Meta-Research: Evaluating the impact of open access policies on research institutions
- Centre for Culture and Technology, School of Media, Creative Arts and Social Inquiry, Curtin University, Australia
- Curtin Institute for Computation, Curtin University, Australia
Figures
Figure 1
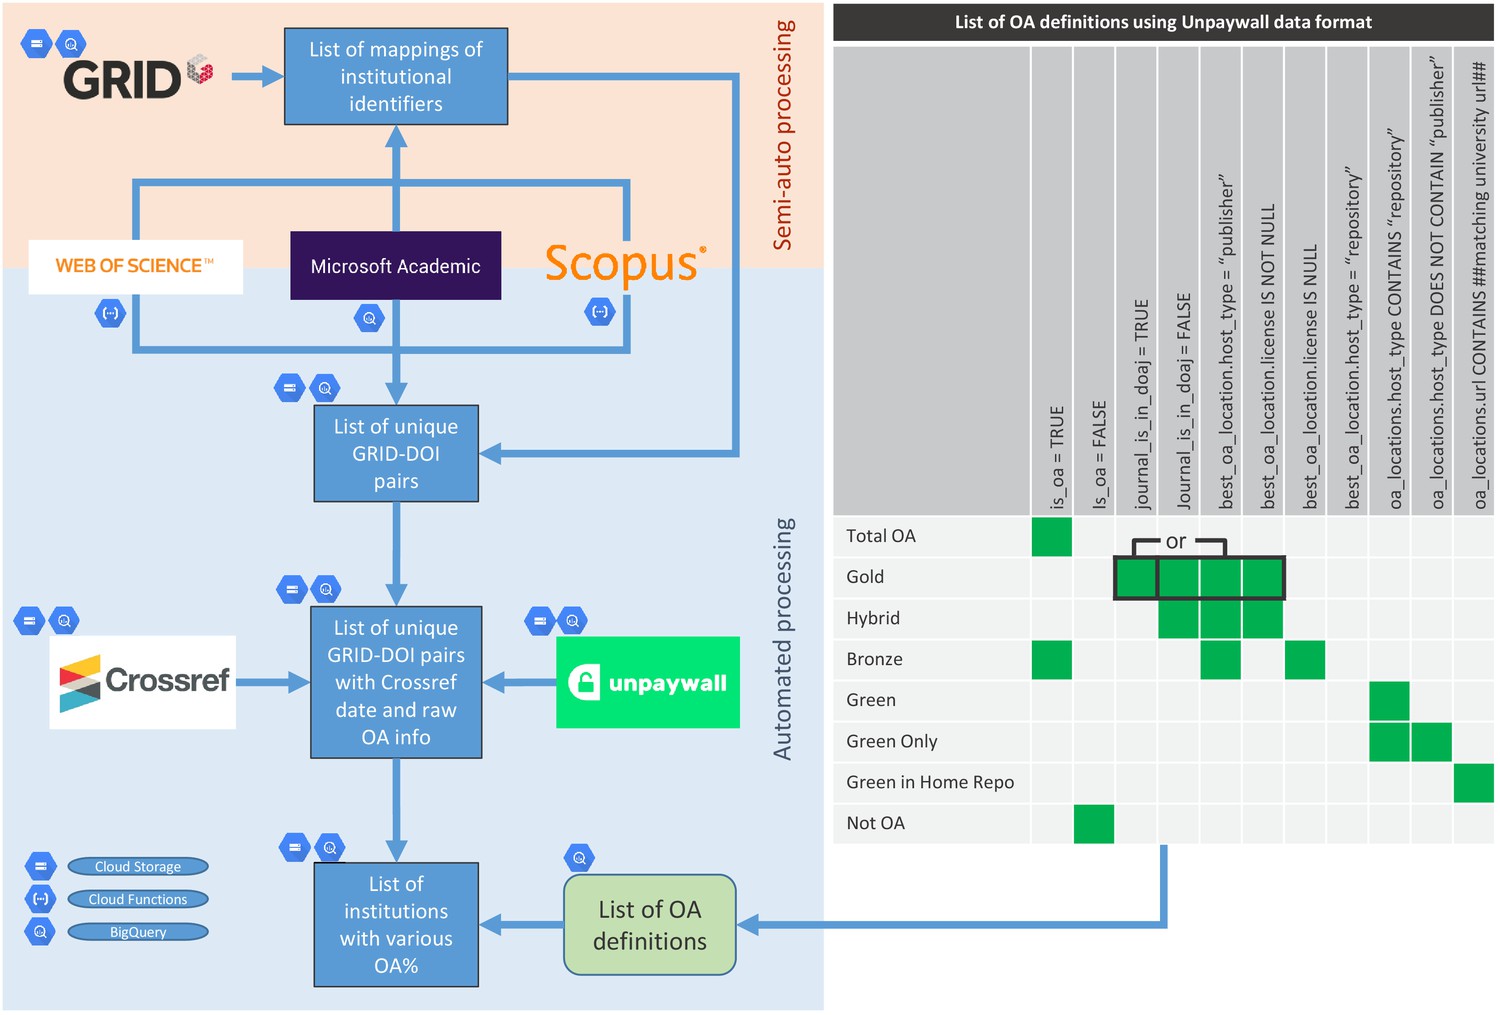
Analysis workflow.
Diagrammatic summary of how data is collected and mapped against open access definitions using information from Unpaywall metadata.
Figure 2 with 3 supplements
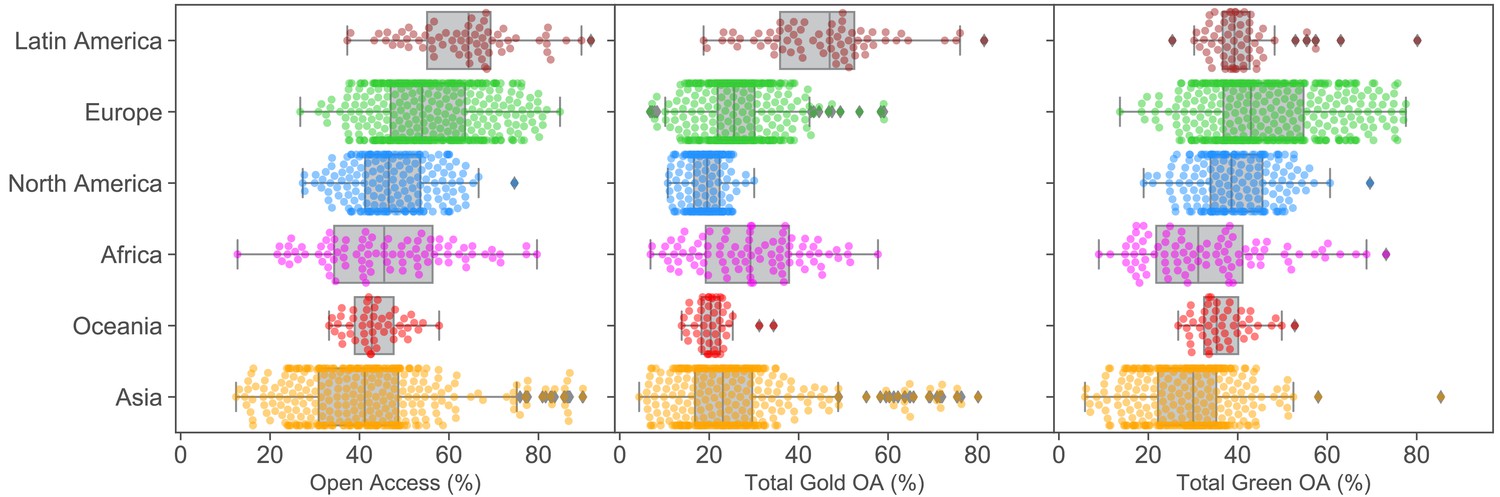
Open access performance of different geographical regions.
Percentages of institutional Total OA, Gold OA and Green OA (left to right) grouped by regions for 2017. Parallel figures for 2016 and 2018 are provided in Figure 2—figure supplement 1.
Figure 2—figure supplement 1
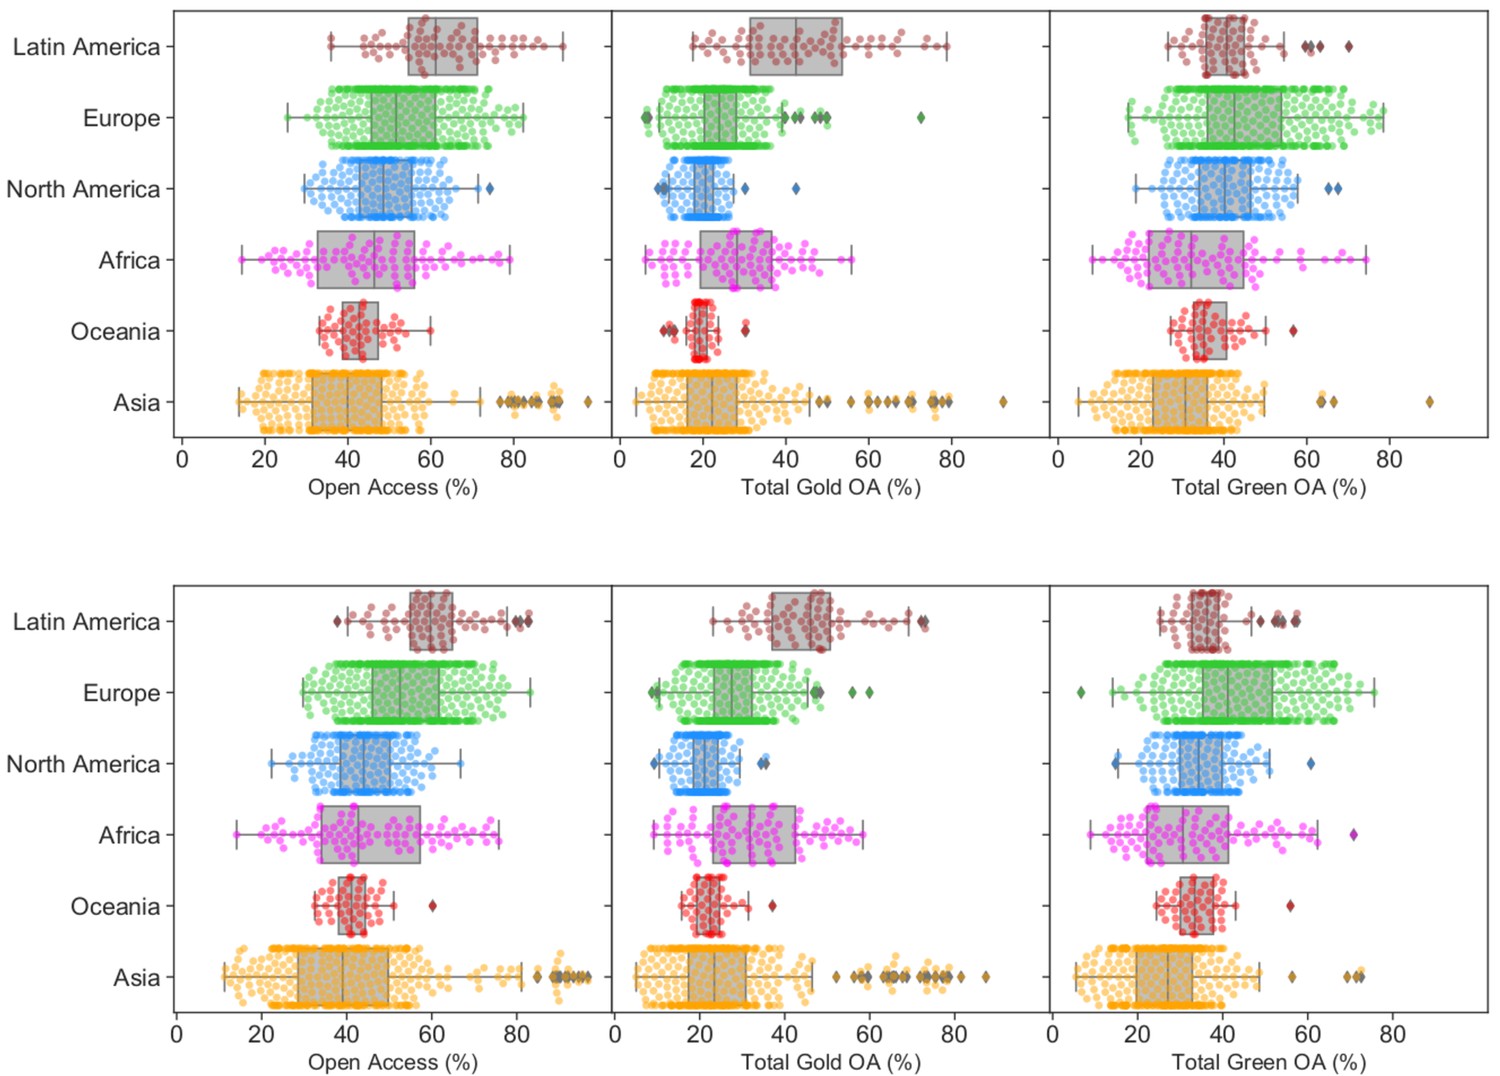
Open access performance of different regions in 2016 and 2018.
Percentages of institutional Total OA, Gold OA and Green OA (left to right) grouped by regions for 2016 and 2018, respectively.
Figure 2—figure supplement 2
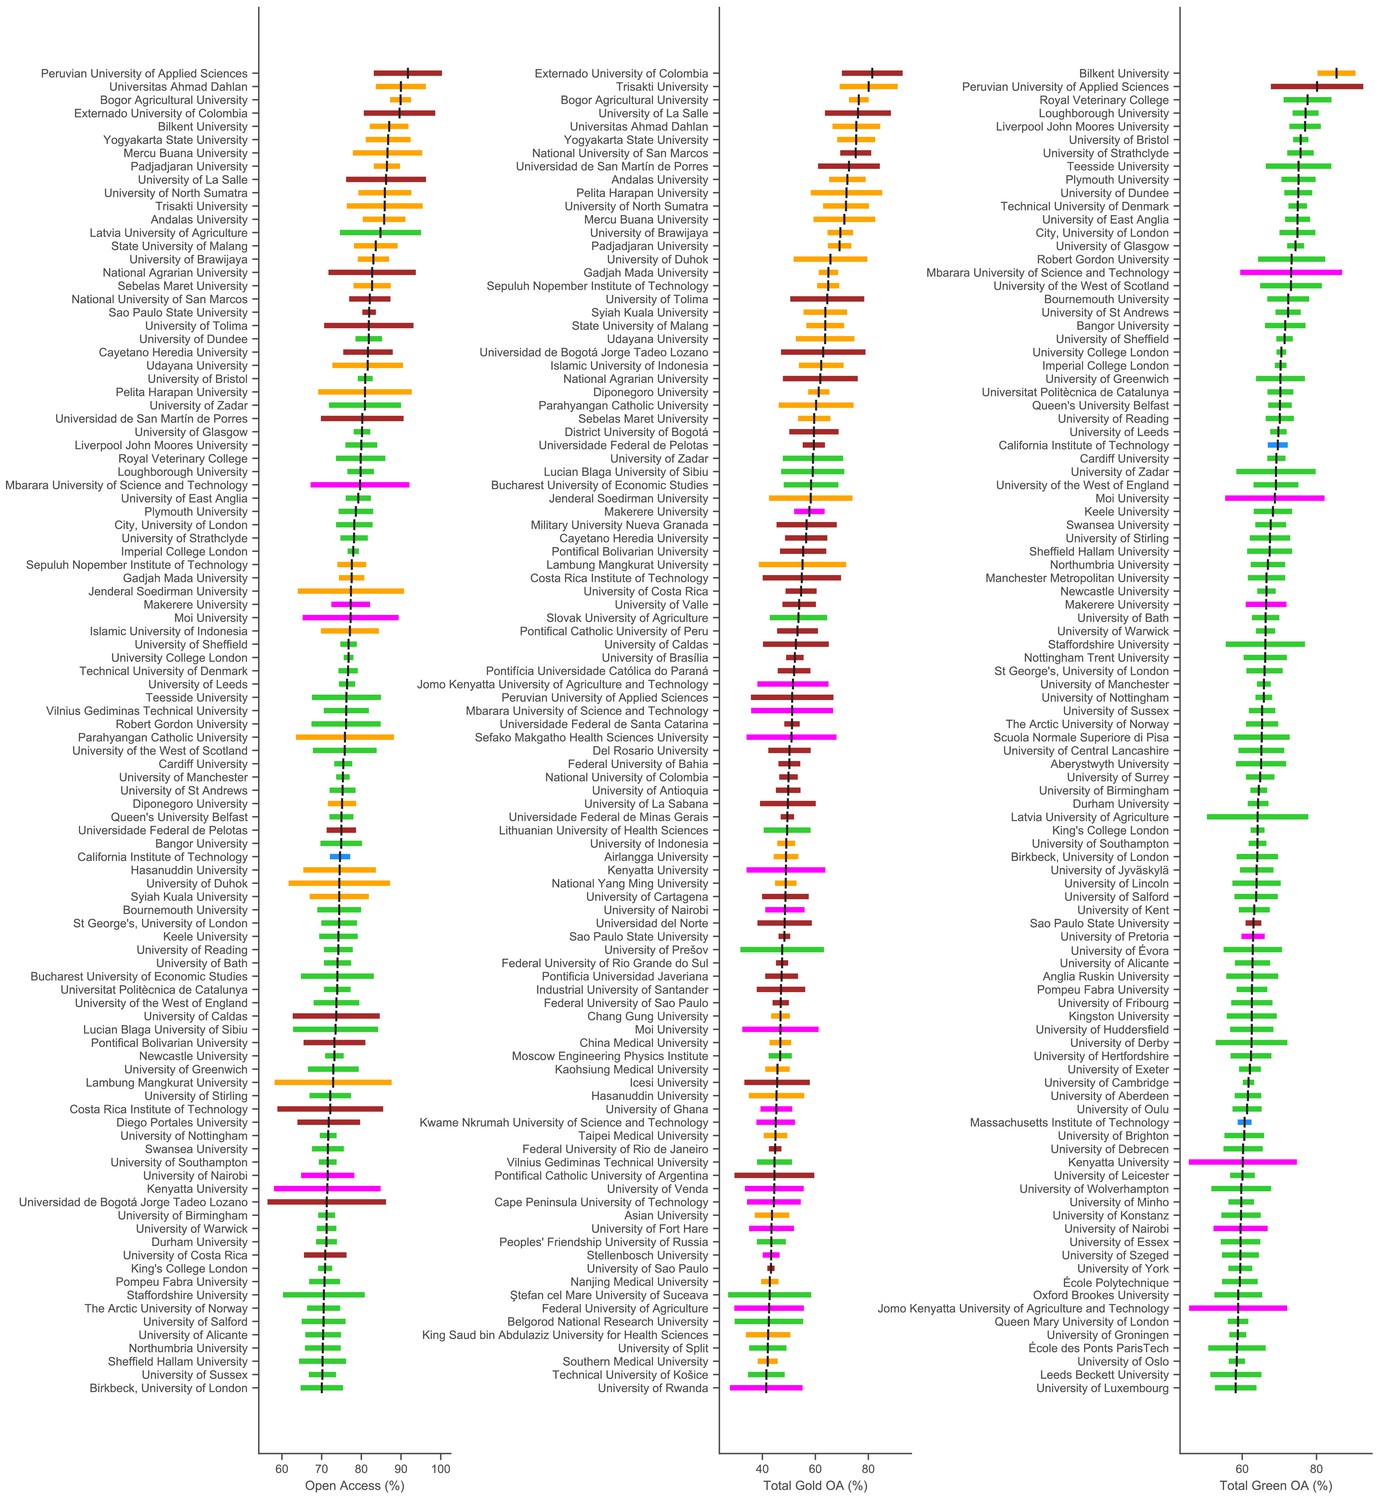
Top 100 universities in terms of performance in total open access, publisher-mediated open access (gold OA) and repository-mediated open access (green OA) for 2017.
The black lines represent the OA% as calculated from the data. The colour bars are 95% confidence intervals calculated with Šidák correction to compensate for the multiple comparisons effect. The colours represent the regions as per Figure 2. Evidently, universities topping this list achieve around 80–90% OA.
Figure 2—figure supplement 3

Percentage of institutional Total OA, Gold OA and Green OA (left to right) grouped by country for 2017.
The colours represent the regions as in Figure 2. The overlaid boxplots exclude outliers as determined using the standard interquartile methods (i.e. values more than 1.5 interquartile range away from the first or third quartile are deemed outliers). Countries are ordered by their median Total OA% (left panel). This figure includes small universities (those with significantly fewer research outputs) which are left out of the main article.
Figure 3 with 1 supplement
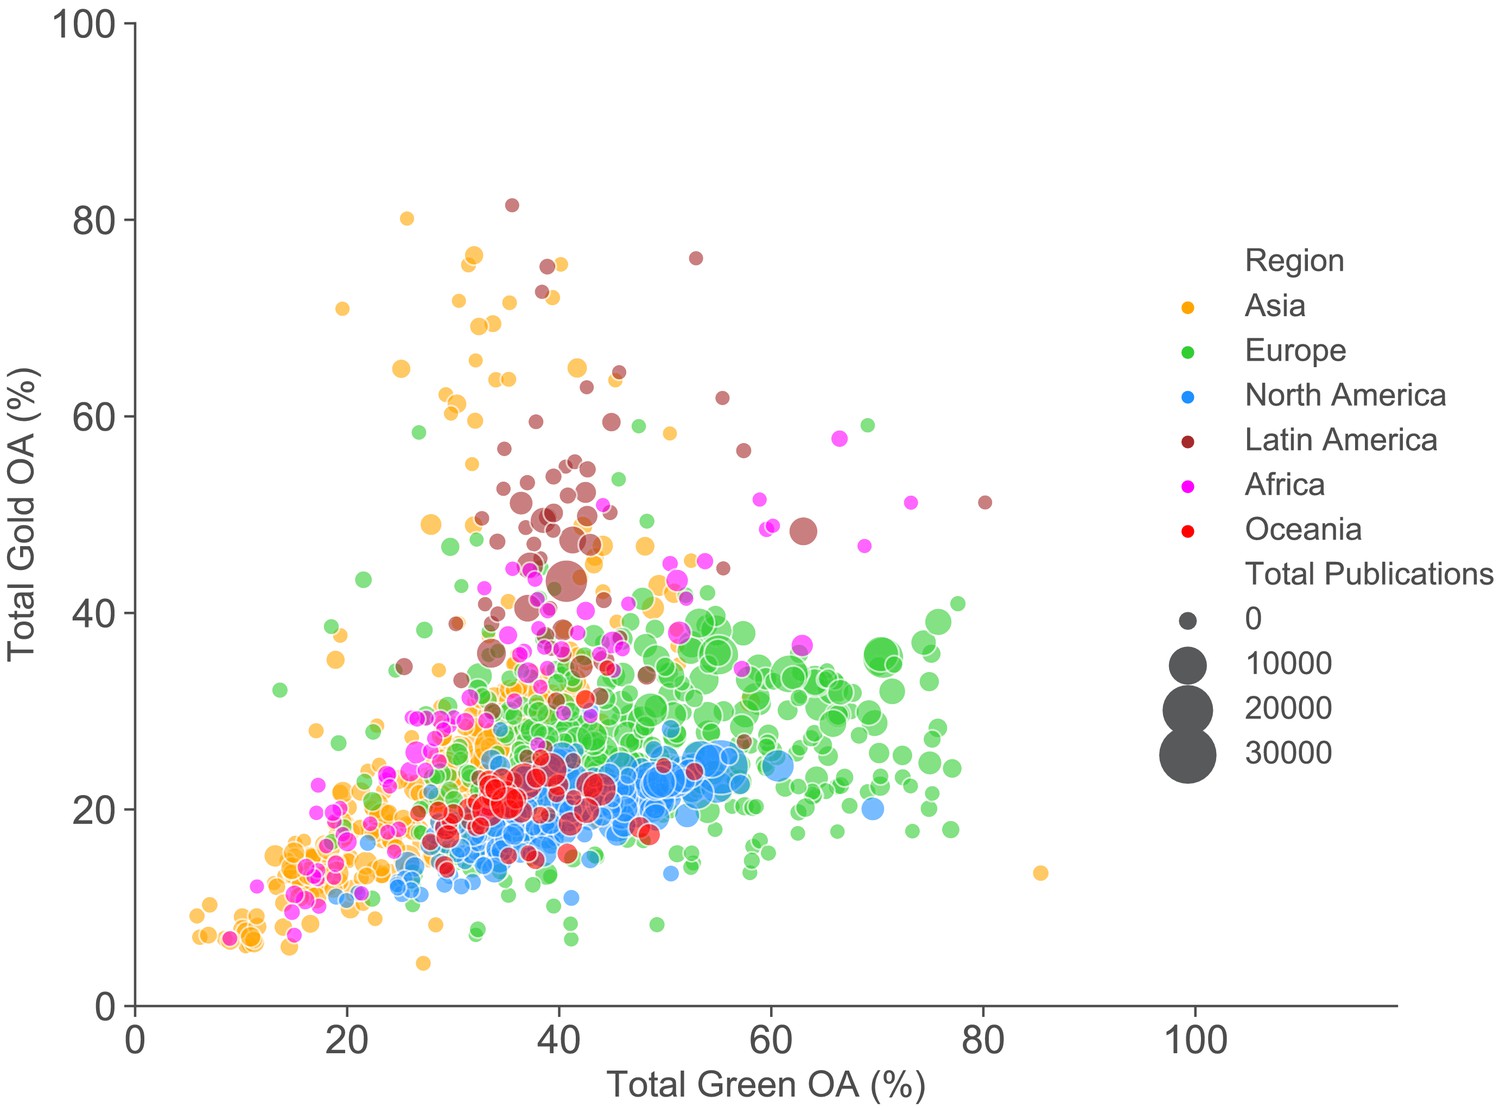
Comparing the level of gold and repository-mediated open access of individual universities.
Publisher-mediated open access (gold OA) vs repository-mediated open access (green OA) by institution for 2017. Each point plotted is a university, with size indicating the number of outputs analysed and colour showing the region. Articles can be open access through both publisher and repository routes so x and y values do not sum to give total open access. Animated version with figures for each year between 2007 to 2018 can be seen in Figure 3—animation 1.
Figure 3—animation 1
Comparing the level of gold and repository-mediated open access of individual universities from 2007 to 2018.
Animated figure showing how the degree of publisher-mediated open access (gold OA) vs repository-mediated open access (green OA) changed from 2007 to 2018. Each point represents a university, with size indicating the number of outputs analysed and colour showing the region.
Figure 4 with 1 supplement
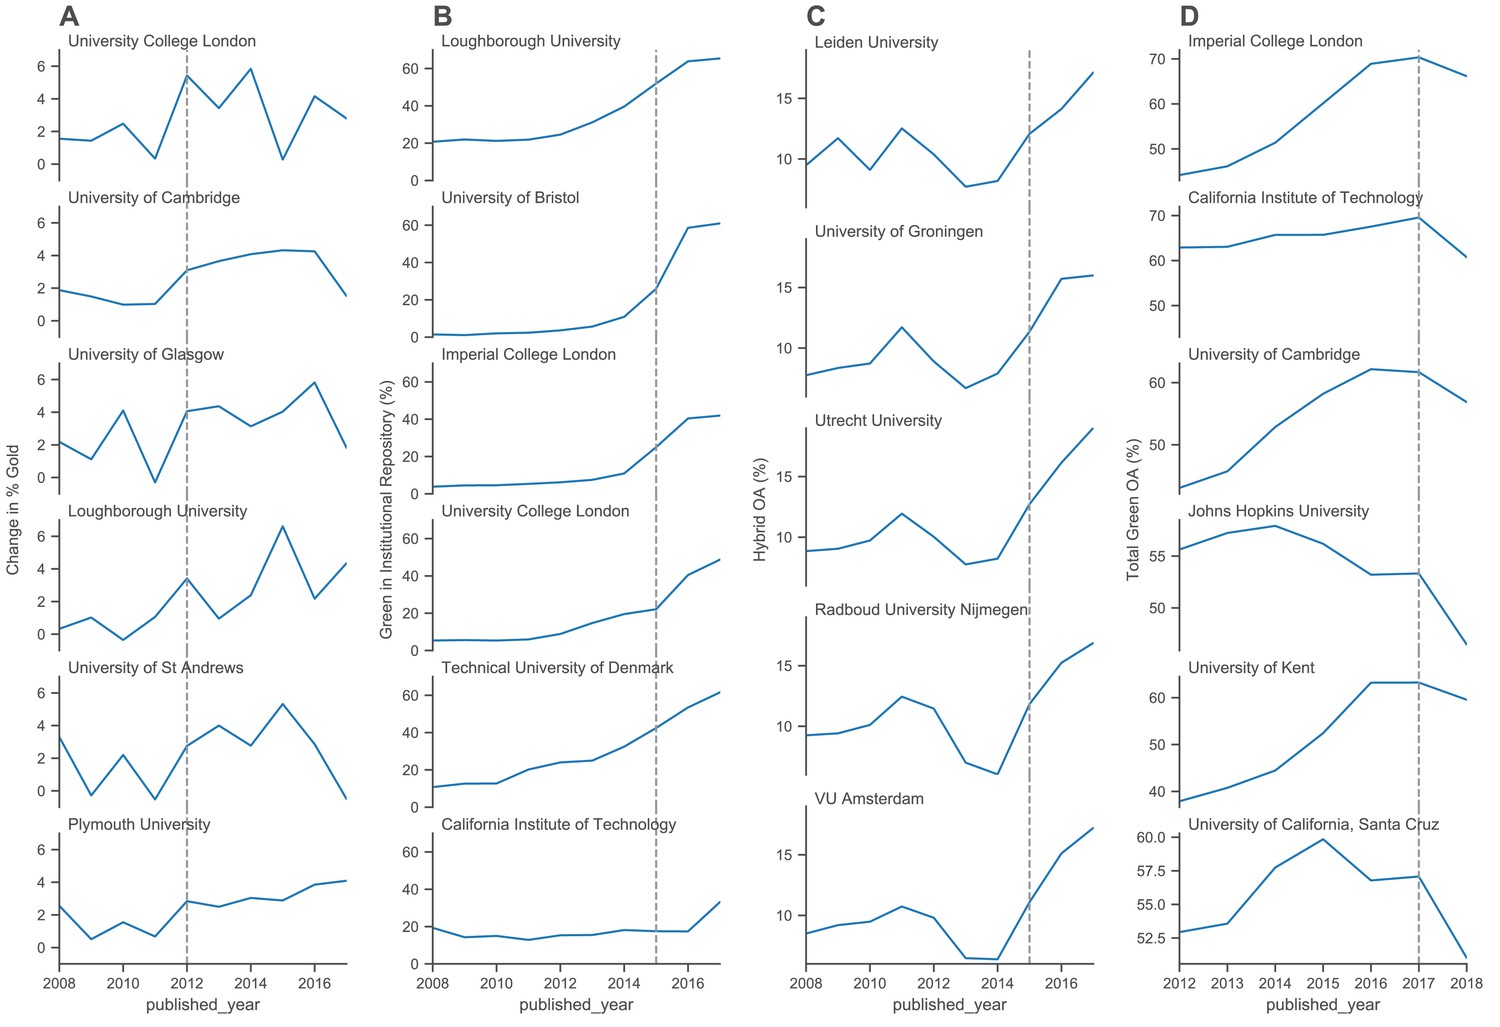
Monitoring the effect of policy interventions for selected groups of universities.
(A) The annual change in percentage (rolling current year percentage minus the previous year percentage) of gold OA for six UK universities. The top three universities are those with the largest additional funding compared to the bottom three universities which received less additional funding. (B) The annual percentage of green OA through the home institutional repositories of four UK universities compared to high performing universities from elsewhere. (C) The annual percentages of hybrid OA at five universities in the Netherlands. (D) Three pairs of UK and US universities, selected based on having a similar size and level of green OA. The annual percentages of total green OA are depicted for each university. Additional figures are provided in Figure 4—figure supplement 1.
Figure 4—figure supplement 1
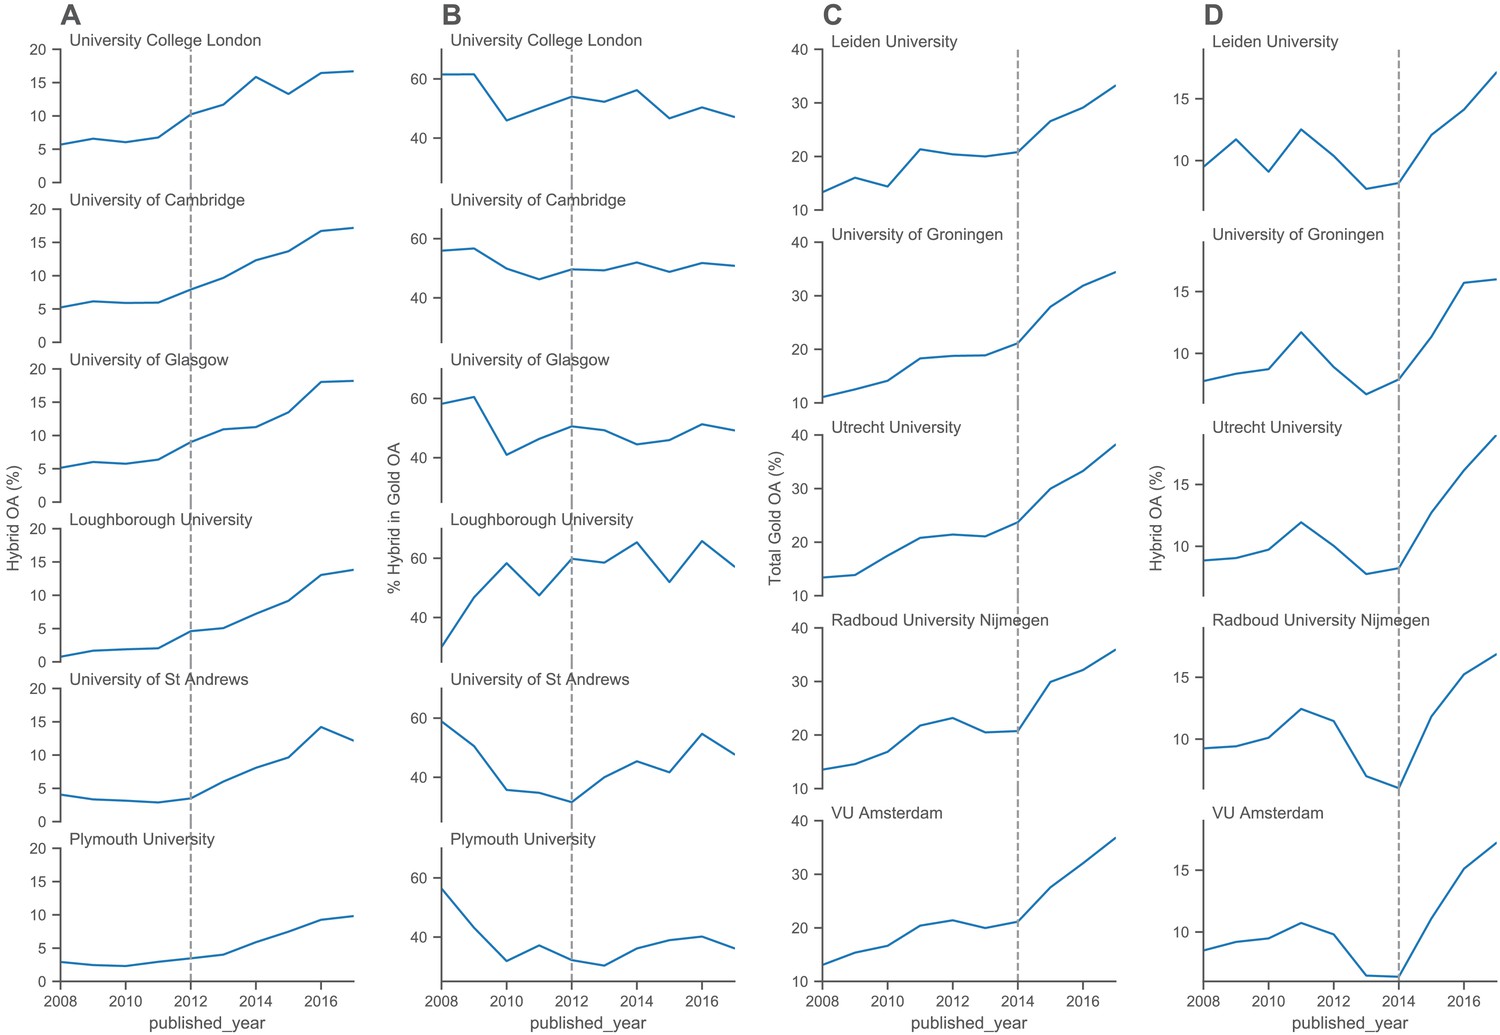
Monitoring changes in the percentage of OA publications for selected groups of universities from the UK and the Netherlands.
(A) The annual percentages of Hybrid OA publications for six UK universities. The top three are those that received the largest additional funding to support open access publishing compared to the bottom three that received less additional funding. (B) For the same set of UK universities, this panel shows the proportion of Hybrid OA publications within Total Gold OA publications. (C) The annual percentages of Total Gold OA for five Dutch universities, showing steady increase in Total Gold OA. (D) The annual percentages of Hybrid OA for the same five Dutch universities, showing a sharp increase in Hybrid OA around 2014 and 2015.
Figure 5 with 1 supplement
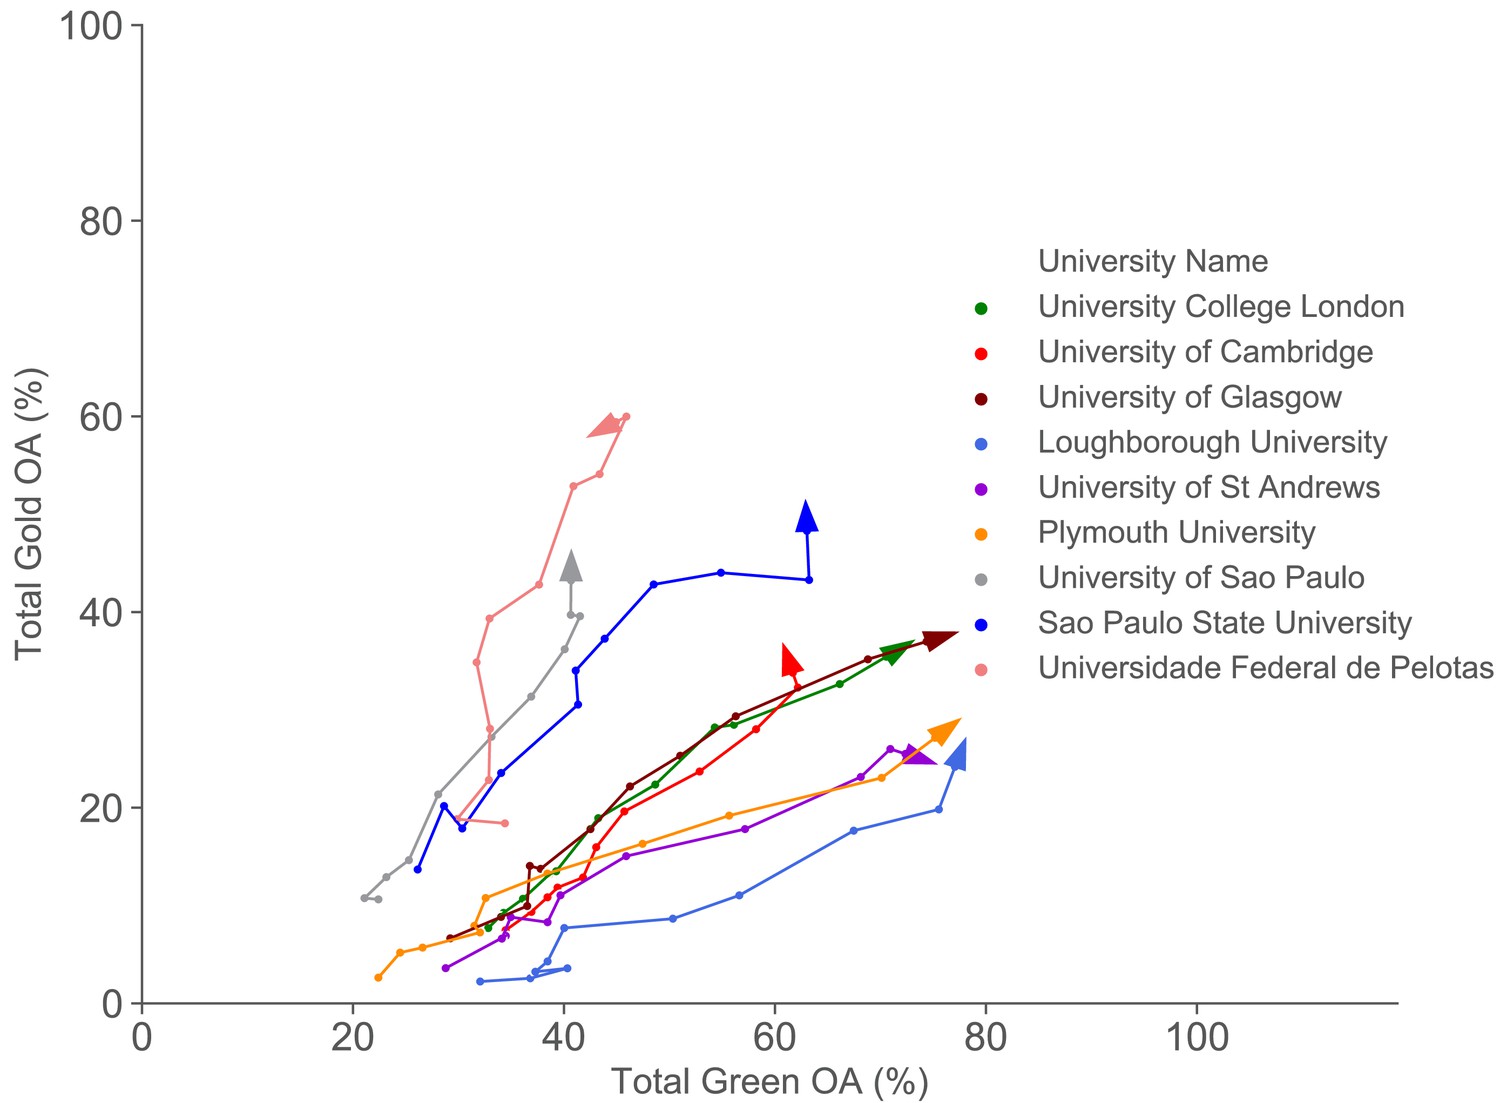
Comparing different paths to open access (gold OA versus green OA) for a selected set of universities from 2007 to 2017.
This figure compares the different open access routes taken by three groups of universities: three UK universities (University College London, University of Cambridge and University of Glasgow) that received substantial funding for open access publishing (combined gold and green OA increases), three UK universities (Loughborough University, University of St Andrews and Plymouth University) that received less funding (more green OA focused), and three Latin American universities (more gold OA focused). The dots represent the % of total gold OA publications and % of total green OA publications for the specified universities for each year from 2007 to 2017, where the arrow indicates the direction of time.
Figure 5—animation 1
An animation comparing different paths to open access (gold OA versus green OA) for a selected set of universities from 2007 to 2017.
This video presents the annual open access levels for each of a selected set of universities. It shows the different open access routes taken by three groups of universities: three UK universities (University College London, University of Cambridge and University of Glasgow) that received substantial funding for open access publishing (combined gold and green OA increases), three UK universities (Loughborough University, University of St Andrews and Plymouth University) that received less funding (more green OA focused), and three Latin American universities (more gold OA focused). The dots represent the % of total gold OA publications and % of total green OA publications for the specified universities for each year from 2007 to 2017, where the arrow indicates the direction of time.
Tables
Table 1
Definitions of open access.
Summary of different types of open access (OA) used in scholarly publishing. These definitions are not always mutually exclusive. For example, an article can be both Gold OA and Green OA. However, articles that are Green Only do not have any common element with articles classified as Gold OA by definition. This study focuses on the following categories: Total OA, Gold, Hybrid, Green and Green in Home Repo. Further discussions on open access definitions can be found in Supplementary file 1.
| OA type | Description |
|---|---|
| Total OA | A research output that is free to read online, either via the publisher website or in an OA repository. |
| Gold | A research output that is either published in a journal listed by the Directory of Open Access Journals (DOAJ), or (if journal not in DOAJ) is free to read via publisher with any license. |
| Hybrid | A research output that is published in a journal not listed by DOAJ, but is free to read from publisher with any license. |
| Bronze | A research output that is free to read online via publisher without a license. |
| Green | A research output that is free to read online via an OA repository. |
| Green Only | A research output that is free to read online via an OA repository, but is not available for free via the publisher. |
| Green in Home Repo | A research output that is free to read online via the matched affiliation’s institutional repository. |
Additional files
-
Supplementary file 1
Further detail on the methodology and data sources used to evaluate the open access performance of individual institutions.
- https://cdn.elifesciences.org/articles/57067/elife-57067-supp1-v2.docx
-
Transparent reporting form
- https://cdn.elifesciences.org/articles/57067/elife-57067-transrepform-v2.docx
Download links
A two-part list of links to download the article, or parts of the article, in various formats.
Downloads (link to download the article as PDF and Executable version)
Open citations (links to open the citations from this article in various online reference manager services)
Cite this article (links to download the citations from this article in formats compatible with various reference manager tools)
Meta-Research: Evaluating the impact of open access policies on research institutions
eLife 9:e57067.
https://doi.org/10.7554/eLife.57067


