Inversion of pheromone preference optimizes foraging in C. elegans
- Physics of Living Systems Group, Department of Physics, Massachusetts Institute of Technology, United States
- Centre de Recherches sur la Cognition Animale (CRCA), Centre de Biologie Intégrative (CBI), Université de Toulouse; CNRS; UPS, France
- Boyce Thompson Institute and Department of Chemistry and Chemical Biology, Cornell University, United States
Figures
Figure 1 with 1 supplement
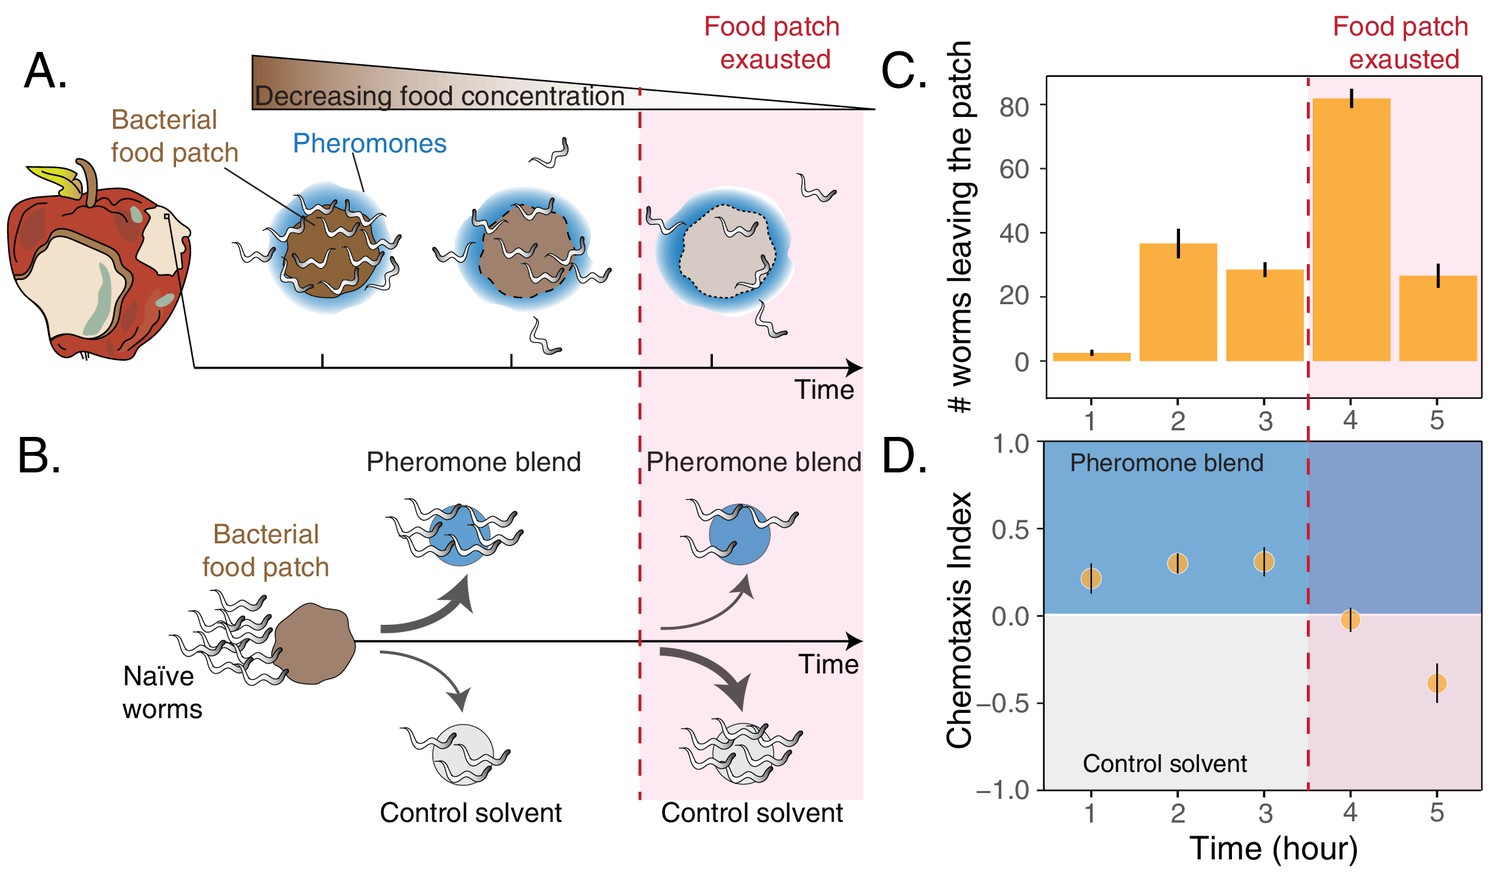
Worms leaving at different times from a food patch exhibit opposite preferences for pheromones.
(A) During the feeding process, worms remaining in the food patch experience different environmental conditions. At the beginning, food is still abundant and pheromones have already accumulated. By the end, food is scarce and pheromone concentration is even higher. (B) In the behavioral assay, as animals feed and leave from a food patch, they are presented with the choice between a spot containing the pheromone blend and a spot containing a control solvent. In the two spots, sodium azide is added in order to anesthetize the animals and prevent them from leaving the chosen spot. (C) Individual worms leave the food patch at different times. The average number of worms that abandoned the food patch at each hour is shown (mean worm count ± SEM across replicates, n. experiments = 2). (D) Animals leaving the food patch earlier prefer the pheromone blend while those leaving later, when the food is almost depleted, avoid the pheromone blend. In the plot, chemotaxis index is calculated on the number of naive MY1 young adult hermaphrodites that, at each hour, reach the two spots (mean CI ± SEM across replicates, n. experiments = 2). The red region in each plot approximately indicates when food in the patch is exhausted.
-
Figure 1—source data 1
Choice after food assay data.
- https://cdn.elifesciences.org/articles/58144/elife-58144-fig1-data1-v1.txt
Figure 1—figure supplement 1
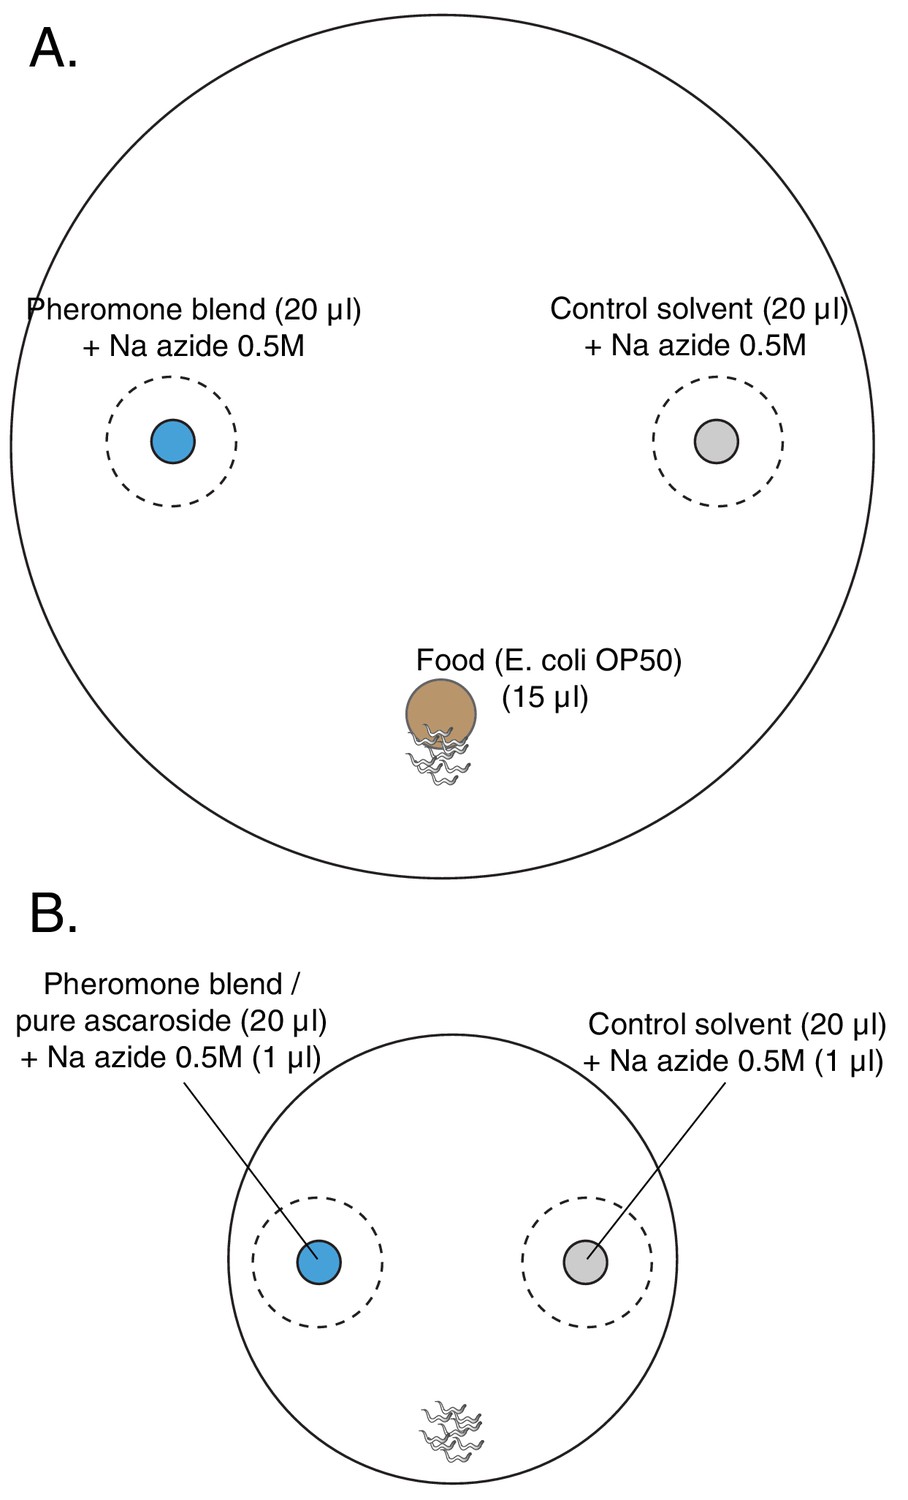
Layout of plates for chemotaxis assays.
(A) Choice after food assay: 100 mm petri dish filled with 25 ml of NGM. In blue, the spot with 20 μl of the pheromone blend, in gray the spot with 20 μl of the control solvent and in brown the food patch, 15 μl of a diluted E. coli OP50 culture. In the pheromone and control spots, 2 μl of 0.5 M sodium azide was added in order to anesthetize the animals once they reached the spots. Since the anesthetic action of sodium azide lasts for about 2 hr in this set-up, another 1 μl was added two hours after the beginning of the assay in both spots. (B) Chemotaxis assay: 60 mm petri dish filled with 10 ml of NGM. In blue, the spot with 20 μl of either pheromone blend or pure synthetic ascarosides; in gray the spot with 20 μl of control solvent. In both spots, 1 μl of Na azide 0.5M is added to paralyze the worms once they reached the cue. Worms are placed equidistant from the two spots.
Figure 2 with 2 supplements

A simple model predicts that worms can optimize foraging by a change in pheromone preference over time.
(A) Schematic of model predictions (only three identical food patches are depicted). Initially, two patches are unequally populated by C. elegans individuals (overcrowded and undercrowded food patch) while a third one is unoccupied. The release of pheromones by worms makes the occupied patches easier to find compared to the unoccupied one. During the first phase, worms equalize occupancy in the occupied patches. Then, all worms stay in their patches until food becomes scarce. In this last phase, worms benefit from dispersing to the unoccupied patch avoiding pheromone cues. This would be favored by a change in pheromone preference. (B) Expected payoff for each strategy (Remain, , in black; Switch , in color as a function of the fraction of individuals that switch (). In the absence of cost, switching is always advantageous (blue line), so the equilibrium switching probability is (blue dot). A switching cost shifts the equilibrium probability to an intermediate value (orange dot). Lines computed with Equations 3a and 3b with parameters , , . (C) Probability to switch in equilibrium (), as a function of switching cost c and the initial fraction of worms in patch 1().
Figure 2—figure supplement 1

Benefit that individuals obtain from switching at time , with respect to individuals that remain , versus the probability of switching.
Blue: Cost . Orange: Cost . For both curves, , , and .
Figure 2—figure supplement 2
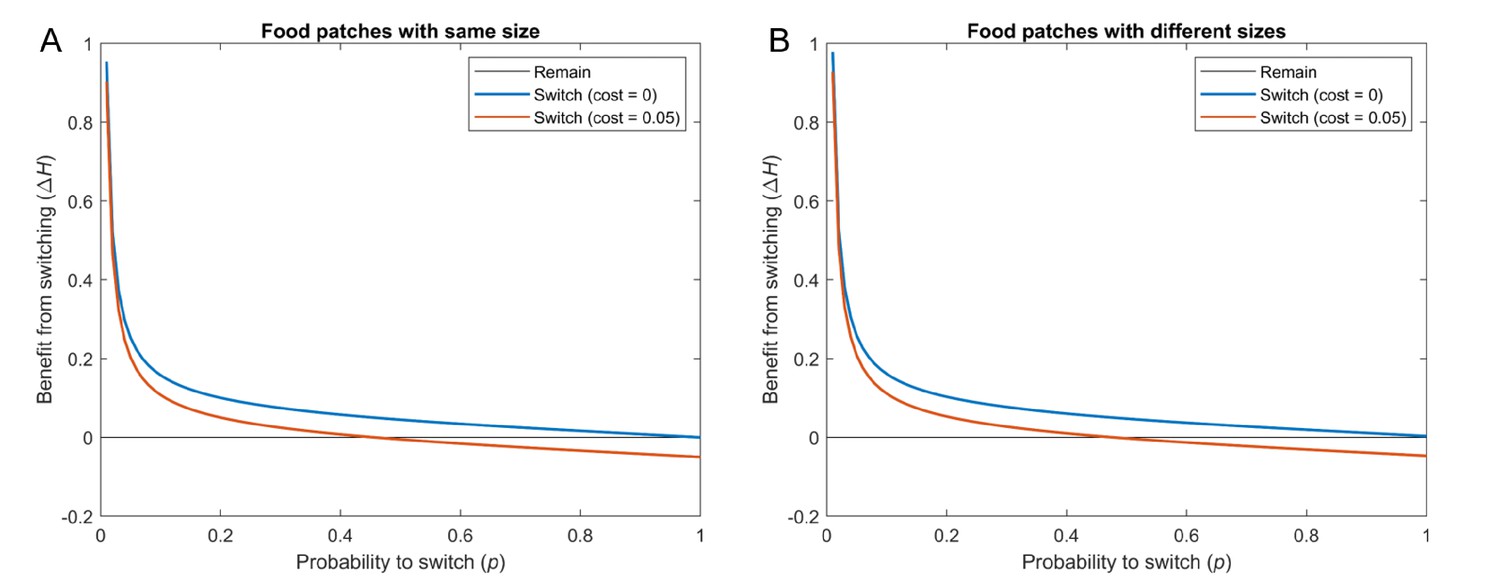
Benefit that individuals obtain from switching at time , with respect to individuals that remain, versus the probability of switching when patches have equal or different sizes.
Blue: Cost . Orange: Cost . For all cases, , , and . Results are averaged across 100 simulations, with each of the 15 individuals starting at a random food patch in every simulation. (A) All food patches have size 1 (curves computed using Equation S12). (B) Food patches have different sizes. For each simulation, the 5 sizes are drawn from a uniform distribution between 0 and 2 (curves computed using Equation S16).
Figure 3 with 1 supplement

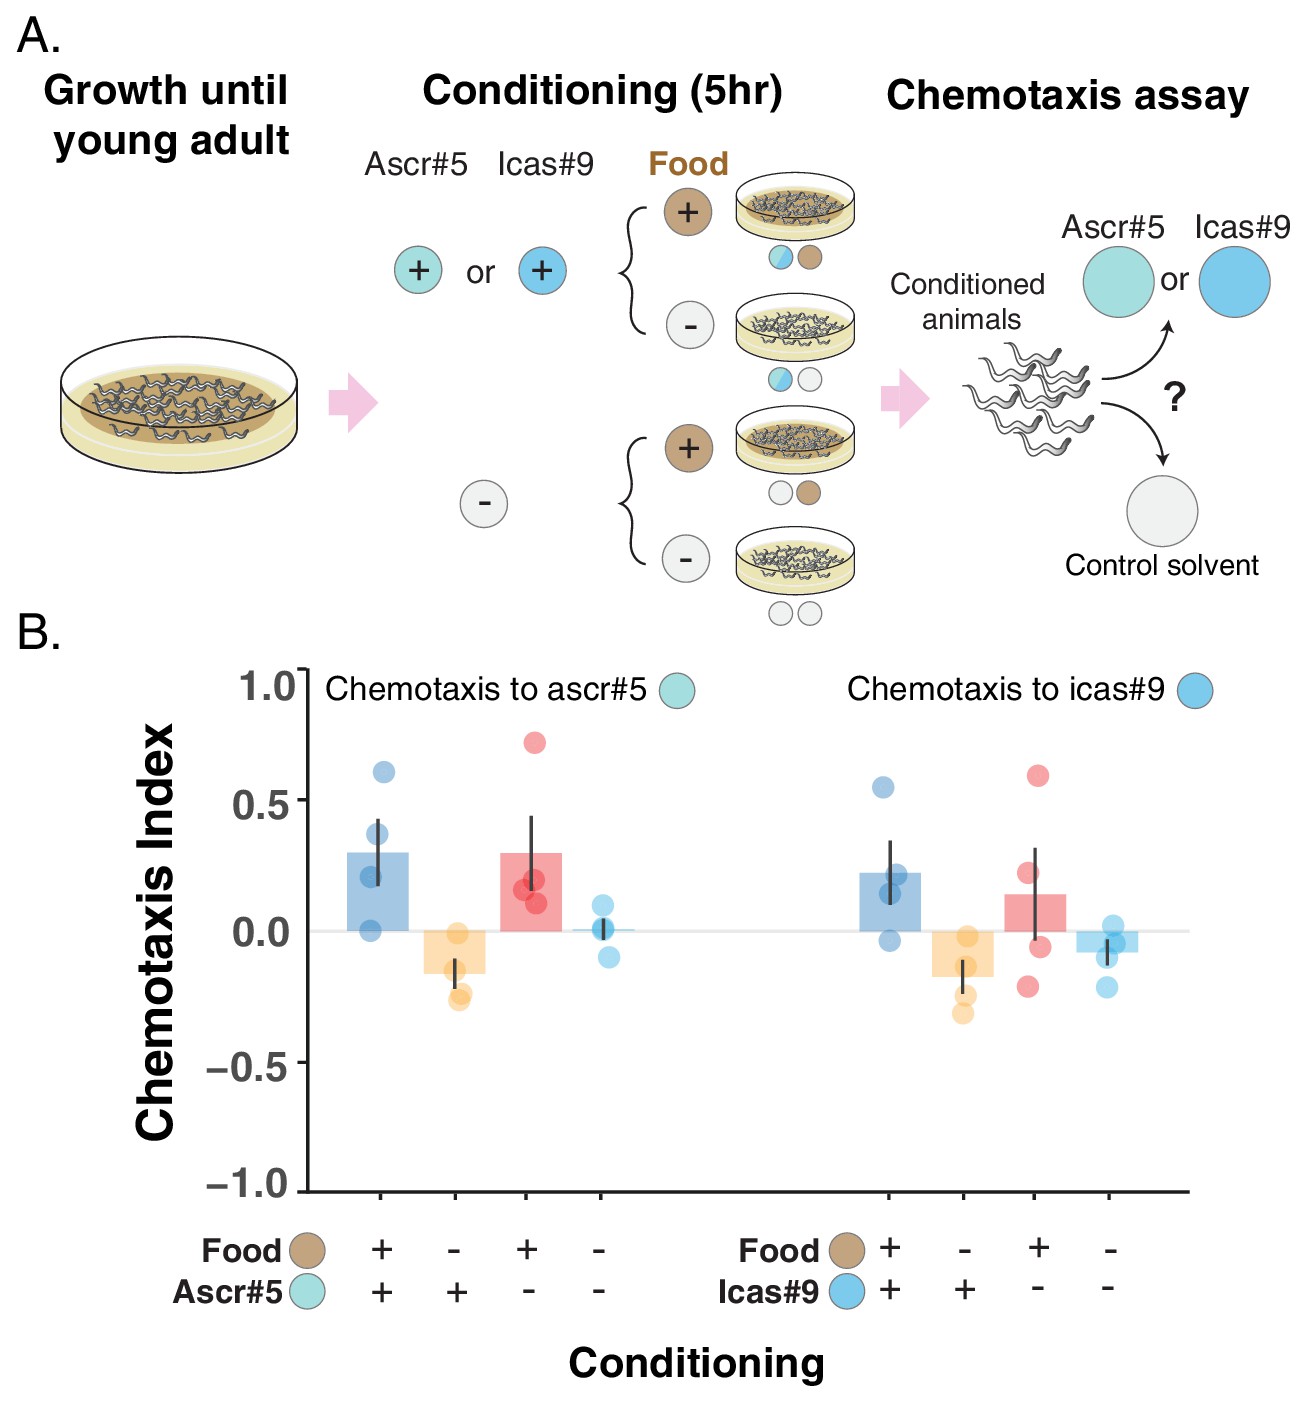
Changes in pheromone preference depend upon associative learning.
(A) MY1 individuals grow at high density and with plenty of food until young adult. Animals are then transferred to conditioning plates, where they spend 5 hr. Conditioning scenarios are four: + food + pheromone blend; – food + pheromone blend; + food – pheromone blend; – food – pheromone blend. To prevent uncontrolled pheromone accumulation, the conditioning scenarios without added pheromone blend had to be repeated at low worm density. Worms are then assayed for chemotaxis to the pheromone blend. (B) MY1 individuals are not generally attracted the pheromone blend unless it is paired with abundant food. Chemotaxis index is shown for the four different conditioning scenarios: + food + pheromone blend (blue bar); – food + pheromone blend (yellow bar); + food – pheromone blend (red bar); – food – pheromone blend (turquoise bar). As a comparison, chemotaxis index is shown for the + food – pheromone blend scenario and the – food – pheromone blend scenarios with conditioning done at normal animal density (Panel B, inset). Points indicate the outcome of each independent replicated experiments (n = 4 and n = 3 for experiments with worms at low population density) while bars indicate the CI ± SEM across independent experiments.
-
Figure 3—source data 1
Conditioning with pheromones data.
- https://cdn.elifesciences.org/articles/58144/elife-58144-fig3-data1-v1.txt
Figure 3—figure supplement 1
Attraction toward two ascarosides, ascr#5 and icas#9, can be turned into repulsion.
(A) Schematic of the conditioning experiment. Worms grow at high density and with plenty of food until they are young adults. Animals are then transferred to conditioning plates, where they spend 5 hr, before being assayed for chemotaxis to the pure ascaroside. (B) Chemotaxis index (CI) is shown for the four different conditioning scenarios: + food + ascaroside (blue bars); – food + ascaroside (yellow bars); + food – ascaroside (red bars); – food – ascaroside (turquoise bars). Points indicate the outcome of each independent replicated experiment (n = 4 for each ascaroside) while bars indicate the CI ± SEM across independent experiments. If attraction is turned into repulsion by the feeding status only, we expect the blue and red bars not to differ and the CI to be positive, while the yellow and turquoise bars not to differ and the CI to be either negative or equal to zero. In the experiment with ascr#5 (on the left), the CI is positive in the + food + ascaroside and the + food– ascaroside scenarios, but it differs in the two conditions without food, being negative in the – food + ascaroside scenario and not differing from zero in the – food – ascaroside scenario. These results are consistent with a combination of associative learning and feeding status driving the change in preference for ascr#5. In the experiment with icas#9 (on the right), the CI in the two conditions with food does not differ, mostly because of the large variability among the repetitions of the + food – ascaroside scenario (red points). The CI in the two conditions without food is instead negative. The most parsimonious explanation for the change in preference for icas#9 is the different feeding status rather than associative learning, although the accumulation of secreted pheromones during the conditioning period (due to the high worm density in the conditioning plates) may once again obscure the evidence of associative learning (as in the inset of Figure 3).
-
Figure 3—figure supplement 1—source data 1
Conditioning with ascarosides data.
- https://cdn.elifesciences.org/articles/58144/elife-58144-fig3-figsupp1-data1-v1.txt
Figure 4
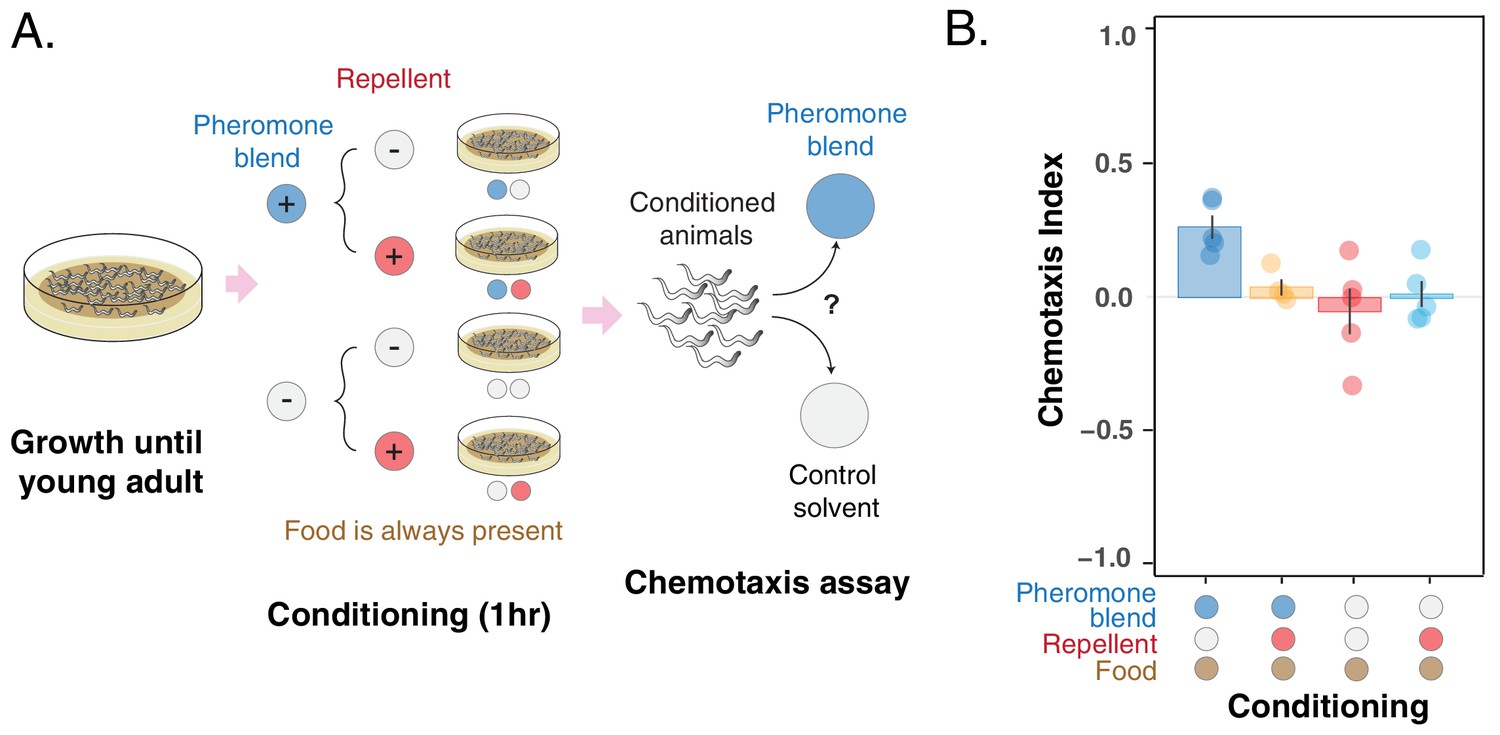
Pheromone preference changes due to association with the presence or absence of a repellent compound (glycerol).
(A) MY1 individuals grow at high density and with plenty of food until young adult. Animals are then transferred to conditioning plates, where they spend 1 hr. Conditioning scenarios are four: + pheromone blend – repellent; + pheromone blend + repellent; – pheromone blend – repellent; – pheromone blend + repellent. Bacterial food is always abundant to prevent confounding effects due to the feeding status of animals. The short conditioning time prevents uncontrolled pheromone accumulation. Worms are then assayed for chemotaxis to the pheromone blend. (B) MY1 individuals are not attracted to the pheromone blend unless it is present and paired with food. Association with the repellent disrupts worm preference for pheromones gained in the presence of abundant food. Chemotaxis index is shown for the four different conditioning scenarios: + pheromone blend – repellent (blue bar); +pheromone blend + repellent (yellow bar); – pheromone blend – repellent (red bar); – pheromone blend + repellent (turquoise bar). Points indicate the outcome of each independent replicated experiments (n = 5) while bars indicate the CI ± SEM across independent experiments.
-
Figure 4—source data 1
Conditioning with pheromones & repellent data.
- https://cdn.elifesciences.org/articles/58144/elife-58144-fig4-data1-v1.txt
Additional files
Download links
A two-part list of links to download the article, or parts of the article, in various formats.
Downloads (link to download the article as PDF)
Open citations (links to open the citations from this article in various online reference manager services)
Cite this article (links to download the citations from this article in formats compatible with various reference manager tools)
Inversion of pheromone preference optimizes foraging in C. elegans
eLife 10:e58144.
https://doi.org/10.7554/eLife.58144


