The Drosophila Individual Activity Monitoring and Detection System (DIAMonDS)
- RIKEN Cluster for Pioneering Research, RIKEN Tsukuba Institute, Japan
- AMED-CREST, AMED, Japan
- Graduate School of Science and Engineering, Yamagata University, Jonan, Japan
- Life Science Center for Survival Dynamics, University of Tsukuba, Japan
Figures
Figure 1 with 3 supplements
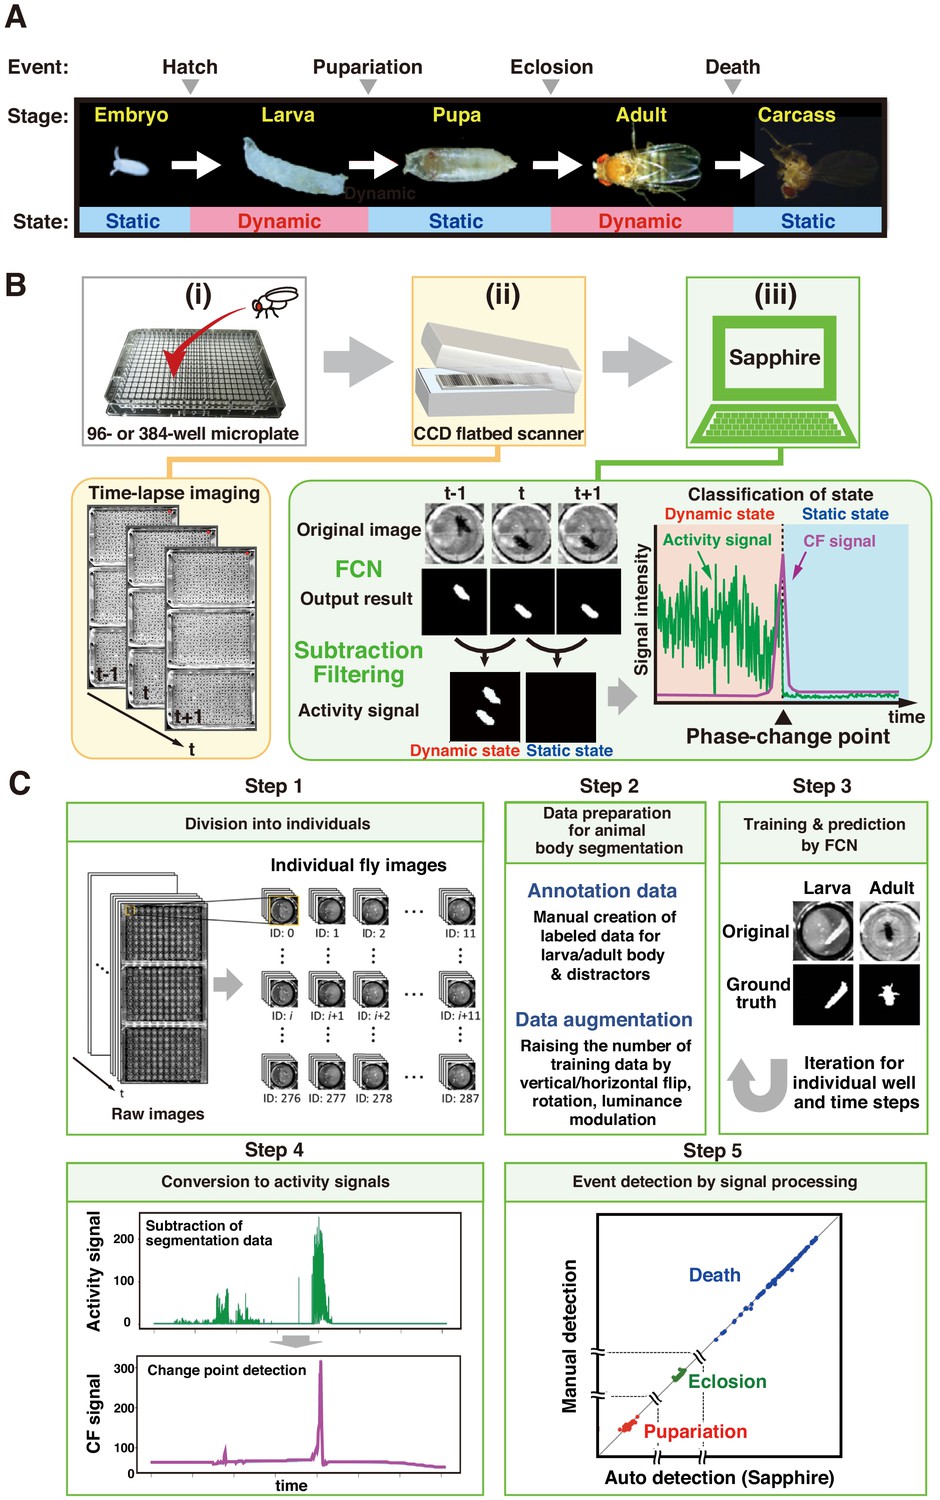
Overview of DIAMonDS.
(A) Diagram of developmental stages and activity states in Drosophila melanogaster. (B) Schematic representation of the DIAMonDS procedure. DIAMonDS consists of: (i) microplate preparation; (ii) time-lapse imaging with CCD scanner; and (iii) data analysis by Sapphire. In step (iii), Sapphire calculates activity signal (green line) intensity via animal body detection from FCN images and subtraction processing of every two consecutive images and then determines the CF signal (purple line) from the activity signal. (C) Flowchart of Sapphire. Algorithm includes extraction of individual animals from population images (Step 1), training data preparation and augmentation (Step 2), training through data and animal body segmentation (Step 3), segmentation data signaling by subtracting labeled data and transition point detection algorithm (Step 4), event detection, signal processing, and visualization (Step 5).
Figure 1—figure supplement 1
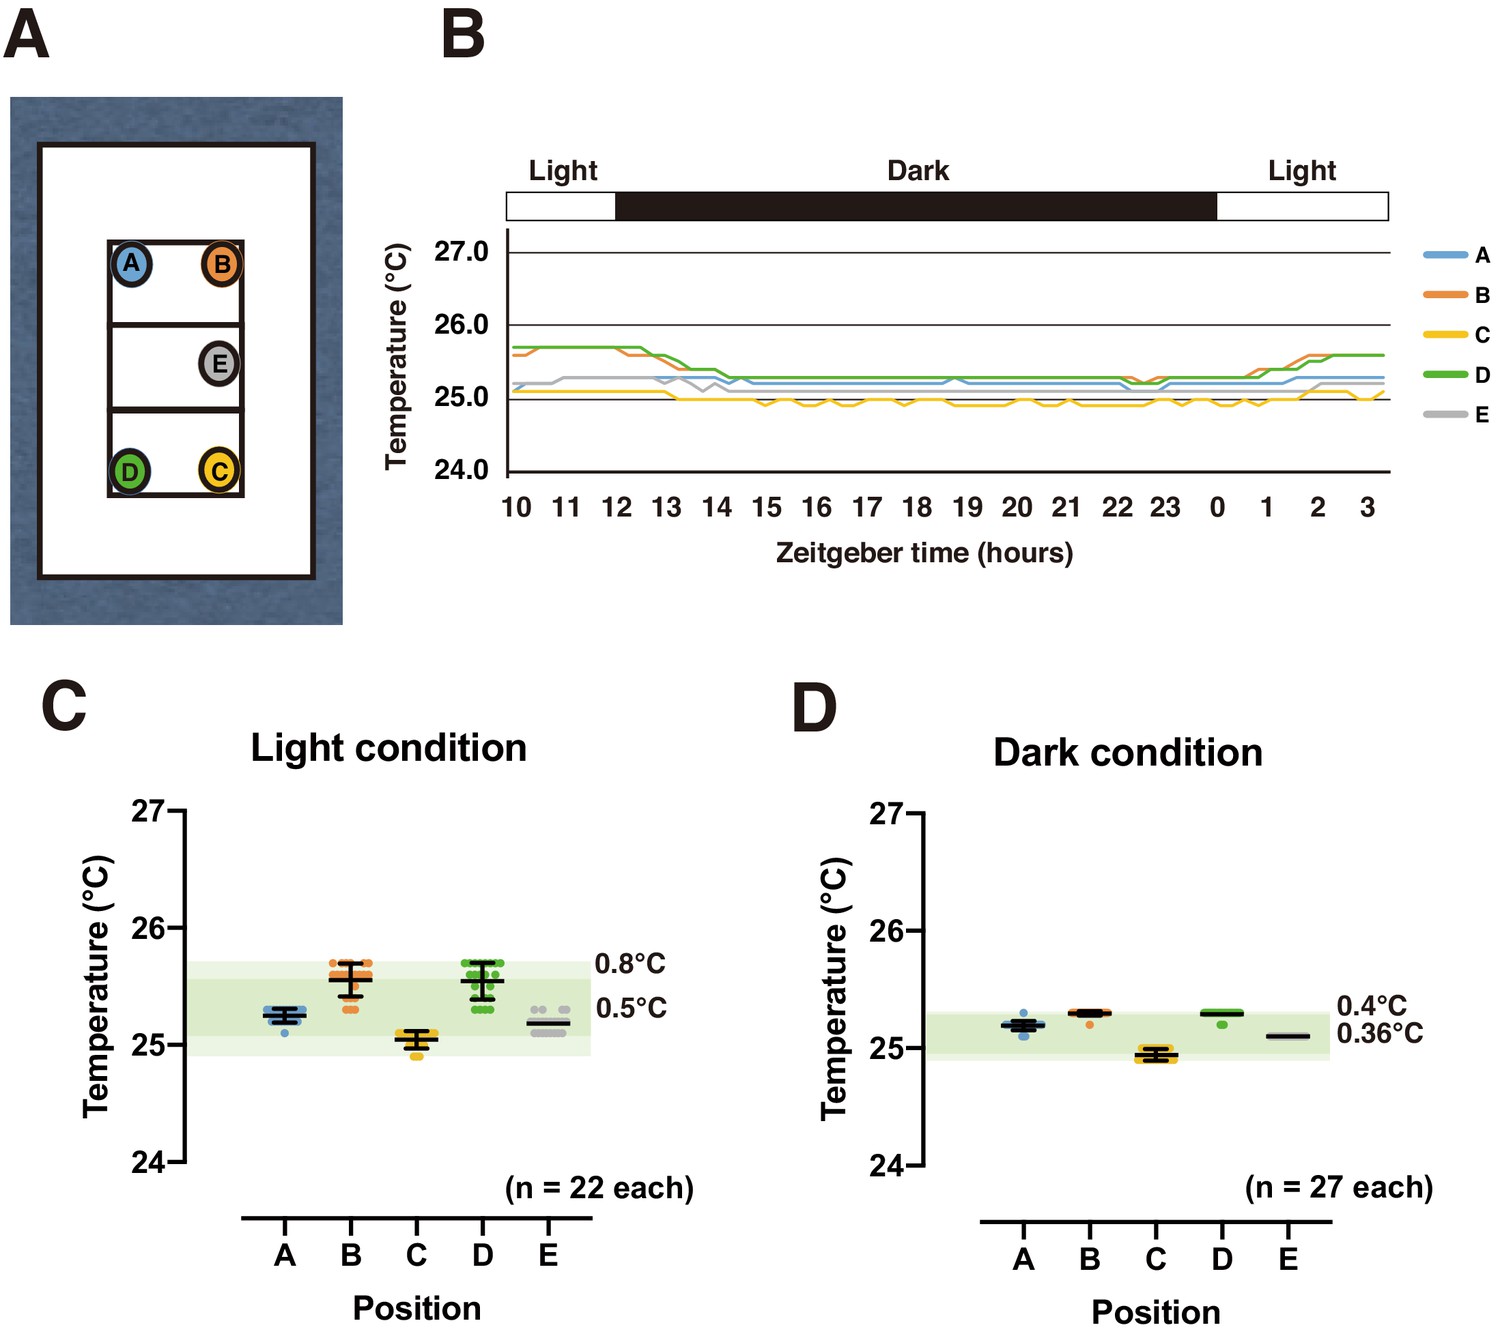
Scanning surface temperature distribution.
(A) Temperature measurement points on scan surface. Temperature measured by temperature data logger (Thermochron SL type, NK Labs, Cambridge, MA, USA) in high-resolution mode. (B) Daily temperature time course under 12:12 light-dark cycle. (C,D) Temperature at each time point under light (C) and dark (D) conditions. Dark and light green bands represent mean and maximum/minimum temperature ranges, respectively.
-
Figure 1—figure supplement 1—source data 1
Scanning surface temperature.
- https://cdn.elifesciences.org/articles/58630/elife-58630-fig1-figsupp1-data1-v2.xlsx
Figure 1—figure supplement 2
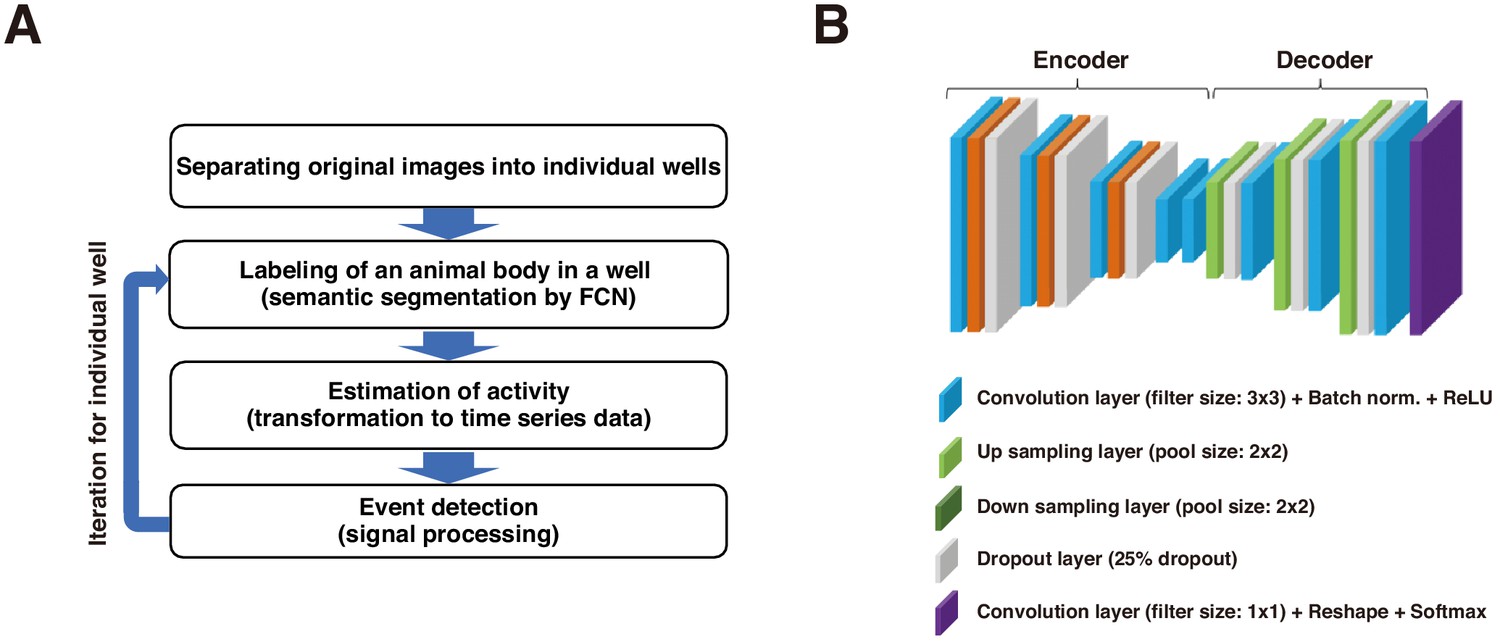
Schematic representation of process of Sapphire and architecture of FCN.
(A) Automatic life event detection algorithm. Detailed procedure described in Figure 1C. (B) Schematic architecture of fully convolutional network (FCN) designed for animal body segmentation.
Figure 1—figure supplement 3
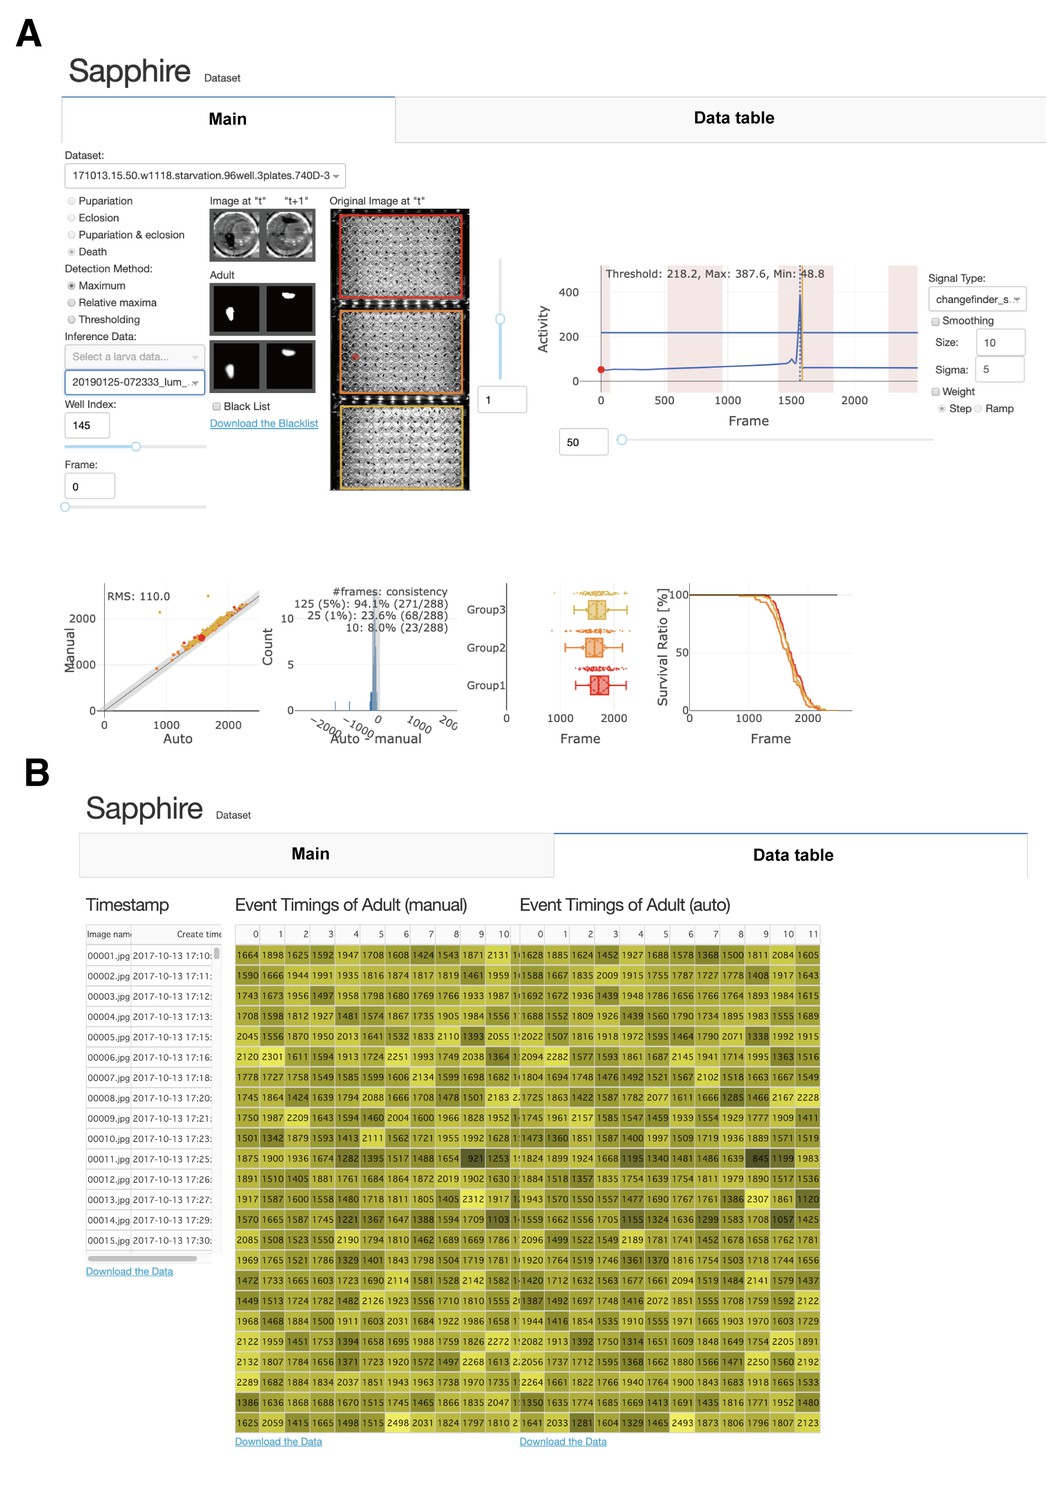
Sapphire user interface.
(A) Under the tab 'Main', appropriate datasets, detection methods, and inference data may be selected. We can also confirm and select well images and segmented areas of two consecutive images. We may confirm the result of Sapphire analysis on the selected well (upper left graph) and change ‘signal type,’ ‘smoothing,’ and ‘weight.’ We can compare data analyzed by Sapphire with those detected manually (lower panels). (B) In tab 'Data Table', we can download the timestamp and analyzed data.
Figure 2 with 5 supplements
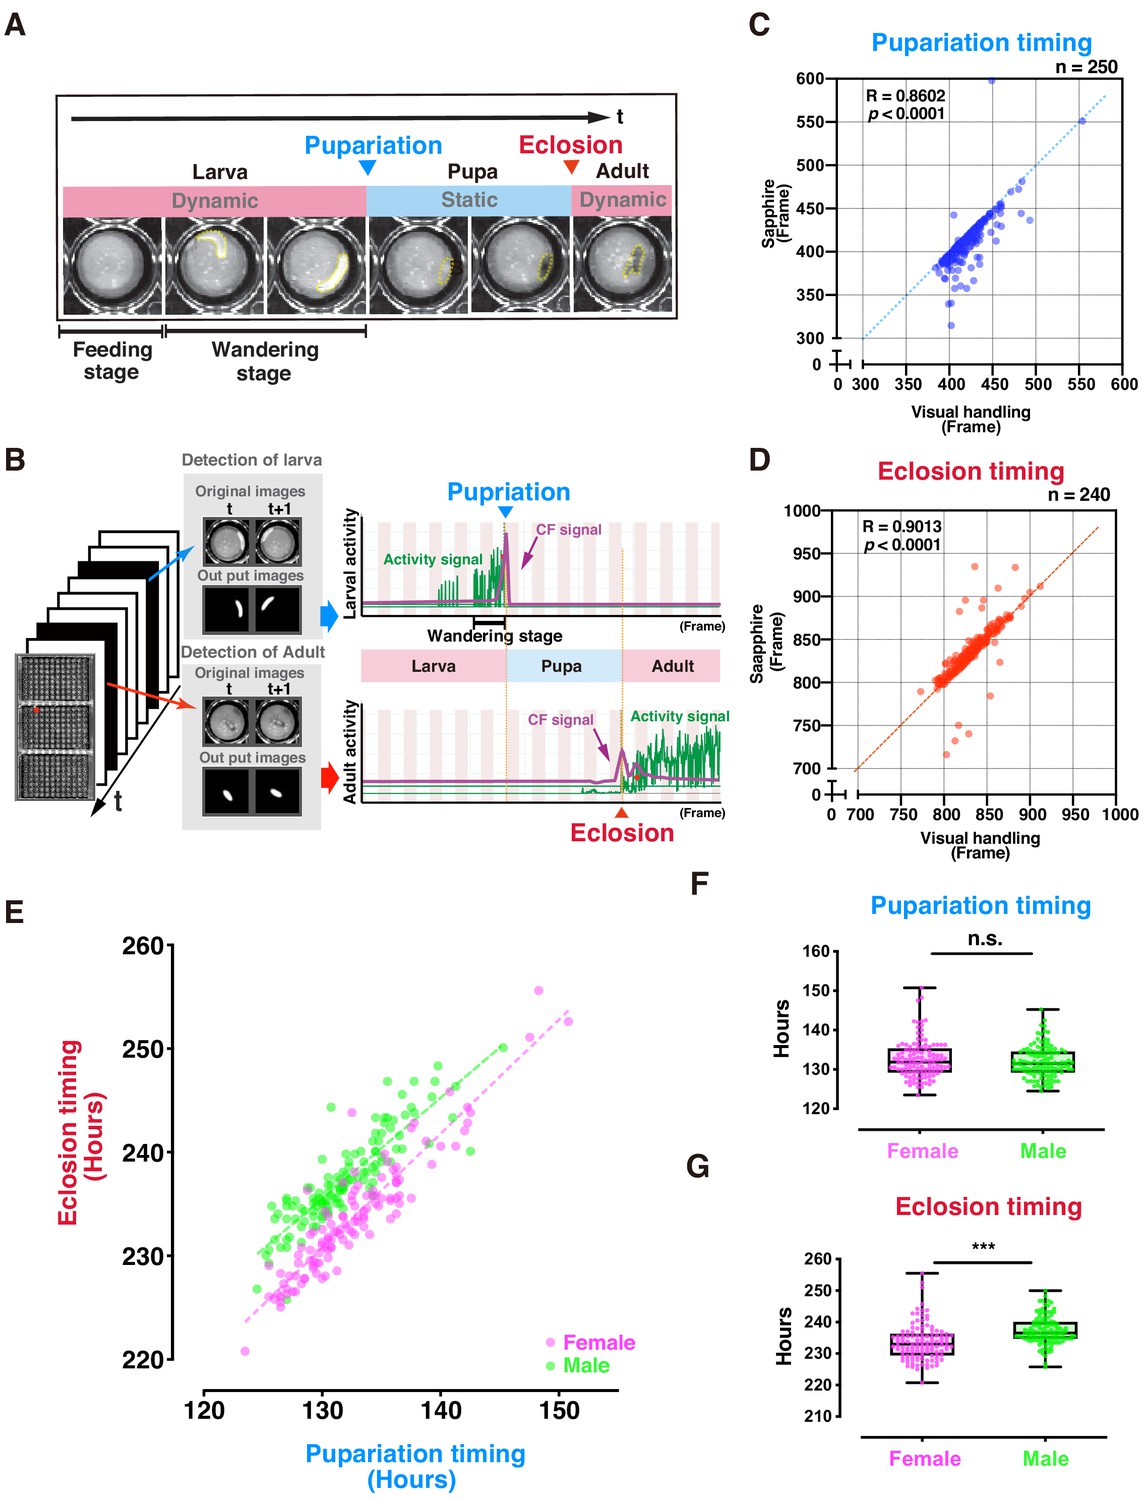
Evaluation of DIAMonDS for automatic detection of individual fly pupariation and eclosion.
(A) Schematic representation of pupariation and eclosion. Drastic changes in dynamic-to-static and static-to-dynamic states occur at pupariation and eclosion, respectively. At late L3, larval activity increases and transitions from feeding to wandering behavior. Dotted circles indicate animal bodies. (B) Time-lapse imaging was conducted until all flies eclosed into adults. Individual pupariation and eclosion transition points were separately analyzed in Sapphire. Wandering L3 larva showing high activity immediately before pupariation. (C,D) Scatterplot analyses comparing data for pupariation (C) and eclosion (D) obtained by Sapphire and visual handling to validate accuracy. (E–G) Scatterplot between pupariation and eclosion timing of individual flies (E) and box plots of pupariation (F) and eclosion (G) timing in males (n = 122; green dots) and females (n = 118; magenta dots). Whiskers indicate minima and maxima (***p<0.001; n.s., no significant difference; unpaired t-test).
-
Figure 2—source data 1
Data of individual pupariation timing obtained by Sapphire and visual handling (for Figure 2C and Figure 2—figure supplement 2A).
- https://cdn.elifesciences.org/articles/58630/elife-58630-fig2-data1-v2.xlsx
-
Figure 2—source data 2
Data of individual eclosion timing obtained by Sapphire and visual handling (for Figure 2D and Figure 2—figure supplement 2B).
- https://cdn.elifesciences.org/articles/58630/elife-58630-fig2-data2-v2.xlsx
-
Figure 2—source data 3
Data for scatterplot between pupariation and eclosion timing of individual flies and for box plots of pupariation and eclosion timing in males and females (for Figure 2E–G).
- https://cdn.elifesciences.org/articles/58630/elife-58630-fig2-data3-v2.xlsx
Figure 2—figure supplement 1

Effects of experimental conditions.
(A) Percent survival at each developmental stage (1 st instar (L1) larva, pupa, and adult stages) when a single embryo or L1 larva is installed in each well of a 96-well microplate. Averages with s.d. are shown (n = 6 each; ***p<0.001; **p<0.01; n.s., no significant difference; Student’s unpaired t-test). (B) Percent survival at each developmental stage (3rd instar (L3) larva, pupa, and adult stages) in 100 or 150 μL medium/well. Averages with s.d. are shown (n = 6 each;; ***p<0.001; n.s., no significant difference; Student’s unpaired t-test).
-
Figure 2—figure supplement 1—source data 1
Effects of experimental conditions.
- https://cdn.elifesciences.org/articles/58630/elife-58630-fig2-figsupp1-data1-v2.xlsx
Figure 2—figure supplement 2
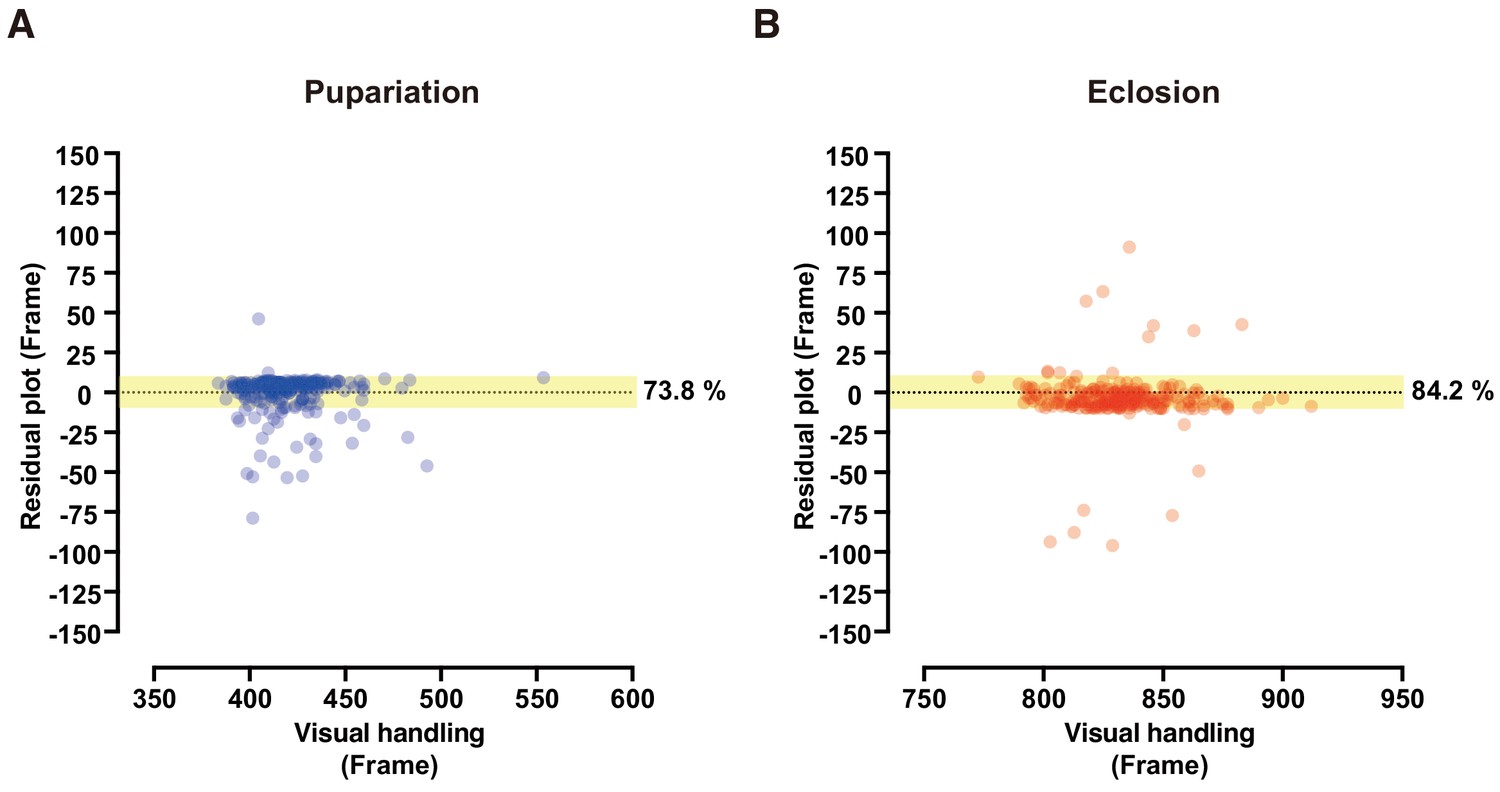
Residual plot analysis of pupariation and eclosion time points.
Figure 2—figure supplement 3
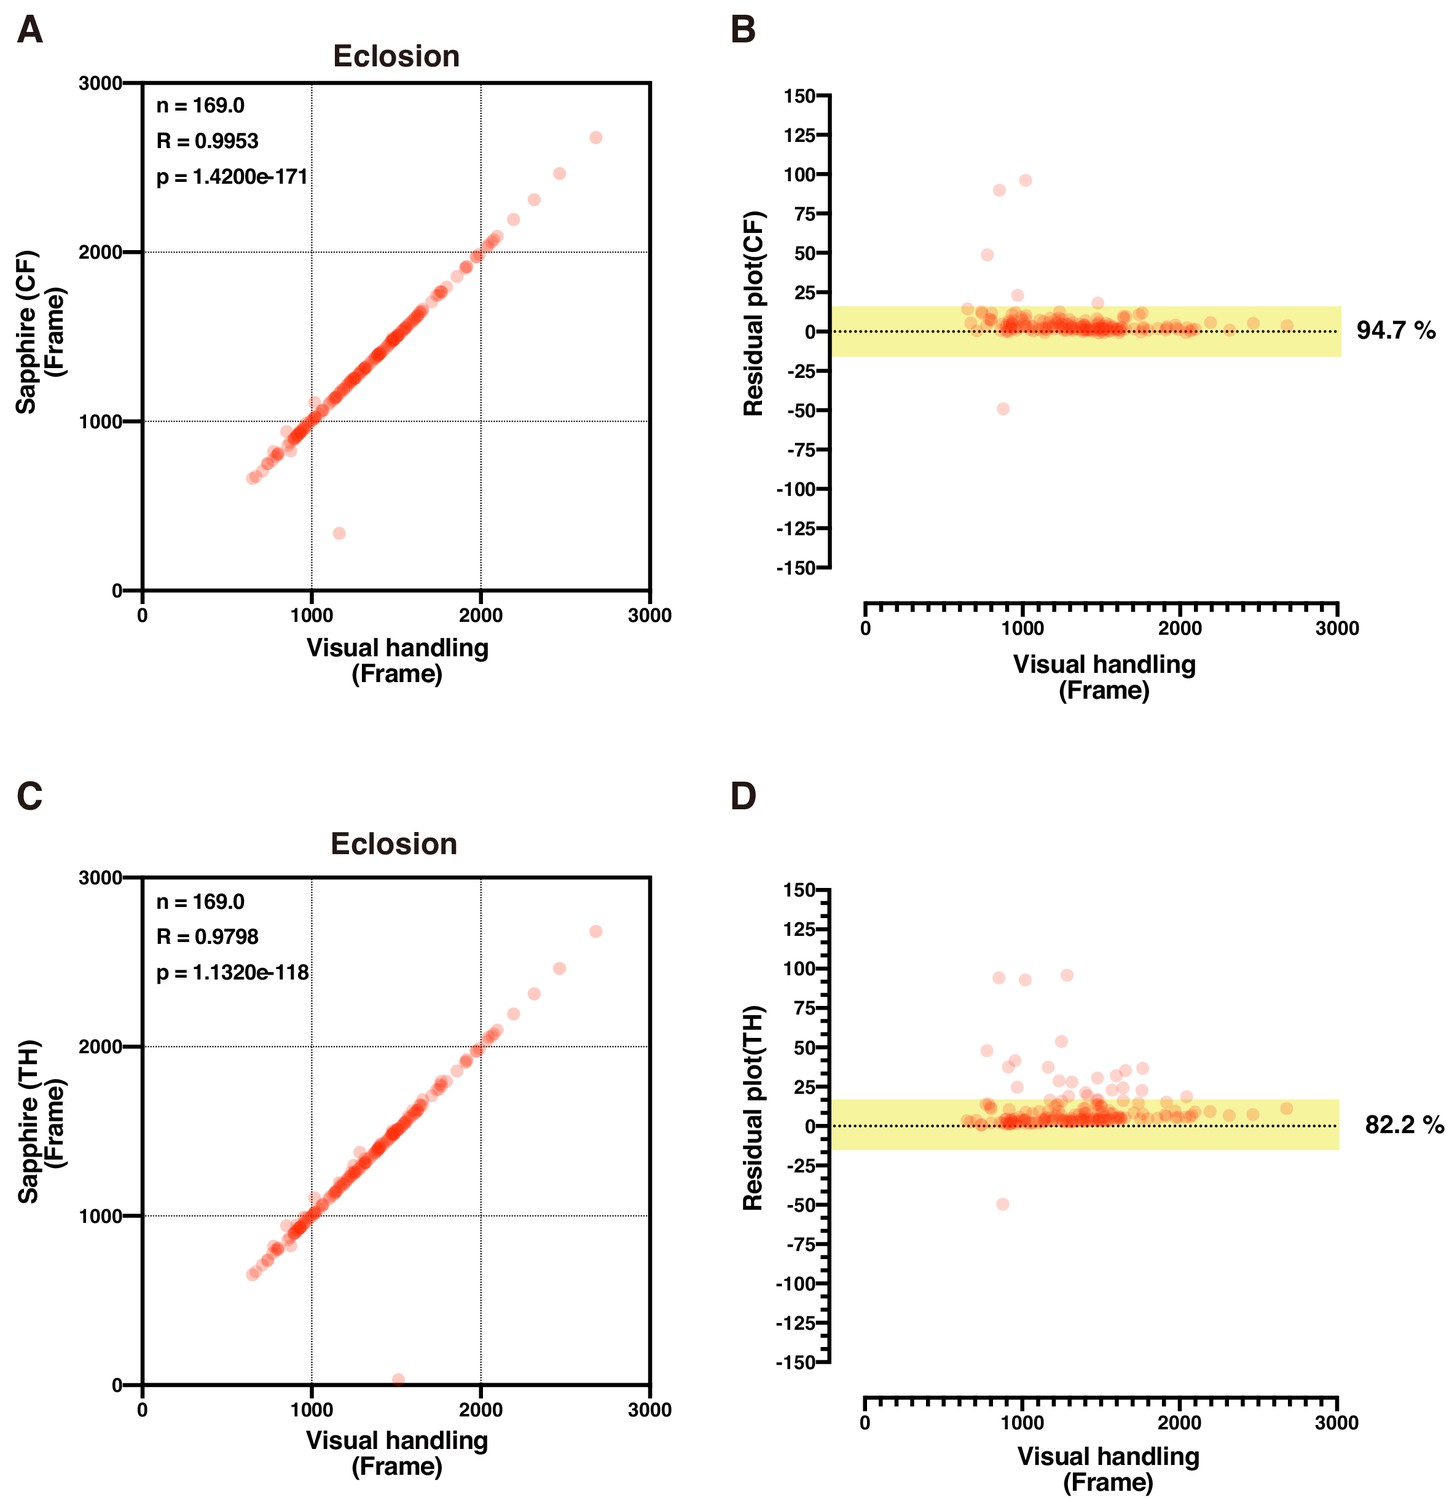
Validation of CF and TH methods.
(A–D) Scatterplot and residual plot of eclosion timing between Sapphire (CF method: A and B; TH method: C and D) and visual handling of the same image data. Here, we transferred P14 stage pupae to new microplates once during time-lapse image acquisition.
-
Figure 2—figure supplement 3—source data 1
Validation of CF and TH methods.
- https://cdn.elifesciences.org/articles/58630/elife-58630-fig2-figsupp3-data1-v2.xlsx
Figure 2—figure supplement 4

Validation of plate position effect.
(A) Image of plates used for pupariation and eclosion time-lapse acquisition in DIAMonDS. (B–D) Box plots of pupariation (B), eclosion (C), and pupal duration (D) in male (green dots) and female (magenta dots) flies. Number of flies analyzed is indicated in parentheses on each graph. Whiskers indicate minima and maxima (***p<0.001; **p<0.01; n.s., no significant difference; Student’s unpaired t-test).
-
Figure 2—figure supplement 4—source data 1
Validation of plate position effect.
- https://cdn.elifesciences.org/articles/58630/elife-58630-fig2-figsupp4-data1-v2.xlsx
Figure 2—figure supplement 5
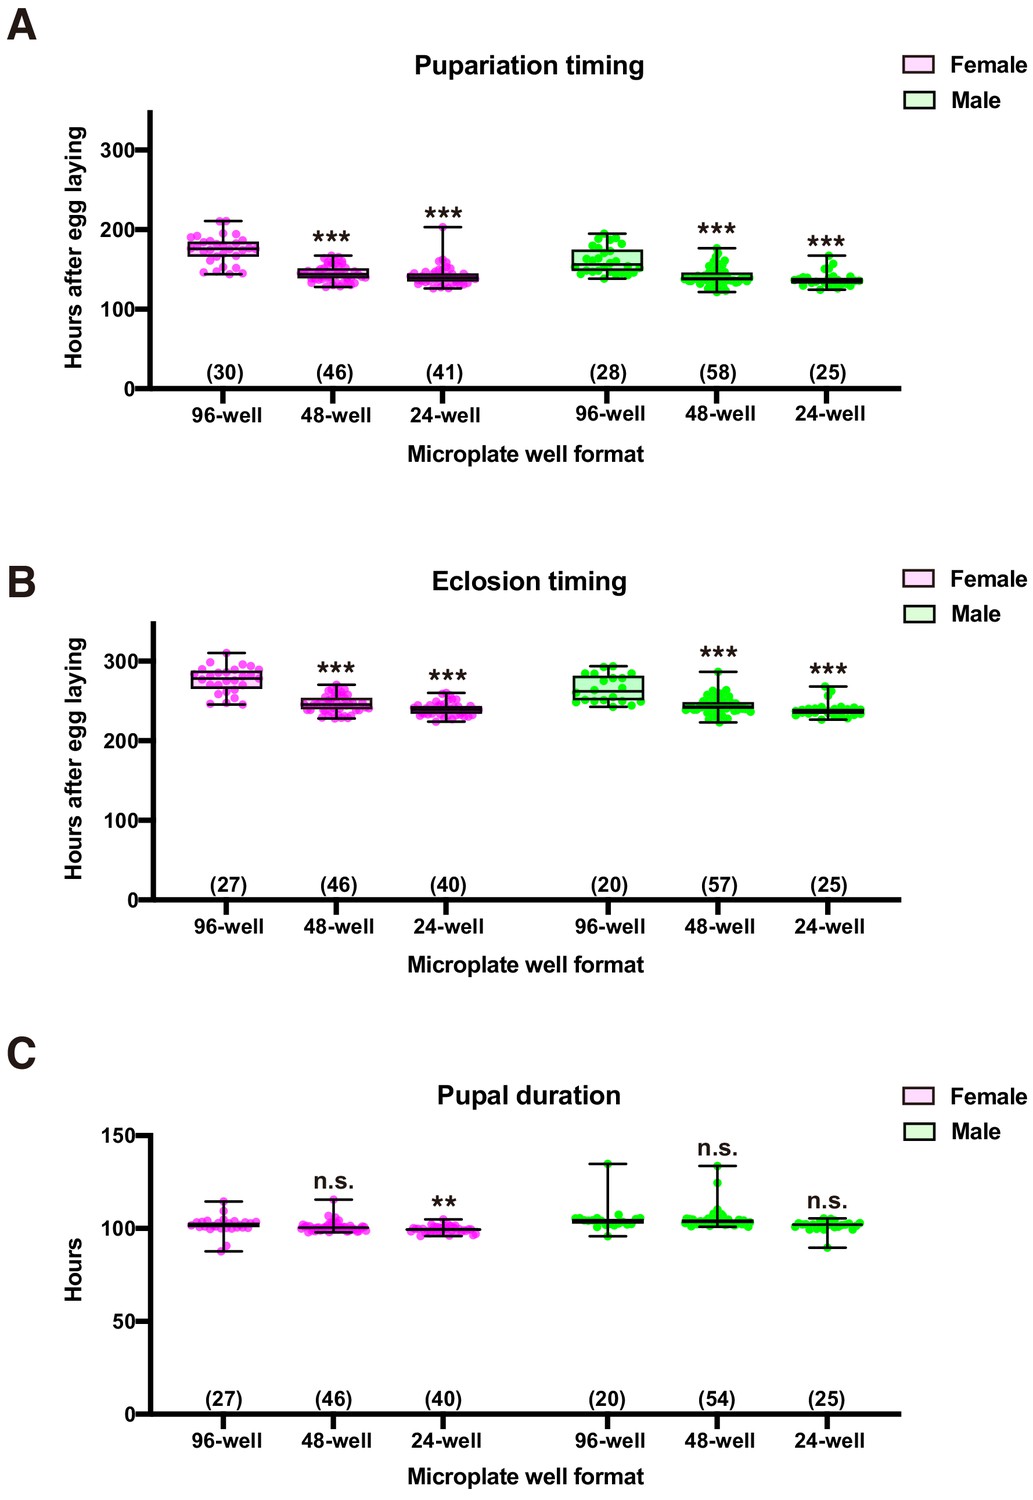
Effect of plate well size on fly’s development.
(A–C) Box plots of pupariation (A), eclosion (B), and pupal duration (C) in male flies. Number of flies analyzed is indicated in parentheses on each graph. Whiskers indicate minima and maxima (***p<0.001; **p<0.01; n.s., no significant difference; one-way ANOVA followed by Dunnett’s multiple comparison test).
-
Figure 2—figure supplement 5—source data 1
Effect of plate well size on fly’s development.
- https://cdn.elifesciences.org/articles/58630/elife-58630-fig2-figsupp5-data1-v2.xlsx
Figure 3 with 1 supplement

DIAMonDS is suitable for phenotypic analyses during larval development.
(A) Box plot analysis of pupariation timing in flies with impaired ecdysteroid biosynthesis at 29°C (genotype: R29H01 > TeTxLC; R29H01>+ as a control). Larval age (L2, early L3, and late L3) at start of measurement had negligible impact on DIAMonDS analysis accuracy. Y-axis indicates pupariation timing from start of experiment. Number of flies analyzed indicated in parentheses on the graph. Whiskers indicate minima and maxima (*p<0.05; **p<0.01; ***p<0.001; n.s., no significant difference; multiple t-test). (B) Three 96-well microplates were subdivided into nine regions according to sucrose concentration (0.15–1 M) in media used for DIAMonDS. (C) Scatterplot between pupariation and eclosion timing in males and females. (D–F) Box plots of pupariation timing (D), eclosion timing (E), and pupal duration (F). Whiskers indicate minima and maxima (*p<0.05; **p<0.01; ***p<0.001; n.s., no significant difference vs. standard diet group; one-way ANOVA followed by Dunnett’s multiple comparison test). Number of flies analyzed indicated in parentheses on the graph.
-
Figure 3—source data 1
Box plot analysis of pupariation timing in flies with impaired ecdysteroid biosynthesis at 29°C (for Figure 3A).
- https://cdn.elifesciences.org/articles/58630/elife-58630-fig3-data1-v2.xlsx
-
Figure 3—source data 2
Effect of sucrose concentration in media on pupariation and eclosion (for Figure 3C–F).
- https://cdn.elifesciences.org/articles/58630/elife-58630-fig3-data2-v2.xlsx
Figure 3—figure supplement 1

Determination of large-scale pupariation timing using DIAMonDS.
(A,B) Scatterplot (A) and residual plot (B) between Sapphire (CF method) and manual analysis (n = 850).
-
Figure 3—figure supplement 1—source data 1
Determination of large-scale pupariation timing using DIAMonDS.
- https://cdn.elifesciences.org/articles/58630/elife-58630-fig3-figsupp1-data1-v2.xlsx
Figure 4 with 3 supplements
Evaluation of DIAMonDS for detection of death of individual adults.
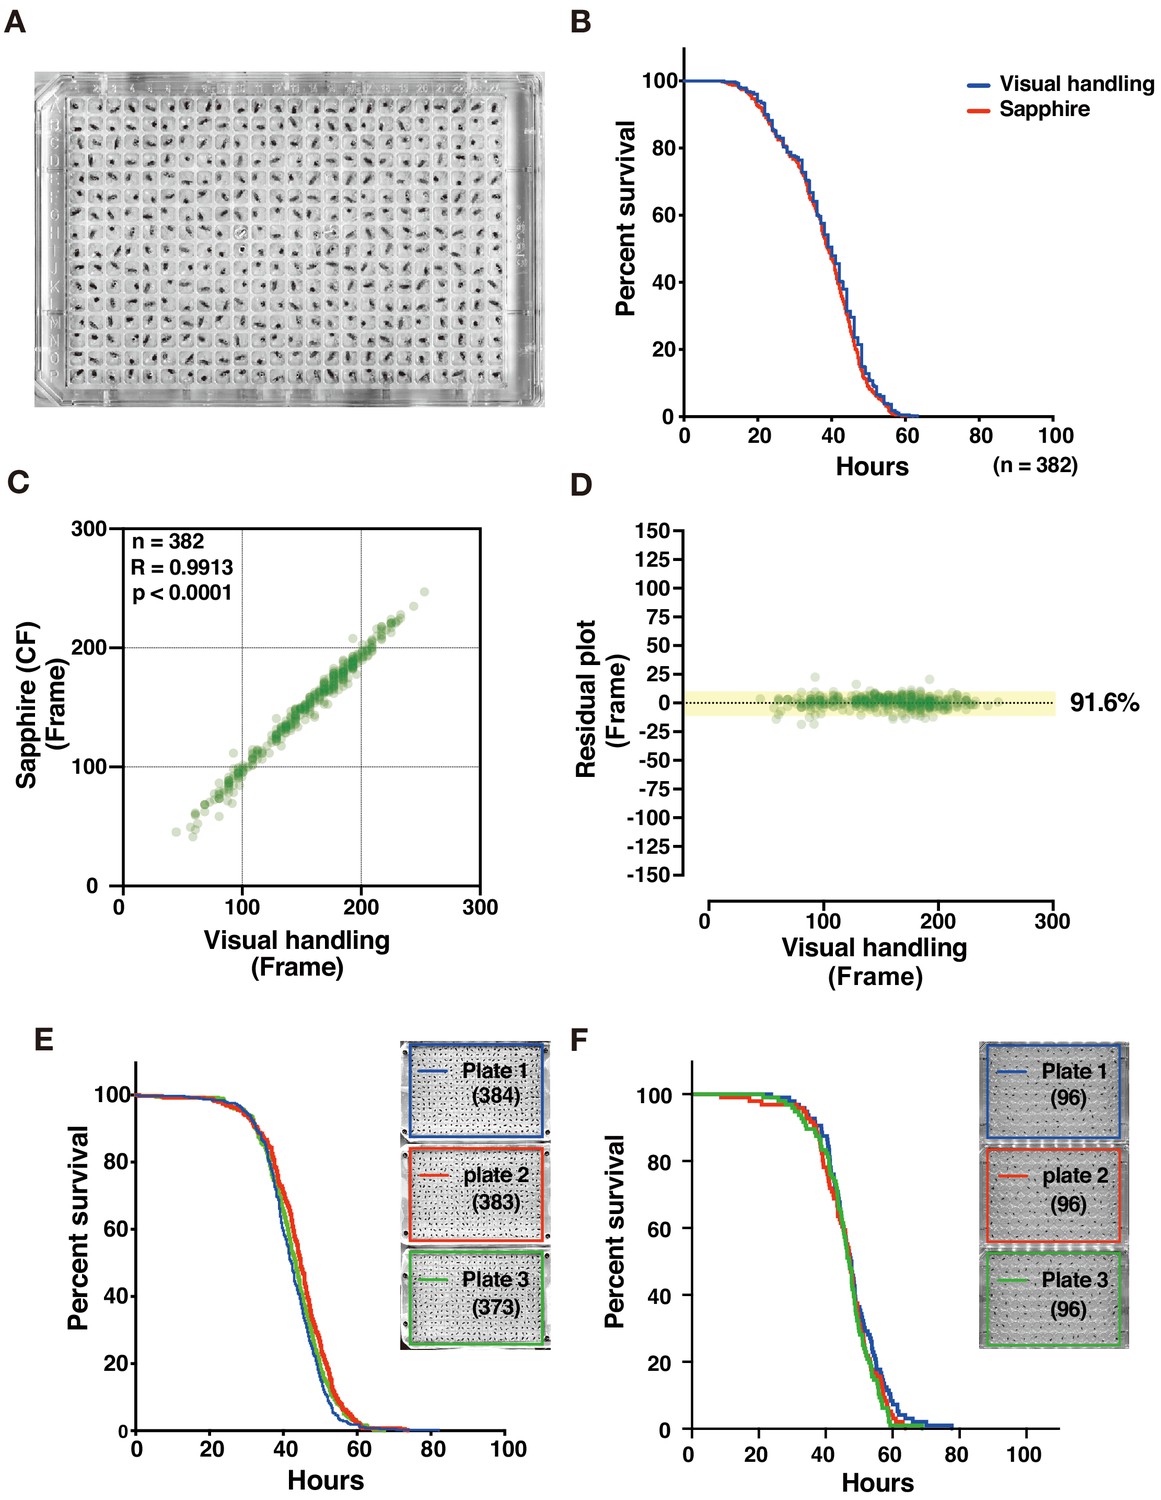
(A) A 384-well microplate with flies prepared for DIAMonDS. (B) Survivorship curves in starvation condition plotted by Sapphire (red line) or visual handling (blue line) using the same data. (C,D) Scatterplot and residual plot analysis comparing Sapphire (CF method) and visual handling to validate accuracy (n = 382). (E,F) Survivorship curves for starvation resistance tests on adult male w1118 flies using three 384- (E) and three 96-well (F) microplates. Number of flies analyzed indicated in parentheses in each plate.
-
Figure 4—source data 1
Evaluation of DIAMonDS for detection of death of individual adults.
- https://cdn.elifesciences.org/articles/58630/elife-58630-fig4-data1-v2.xlsx
Figure 4—figure supplement 1
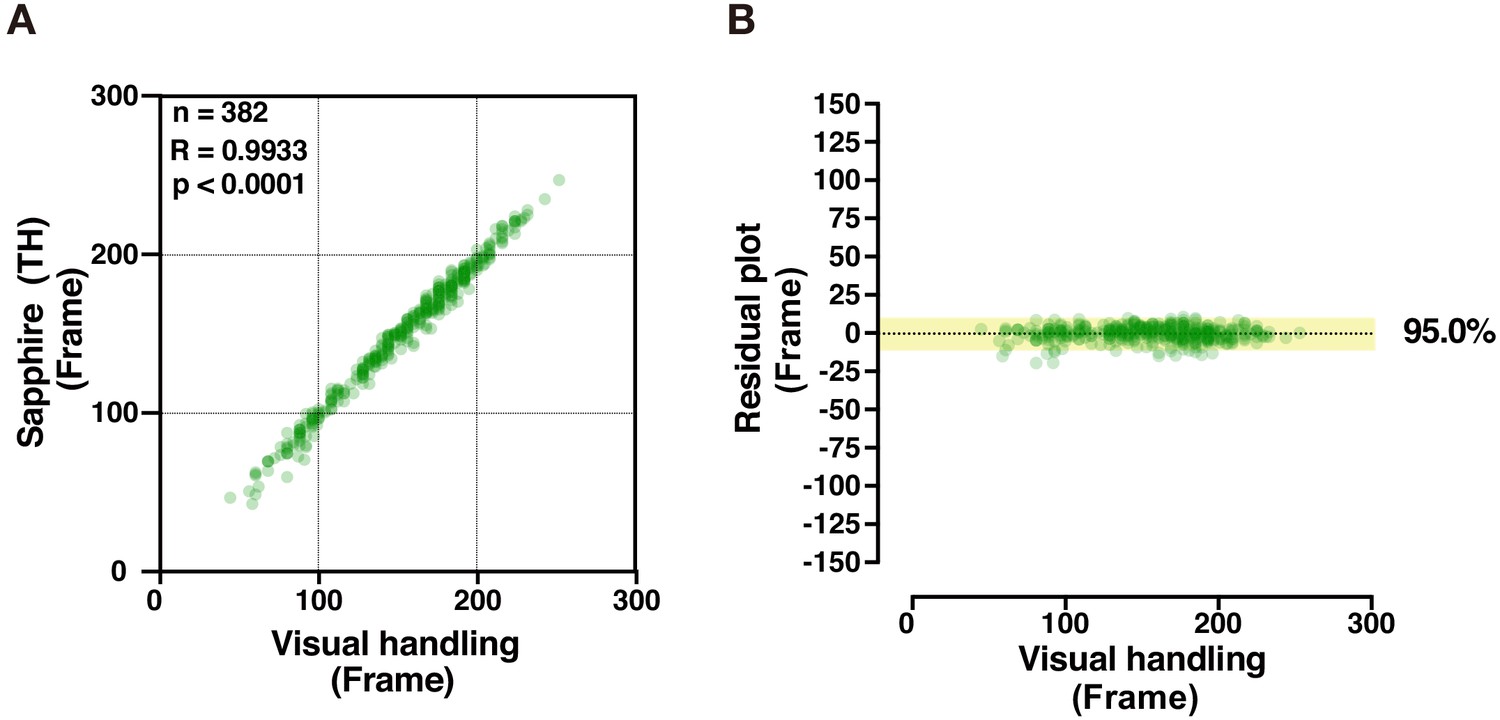
Semi-automatic TH method for Sapphire.
(A,B) Scatterplot (A) and residual plot (B) between Sapphire (TH method) and manual analysis (visual handling) to validate accuracy (n = 382). Results corresponding to Figure 4C,D.
-
Figure 4—figure supplement 1—source data 1
Semi-automatic TH method for Sapphire.
- https://cdn.elifesciences.org/articles/58630/elife-58630-fig4-figsupp1-data1-v2.xlsx
Figure 4—figure supplement 2
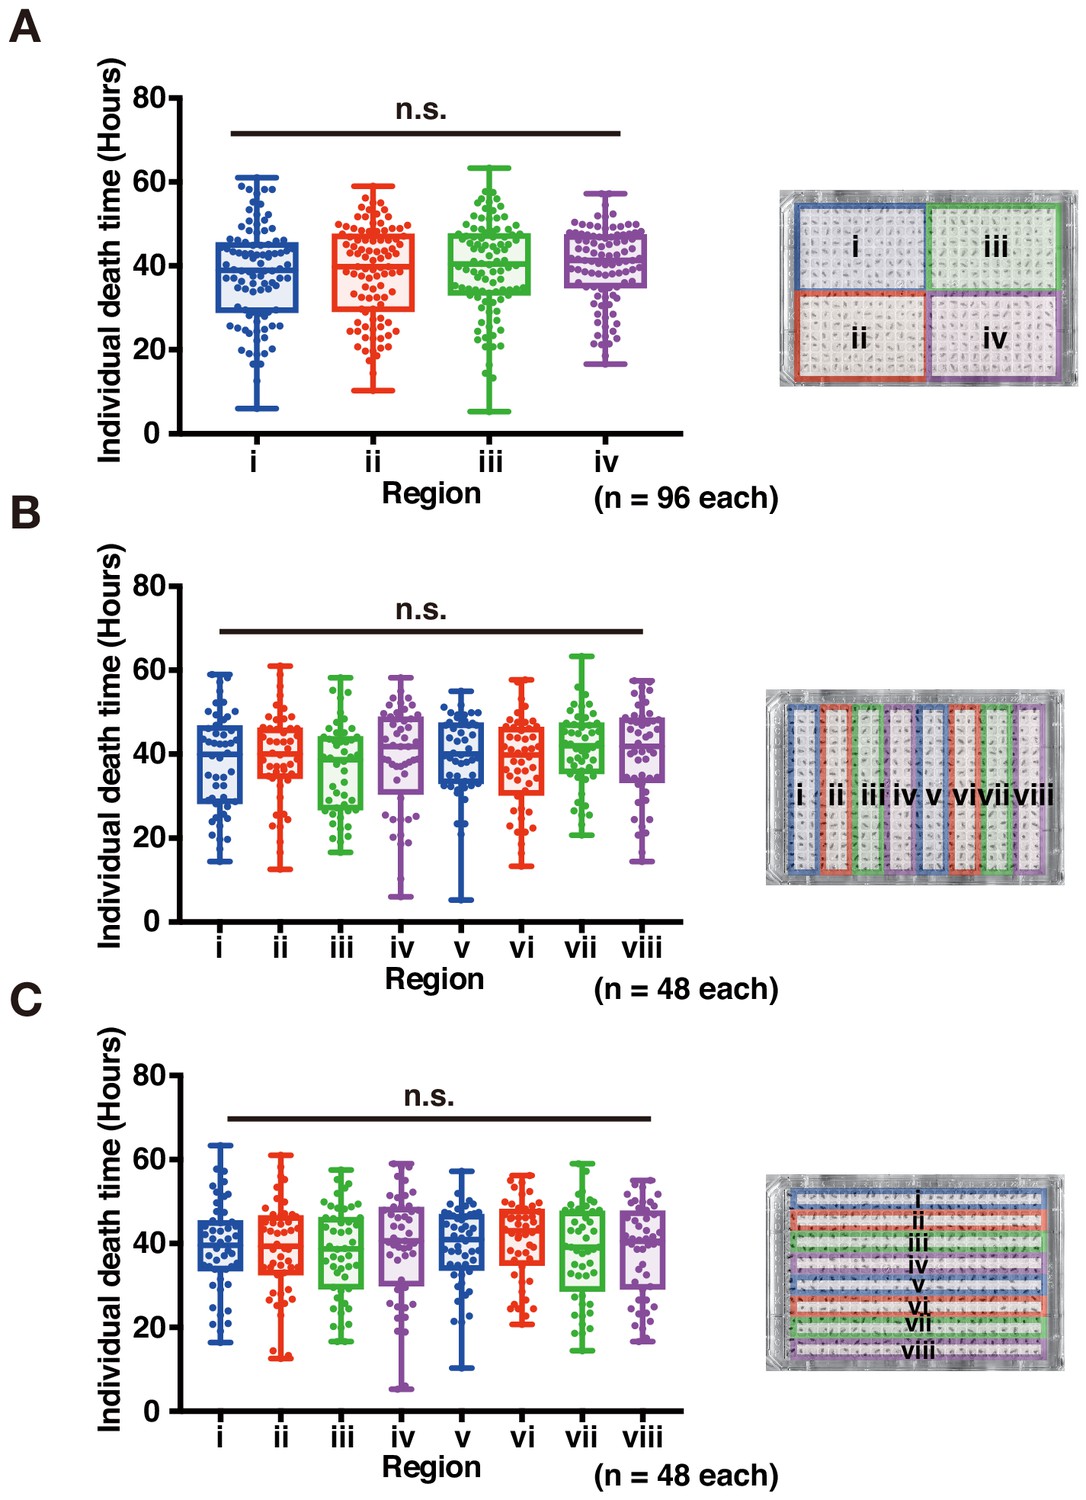
Validation of the effect of sub-area on 384-well microplate.
(A–C) Box plots subdivided in the same dataset are shown as images on the left side of graphs. (n.s., no significant difference; Student’s unpaired t-test). Image of plates used to detect death timing in DIAMonDS. Number of flies analyzed indicated in parentheses on the graph.
-
Figure 4—figure supplement 2—source data 1
Validation of the effect of sub-area on 384-well microplate.
- https://cdn.elifesciences.org/articles/58630/elife-58630-fig4-figsupp2-data1-v2.xlsx
Figure 4—figure supplement 3
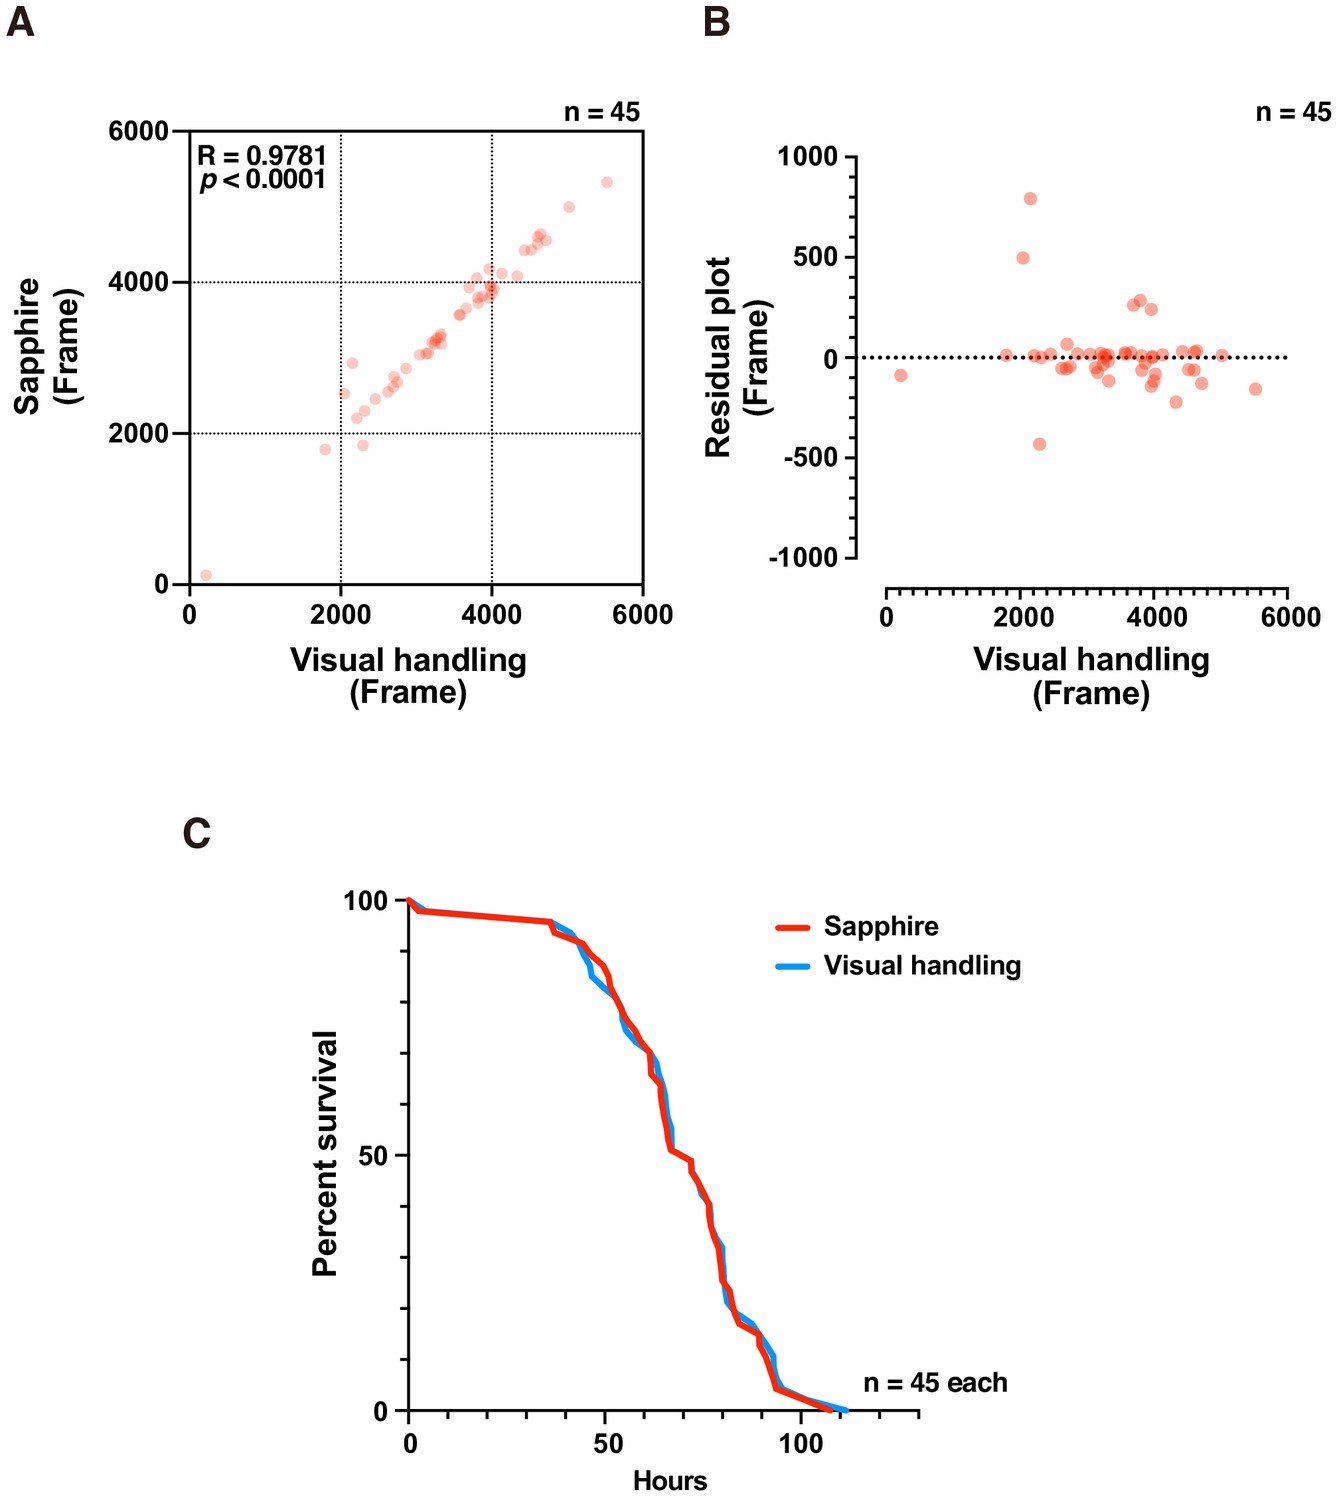
Death timing detection of decapitated adult females using DIAMonDS.
(A,B) Scatterplot (A) and residual plot (B) between Sapphire (CF method) and manual analysis (n = 45). (C) Survivorship curves. Red and blue lines indicate results determined by Sapphire (CF method) and visual handling, respectively (n = 45).
-
Figure 4—figure supplement 3—source data 1
Death timing detection of decapitated adult females using DIAMonDS.
- https://cdn.elifesciences.org/articles/58630/elife-58630-fig4-figsupp3-data1-v2.xlsx
Figure 5 with 1 supplement
Adult survival curve detection by DIAMonDS.
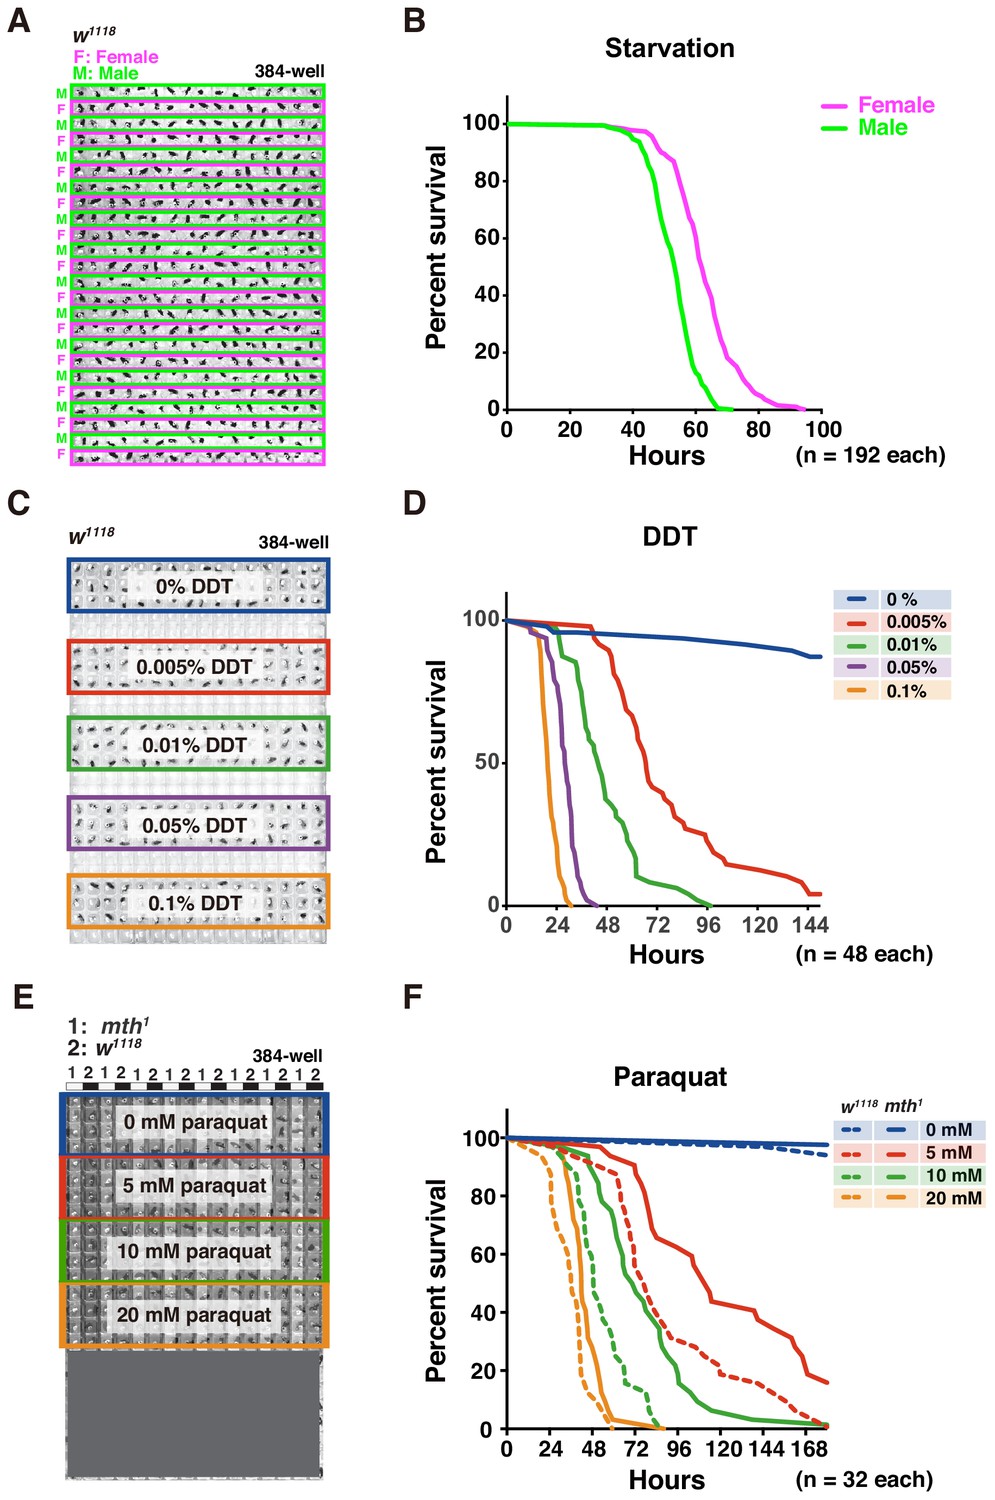
(A,B) Starvation tolerance test using male and female w1118 flies (n = 192 each). Rows of males and females were alternately arranged in 384-well microplate (A). Representative male and female survivorship curves (B). (C,D) DDT resistance test on male w1118 flies (n = 48 each). A 384-well microplate with YS media containing DDT concentration series (0–0.1%). Forty-eight male flies were exposed to each concentration and subjected to DIAMonDS (C). Survivorship curves show concentration-dependent toxic effects of DDT (D). (E,F) Paraquat resistance test on male mth1 and w1118 flies (n = 32 each). A 384-well microplate containing media with paraquat (0, 5, 10, and 20 mM). Rows of mth1 and w1118 flies were alternately arranged in wells (E). Survivorship curves for mth1 mutants (solid lines) and w1118 flies (dotted lines) substantially differed at all paraquat concentrations (F).
-
Figure 5—source data 1
Adult survival curve detection by DIAMonDS (for Figure 5 and Figure 5—figure supplement 1).
- https://cdn.elifesciences.org/articles/58630/elife-58630-fig5-data1-v2.xlsx
Figure 5—figure supplement 1
Comparison between CH and TH methods for detecting death time points in DIAMonDS.
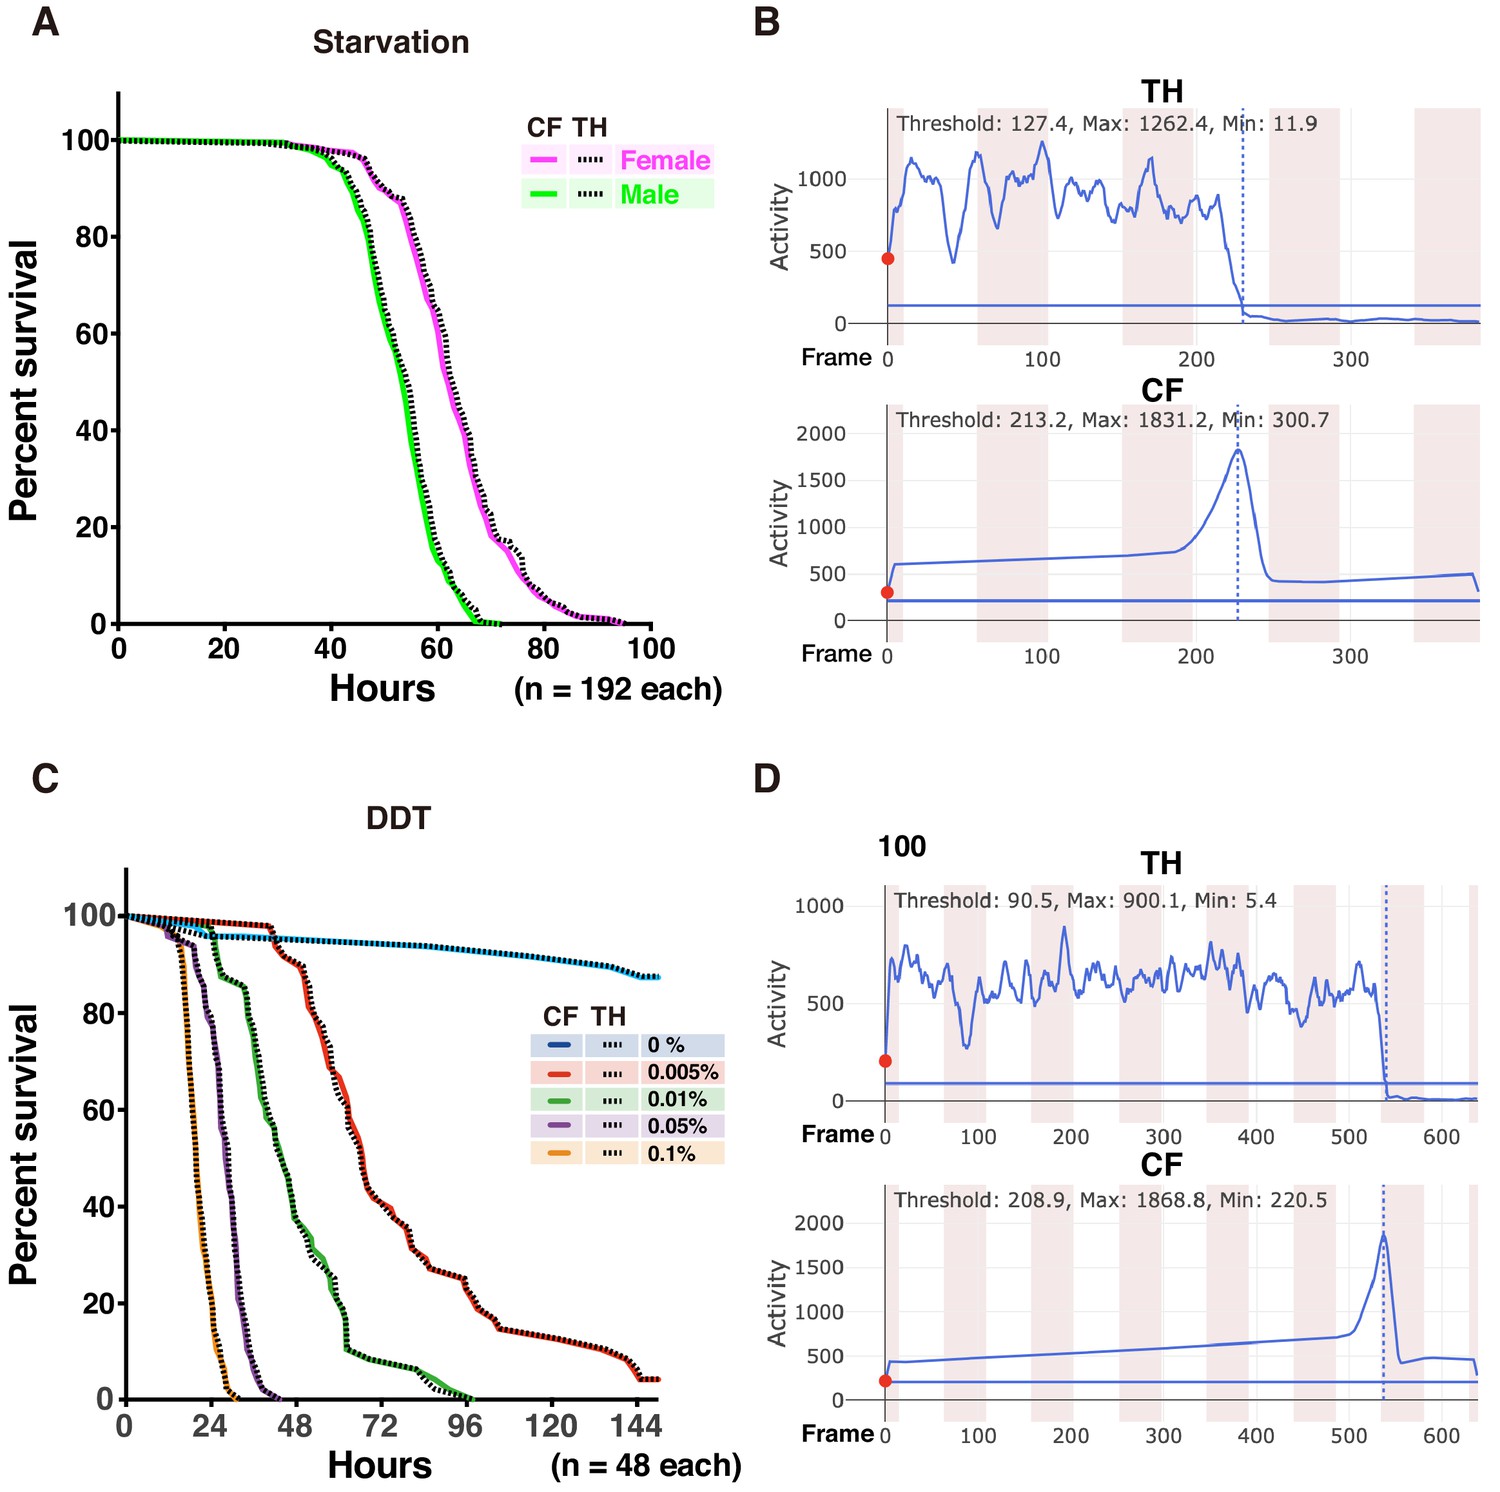
(A,B) Results corresponding to Figure 5A,B. (C,D) Results corresponding to Figure 5C,D. (A,C) Survivorship curves. Solid and dotted lines indicate results determined by CF and TH methods, respectively. (B,D) Example of analysis by Sapphire using TH and CF methods.
Figure 6 with 1 supplement
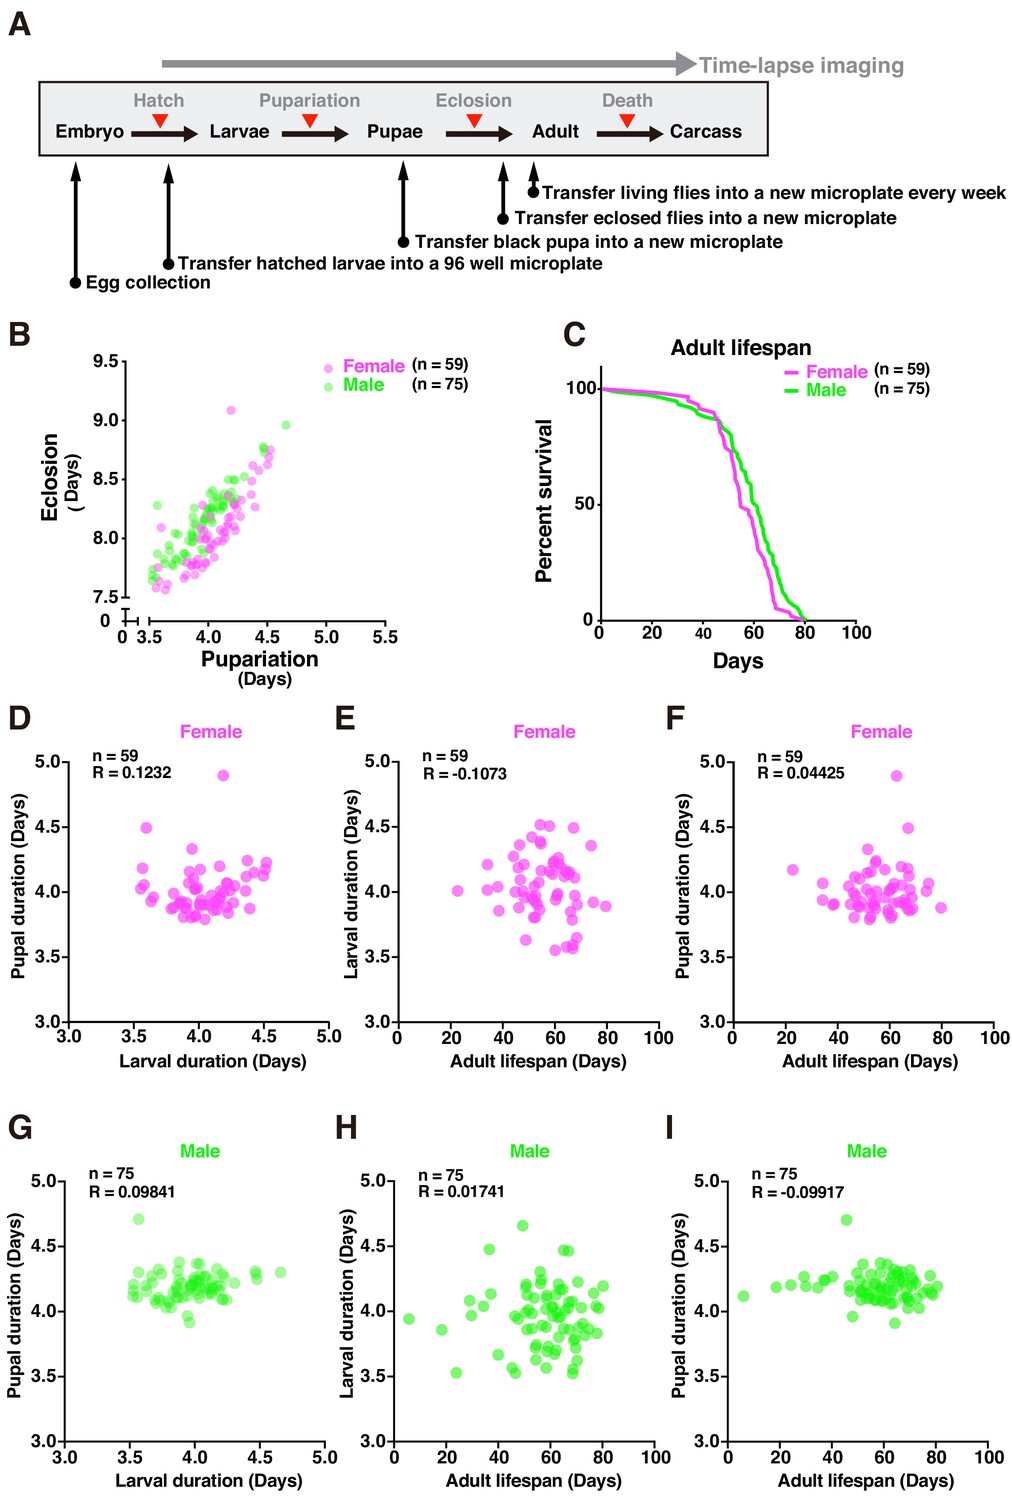
Tracing entire life events of individual flies by DIAMonDS.
(A) Schematic diagram showing detection of pupariation, eclosion, and death transition points for each individual in DIAMonDS. (B) Scatterplot between pupariation and eclosion timing for individual female (n = 59) and male (n = 75) flies. (C) Survivorship curves for adult female (n = 59) and male (n = 75) flies. (D–I) Pearson’s correlation scatter plots indicate relationships between larval and pupal duration (D,G), between larval duration and adult lifespan (E,H), and between pupal duration and adult lifespan (F,I). Data are separately presented for female (D–F, n = 59 each) and male (G–I, n = 75 each) flies.
-
Figure 6—source data 1
Tracing entire life events of individual flies by DIAMonDS.
- https://cdn.elifesciences.org/articles/58630/elife-58630-fig6-data1-v2.xlsx
Figure 6—figure supplement 1
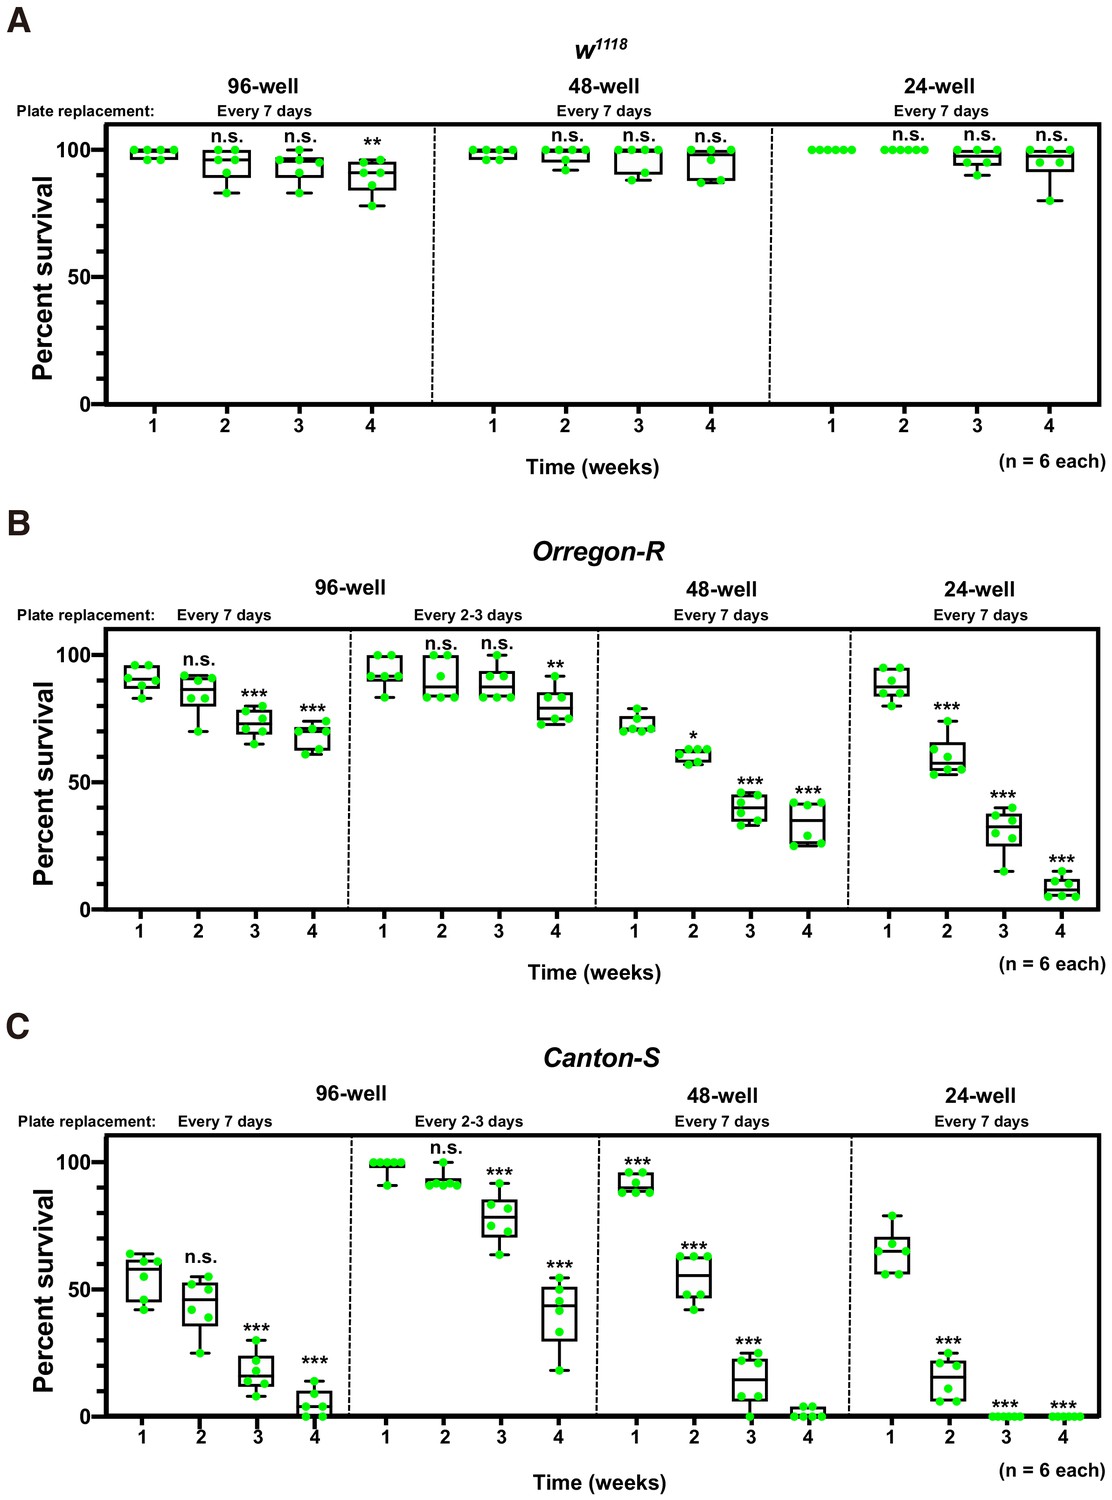
Effect of plate well size on adult survival.
(A–C) Box plots of adult percent survival at 1 st, 2nd, 3rd, and 4th weeks in w1118 (A), Oregon-R (B), and Canton-S (C) male flies. Flies were reared in several plate well sizes (96-well, 48-well, and 24-well) and transferred to appropriate new plates every week or 2–3 days cycles. Twenty-four flies were selected randomly from each well of microplate and calculated percent survival at each time point. Whiskers indicate minima and maxima (***p<0.001; **p<0.01; *p<0.05; n.s., no significant difference; one-way ANOVA followed by Dunnett’s multiple comparison test, n = 6 each).
-
Figure 6—figure supplement 1—source data 1
Effect of plate well size on adult survival.
- https://cdn.elifesciences.org/articles/58630/elife-58630-fig6-figsupp1-data1-v2.xlsx
Appendix 1—figure 1
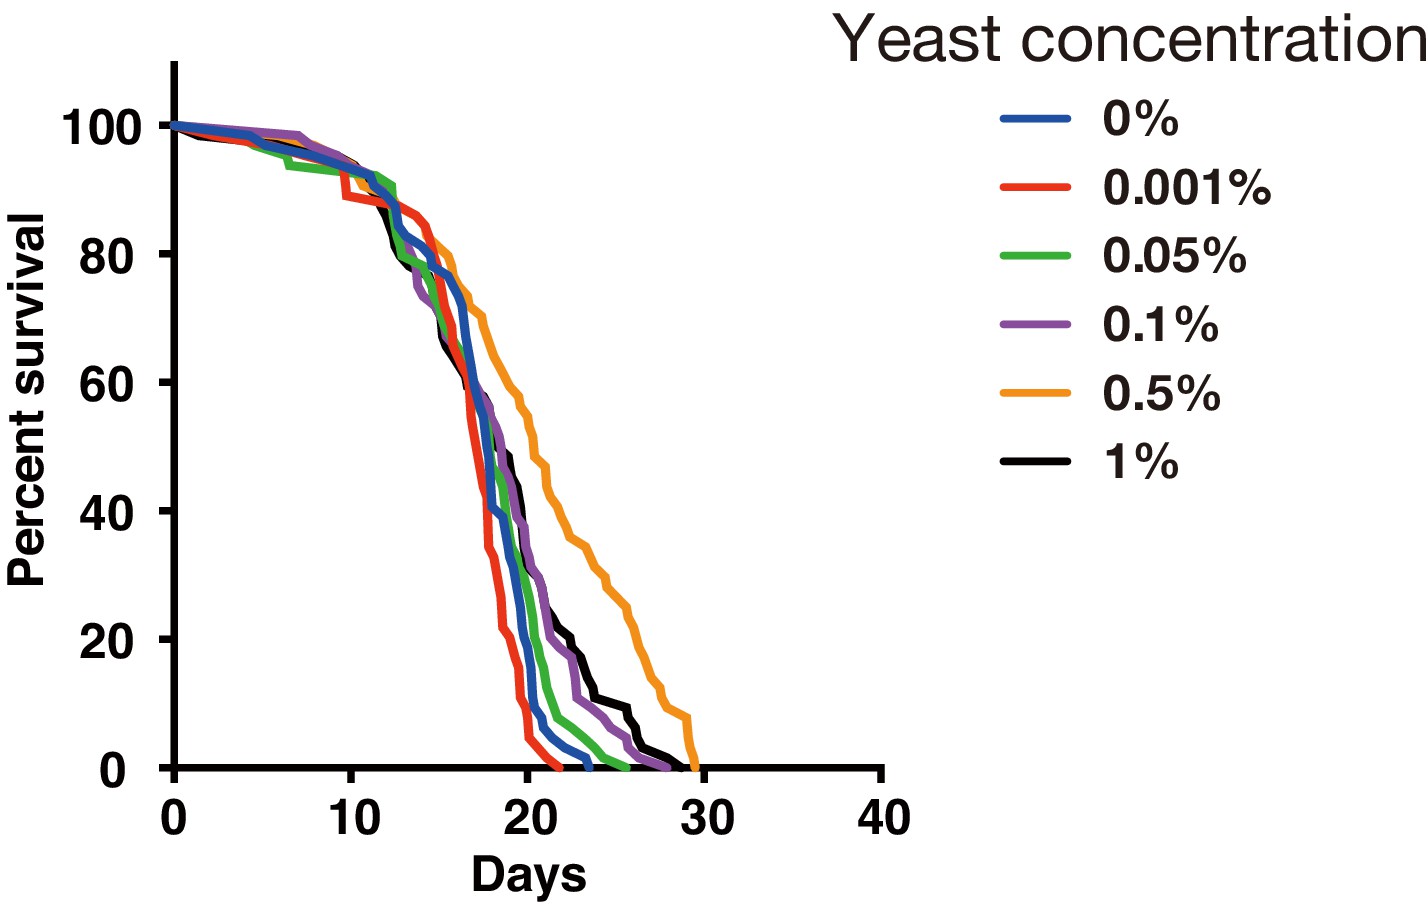
Effect of yeast concentration in fly medium.
Survivorship curves for w1118 males under several yeast concentrations by using a 384-well microplate (n = 24 each).
Appendix 2—figure 1
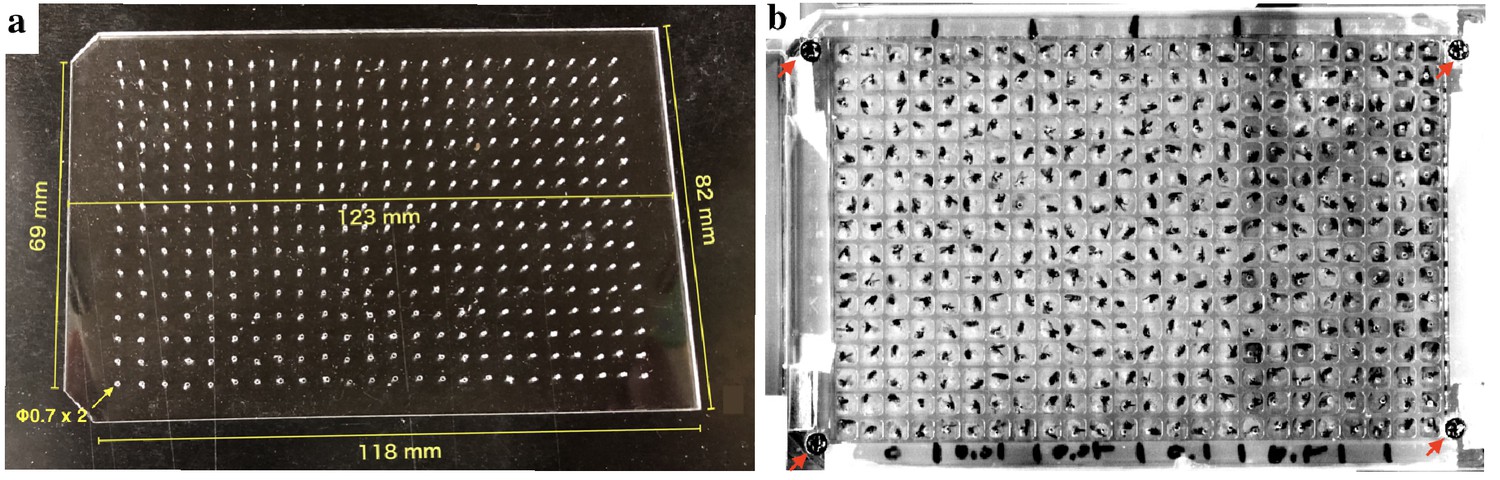
Lid design for 384-well microplate.
(a) A handmade acrylic lid for 384-well microplate. (b) Usage example of the lid. Red arrows indicate positions of the screw.
Appendix 4—figure 1
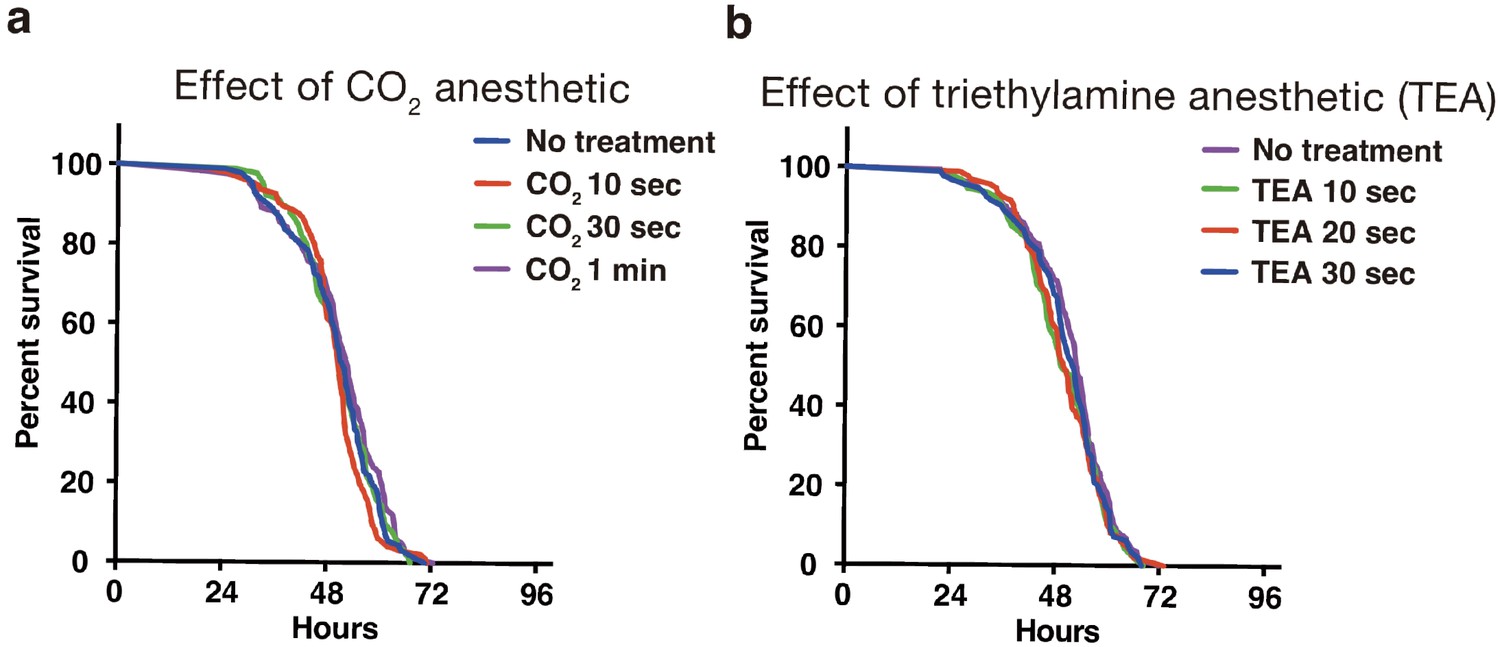
Effect of anesthetics on fly viability in starvation test of adult male flies using 384-well microplate.
(a) Effect of CO2 anesthetic. (b) Effect of TEA anesthetic.
Appendix 5—figure 1
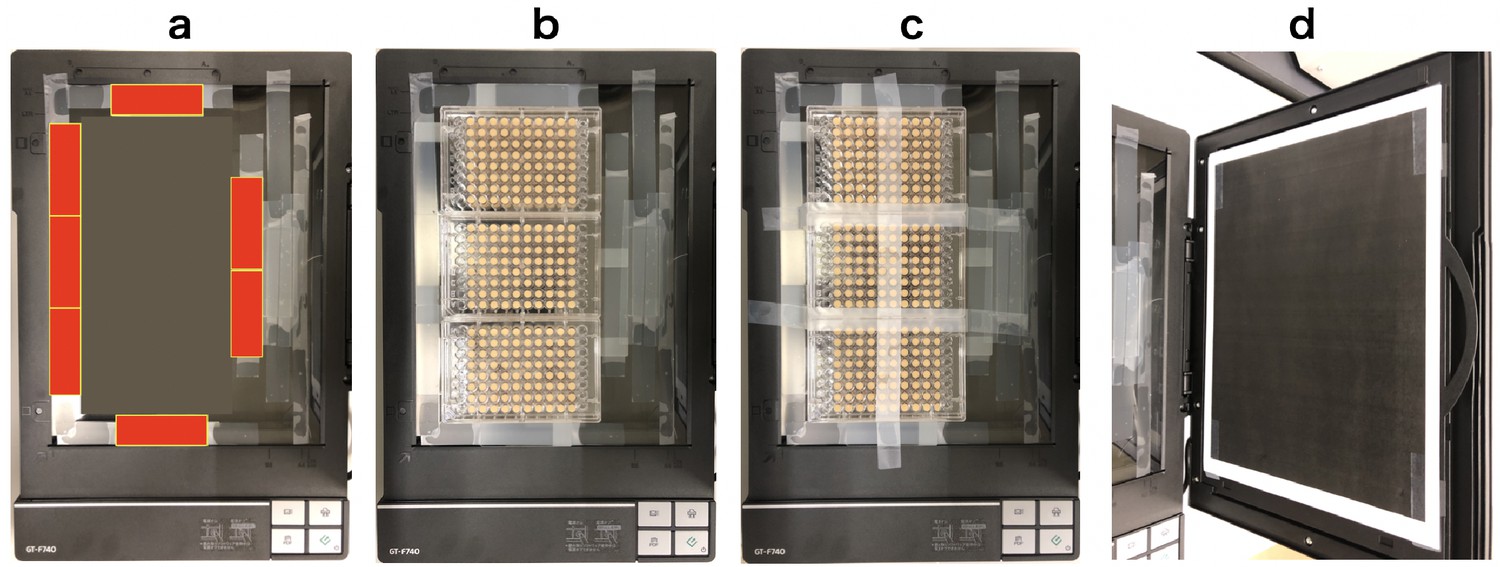
Fixing method of microplates on the scanner surface.
(a) Positions of glass slides (red squares). (b) Three microplates fit perfectly in the frame of glass slides. (c) Microplates are fixed tightly on the surface by masking tape. (d) A black painted sheet on the scanner reflector.
Appendix 6—figure 1

Equipment arrangement for DIAMonDS.
(a) An example of the layout for DIAMonDS. (b and c) The direction of installation of the scanner for measurement of death time point. The scanner should be installed in the normal direction or upside-down direction for measurement of death (b) or developmental timings (pupariation and eclosion) (c) respectively.
Appendix 6—figure 2
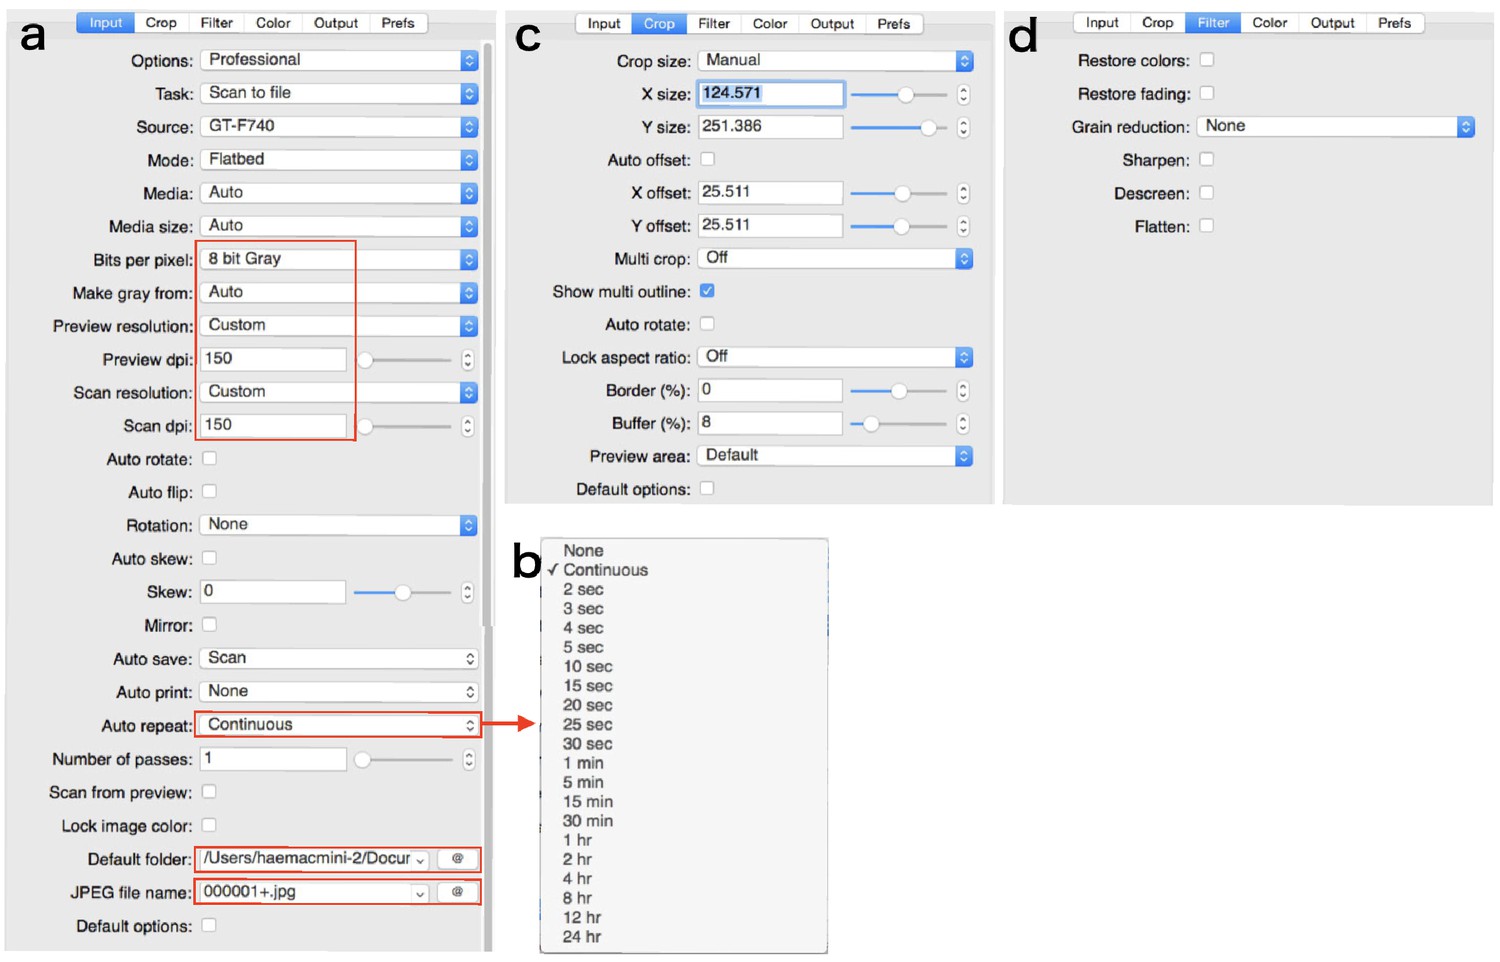
Parameters in the tabs.
Areas enclosed by the square is especially important. (a) ‘Input’ tab. (b) Drop-down box of ‘Auto repeat’. (c) ‘Crop’ tab. (d) ‘Filter’ tab.
Appendix 6—figure 3
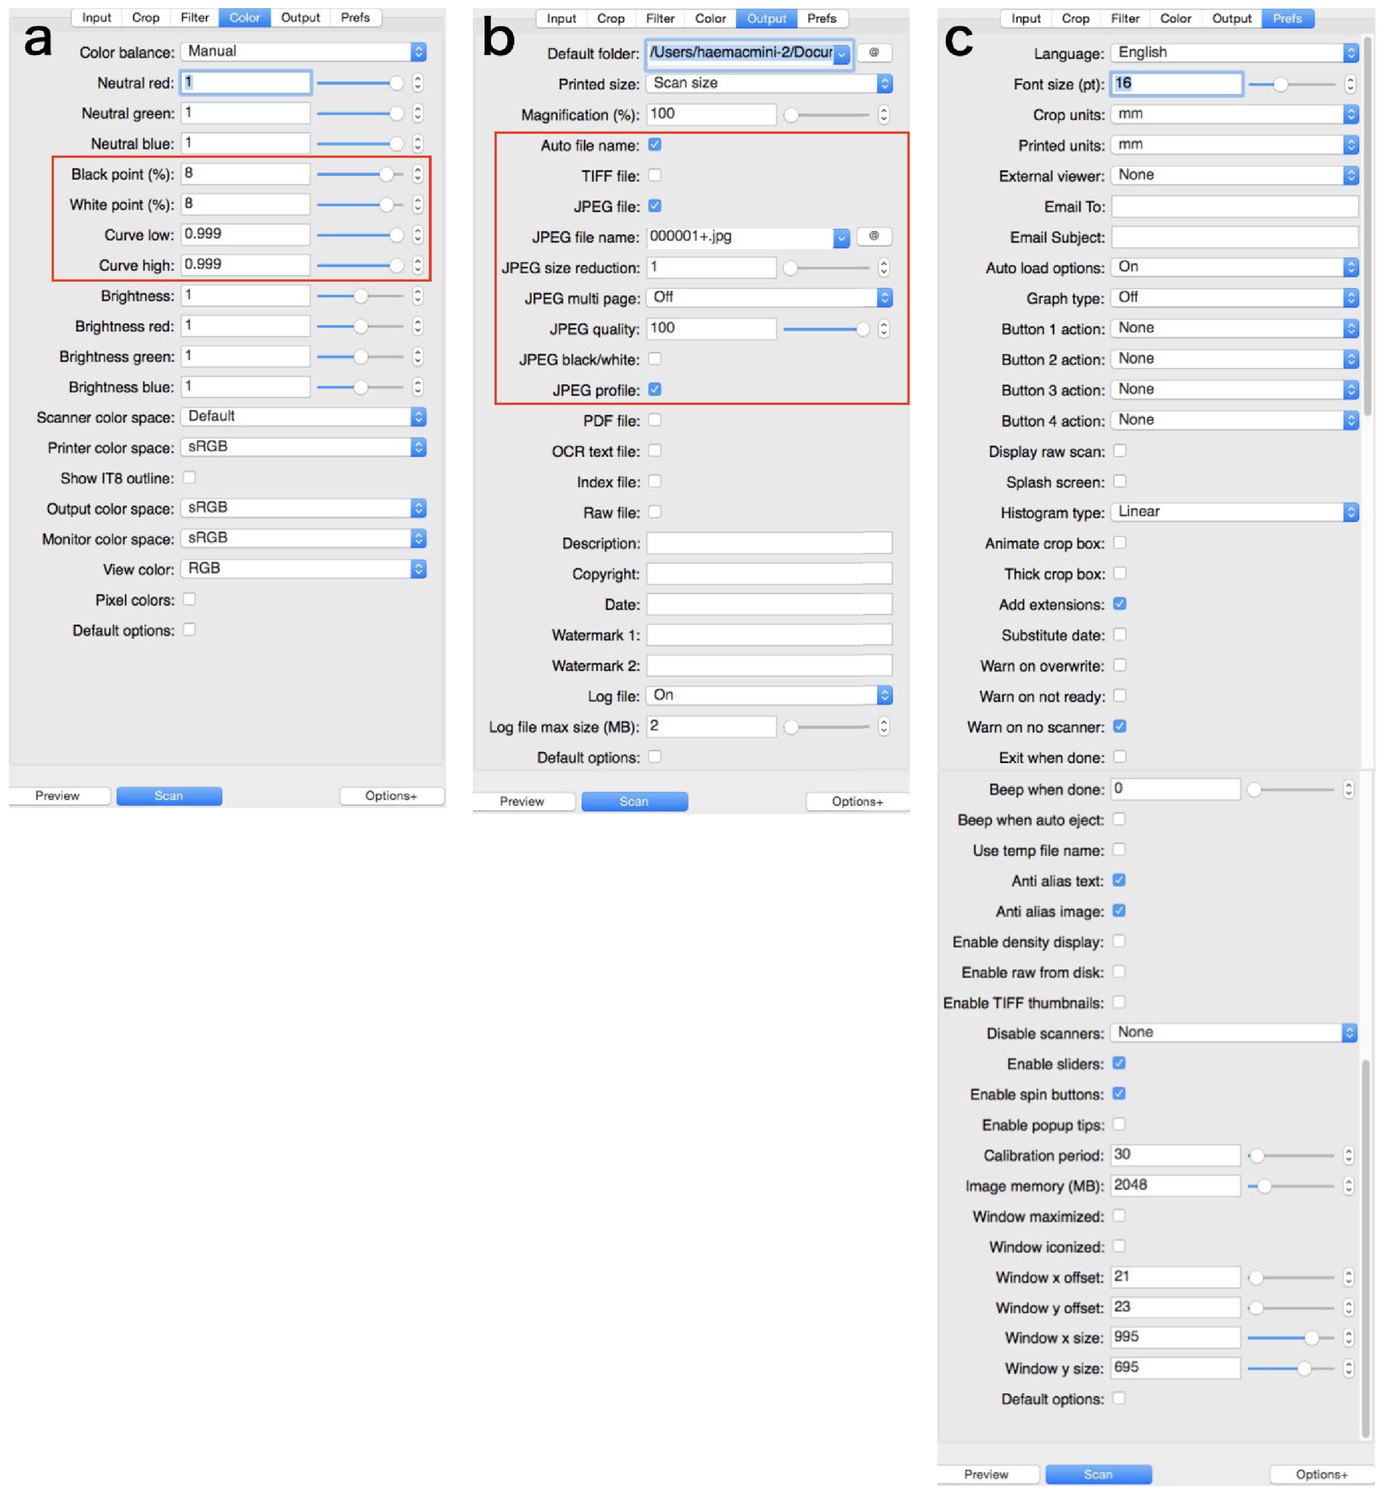
Parameters in the tabs.
Areas enclosed by the square is especially important. (a) ‘Color’ tab. (b) ‘Output’ tab. (c) ‘Prefs’ tab.
Appendix 7—figure 1
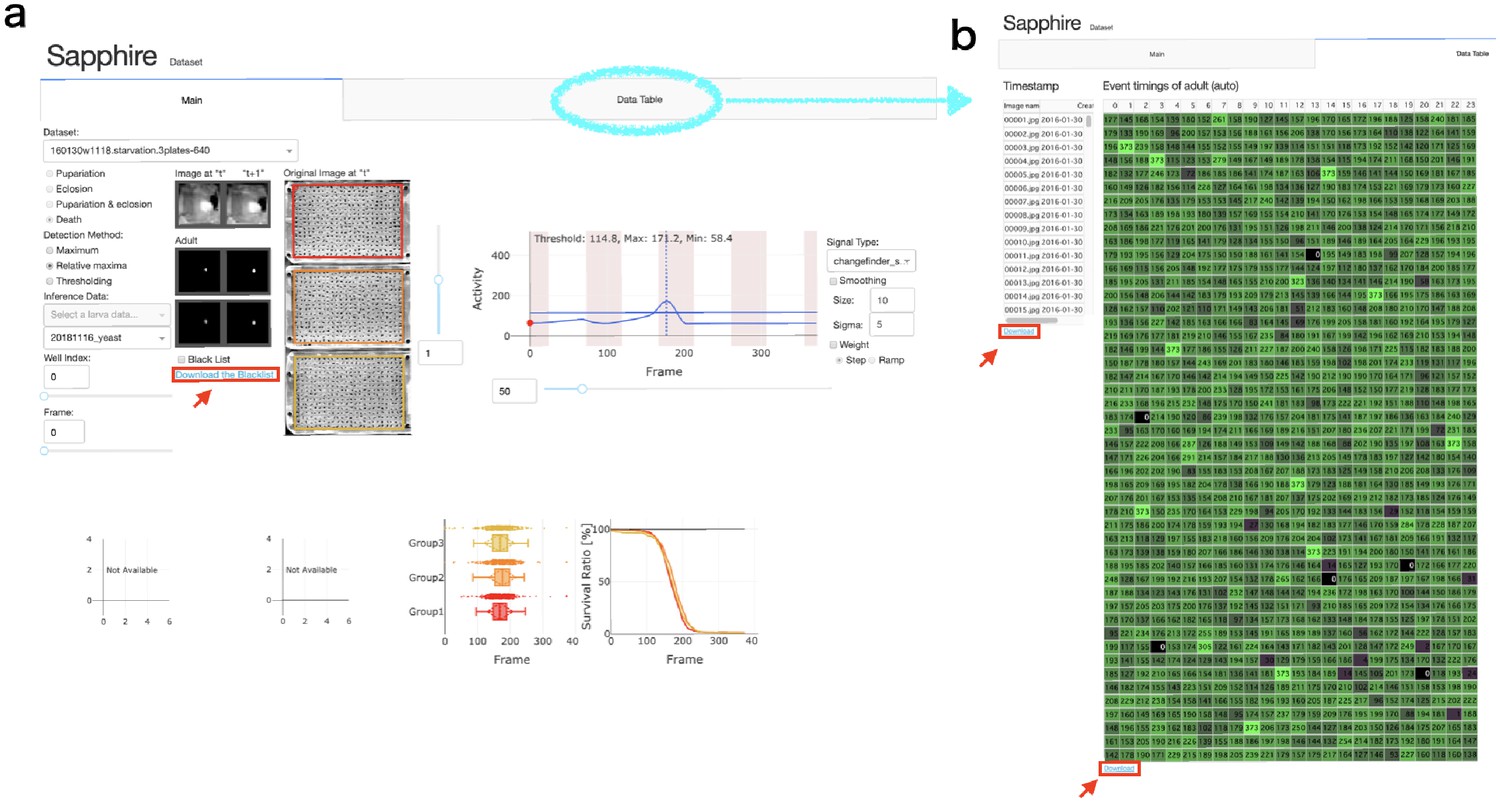
Sapphire viewer.
(a) 'Main’ tab. (b) ‘Data table’ tab. Red arrows indicated ‘Download’ button of each data lists.
Appendix 7—figure 2
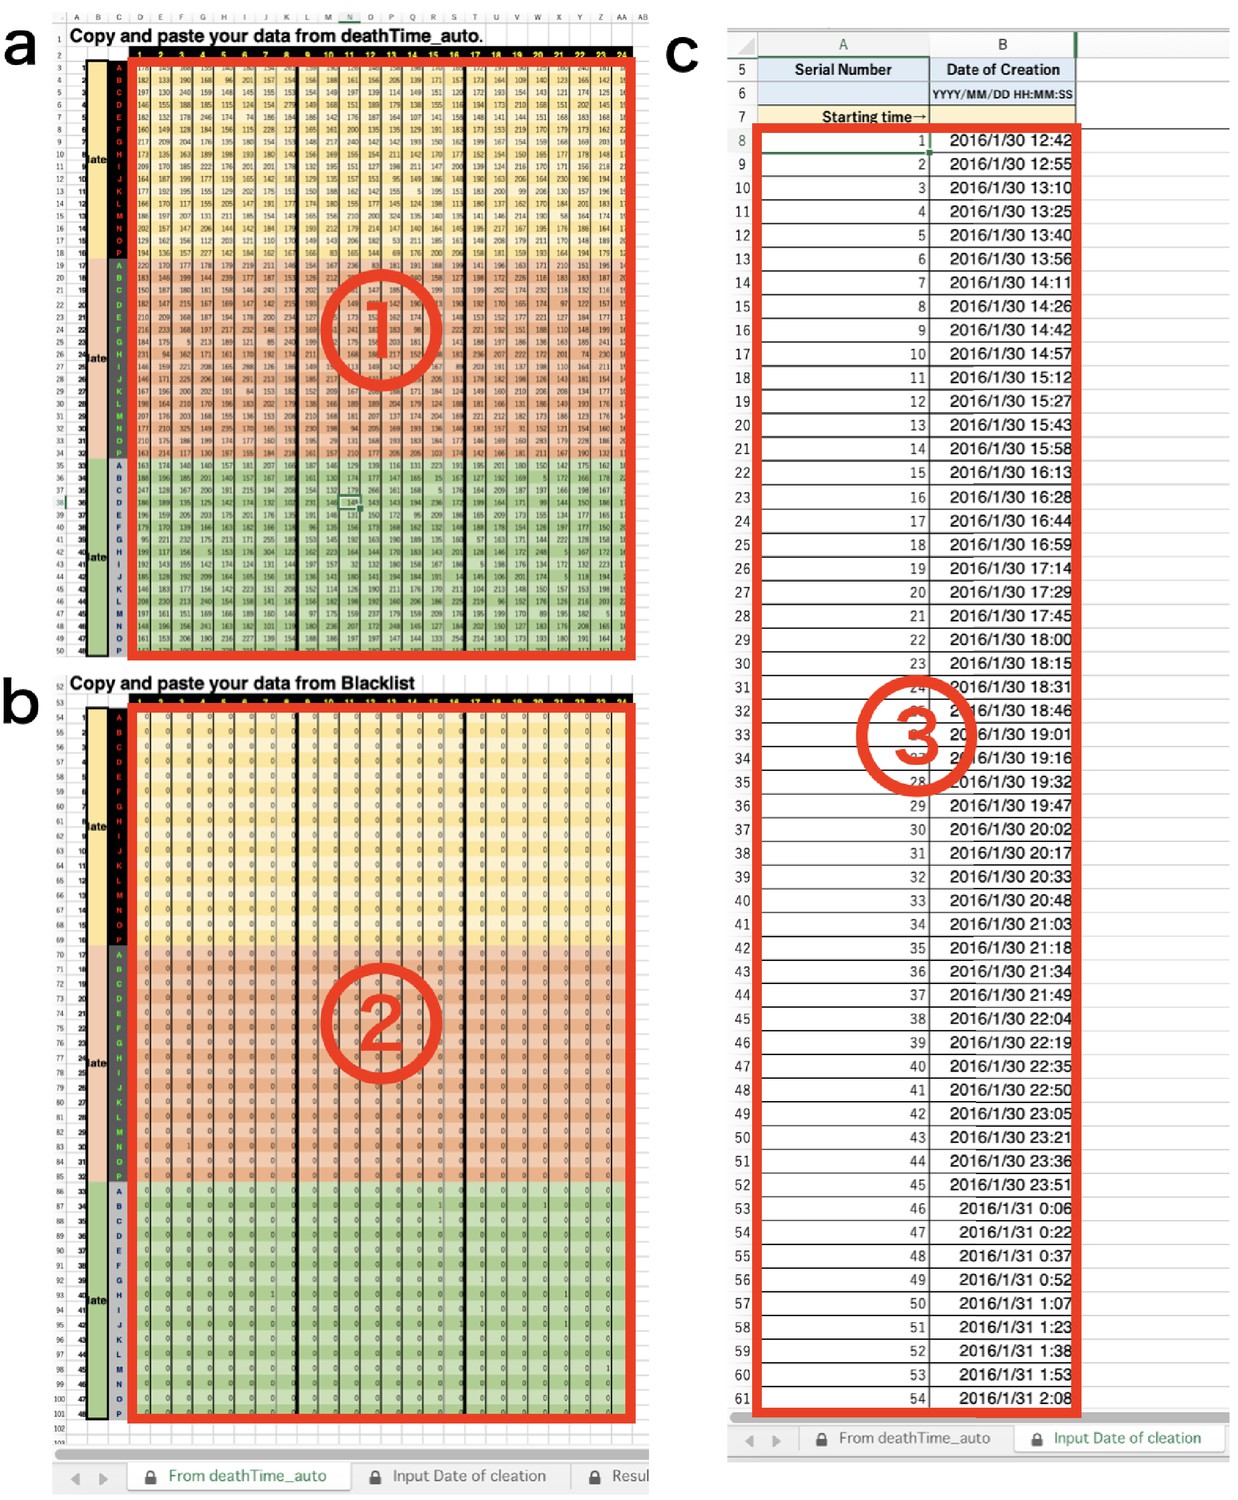
DIAMonDS analysis template: tabs for data input.
(a) Input data list calculated by Sapphire into ①. (b) Input ‘Blacklist’ downloaded from Sapphire into ②. (c) Input ‘Timestamp’ downloaded from Sapphire into ③.
Appendix 7—figure 3
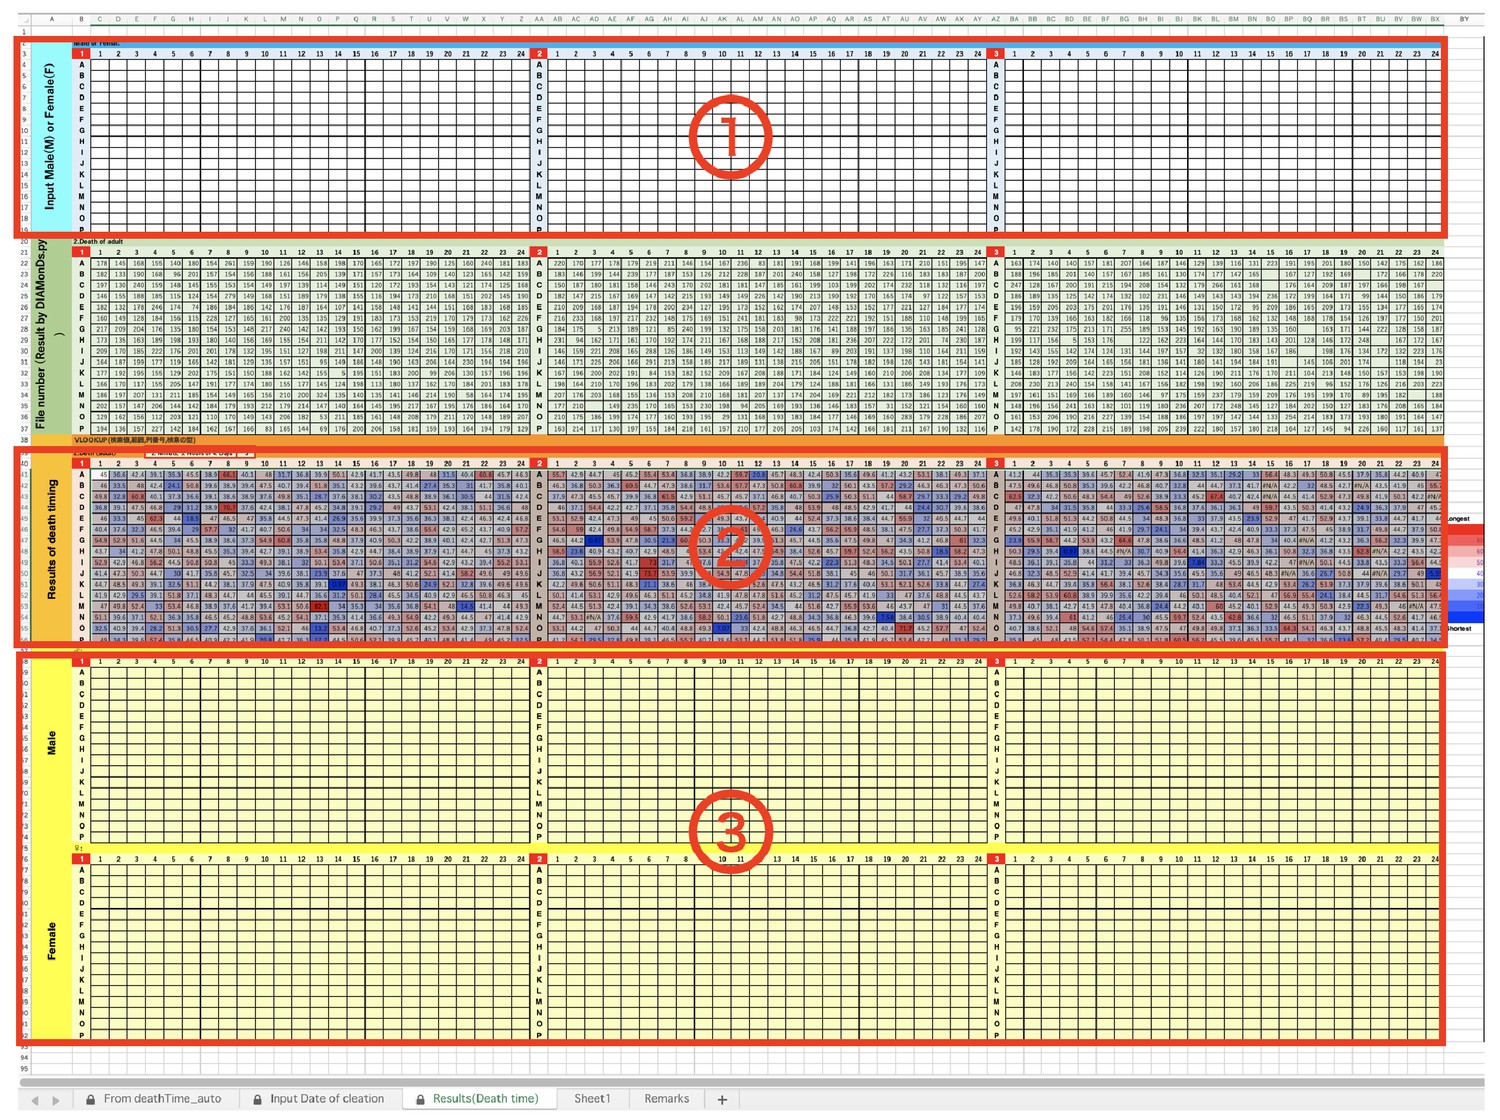
DIAMonDS analysis template: tabs for results.
(a) Input Sex (‘M’ or”F’) of each well into ①. (b) The Result is indicated in ②. (c) In ③, Results are separated two groups, male and female.
Appendix 8—figure 1
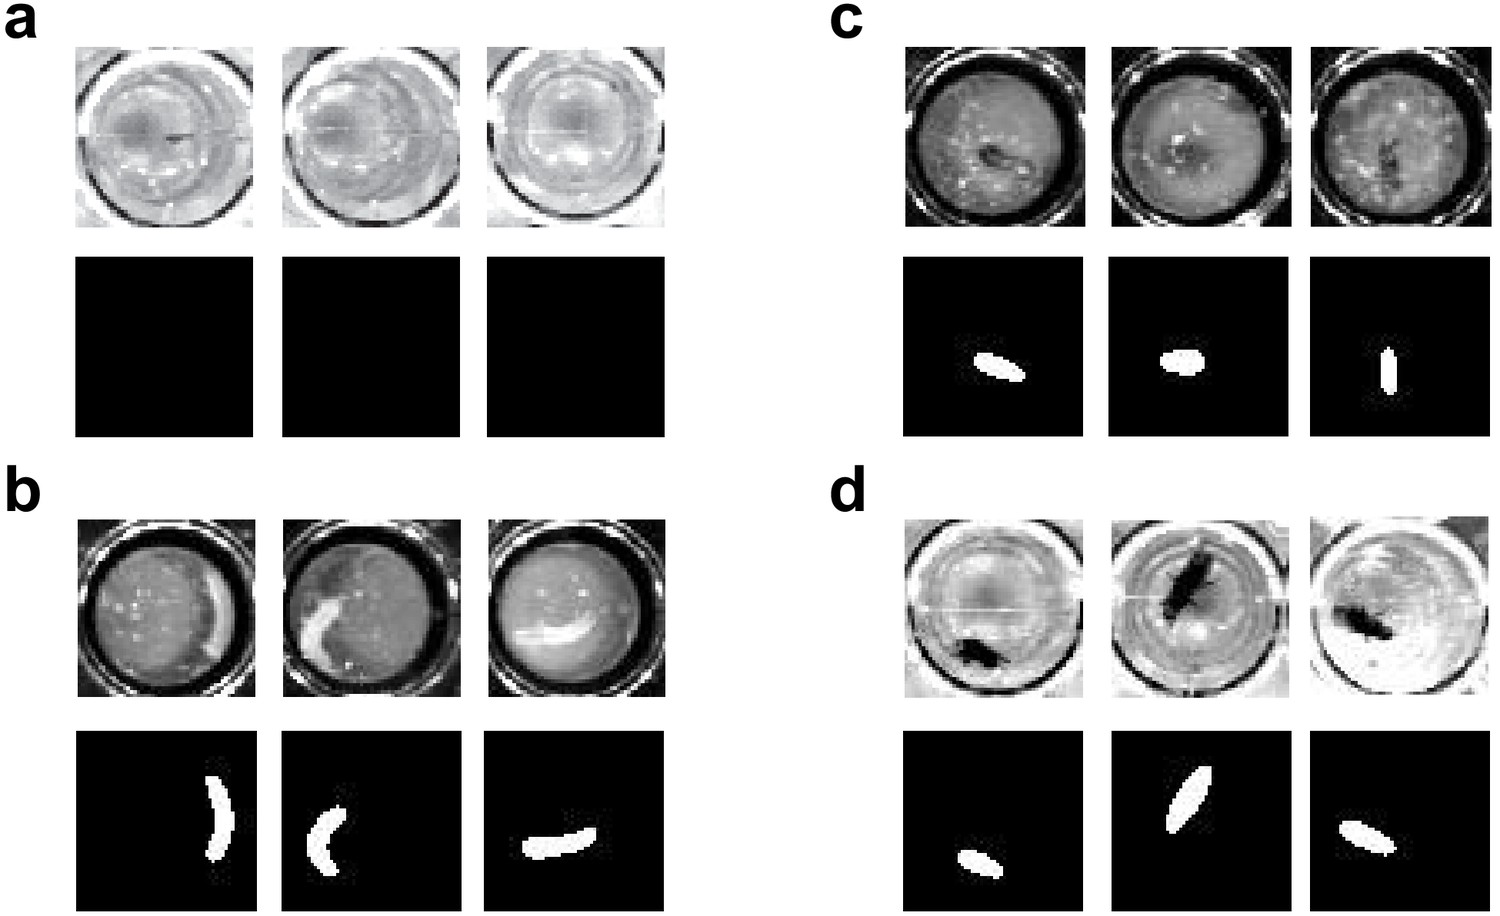
Example of segmentation for pupa (a), larva (b), adult in dataset 1 (c), and dataset 2 (d).
Note that the segmentation correctly captured the animal body in the images obtained by different imaging condition (c and d), and correctly ‘ignored’ pupa (a).
Appendix 8—figure 2
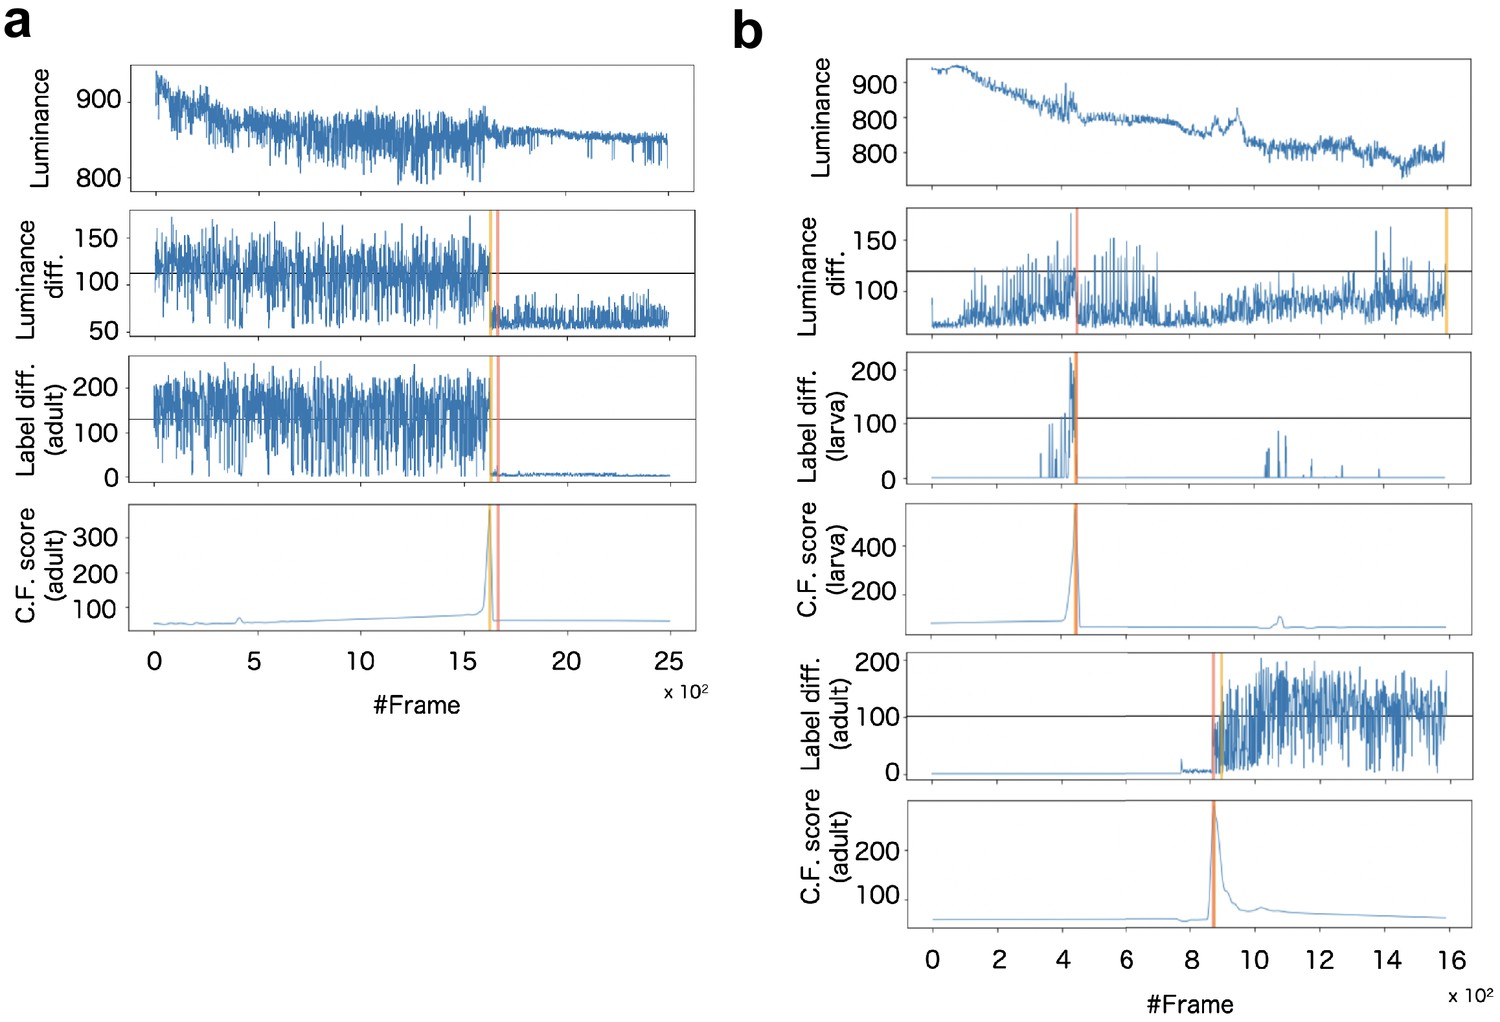
Example of signalization from image data and detection of death (a) and pupariation-eclosion (b).
In (a), each panel indicates signals obtained as (top) luminance at every time steps, (second panel) subtraction of luminance between consecutive raw images, (third panel) subtraction between consecutive labeled images obtained by larva segmentation, and (bottom) ChangeFinder signal calculated by Label diff. Black horizontal lines indicate thresholds for detection of event timing. Red vertical line indicates the manually-detected event timings (pupariation), and yellow vertical lines are automatically-detected event timings (see supplementary text). In (b), almost same organization with (a) except both signals of larva and adult are included for detection of pupariation and eclosion.
Appendix 8—figure 3
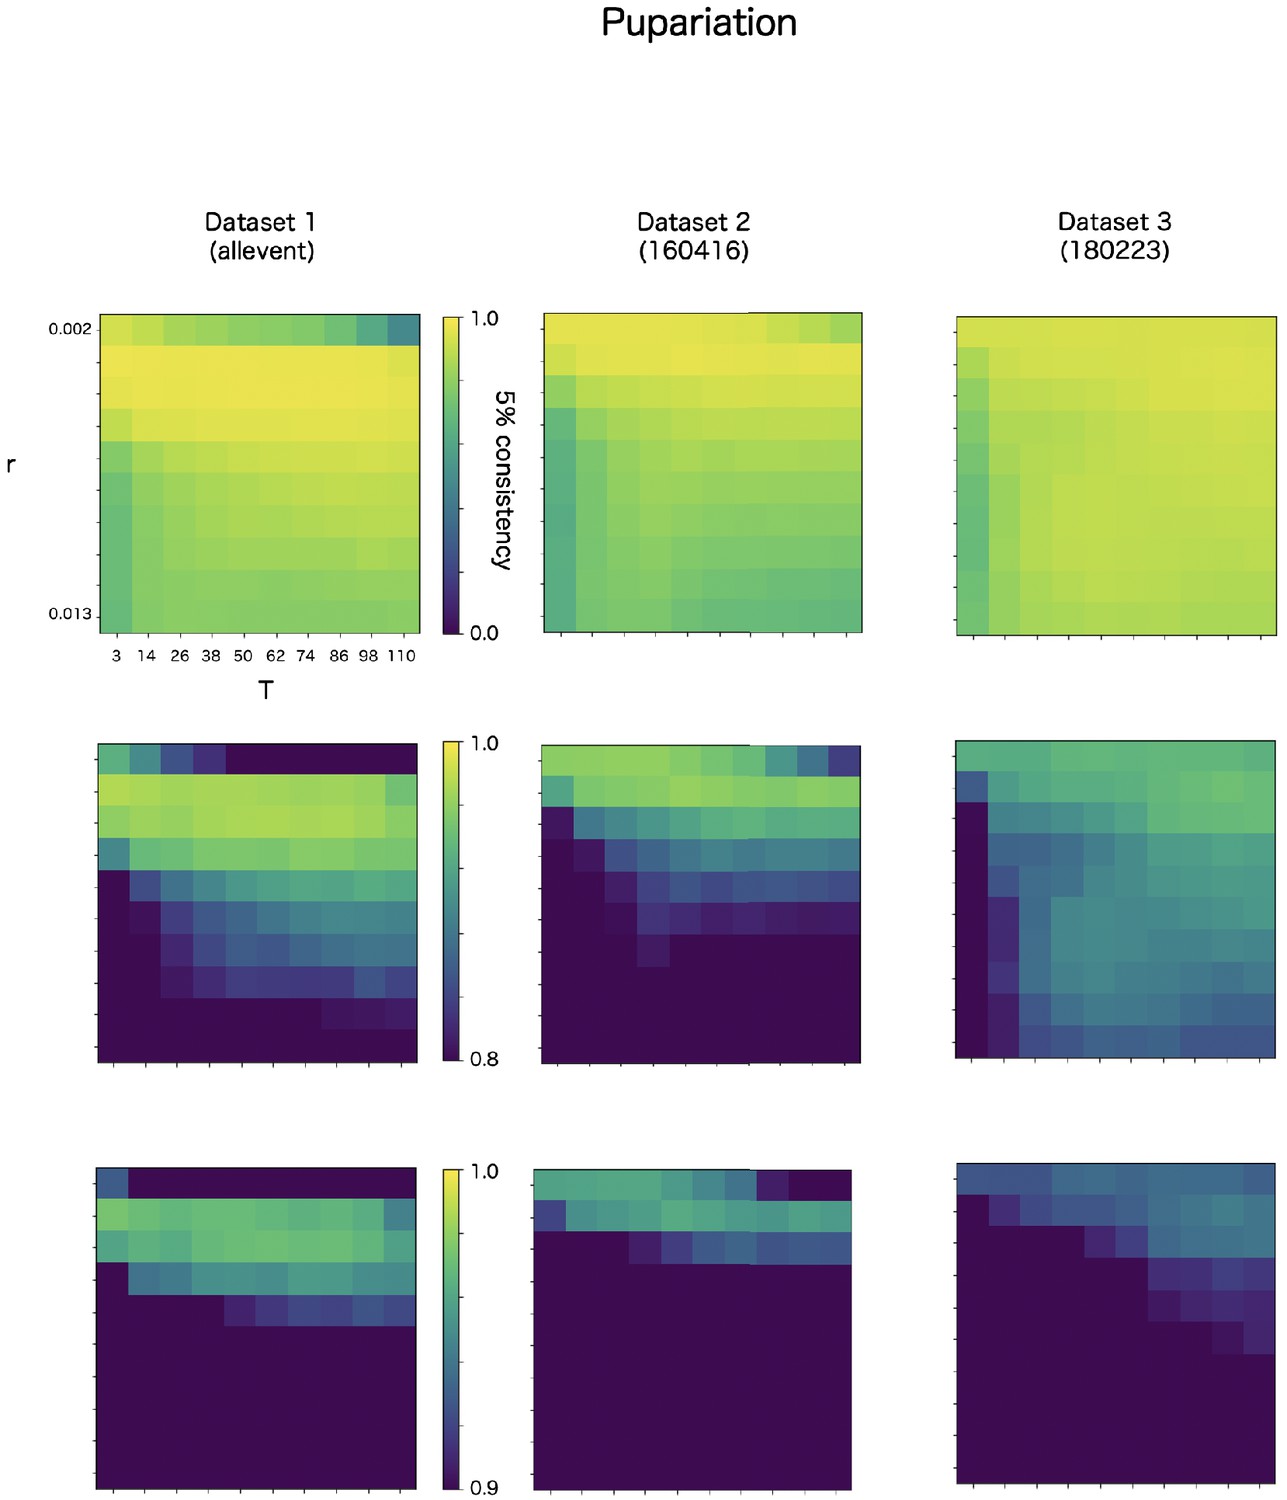
Robustness of automatic detection system for ChangeFinder parameters at pupariation detection.
Each panel shows 5% consistency as heatmap for T (x-axis) and r (y-axis) of ChangeFinder’s parameter. Panels are placed for different datasets (column) and color-scales (row).
Appendix 8—figure 4
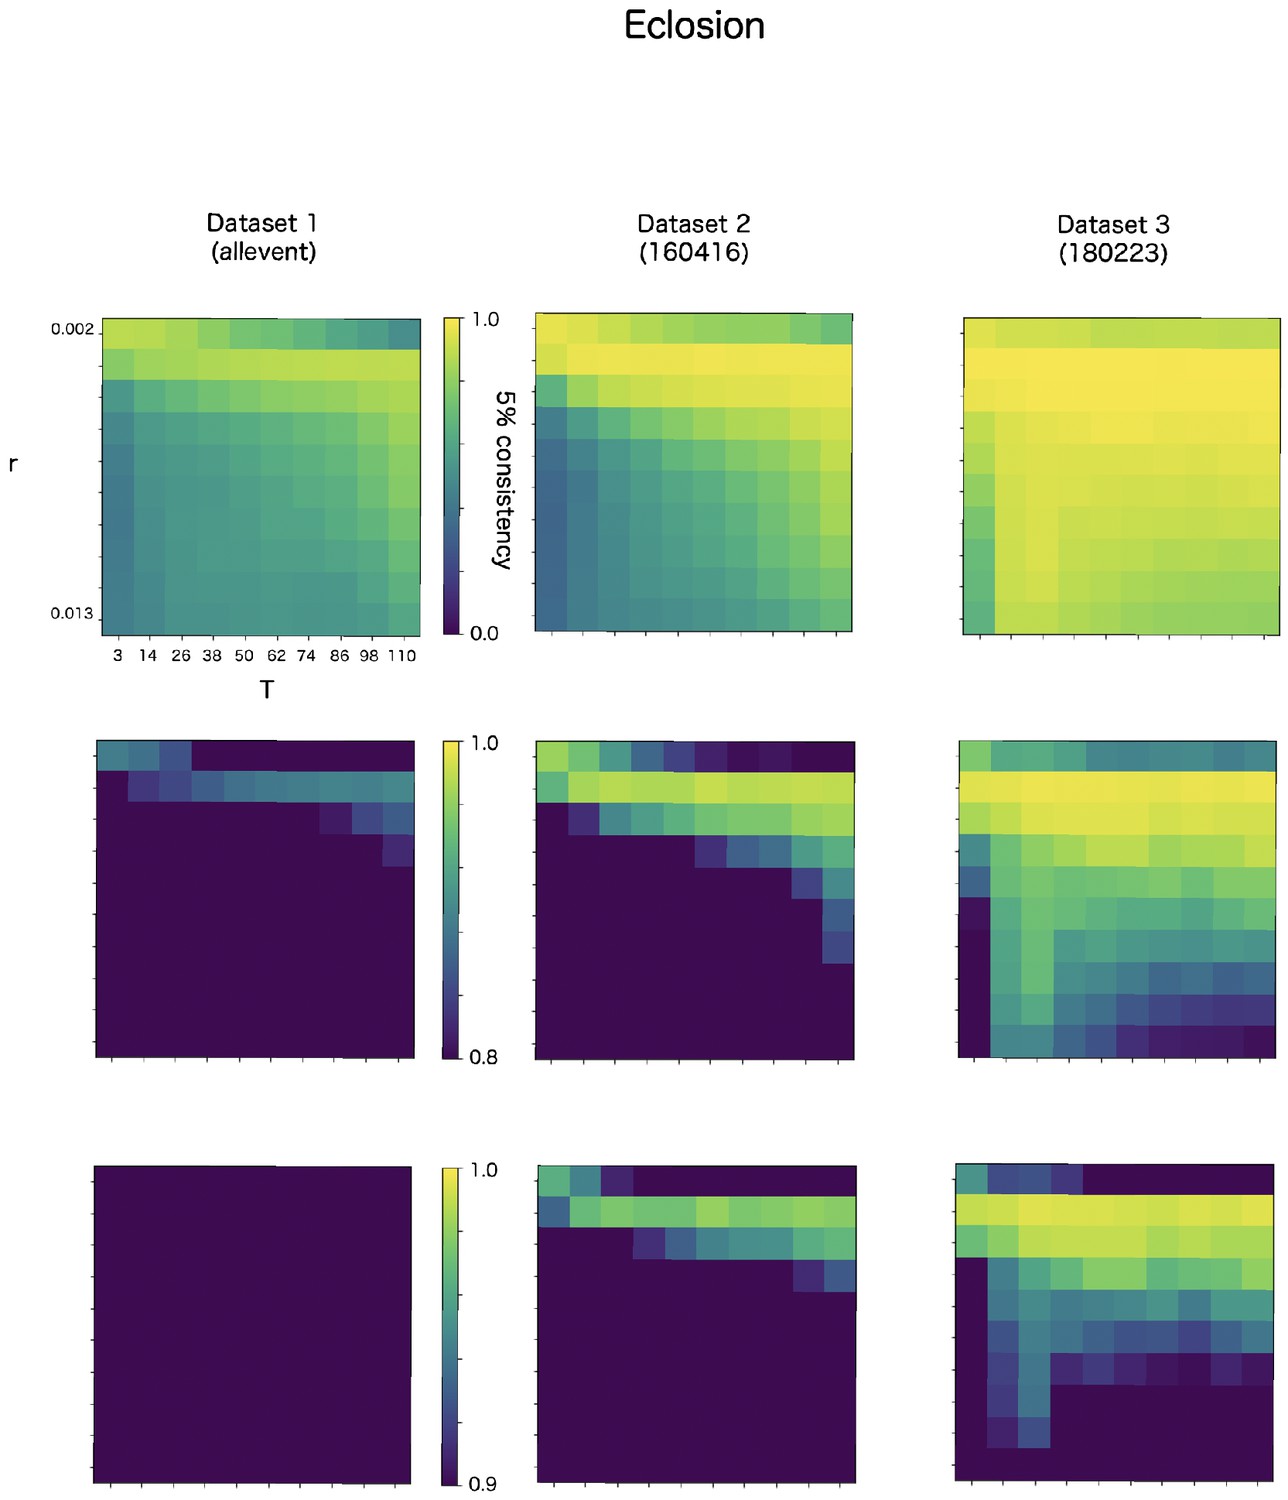
Robustness of automatic detection system for ChangeFinder parameters at eclosion detection.
Each panel shows 5% consistency as heatmap for T (x-axis) and r (y-axis) of ChangeFinder’s parameter. Panels are placed for different datasets (column) and color-scales (row).
Appendix 8—figure 5
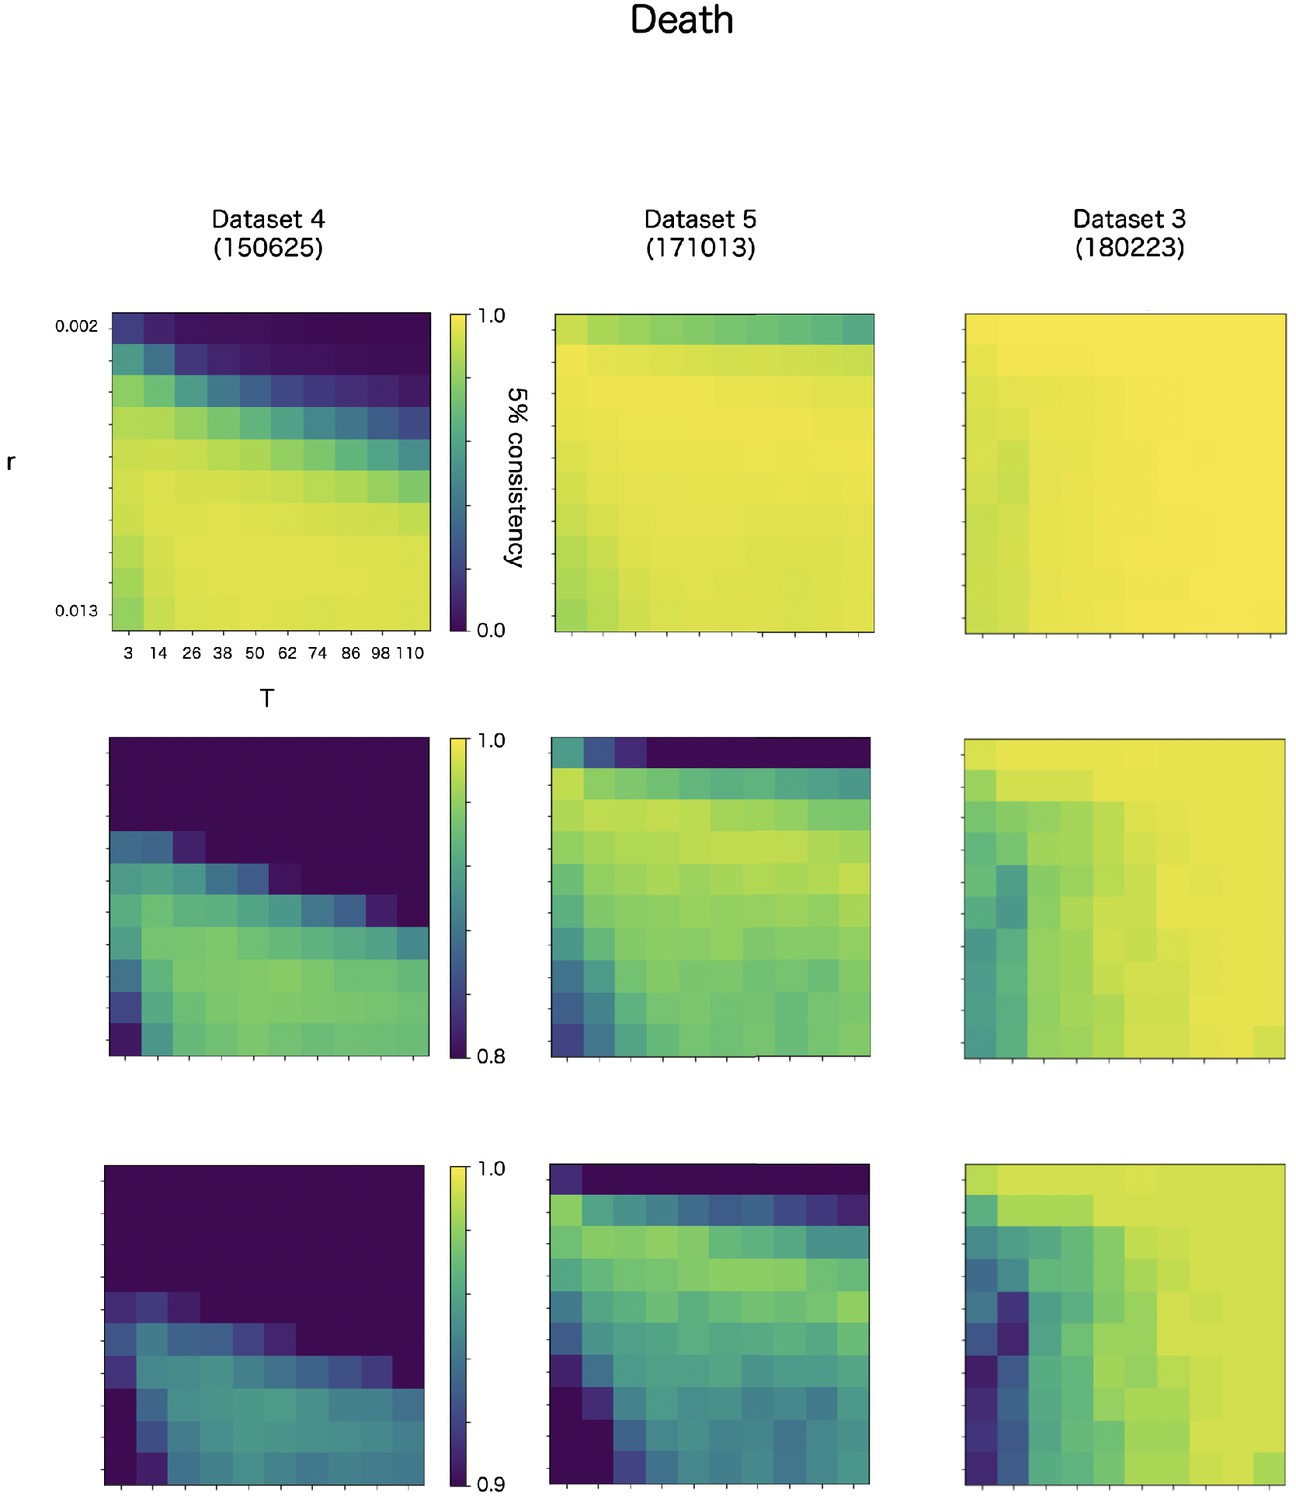
Robustness of automatic detection system for ChangeFinder parameters at death detection.
Each panel shows 5% consistency as heatmap for T (x-axis) and r (y-axis) of ChangeFinder’s parameter. Panels are placed for different datasets (column) and color-scales (row). Most right column (dataset 3, 180223) is same dataset in the Appendix 8—figures 3 and 4.
Author response image 1
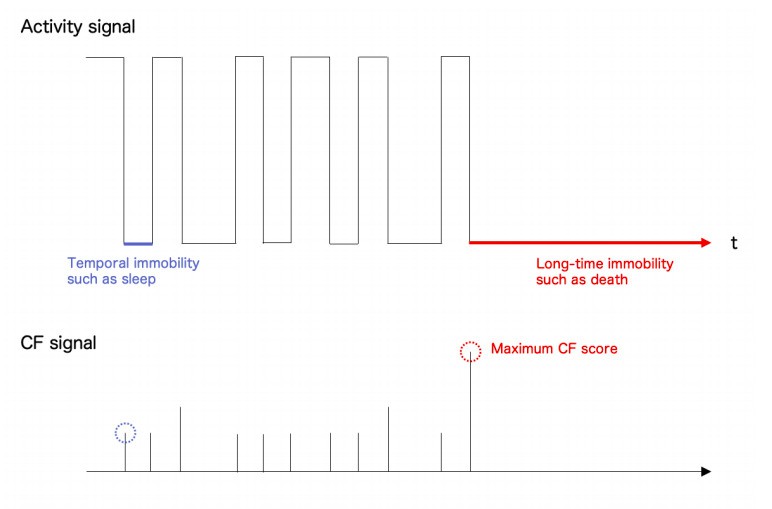
Conceptual figure of activity signal (upper panel) and ChangeFinder (CF) signal (lower panel).
Temporal cessation of Drosophila behaviour like a sleep showed relatively low CF score than the long-time cessation such as death. So, the present system could correctly capture the event as a maximum point of CF score. NB. All the signals were idealized for understanding.
Author response image 2
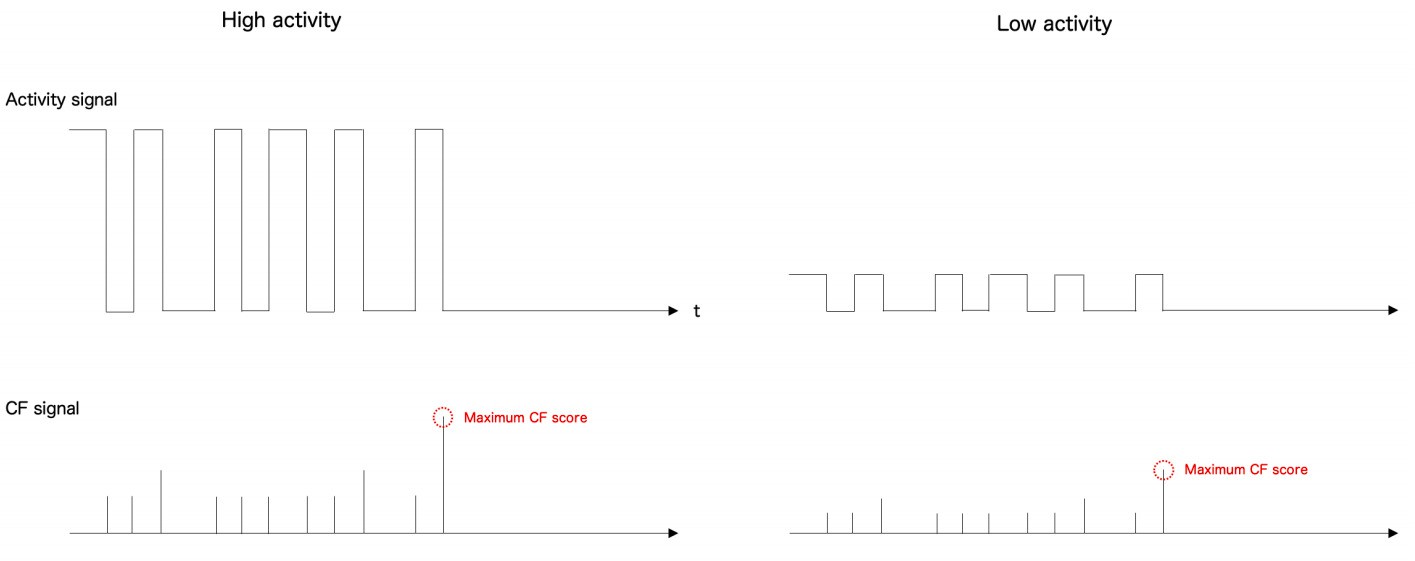
Conceptual figure of high and low activity.
Upper panels indicates activity signal and lower plans are CF values. In low activity animal, both signal shows relatively low intensity, however, the maximum point still indicates continuous cessation which corresponds to death. NB. All the signals were idealised for understanding.
Videos
Video 1
The estimated activity history of a single fly by Sapphire.
Appendix 8—video 1
Example of sequential detection of pupariation and eclosion by Sapphire.
Tables
Key resources table
| Reagent type (species) or resource | Designation | Source or reference | Identifiers | Additional information |
|---|---|---|---|---|
| Gene (D. melanogaster ) | mth1 | Flybase | FBti0012557 | |
| Strain, strain background (D. melanogaster ) | w1118 | Kept in lab stock | ||
| Strain, strain background (D. melanogaster ) | Oregon-R | Kept in lab stock | ||
| Strain, strain background (D. melanogaster ) | Canton-S | Gift from Dr. Uemura | ||
| Genetic reagent (D. melanogaster ) | R29H01-GAL4 | Flybase | FBti0191124 | |
| Genetic reagent (D. melanogaster ) | UAS-TeTxLC | Flybase | FBtp0001264 | |
| Software, algorithm | Sapphire | https://github.com/kanglab/Sapphire/tree/master | ||
| Software, algorithm | VueScan | https://www.hamrick.com | ||
| Software, algorithm | Prism 8 | https://www.graphpad.com/scientific-software/prism/ |
Appendix 8—table 1
Data augmentation for training of FCN designed for animal body segmentation.
Note that the system was trained by only two datasets.
| Training data | Training data 2 | ||
|---|---|---|---|
| Target event | Death | Pupariation/Eclosion | |
| Target animal in segmentation | Adult | Adult | Larva |
| No. of annotation data | 178 adults | 300 adults | No adult |
| 5760 larva (distractor) | 1839 larva | ||
| No. of augmented data | 71,200 adult | 60,000 adults | 183,900 larva |
| 57,600 larva (distractor) | |||
Appendix 8—table 2
Summary of consistency between automatic and manual detections of pupariation (a), eclosion (b), and death (c).
The consistency was evaluated as the ratio of individuals whose detected frame differences between the algorithm and human expert were less than 5% for entire frame. Columns indicates different dataset and rows corresponds different detection method for comparison. Consistencies were described as the ratio and the number. The cells with >= 90% consistency were labeled by two asterisks, and one asterisk corresponds the cells equal or greater than 80%, and less than 90%. Note that the total numbers of animal were different depending on dataset because of the elimination of some individuals that could not had the events.
| Pupariation | |||
|---|---|---|---|
| Dataset 1 (allevent) | Dataset 2 (160416) | Dataset 3 (180223) | |
| Luminance diff. thre (auto) | 36.6% (102/279) | 0.0% (0/255) | 37.4% (92/246) |
| Luminance diff. thre (manual) | 78.5% (219/279) | 39.6% (101/255) | 39.0% (96/246) |
| Segmentation diff. thre (auto) | 96.4%** (269/279) | 82.4%* (210/255) | 94.7%** (233/246) |
| Segmentation diff. thre (manual) | 96.8%** (270/279) | 91.8%** (234/255) | 96.3%** (237/246) |
| Maximum point of CF signal | 97.5%** (271/279) | 96.1%** (245/255) | 92.3%** (227/246) |
| Eclosion | |||
| Dataset 1 (allevent) | Dataset 2 (160416) | Dataset 3 (180223) | |
| Luminance diff. thre (auto) | 14.6% (34/233) | 0.0% (0/241) | 98.8%** (161/163) |
| Luminance diff. thre (manual) | 60.1% (140/233) | 2.9% (7/241) | 98.8%** (161/163) |
| Segmentation diff. thre (auto) | 82.0%* (191/233) | 95.9%** (231/241) | 99.4%** (162/163) |
| Segmentation diff. thre (manual) | 85.4%** (199/233) | 97.1%** (234/241) | 99.4%** (162/163) |
| Maximum point of CF signal | 86.3%* (201/233) | 97.5%** (235/241) | 99.4%** (162/163) |
| Death | |||
| Dataset 1 (150625) | Dataset 2 (171013) | Dataset 3 (180223) | |
| Luminance diff. thre (auto) | 62.0% (237/382) | 97.9%** (281/287) | 10.3% (14/136) |
| Luminance diff. thre (manual) | 94.0%** (359/382) | 97.9%** (281/287) | 10.3% (14/136) |
| Segmentation diff. thre (auto) | 76.4% (292/382) | 97.2%** (279/287) | 99.3%** (135/136) |
| Segmentation diff. thre (manual) | 93.5%** (357/382) | 97.6%** (280/287) | 100.0%** (136/136) |
| Maximum point of CF signal | 94.8%** (362/382) | 93.4%** (268/287) | 98.5%** (134/136) |
Additional files
-
Supplementary file 1
DIAMonDS analysis templates.
- https://cdn.elifesciences.org/articles/58630/elife-58630-supp1-v2.zip
-
Transparent reporting form
- https://cdn.elifesciences.org/articles/58630/elife-58630-transrepform-v2.docx
Download links
A two-part list of links to download the article, or parts of the article, in various formats.
Downloads (link to download the article as PDF)
Open citations (links to open the citations from this article in various online reference manager services)
Cite this article (links to download the citations from this article in formats compatible with various reference manager tools)
The Drosophila Individual Activity Monitoring and Detection System (DIAMonDS)
eLife 9:e58630.
https://doi.org/10.7554/eLife.58630


