Equity, Diversity and Inclusion: Alternative strategies for closing the award gap between white and minority ethnic students
- MRC Laboratory for Molecular Cell Biology, UCL, United Kingdom
- Department Cell and Developmental Biology, UCL, United Kingdom
Figures
Figure 1
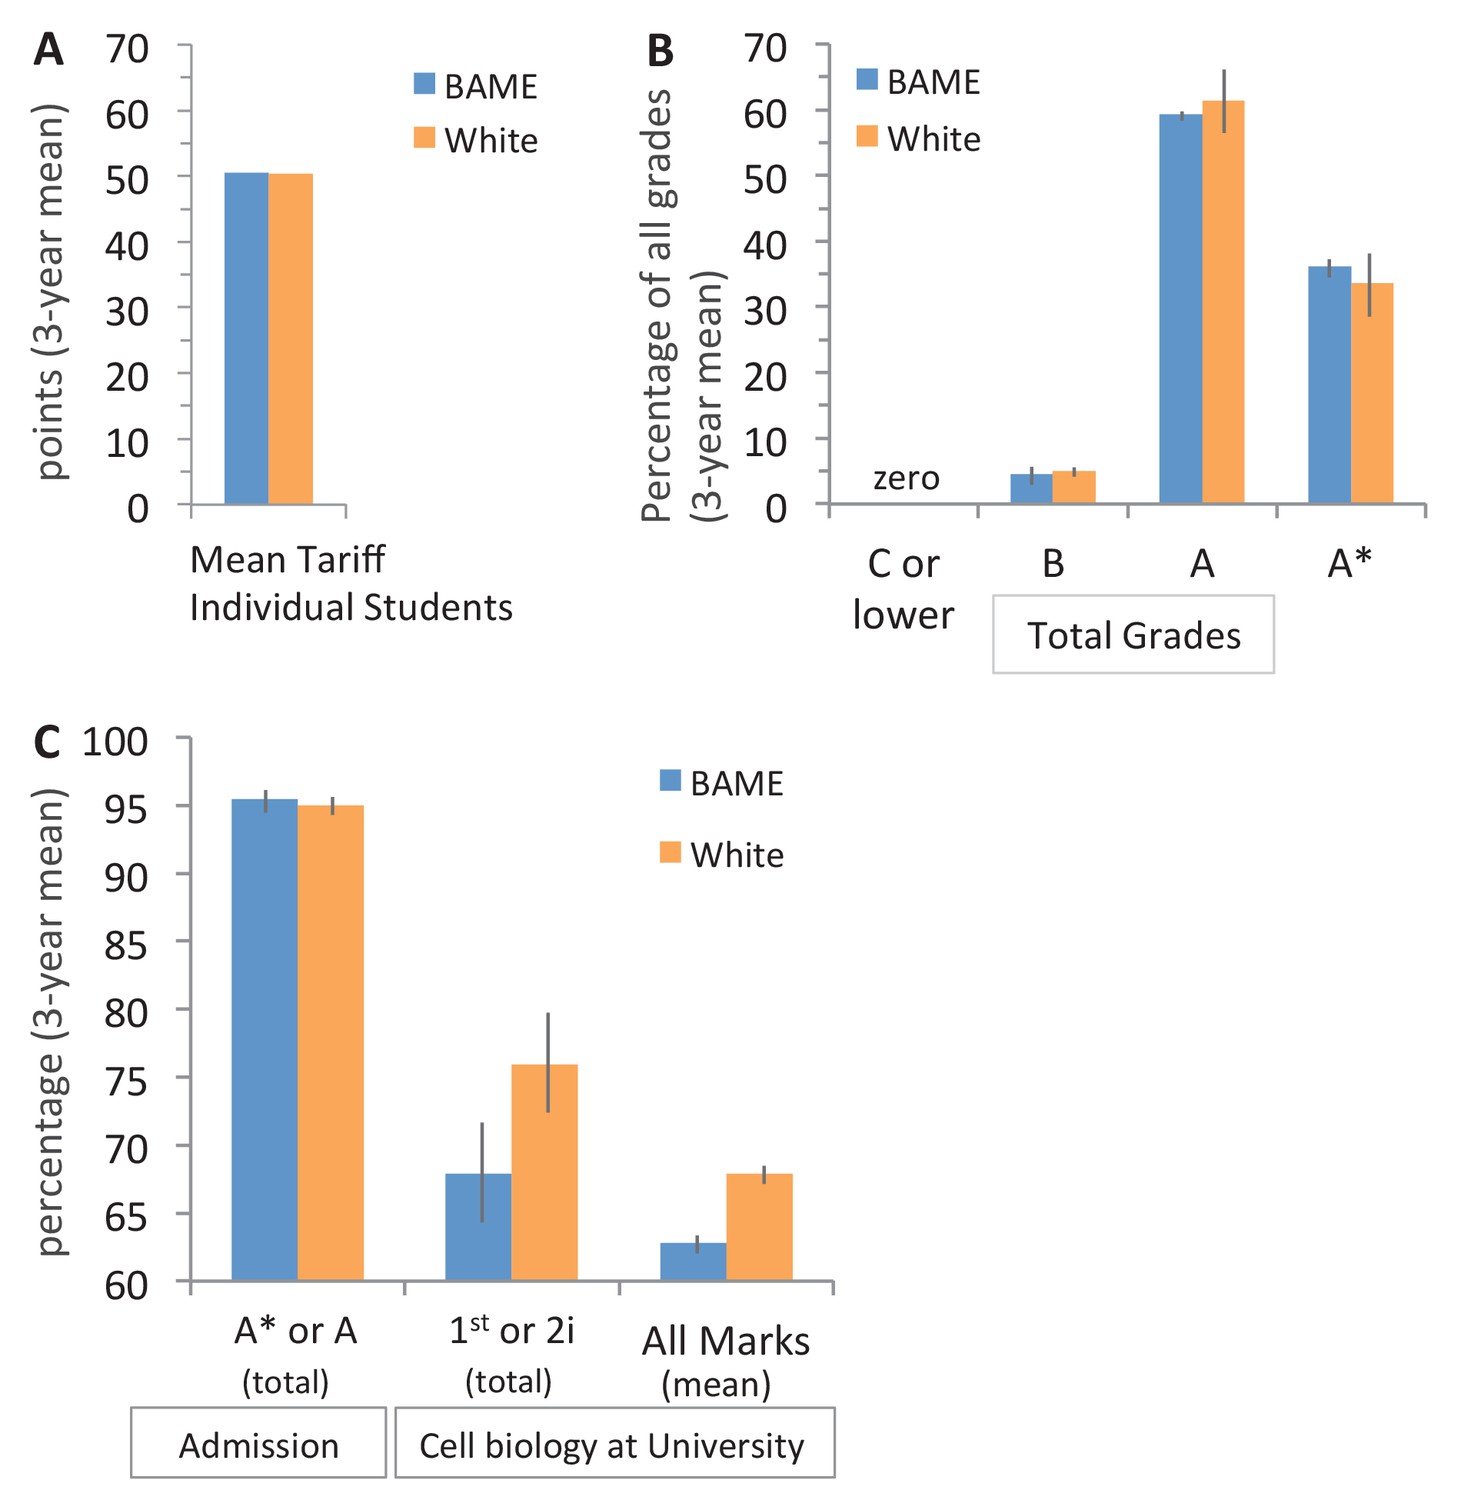
Entrance qualifications are near identical for BAME and white students in this study.
(A) Top three A-level grades awarded to the first three cohorts in year 1–2 pathway that entered UCL between 2013–2015: grades were converted to the UK standard points tariff (see Entrance qualifications for cell biology students in this study), the average for each student was calculated, and the mean of all three cohorts was determined (SEM: ±0.15 for BAME and ±0.33 for white students, which are too small to see on the graph). N = 179 students (82 BAME, 97 white); 536 entrance grades (246 BAME, 290 white). (B) Percentage of grades awarded to students in (A) that were C or lower, B, A, or A*: 3 year mean (± SEM). (C) The percentage of top admission (A* and A) grades awarded to BAME and white students in (A), the percentage of students that received the top two grade bands (first or 2i) in year 2 of cell biology in 2014–2016 (same students shown in (A)), and their average mark in year 2 of cell biology: each column: (3 year mean ± SEM).
-
Figure 1—source data 1
Source data on the entrance qualifications of white and BAME cell biology students entering UCL in 2013–2015 and their subsequent grades for year 2 cell biology.
- https://cdn.elifesciences.org/articles/58971/elife-58971-fig1-data1-v1.xlsx
Figure 2
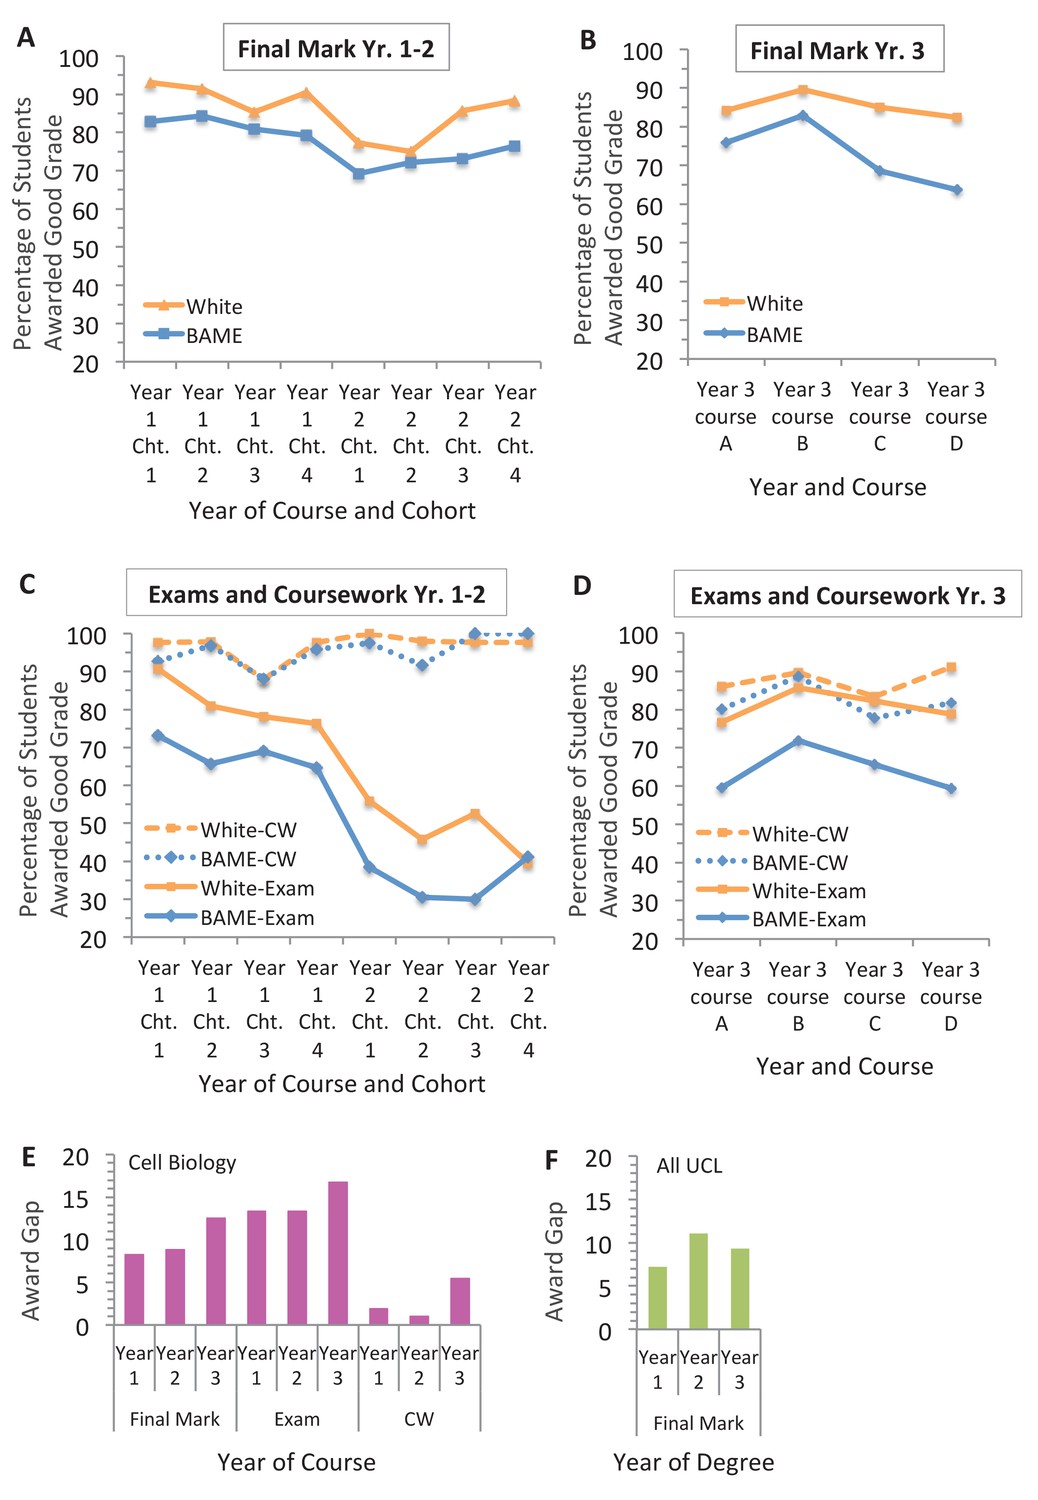
The exam is the main contributor to the award gap in cell biology.
Percentage of BAME and white students in each cohort (shown in Table 1) that were awarded good grades in cell biology for the final course mark in the (A) year 1–2 pathway and (B) year 3 study; and the exam and coursework components in the (C) year 1–2 pathway and in the (D) year 3 study. (E) Difference in the percentage of white and BAME students awarded a good mark (first or 2i) for each year of the cell biology course (data shown in A-D) based on the mean of all four cohorts or courses (means and SEMs are reported in Figure 2—source data 1). (F) Difference in mean proportion of good grades awarded to all white and BAME students at UCL in 2016, 2017 and 2018 for each year of study (years 1, 2 and 3). Total number of students that completed the course = 792; in the year 1–2 pathway = 344 (167 BAME, 177 white); in the year 3 study = 448 (205 BAME, 243 white). 22 students were excluded (12 due to unknown ethnicity; 10 did not complete the course).
-
Figure 2—source data 1
Source data for the final course, exam and coursework marks of white and BAME students in the year 1–2 pathway and year three study; and the grades for all UCL undergraduates that took year 1, 2 and 3 in either 2016, 2017 or 2018.
- https://cdn.elifesciences.org/articles/58971/elife-58971-fig2-data1-v1.xlsx
Figure 3 with 1 supplement
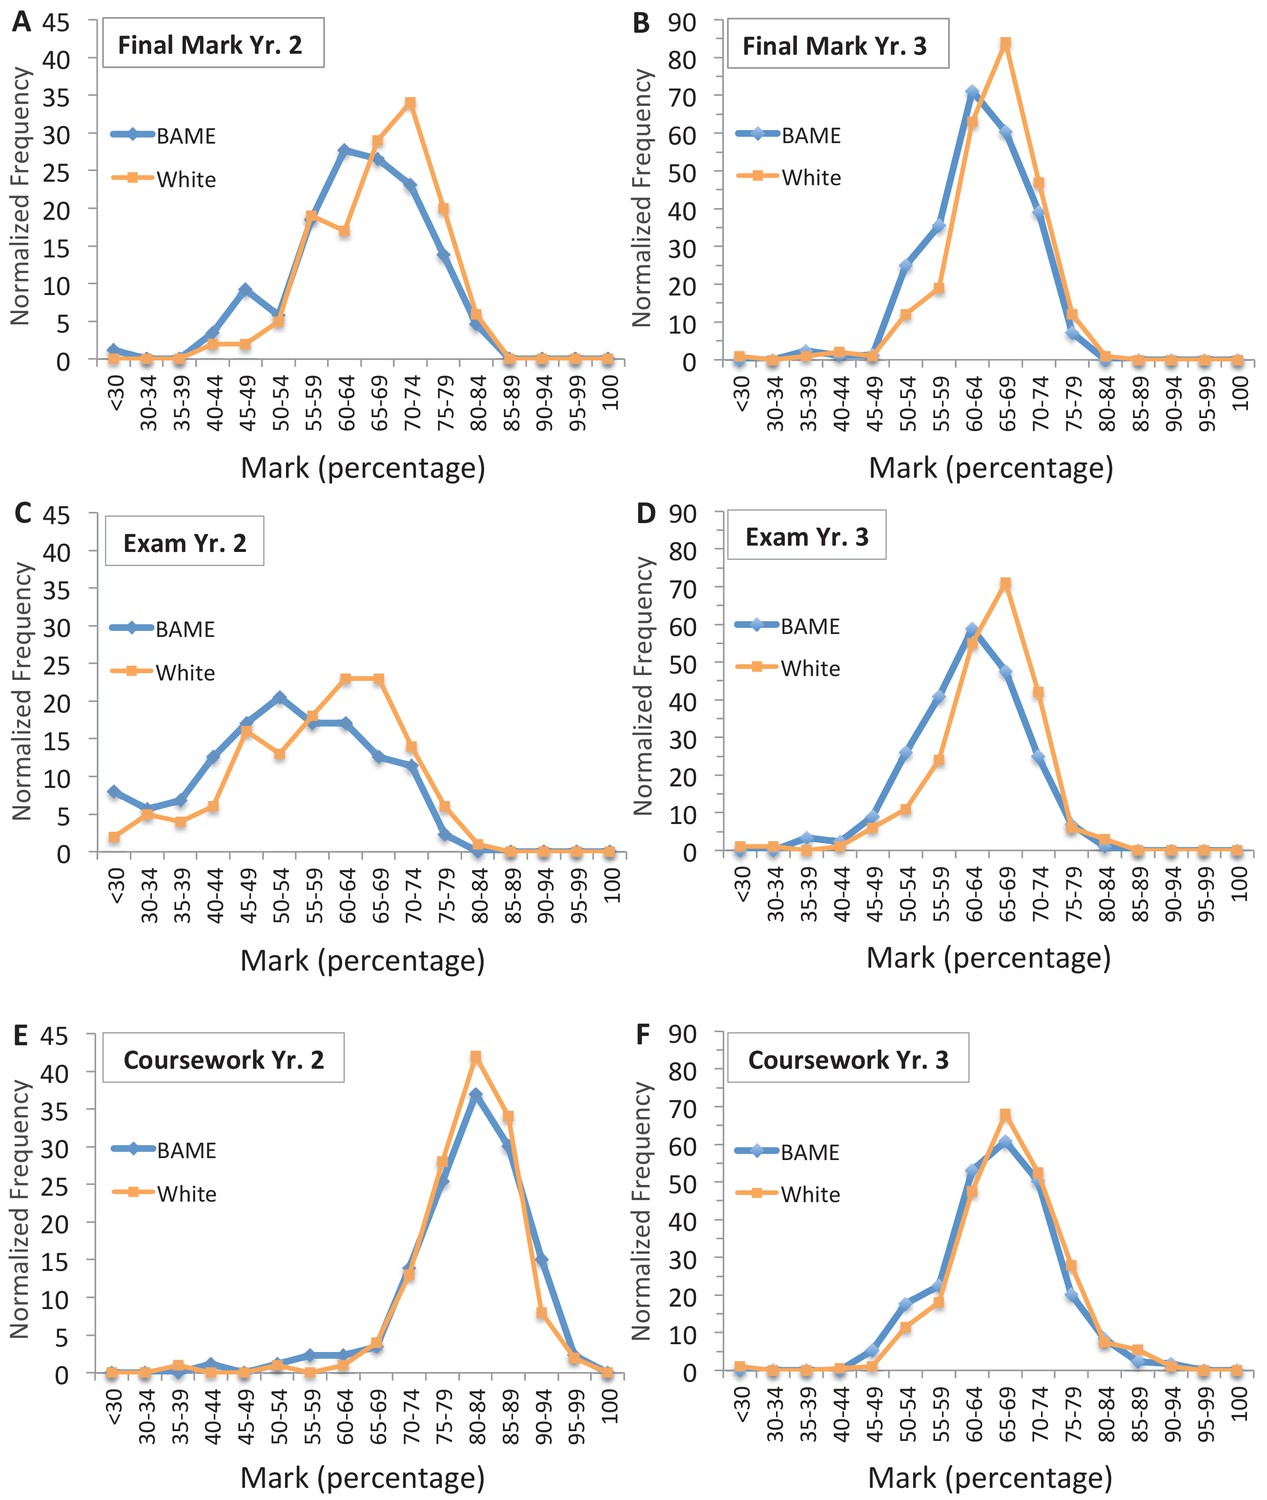
Comparison of all marks does not reveal any larger award gap in the coursework.
Comparisons of all marks awarded to individual BAME and white students in year 2 (A, C, E) and year 3 (B, D, F) cell biology for all courses in year 3 study and three cohorts (cohorts 1-3) in year 2; cohort 4 in year two was excluded since there was no exam award gap in good marks, as reported (Figure 2C; and main text) and also none in first class marks-only. For each component, frequency of marks for each interval was aggregated across cohorts. To enable fair comparison BAME, student frequencies were then normalised to the total number of white students in that component (normalisation factors are shown in Figure 3—figure supplement 1—source data 1). Total number of students that completed the course = 698; in year 2 = 250 max (116 BAME, 134 white); in year 3 = 448 max (205 BAME, 243 white). Exact cohorts and N for each component in (A–F) is shown in Figure 3—figure supplement 1—source data 1.
Figure 3—figure supplement 1
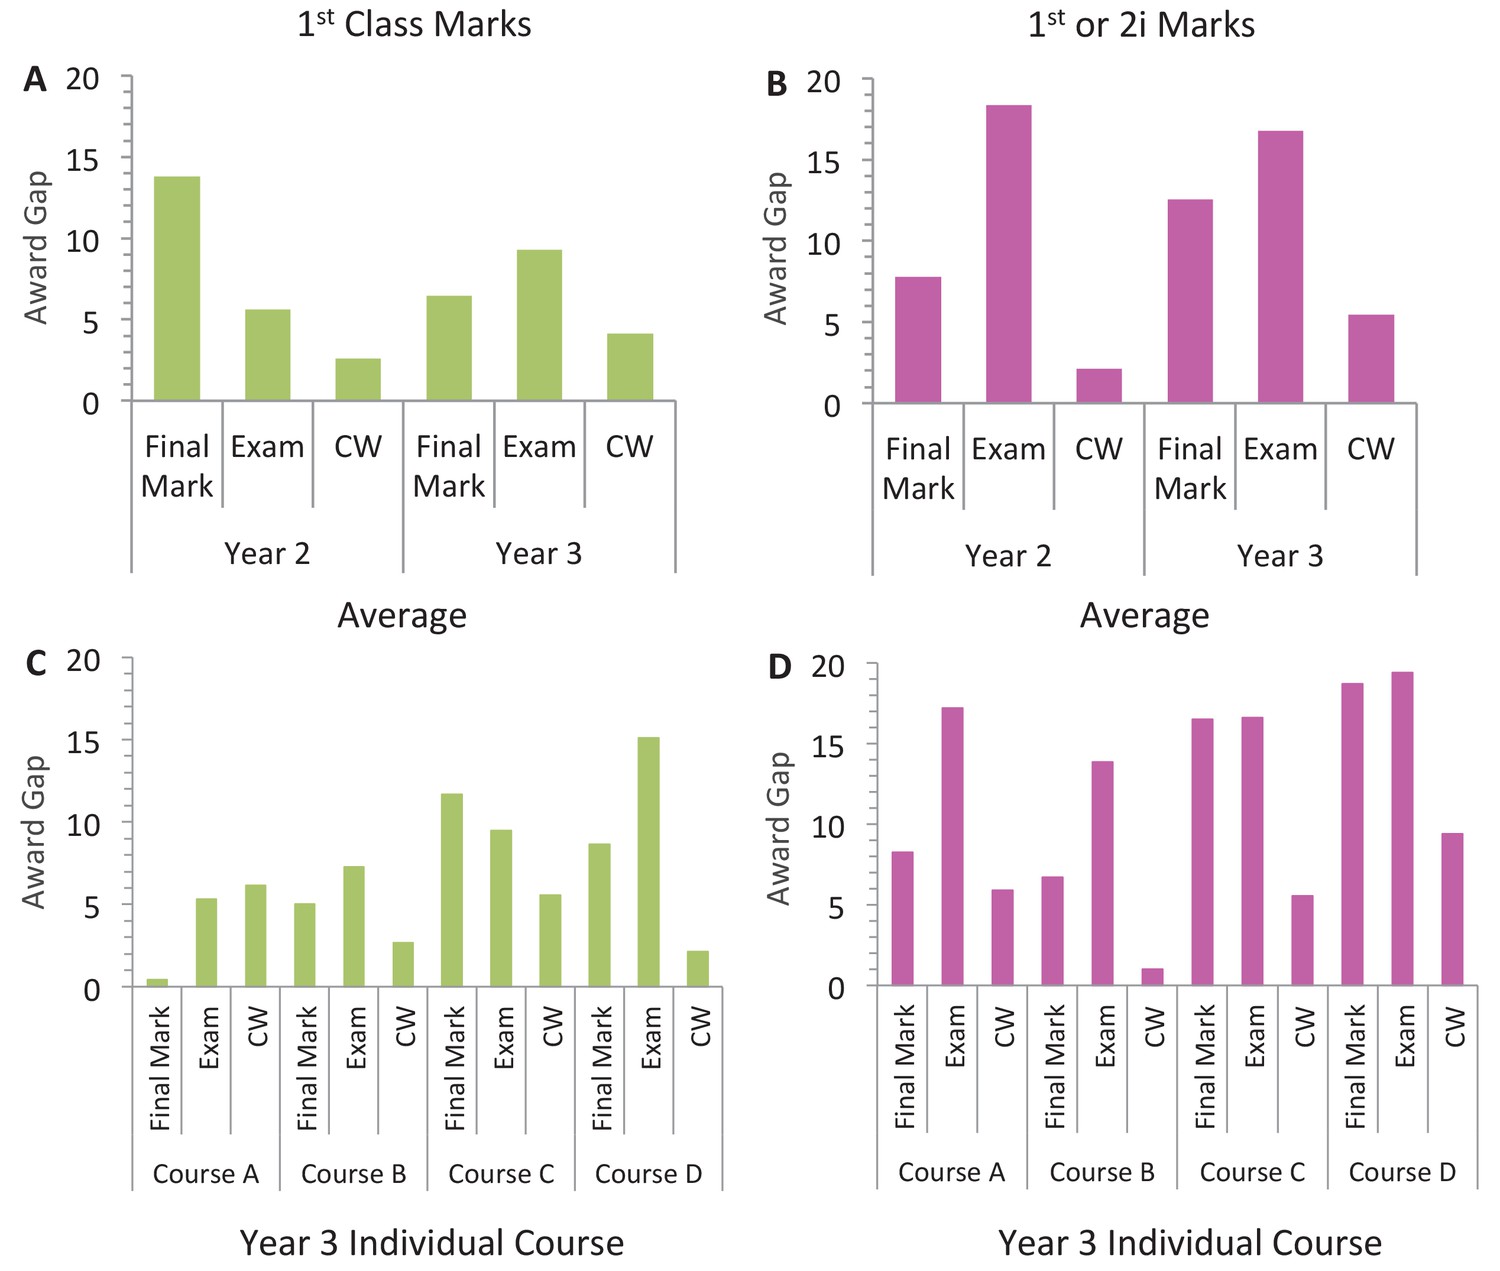
The award gap for first class marks is similar to the difference in good marks awarded for coursework in cell biology.
Comparison of the award gaps in the exam, coursework, and final mark, for first class marks only (A, C) and all good marks (B, D) for the year 2 and year 3 average (A, B) and individual (C, D) cell biology courses and cohorts in year 3 (also listed in Figure 3—figure supplement 1—source data 1). As noted, cohort 4 of year 2 was excluded from Figure 3; therefore, for fair comparison, the award gap data shown here for year 2 only includes cohorts 1, 2 and 3 for all good marks and first class marks only. Award gaps in all four year 2 cohorts (cohort 1, 2, 3 and 4) were similar except the exam gap in all good grades is larger (~18%) for the 3-cohort mean (B) than the 4-cohort mean (Figure 2E, year two exam,~13%) as expected, and this also follows through to first class grades (see full evaluation in Figure 3—figure supplement 1—source data 1). All award gaps represent the mean of individual cohorts or courses except those in year 2 at the level of first class marks (see Methods for more details); the exam gap was instead based on the aggregated data of cohorts 1–3 and, for a fair comparison, this method was also used to calculate the award gap in first class marks for the other two components (final mark and coursework). See Figure 3—figure supplement 1—source data 1 for mean values +/- SEM or averages as indicated.
-
Figure 3—figure supplement 1—source data 1
Source data for the values used to calculate the final mark, exam and coursework award gap between white and BAME students in years 2 and 3.
- https://cdn.elifesciences.org/articles/58971/elife-58971-fig3-figsupp1-data1-v1.xlsx
Figure 4
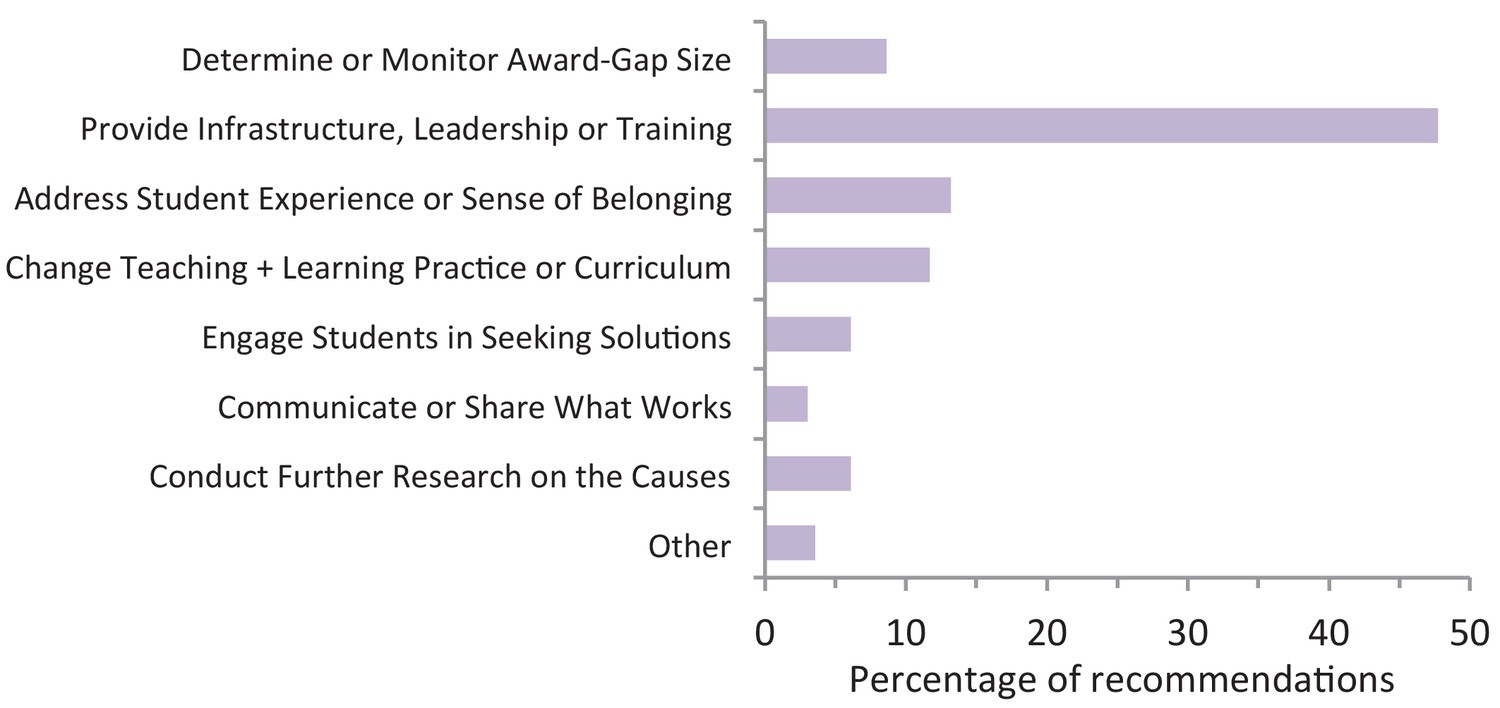
Summary of previous recommendations on how to close the award gap between white and BAME undergraduate students.
Recommendations are from three major UK original research reports: ECU and HEA, 2008; Berry and Loke, 2011; Amos and Doku, 2019. Reports were selected based on the depth and breadth of the data, the number of participating higher education institutions (HEIs) and representation across the past decade. The recommendations from each report were then assigned to seven different categories based on the language used to describe them. For example, characteristics of ‘HEI culture’, ‘student experience’ and 'racism' were grouped together, and ‘change curriculum’ encompasses recommendations with terms such as diversify, decolonise, internationalise, and make more inclusive. N = 197 recommendations; 168 participating HEIs total: 99 HEIs partnered with the UK National Union of Students and Universities UK; and 69 HEIs worked with the Equality Challenge Unit and the Higher Education Academy (now AdvanceHE).
-
Figure 4—source data 1
Source data for the values used to calculate the percentages of the different recommendation categories.
- https://cdn.elifesciences.org/articles/58971/elife-58971-fig4-data1-v1.xlsx
Tables
Table 1
Cell biology cohorts studied in this report.
(A) The year 1–2 pathway includes four cohorts that entered UCL between 2013–2016 and took a year 1 and year 2 course in cell biology. *>99% of students stayed with their cohort as it progressed in the pathway. Results for the other ~1% were allocated to the year they took the course. (B) The year 3 study includes students that entered UCL between 2012–2016 and took one of four courses. For each course, the marks of students from all five years groups are aggregated together. All academic years start in October and end June the following year. Final year is based on three year bachelor’s or four year master’s undergraduate degree.
| A | |||||
|---|---|---|---|---|---|
| Year 1–2 pathway * | Year of entry in to university | Start of the academic year in which year 1 course was taken | Start of the academic year in which year 2 course was taken | Start of the academic year in which final year was taken | |
| Cohort 1 | 2013 | 2013 | 2014 | 2015 or 2016 | |
| Cohort 2 | 2014 | 2014 | 2015 | 2016 or 2017 | |
| Cohort 3 | 2015 | 2015 | 2016 | 2017 or 2018 | |
| Cohort 4 | 2016 | 2016 | 2017 | 2018 or 2019 | |
| B | |||||
| Year 3 study | Year of entry in to university | Start of the academic year in which year 3 course was taken | Start of the academic year in which final year was taken | ||
| Course A | 2012–16 | 2014–2018 | 2014–2019 | ||
| Course B | 2012–16 | 2014–2018 | 2014–2019 | ||
| Course C | 2012–16 | 2014–2018 | 2014–2019 | ||
| Course D | 2012–16 | 2014–2018 | 2014–2019 | ||
Additional files
Download links
A two-part list of links to download the article, or parts of the article, in various formats.
Downloads (link to download the article as PDF)
Open citations (links to open the citations from this article in various online reference manager services)
Cite this article (links to download the citations from this article in formats compatible with various reference manager tools)
Equity, Diversity and Inclusion: Alternative strategies for closing the award gap between white and minority ethnic students
eLife 10:e58971.
https://doi.org/10.7554/eLife.58971


