Equity, Diversity and Inclusion: Alternative strategies for closing the award gap between white and minority ethnic students
- MRC Laboratory for Molecular Cell Biology, UCL, United Kingdom
- Department Cell and Developmental Biology, UCL, United Kingdom
- Article
- Figures and data
- Abstract
- Introduction
- An exploration of the award gap in cell biology courses at University College London
- Policies for reducing the award gap in undergraduate degrees
- Conclusion
- Methods
- Data availability
- References
- Decision letter
- Author response
- Article and author information
- Metrics
Abstract
In the United Kingdom, undergraduate students from Black, Asian and other minority ethnic backgrounds receive lower classes of degrees than white students, and similar gaps have been reported in other countries. Such award gaps limit ethnic diversity in academic research, and in the broader job market. Whilst there has been some success in reducing the award gap in the UK, a significant gap still persists. Here, based on an analysis of students studying cell biology at University College London, I show that differences in performance at exams contribute significantly more to the award gap than differences in performance in coursework. From these data, plus scrutiny of the literature, alternative policies are identified to speed up the closure of the award gap and to remove the barriers that prevent students from Black, Asian and other minority ethnic backgrounds from progressing to PhD and postdoctoral positions.
Introduction
In the United Kingdom (UK), 81.4% of white students and 68.0% of Black, Asian, and other minority ethnic (BAME) students are awarded good undergraduate degrees (where good means a first or upper second), which equates to an award gap of 13.4% (see Methods for more details on the use of the term BAME in this article). The existence of an award gap has been known about for over 25 years, and such gaps have been reported for every university in the UK (AdvanceHE, 2020b; Woolf et al., 2011).
Similar gaps have also been reported in the Netherlands, United States (US) and Australia for undergraduate and postgraduate taught degrees, and other college-level courses (Stegers-Jager et al., 2016; Kleshinski et al., 2009; Tekian et al., 2001; Alexander et al., 2009; Harris et al., 2020; Haak et al., 2011; Rath et al., 2012; Farmer, 2017; Kay-Lambkin et al., 2002). In theory, scores in qualifying entrance exams may explain the gap in grades awarded. Indeed, studies in the US, UK and the Netherlands have reported gaps in the marks awarded to different ethnic groups for various qualifying exams for both undergraduate and postgraduate courses (Miller and Stassun, 2014; Miller et al., 2019; Reeves and Halikias, 2017; Stegers-Jager et al., 2016; UK Government, 2020). However, when tested directly in both the UK and the US, the award gap between ethnic groups persists when comparing students entering higher education with the same qualifications (Amos and Doku, 2019; Tekian et al., 2001). Furthermore, despite students from Chinese and Indian ethnic backgrounds outperforming white students in university entrance exams in the UK, an award gap of 5% still exists for both of these minority groups (UK Government, 2020; AdvanceHE, 2020b).
These analyses indicate that institutions themselves are responsible for the award gap between white and BAME students. Within the context of marking students’ work, racism or unconscious (implicit) bias is unlikely since most marking is blind, and when it is not (such as in clinical work) it has been found to be an unlikely major cause (McManus et al., 2013; Woolf et al., 2011; Yeates et al., 2017). Other studies investigating the cause of the award gap have controlled for over 20 other potential factors, such as poverty, age, prior school type and learning style. Yet, while some of these factors have been found to make a contribution, a large, unexplained award gap still remains (Broeke and Nicholls, 2007; Woolf et al., 2013).
The award gap follows BAME students into their careers: the proportion of white graduates in employment or further education one year after graduation is a third higher than the proportion of BAME graduates (UK Government, 2020). Moreover, only 9.1% of professors are BAME (AdvanceHE, 2020a), compared with 14% of the population in England and Wales, and 40% in London (White, 2012). Most of this attrition takes place at the transition from undergraduate to PhD student, and the transition from PhD student to postdoctoral researcher (see Methods for the trajectory; AdvanceHE, 2020a; AdvanceHE, 2020b). In practice, selection for interview for the most competitive and prestigious PhD positions – which appear to increase the chances of progressing further in an academic research career – tend to go to those students with the highest grade (that is, to students with a first, or students with an upper second overall with a first or high upper second in the relevant modules), which fewer BAME students possess (AdvanceHE, 2020b; this report). This in turn affects progression into postdoctoral positions as students on prestigious PhD programs have a higher chance of obtaining the skills and outputs favoured by selection panels.
There is little direct data, but this notion is consistent with the observation that Black Caribbean PhD students are less likely than other PhD students to have a fully-funded UK Research Council Studentship (a pre-doctoral fellowship that is considered to be highly competitive; Williams et al., 2019). It is important to note, however, that other inequalities linked to the undergraduate degree, such as disparities in information on application processes and prior university attended, also likely contribute to reducing the chance of a BAME student progressing to PhD (Williams et al., 2019) or receiving an interview for doctorate positions. Furthermore, previous data have shown that other inequalities also contribute to career outcomes in the UK: for example, considerably fewer school leavers (of all white and minority ethnic groups combined) who live in the most deprived neighbourhoods progress to higher education (Sosu and Ellis, 2014; UCAS, 2019), and Pakistani, Black, or Roma/Gypsy/Irish/other traveller ethnic groups are awarded fewer high grades in end-of-school exams (UK Government, 2020).
A similar effect is also seen in the US, where the ethnicity award gap (and to a lesser extent, gender gaps) in the graduate record exams (GRE) leads to higher rejection rates for these minority groups when applying to PhD positions, or even prevents them from applying (Hodapp and Woodle, 2017; Miller and Stassun, 2014). Efforts to reduce racism and unconscious bias are critical for all stages of recruitment and promotion in academia. However, the transitions to PhD and postdoc positions show by far the largest loss of talent of minority ethnic groups, so focusing resources on these transitions is likely to have the largest impact.
One strategy for reducing the unexplained award gap for undergraduate degrees is to seek quantitative (see Methods for definition) and scientific data on the underlying causes. Although such evidence is recognised as important, it is not widely used (Amos and Doku, 2019). Furthermore, the fact the gap can vary from subject to subject – from 3% to 22% in the UK (AdvanceHE, 2020b) – is often not considered. This suggests that different solutions (or different combinations of solutions) may be needed for different subjects.
Here, data from courses in cell biology at University College London (UCL) are used to explore the origins of the unexplained award gap, and to suggest measures to reduce this difference and lessen the impact of this gap on academic career progression. In addition, conclusions based on discussions with the organisers of PhD programmes are presented in the article along with an analysis of published initiatives that have increased the recruitment and retention of doctoral students from minority ethnic backgrounds.
An exploration of the award gap in cell biology courses at University College London
Undergraduate degree pathways in the biosciences and natural sciences at UCL are complex with many possible routes, which is typical across the life sciences in the UK. The cell biology courses (also termed modules) in this study were part of 17 different degree pathways: 15 bioscience and natural science routes were taken by 96.1% of students and the other two routes were taken by the remaining 3.9% (other life science or medical students). The third and often final year of the degree is fragmented into smaller specialised courses, which means that students do not typically take the same modules across all years of their degree. To accommodate this constraint, two complimentary approaches were taken to study the award gap in cell biology.
The first approach, termed the ‘year 1–2 pathway’, analyses the marks of students entering UCL between 2013–2016 who studied the same cell biology courses in year 1 and 2 (up to 344 students; Table 1). Out of the 344 students, eight did not have a record for having taken year 1 cell biology: based on when they joined UCL, five are likely to have transferred directly into year 2 from another UCL degree, and the other three from another university. In year 1, each student takes one of two courses, and the grades awarded were combined as a single year 1 cell biology output. In year 2 all students study the same course.
Table 1
Cell biology cohorts studied in this report.
(A) The year 1–2 pathway includes four cohorts that entered UCL between 2013–2016 and took a year 1 and year 2 course in cell biology. *>99% of students stayed with their cohort as it progressed in the pathway. Results for the other ~1% were allocated to the year they took the course. (B) The year 3 study includes students that entered UCL between 2012–2016 and took one of four courses. For each course, the marks of students from all five years groups are aggregated together. All academic years start in October and end June the following year. Final year is based on three year bachelor’s or four year master’s undergraduate degree.
| A | |||||
|---|---|---|---|---|---|
| Year 1–2 pathway * | Year of entry in to university | Start of the academic year in which year 1 course was taken | Start of the academic year in which year 2 course was taken | Start of the academic year in which final year was taken | |
| Cohort 1 | 2013 | 2013 | 2014 | 2015 or 2016 | |
| Cohort 2 | 2014 | 2014 | 2015 | 2016 or 2017 | |
| Cohort 3 | 2015 | 2015 | 2016 | 2017 or 2018 | |
| Cohort 4 | 2016 | 2016 | 2017 | 2018 or 2019 | |
| B | |||||
| Year 3 study | Year of entry in to university | Start of the academic year in which year 3 course was taken | Start of the academic year in which final year was taken | ||
| Course A | 2012–16 | 2014–2018 | 2014–2019 | ||
| Course B | 2012–16 | 2014–2018 | 2014–2019 | ||
| Course C | 2012–16 | 2014–2018 | 2014–2019 | ||
| Course D | 2012–16 | 2014–2018 | 2014–2019 | ||
The other experimental approach, termed the ‘year 3 study’, looked at four different year 3 courses (448 students, entering UCL between 2012–2016; Table 1). Each course had a different composition of students and was chosen on the basis of their class size and variety of specialisms. From the data, it was possible to approximate how many students from the year 1–2 pathway were present in at least one of the year 3 courses (see Methods). This suggests that ~41% (182/448) of the students in the year 3 study flowed from the year 1–2 pathway and an additional ~59% (266/448) came from other bioscience degrees or another degree route.
In the year 1–2 pathway there are four cohorts (one for each year of entry from 2013 to 2016). For clarity, all years in this study are academic years (which in the UK start in September-October and end May-June the following year) and cohorts are cited by the year they start. As each cohort takes two courses – one in year 1 and one in year 2 – a total of eight sets of marks were analysed (Table 1). The year 3 study encompasses students who entered UCL from 2012 to 2016, equalling five-year groups in total. Due to the small class sizes, the marks of the five-year groups included in the study are aggregated together for each course.
In the UK, most undergraduate degrees are either a three year bachelor’s degree, or a four year undergraduate master’s degree (exceptions include medicine). The fourth year was not studied here, because most of that year is a lab project and the ethnicity of students is visible to the examiners, whereas in the cell biology courses selected, all the marking is done blind or by a machine. This circumvents the possibility of unconscious bias or racism contributing to or explaining any gap identified.
In addition to the 792 students included in the study (across both experimental approaches), an additional 22 students were excluded: 12 withheld their ethnicity and 10 (five BAME and five white) did not complete the course. 47.0% (372/792) of the cell biology students assigned themselves as having BAME ethnicity, and 63.3% (501/792) were UK-domiciled. Out of the 792 students included in the study, 95.5% (756) had a grade returned for all the individual components in their course; all data that was returned for all 792 students were included (see Methods - Student Count for further details). In the UK, the final degree is then classified into bands (grades) according to the percent awarded: first class,70% or higher; upper second (2i), 60–69%; lower second (2ii), 50–59%; third class (40–49%); lower than 40% is further separated into referral and fail. A mark of 60% or higher (i.e., a first or upper second) is considered a good degree or a good mark when looking at components of a degree.
The average award gap in good grades is the difference in the mean proportion of BAME and white students that are awarded good marks. For each course, the final mark awarded is the sum of a weighted exam and weighted coursework mark (with exams typically receiving the higher weighting). Here, to enable a comparison of exam and coursework results, the raw (unweighted) marks are reported for each, along with the final weighted mark.
Comparing the award gap of UK domicile and international students at UCL
Statistics agencies in the UK report the ethnicity award gap for undergraduate students that are domiciled in the UK, but universities themselves can collect data on all their students. At UCL, the gap for its UK students is 4.9% on average based on the marks of 8,044 undergraduate students that started their graduation year between 2016–2018, which are similar cohort years to those in this study (Table 1). This is at the smaller end of the scale compared to the average gap for all UK students (13.4%). In these same UCL cohorts, the average gap between BAME and white international undergraduate students (N = 5,671 total) is 6.3%, which is near the 4.9% for UK students. This suggests that if any domicile effect exists, it is small. Studying any potential effect of domicile on the gap is not the purpose of this investigation and has been discussed in part elsewhere (Stegers-Jager et al., 2016; Woolf et al., 2013). In this study, which is designed to find major contributions to the gap that would benefit all students, both UK domicile and international students are included for all the cell biology courses investigated and comparative UCL-wide data.
Entrance qualifications for cell biology students in this study
The most common type of entrance exam (termed advanced level, or A-level) was accessible from UCL records. At UCL about 90% of UK and 30–40% of international students are admitted with A-levels. The university places strict equivalency requirements on those students that enter with other types of admission exams. Thus A-level grades are a reasonable approximation of all students in the study.
UCL released the A-level grades of a sub-set of students in this study. However, these are representative, and include the first three cohorts (out of four) from the year 1–2 pathway (250 students), 54% of which (135) also took one of the courses in the year 3 study. 72% (179/250) were admitted with A-levels. Typically, only three A-levels are required in sciences or sciences and maths for entrance in science-related degrees. Approximately a quarter received four or more A-levels, and the other three-quarters had three A-levels. To make the analysis fair, for students with four or more entrance subjects, their three highest grades in most relevant A-level subjects (sciences and maths) were included. A student with grades in only two A-level subjects was also included in the analysis.
A-level grades awarded are alphabetical with A* the highest and E the lowest. Each grade was then assigned a numerical value based on the UK standard tariff: A* = 56; A = 48; B = 40; C = 32 (no student had lower than a B). An average of the best three grades (as described above) was then calculated for each student.
The mean admission tariff for BAME (50.53 ± 0.15) and white (50.29 ± 0.33) students included in this study were virtually identical (Figure 1A): the equivalent of nearly all students in each of these ethnic groupings gaining one A* grade and two A grades (which would be a mean tariff of 50.7). These data are very similar to the mean entrance tariff for all BAME (50.27 ± 0.06) and all white (50.03 ± 0.01) undergraduate students who entered UCL with A-levels for the same cohort years as these cell biology students (2013, 2014, 2015 entrants).
Figure 1
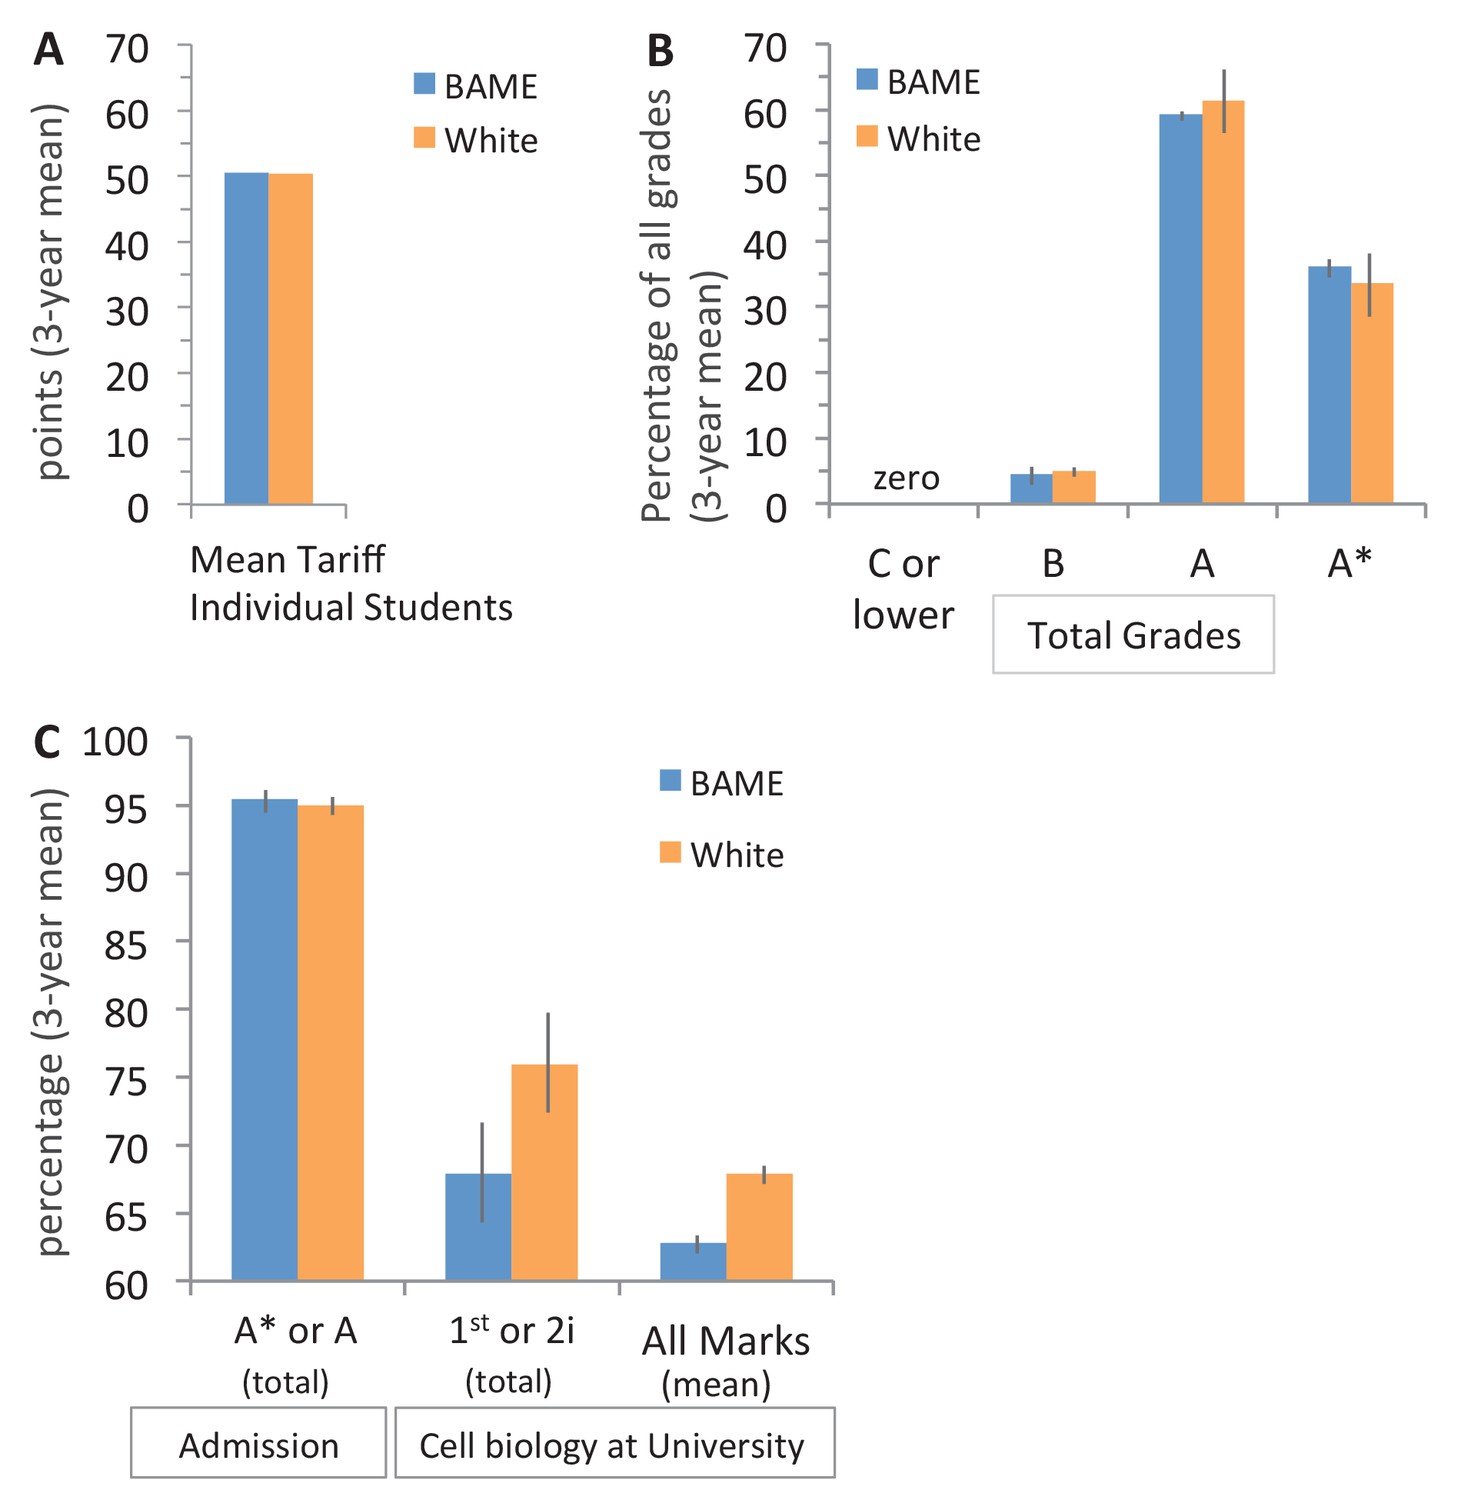
Entrance qualifications are near identical for BAME and white students in this study.
(A) Top three A-level grades awarded to the first three cohorts in year 1–2 pathway that entered UCL between 2013–2015: grades were converted to the UK standard points tariff (see Entrance qualifications for cell biology students in this study), the average for each student was calculated, and the mean of all three cohorts was determined (SEM: ±0.15 for BAME and ±0.33 for white students, which are too small to see on the graph). N = 179 students (82 BAME, 97 white); 536 entrance grades (246 BAME, 290 white). (B) Percentage of grades awarded to students in (A) that were C or lower, B, A, or A*: 3 year mean (± SEM). (C) The percentage of top admission (A* and A) grades awarded to BAME and white students in (A), the percentage of students that received the top two grade bands (first or 2i) in year 2 of cell biology in 2014–2016 (same students shown in (A)), and their average mark in year 2 of cell biology: each column: (3 year mean ± SEM).
-
Figure 1—source data 1
Source data on the entrance qualifications of white and BAME cell biology students entering UCL in 2013–2015 and their subsequent grades for year 2 cell biology.
- https://cdn.elifesciences.org/articles/58971/elife-58971-fig1-data1-v1.xlsx
An alternative approach for assessing admission qualifications is to look at the distribution of the total number of each individual grade (A*, A, B, C or lower) awarded to each cohort. As expected distributions for BAME and white students were nearly identical (Figure 1B); of the total grades awarded to BAME students 95.45% ± 1.01 were A* or A, and for white students this figure was 95.02% ± 0.62 (Figure 1C).
Looking at the grades awarded to the same three cohorts of students in year 2 of their biosciences, natural sciences or other degree revealed that proportionally fewer of these same BAME students were awarded good grades for cell biology (Figure 1C). The mean of all marks awarded was a low 2i (60–64%) for BAME students and a high 2i (65–69%) for white students (Figure 1C). Students admitted with A-levels performed similarly in cell biology to all students admitted in the study as expected (Figure 1—source data 1).
These data indicate that prior qualifications do not explain the subsequent award gap in cell biology, at least at the resolution that the A-level grading system permits. This is in line with other admission studies at UK universities (Amos and Doku, 2019; Broeke and Nicholls, 2007; Woolf et al., 2013).
Dissecting cell biology course components at the level of good grades
In all year 1, year 2 and year 3 courses in the study, proportionally fewer BAME students were awarded final good grades than white students (Figure 2A, B and E). That the award gap has appeared by year 1 has also been reported for the University of Nottingham (Amos and Doku, 2019) and is the case for all undergraduate degrees at UCL (Figure 2F). The average gap in good grades awarded each year of study in cell biology (~8–13%) and across UCL (~7–11%) were similar (Figure 2, compare E and F, final mark). This suggests that the gaps identified in cell biology are in the range expected for students studying at UCL. Note the UCL award gap each year of study (starting the year 2016–18) were higher (~7–11%; Figure 2F) than the final degree classification (average 5.7%; 13,715 UK and international students starting the graduation year 2016–2018). One likely reason is that for most degrees, a defined number of worse performing courses are automatically excluded when calculating the final classification.
Figure 2
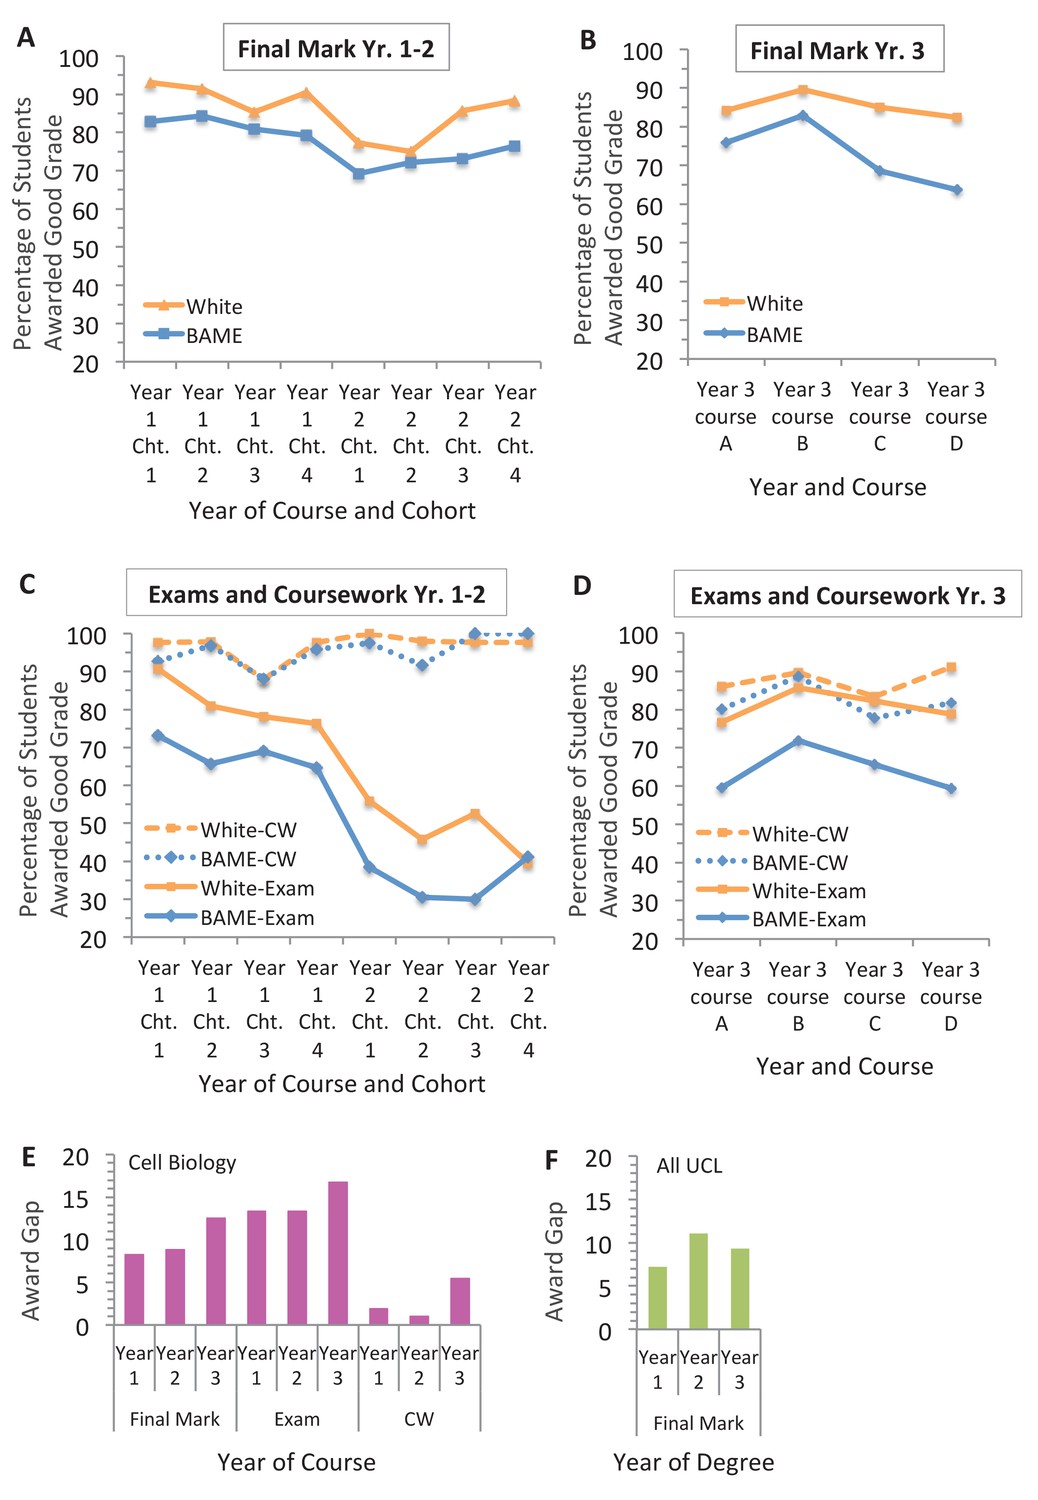
The exam is the main contributor to the award gap in cell biology.
Percentage of BAME and white students in each cohort (shown in Table 1) that were awarded good grades in cell biology for the final course mark in the (A) year 1–2 pathway and (B) year 3 study; and the exam and coursework components in the (C) year 1–2 pathway and in the (D) year 3 study. (E) Difference in the percentage of white and BAME students awarded a good mark (first or 2i) for each year of the cell biology course (data shown in A-D) based on the mean of all four cohorts or courses (means and SEMs are reported in Figure 2—source data 1). (F) Difference in mean proportion of good grades awarded to all white and BAME students at UCL in 2016, 2017 and 2018 for each year of study (years 1, 2 and 3). Total number of students that completed the course = 792; in the year 1–2 pathway = 344 (167 BAME, 177 white); in the year 3 study = 448 (205 BAME, 243 white). 22 students were excluded (12 due to unknown ethnicity; 10 did not complete the course).
-
Figure 2—source data 1
Source data for the final course, exam and coursework marks of white and BAME students in the year 1–2 pathway and year three study; and the grades for all UCL undergraduates that took year 1, 2 and 3 in either 2016, 2017 or 2018.
- https://cdn.elifesciences.org/articles/58971/elife-58971-fig2-data1-v1.xlsx
For 11 out of 12 sets of marks studied, this award gap seemed largely derived from the exam component of the course (Figure 2C–E). The average exam gaps were similar in year 1 and 2 at over 13% each, and most pronounced in year 3 at nearly 17% (Figure 2E). Whether the peak in year 3 is a trend needs to be more widely tested. No exam gap was detected in year 2, cohort 4 (Figure 2C). However, a gap overall was still observed for this group (Figure 2A). This was explained by a longer ‘tail’ of lower exam marks for BAME students which resulted in fewer BAME students (61.3%; 23/36) being able to use their coursework grade to obtain a good final mark compared to white students (88.5%; 23/26).
The coursework award gap in good grades was smaller than the exam gap in all individual cohorts and cell biology courses in year 1 (4/4) and year 3 (4/4); and most of the cohorts in year 2 (3/4) (Figure 2C,D, compare solid and dashed lines). The coursework award gap was 7.1- (year 1), 13.1- (year 2) and 3.1- (year 3) times smaller than the exam award gap on average (Figure 2E, compare exam and coursework values). Taken together this suggests a reproducible and therefore significant pattern.
It is speculated that the small coursework award gap (1–2%) for the year 1–2 pathway in this study reflects small fluctuations in different admission years: this is consistent with 5/8 incidences where BAME students were awarded equal, near equal or slightly higher proportion of good marks for the coursework than white students (observable in Figure 2C, compare dashed lines). In contrast, although different admission years cannot be evaluated in the year three study as they were necessarily aggregated (see An exploration of the award gap in cell biology courses), there is no such fluctuation, suggesting that the coursework effect in year 3 courses in this study (average 5% award gap) is consistently small (Figure 2D, compare dashed lines).
In theory, if most students are awarded a good grade that may mask a gap. However, when the grades awarded for the exam and coursework were similarly high as each other (such as cohorts 1 and 3 in year 1 for white students) a relatively large award gap between white and BAME students was still distinguishable for the exam, but was small or none for the coursework of the same cohort (Figure 2C). Similarly, it is unlikely that larger gaps are only revealed when tasks are harder: for example, in year 3, which is expected to have harder coursework tasks overall, grades were broadly the same for exams and coursework (for white students), yet the gap in grades awarded to BAME and white students were only evident in the exam.
Overall, the method of looking at good marks seems sensitive enough to both detect a gap and to reflect its size if it exists. Cohen’s D (which is a measure of effect size) was then applied to the mean award gap of all four cohorts or courses studied for each component in the year 1–2 pathway and year 3 study. This revealed that the effect for coursework is three to six times smaller than the exam (Figure 2—source data 1).
Testing for potential hidden award gaps across all marks
There is a further possibility that there may be a larger coursework award gap, but it was not detectable because it occurred within a specific range of marks. However, in year 2 and year 3 cell biology a larger coursework gap could not be found when comparing every absolute mark awarded to BAME and white students at the resolution of 5% intervals (which is one-half grade band) from less than 30% to 100% scores (Figure 3; only cohorts 1–3 were included in the analysis for year 2 – see legend for more details) Clearly evident in these frequency distributions, the peak of final marks (Figure 3A and B) and the peak of exam marks (Figure 3C and D) awarded to BAME students were shifted half to more than one grade band lower than white students (Figure 3A–D). The end result is that BAME students are most likely to receive a low 2i (60–64%), whilst white students are more likely to receive a high 2i (65–69%) or a low first (70–74%) for these courses overall (Figure 3A and B).
Figure 3 with 1 supplement see all
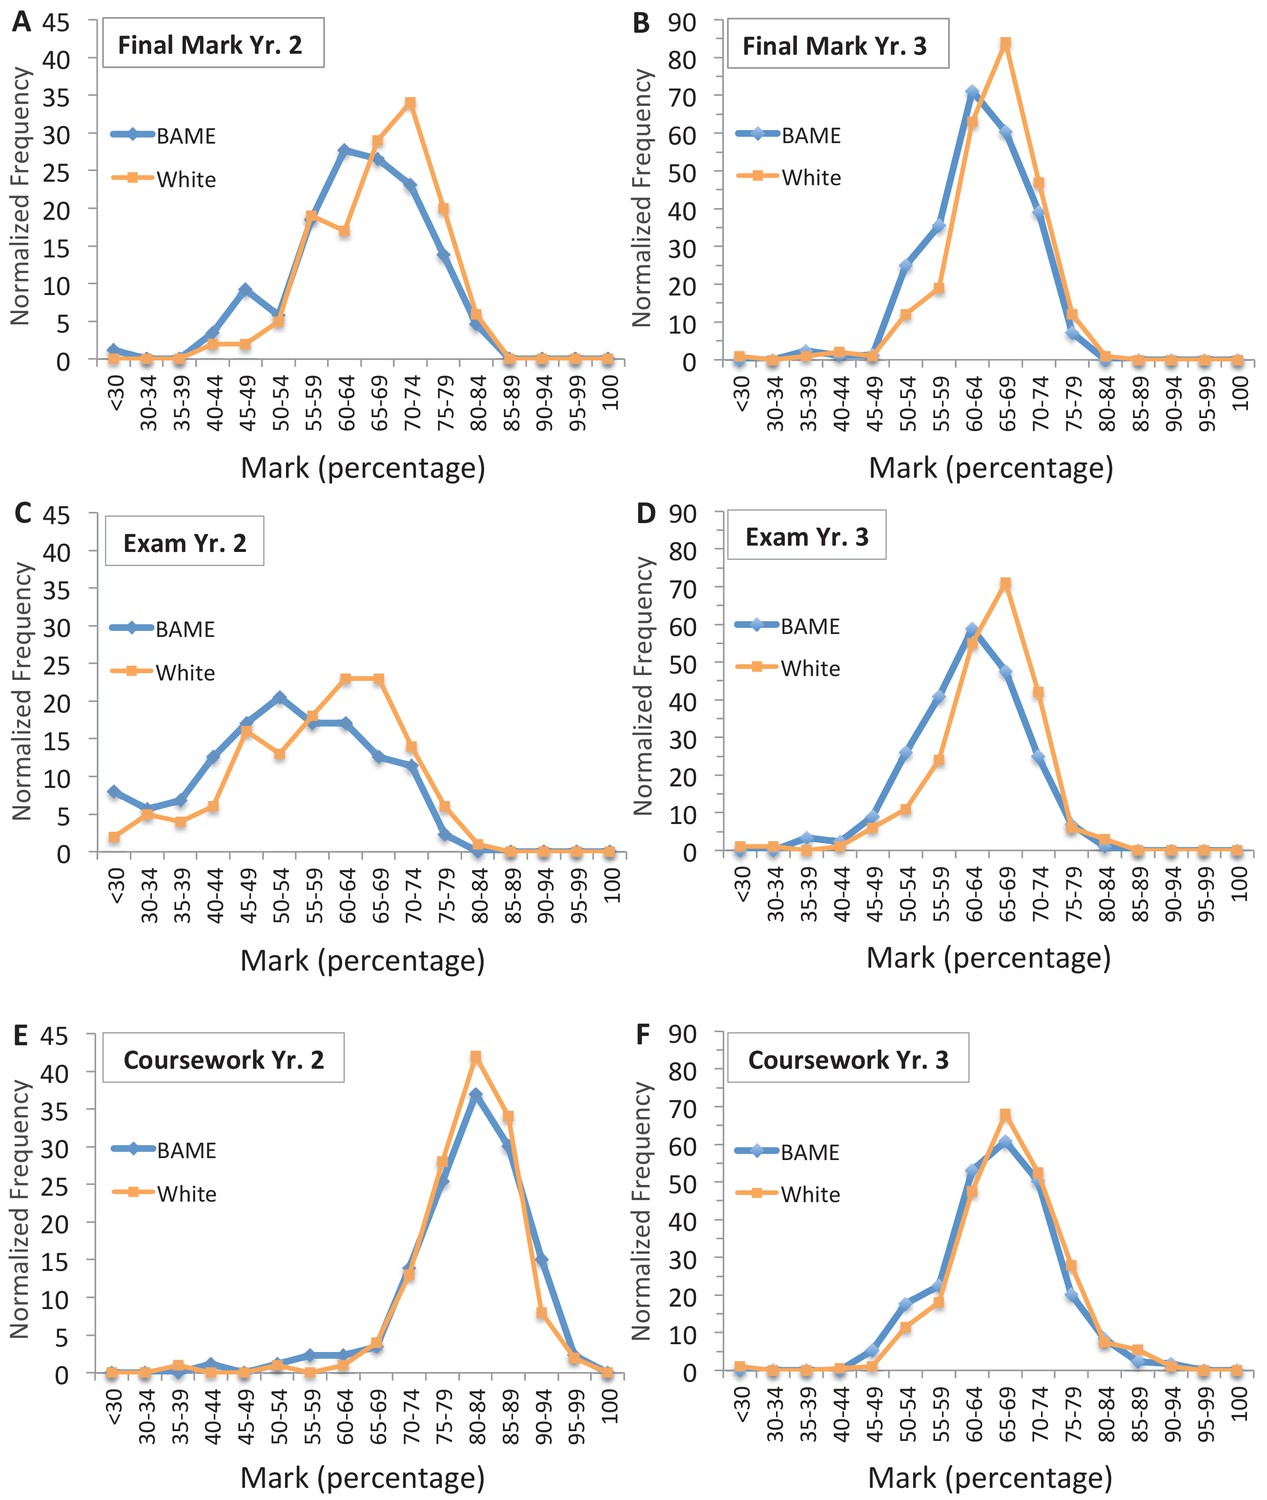
Comparison of all marks does not reveal any larger award gap in the coursework.
Comparisons of all marks awarded to individual BAME and white students in year 2 (A, C, E) and year 3 (B, D, F) cell biology for all courses in year 3 study and three cohorts (cohorts 1-3) in year 2; cohort 4 in year two was excluded since there was no exam award gap in good marks, as reported (Figure 2C; and main text) and also none in first class marks-only. For each component, frequency of marks for each interval was aggregated across cohorts. To enable fair comparison BAME, student frequencies were then normalised to the total number of white students in that component (normalisation factors are shown in Figure 3—figure supplement 1—source data 1). Total number of students that completed the course = 698; in year 2 = 250 max (116 BAME, 134 white); in year 3 = 448 max (205 BAME, 243 white). Exact cohorts and N for each component in (A–F) is shown in Figure 3—figure supplement 1—source data 1.
In contrast, the histograms of coursework marks for white and BAME students were almost completely superimposed in both studies (Figure 3E and F). Further inspection of the curves demonstrates the method is sensitive enough to visualise the small award gap in good marks between BAME and white students for the coursework in year 3 (Figure 3F, slight broadening in the bell-shaped, blue curve away from the orange curve at 59% to 40%) that was reported in Figure 2E. However, clearly there is no larger visible gap anywhere in the entire spectrum of marks at the resolution of 5% intervals for either year 2 or 3 cell biology coursework (Figure 3E and F).
There was insufficient data to fully assess year 1 cell biology course components by first class marks, though they were found to follow the same general trends as year 2 and 3 (see Limitations of the study).
Cell biology award gaps in first class marks
As expected from these histograms (Figure 3) the average award gaps for year 2 and year 3 coursework at the level of first class marks-only remained small (2.60% and 4.11%, respectively) similar to that reported at the level of all good marks for these modules (2.14% and 5.45%; Figure 3—figure supplement 1, compare A and B).
The average exam award gaps for first class marks in year 2 and 3 (5.60% and 9.29%) were smaller than those for good marks (18.37% and 16.75%), but importantly were two (or more) times larger than the coursework gaps at the same level (Figure 3—figure supplement 1, compare A and B). This pattern of the exam award gap in first class marks being larger than the coursework award gap was also observed in three out of four of the year 3 courses (B, C and D); in course A, both the exam and coursework award gap were similarly small (Figure 3—figure supplement 1C). There were too few white (and BAME) students awarded first class marks for the exam to compare individual year 2 cohorts (observable in Figure 3; see Figure 3—figure supplement 1—source data 1 for comparison of year 2 course components, aggregating the cohorts and Methods for more details).
In addition, a number of factors contribute to the relative size of the award gap for the final cell biology mark: the weighting for the coursework and to what extent the coursework mark can lift a student to a final grade band that is higher than that for the exam mark, and how far the exam is shifted to lower marks. All these factors can vary by course (some are observable for example in Figure 3); and in these data the gap in first class marks awarded for the final module mark was greater than all good marks in year 2, but smaller in year 3 (Figure 3—figure supplement 1 – compare A and B and quantified in the source data).
These differences are not unexpected. Indeed, although the exam award gap for first class marks being smaller than all good marks is similar to the UK-wide pattern for the final degree, it is evident from other national statistics, and at UCL, that the amount first class and upper second marks contribute to the award gap varies at least between different subjects and minority ethnic groups (AdvanceHE, 2020b). It is therefore plausible that different studies will detect different patterns in this regard.
Taken together, these data indicate that in these cell biology courses, the exam is the main contributor to the gap in marks awarded for the course overall. If there is a contribution from coursework, it is relatively small in all years and may not be consistently present in years 1 and 2.
Evaluating potential underlying causes of the award gap in exams
There are fewer cell biology courses in the year 1–2 pathway than in the year 3 study, and it is possible that comparing more biology courses in these first two years could identify a larger award gap in coursework, similar to the one found in year 3. On the corollary, the inclusion of students from multiple years groups in the year 3 study might drive the small coursework award gap detected. Future studies will be needed to distinguish between these two possibilities. Furthermore, it is also not possible to determine whether the difference in size of the exam and coursework award gaps between year 1, 2 and 3, and between different year 3 modules, is due to how each course is taught: for example, how the course is delivered, the precise types of assessments, the level of support students receive on different degree routes or a combination of these factors.
Similarly, why exams overall produce a bigger gap than coursework in the year 1, 2 and 3 courses studied is not yet known. The finding is consistent with medicine where different types of assessments produce gaps of different sizes; although, unlike here, exams versus coursework were not explicitly tested (Woolf et al., 2011). In cell biology, the exam assessment method in year 1 (mainly multiple choice) is different to years 2 and 3 (mainly essays). One interpretation of this difference is that the process of taking an exam may contribute to the gap. To test how widespread these findings are, other cell biology courses in other universities need to be evaluated.
In the future, it will also be important to directly test the extent to which the examination process, its content or other potential factors matter. This will reveal further precision on the underlying causes of the exam award gap. Related to this, and equally important in its own right, will be to determine if other types of degree subjects have similar or distinct patterns in their own gaps to that observed for cell biology. For example, how does the size and pattern of the award gap in subjects that do not examine by essays compare to those that mainly rely on coursework? Furthermore, the different assessment methods forced by the COVID-19 pandemic may also help identify ‘what matters’.
Overall, these results suggest that this strategy of dissecting individual components of a degree could reveal what is causing the award gap for a particular subject. Although a description goes beyond the scope of this paper, these results could inform the development of a new educational framework aimed at reducing the award gap in cell biology.
Limitations of the study
The study is restricted to certain courses at one university. The wider applicability of the written exam and coursework findings require testing in cell biology in other universities and in other subjects across institutions. Most degree subjects (if not all) are composed of different types of activities and assessed components. The method described here is envisaged to be readily adaptable to look systematically at the relevant components of any particular subject.
In year 1 cell biology there was more variability between cohorts in the proportion of students awarded first class marks for the exam and for the coursework, for both BAME and white students. It is speculated that this was due to the combination of disaggregating good marks further, and the necessity of combining two different modules for each cohort in year 1 which may have varied marking schemes (whereas all cohorts in year 2 and year 3 were composed of a single course). Additional year 1 cohorts are required to test the preliminary finding that the average coursework award gap in first class marks was 1.6-times smaller than the exam gap (for cohorts one, two and three), which is similar to that for the year 2 and 3 cell biology courses, which are 2.2 and 2.3-times smaller, respectively (Figure 3—figure supplement 1). In cohort four (year 1), there was no award gap in first class marks for the exam, which is consistent with the similar finding for the same students in year 2 (cohort four, year 2) at the level of all good marks reported (Figure 2C).
Except for this year 1 limitation, the studies here are of sufficient size to assess gaps at the level of the components of an individual course, a main aim of this investigation. However, disaggregating exam and coursework marks of individual minority ethnic groups will require further investigation with larger cohort sizes. In particular, it would be informative to look at students with Black ethnic backgrounds because proportionally these students are awarded the fewest good degrees in the UK (AdvanceHE, 2020b). Only 2% of the cell biology students in this study self-identified as Black African, Black Caribbean or other Black background (UK and international domiciled) which is a similar proportion across all undergraduates at UCL (3%, UK and international) for similar cohort years (2012–2016 entrants), and similar to that for England and Wales (3%) at the last census (2011), but underrepresented for London (13%). Preliminary data, which is consistent with the UK pattern, looking at year 3 cell biology courses, the proportion of Black students awarded good grades for the final course mark (~38%) and for the exam (~38%) was up to 2-times lower than all minority ethnic students (BAME) for these two components (72.7% ± 3.7% and 64.1% ± 2.6, respectively). However, the proportion of Black students awarded good grades for cell biology coursework (~87%) was similar to all BAME (82.1% ± 2.0) and white (87.5% ± 1.5) students.
Policies for reducing the award gap in undergraduate degrees
For the past 10 years, only 0.5% per year has been shaved off the undergraduate degree award gap (AdvanceHE, 2020b). Yet in the same period there have been extensive reviews and reports that have detailed why the unexplained, award gap exists and hundreds of recommendations on how universities can tackle it (Alexander and Arday, 2015; Amos and Doku, 2019; Berry and Loke, 2011; ECU and HEA, 2008; Miller, 2016; NUS, 2011; summarised in Figure 4; for a review of earlier studies (from pre-1990s) see Singh, 2011).
Figure 4
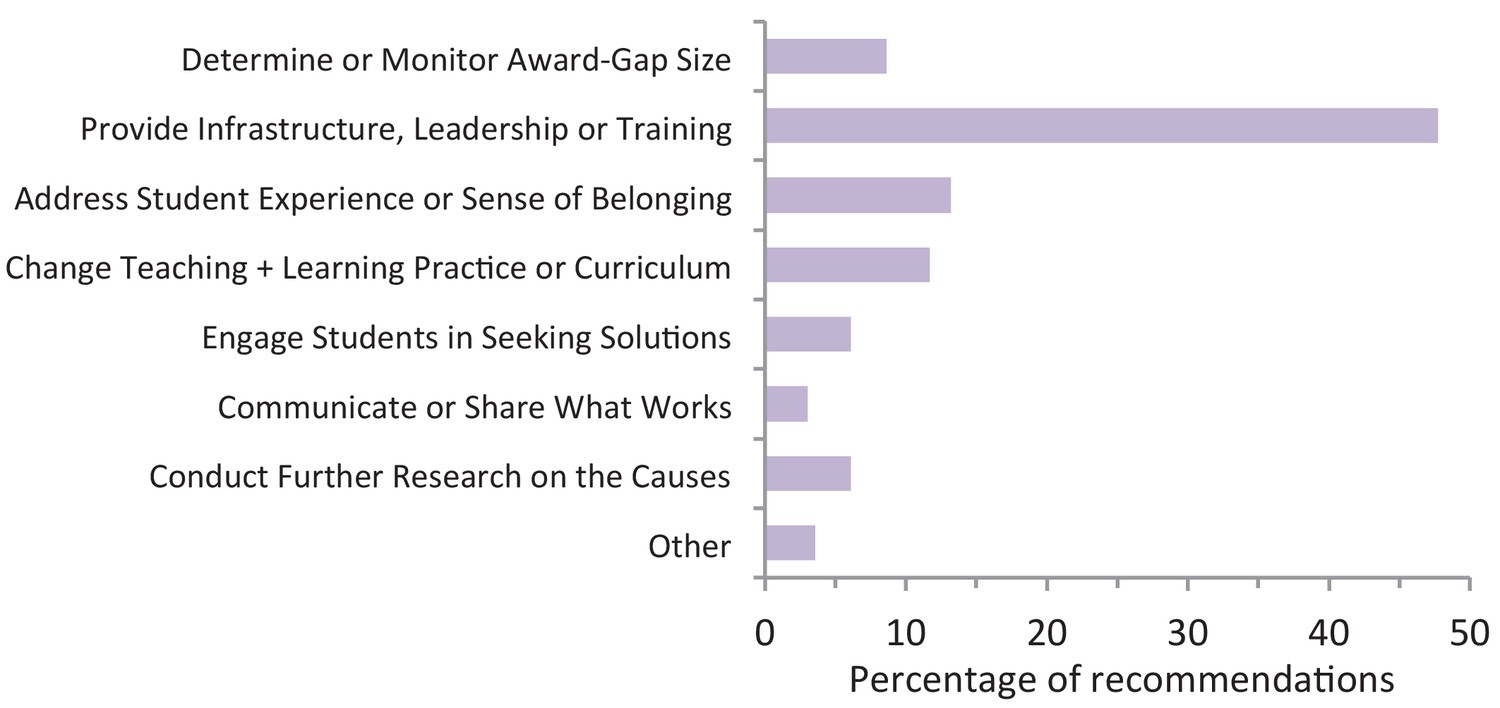
Summary of previous recommendations on how to close the award gap between white and BAME undergraduate students.
Recommendations are from three major UK original research reports: ECU and HEA, 2008; Berry and Loke, 2011; Amos and Doku, 2019. Reports were selected based on the depth and breadth of the data, the number of participating higher education institutions (HEIs) and representation across the past decade. The recommendations from each report were then assigned to seven different categories based on the language used to describe them. For example, characteristics of ‘HEI culture’, ‘student experience’ and 'racism' were grouped together, and ‘change curriculum’ encompasses recommendations with terms such as diversify, decolonise, internationalise, and make more inclusive. N = 197 recommendations; 168 participating HEIs total: 99 HEIs partnered with the UK National Union of Students and Universities UK; and 69 HEIs worked with the Equality Challenge Unit and the Higher Education Academy (now AdvanceHE).
-
Figure 4—source data 1
Source data for the values used to calculate the percentages of the different recommendation categories.
- https://cdn.elifesciences.org/articles/58971/elife-58971-fig4-data1-v1.xlsx
A scrutiny of the literature suggests that various factors are reducing the speed at which the award gap is closing: lack of staff time coupled to insufficient funding and resources to implement existing recommendations (see Policy 1); limited scientific approaches and diverse types of evidence on the underlying causes (Policy 2); limited funding for fundamental scientific studies and for applied scientific approaches on what works (Policies 3 and 4). That the gap is only disappearing very slowly also propels the need for alternative, parallel action to reduce impact on academic (and other) career progression, by removing (in the case of academic careers) barriers to accessing PhD and postdoc positions (Policy 5). Overall, combining these five strategies may help eliminate the award and progression gap between white and BAME students.
Policy 1. Create time and fund resources to develop, implement and monitor impact of recommendations
Many universities, including UCL, have put considerable effort into identifying what resources are needed to close the award gap, with nearly 200 recommendations in three reports alone (Figure 4; Box 1). But therein lay two fundamental issues: they are all hugely time-intensive to develop and implement, both for academic and other university staff, and cost-heavy for universities. Academics already work excessive hours just to get their ‘regular’ job done (Richardson, 2019; UCU, 2016), yet seem directly responsible for delivering many of the recommendations. The UK does not appear in the world’s top 100 for staff-student ratios (THE, 2020) and the best UK ones are misleading, as they do not measure proportion of time spent on teaching or with students. Even if it is still ‘too early to tell’, the same work-load issues and ownership of who develops and delivers the actions apply. The complex mix of recommendations distils to a simpler accelerated answer: increase staff ratios and remove other speed barriers.
Box 1.
Examples of specific recommendations provided by previous policy reports on how to close the award gap.
A non-exhaustive selection of some of the types of previously suggested actions within the three largest categories. (1) Provide infrastructure leadership and training by: (a) ensuring clear messages on the importance of addressing the problem comes from all tiers of leadership; (b) creating and enabling access to resources for each category of recommendation; (c) providing access to data and reporting transparently; (d) offering staff training on: how to recognise and respond to racism and micro-aggressions on campus, unconscious (implicit) bias training, how to build supportive and inclusive environments, and how to assess and mark fairly. (2) Changing teaching and learning practices or curriculums by: (a) diversifying how a subject is taught and assessed through promoting inclusive learning environments, increasing feedback to students, encouraging students to directly engage with their peers and academic staff, providing equal access to feedback and learning opportunities, providing a range of assessments, marking students’ work anonymously where feasible and according to specific mark schemes; (b) Identifying, in all subjects, a fair representation of previous contributions to that subject’s knowledge-base from different ethnic (and gender) backgrounds, and for relevant subjects or topics create curricula that are more representative of different ethnic (and gender) cultural, historical and ideological backgrounds and experiences. (3) Addressing students’ experience or sense of belonging by (a) providing diverse spaces and opportunities on campus where communities can thrive in supportive and inclusive environments; (b) celebrating and recognising the importance of diversity; (c) engaging with students equally; (d) equalising differences in cultural capital; (e) addressing racism; (f) providing role models where possible.
(1a) Increase the number of academics per student and monitor the new ratio to keep pace with the rise in student numbers
This would enable identification of sufficient academic staff that can be specifically tasked with a remit to work on the award gap so more time can be devoted to implementing initiatives aimed at decreasing the award gap. These additional academics should work with module or programme organisers, or both, to develop and implement existing recommendations (Figure 4) or design new education frameworks incorporating new evidence, such as the findings of this study, that are best suited for each subject.
(1b) Increase the number of staff to extract and analyse data and place more of them locally within departments to work on the gap
This is essential to cope with the time-heavy (but critical) activity of monitoring and measuring impact of local actions. Currently individuals and departments working on the undergraduate award gap must typically rely on a single, central student record team, or similar, to extract student results. Such teams are often small and understandably must instead prioritise their own important tasks, which include complying with statutory regulations and maintaining the student record for the entire university. Furthermore, departmental teaching teams typically do not have dedicated analysts.
(1c) Release ethnicity of students in selected, pre-approved undergraduate class lists
Another speed barrier is that in some higher education institutes – but not all – there is no mechanism for course-organisers (and entire departments) to access ethnicity (or gender) for their undergraduate class lists whilst they are live. Instead, organisers must wait to receive ethnicity data matched to student results retrospectively, which may well not be until the next academic year, delaying results of impact of any actions (see Policy 1b). Students in the UK give permission for their special category data (such as ethnicity) to be used for the legal purpose of monitoring equality of opportunity or treatment. This suggests that collecting this data in real-time will not breach UK data protection and recording of processing regulations.
(1d) Increase funding and resources to implement existing recommendations
Investment is required to enable the increase in staff time or number, or both, and to provide resources to implement the many recommendations (Figure 4); there are >5 types of training alone suggested for example (Box 1). Some universities (including University of the Arts London (UAL) and University of Brighton) have responded by releasing university access and other funds to hire new, permanent staff to work on the award gap, whilst others (including UCL) are enabling temporary ‘buy-out’ of existing staff time to develop and implement initiatives. This is welcome news; however, the total amounts to a handful of full-time equivalent posts, whereas at a single large university alone there are >4,400 courses (modules) within >440 separate undergraduate degrees (estimate based on the UCL record) and scaling that up to >50,000 undergraduate degrees across the UK (http://www.ucas.com) approaches half a million courses.
The UK government who have tasked universities with removing the difference in degree scores could fund substantially more academic positions specifically for this role, so there is one or more in each department. These positions could be made permanent which would substantially increase the £8 per BAME student provided for training and other resources to reduce the gap (see Policy 3). A proposed stakeholder alliance could also make a significant investment (Policy 4).
Policy 2. Increase scientific evidence on causes of the unexplained award gap and the diversity of approaches
At first glance it may appear there is plenty of evidence on causes of the award gap, which in turn informs the many suggested actions (Figure 4). However, on closer inspection there seem two large gaps in the evidence base. Closing these have the potential to uncover previously unrecognised solutions and to inform which ones work best.
Three comprehensive reports representing the beginning, middle and end of the past decade have comprised nearly 200 recommendations on how to close the unexplained award gap (Figure 4). However, only a very small number (estimated 0.51%) of these recommendations appear to be supported by raw numerical data. Clearly much has been quantified, particularly the size of award gaps. However, to date this has almost exclusively been used as evidence that the problem exists, as a benchmark, or as attempts to identify the size of various potential, contributing external factors (see introduction). Yet, these do not identify the larger, university-driven (unexplained) causes of the gap.
The majority of these recommendations appear to be based on qualitative data (estimate 20.3%), such as surveys, interviews and discussions, particularly those related to the following two categories which represent nearly one-quarter of all the recommendations: student experience of university life and sense of belonging; teaching and learning practice and the degree curriculum (Figure 4; see also Methods for other details).
Engaging with the lived experiences and views of minority ethnic students and staff is fundamentally important for developing potential key solutions. In the context of identifying areas that might help speed up gap closure, balancing these with quantitative approaches (see Methods for definition), such as the one in this report, which has identified a possible contributory cause, will increase the diversity of the evidence base.
Robust scientific evidence can be qualitative or quantitative in nature, and both have equal merit and complimentary benefits. A recent comprehensive analysis of what 99 UK higher education institutions are currently doing concluded that ‘a far more scientific approach’ is one of the top five most outstanding actions required to close the award gap (Amos and Doku, 2019). There are enormous benefits of a scientific approach: it clearly identifies whether any particular issue is disproportionate to minority ethnic students (or staff) and is therefore a powerful indicator of possible cause. Yet many (25/30) of the surveys and discussions to date do not seem to report control data (NUS, 2011; Methods). Recommendations in the area of tackling racism are not likely much further informed by control groups. However, in the context of speed of implementation for many of the other recommendations (Figure 4; Box 1), having a more scientific message on possible cause may persuade others to take action, to invest or guide the prioritisation of allocating valuable resources.
Explicitly advocating scientific approaches in the UK’s Race Equality charter mark and in Fellow of Higher Education Academy Awards, when either is related to degree award gap work, may also help the rate of progress, as seen with the gender-professor gap and the Athena Swan charter mark.
Policy 3. Increase direct funding to research teams proposing scientific approaches
Enabling Policy 2 requires investment. Although the UK government has announced universities must remove the gap, it is only providing £3 million/year (government and other sources) in targeted-funding, equivalent to just £8 per BAME undergraduate/year (see Methods). In addition, the commitment is only for 2–3 years; yet the award gap will take several decades to close at current projection (AdvanceHE, 2020b). Universities also have separate ‘access funds’ which could in theory be released to individual research groups. Their general availability, however, seems unclear as well as in competition with other equally important priority areas such as enabling students from disadvantaged backgrounds to attend university.
Policy 4. Involve different stakeholders to create a funding alliance
Vanishing the award gap should concern everyone. It provides all employers with a major route to considerably close their ethnicity pay- and career-gaps and thus increases productivity through enhanced work-force diversity. This in turn increases government tax revenue through increased corporate profits. Furthermore, gap closure is the sole method available to universities to remove their breach of UK laws on race equality.
A funding alliance seems a pragmatic way to raise and accelerate the large investment sums required for the success all parties stand to gain if the gap is eliminated. The remit could embrace both fundamental scientific approaches (Policies 2 and 3), and applied scientific endeavours to implement and monitor existing recommendations (Policy 1) as well as manage essential funding structures. This works elsewhere; take the Dementia Discovery Fund of £250 million, an alliance of the UK government, global pharmaceutical companies, a UK charity, and global philanthropy which funds research into effective treatments for dementia, equivalent to £294 per UK patient (see Methods).
Strong leaders who believe what society has to gain from such an alliance are required for success. It is proposed then to take advantage of a pre-existing structure such as the UK’s Nuffield Foundation, which already seems to demonstrate such a belief both in its strategy document 2017–2021 and in its funding of projects widely across education, welfare and justice; their housing of the suggested alliance may speed up its creation.
Policy 5. Re-design monitoring and recruitment for early academic career positions whilst the award gap still exists
This policy combines determining exactly where the issue in PhD and postdoc recruitment is for different minority ethnic groups (Policy 5a), implementation of more accurate national data (Policy 5b), and direct action on the impact of an unexplained difference in grades for admission exams and other selection criteria that disadvantage PhD applicants from minority ethnic groups (Policy 5c). Although most of this section focuses on PhD admission the principles of recruitment redesign and access can be applied to postdoc recruitment.
(5a) Increase the monitoring and reporting of applications, interviews and offers for PhD student and postdoctoral researcher positions by ethnicity and gender
Although at a national level, we know where the ethnicity career gaps are in terms of academic progression and the size of those gaps (described in the introduction), that information alone is not precise enough to design actions with the most impact. For example, preliminary work in our department reveals that Black people are underrepresented at application, whilst the bigger barrier for candidates from Asian ethnic groups seems underrepresentation at interview for both PhD and postdoctoral positions (ethnicity of candidates are not revealed during selection). Where such a monitoring policy is practiced, consequent legal and fair re-design of recruitment criteria combined with other successful initiatives have been powerful (Policy 5c).
(5b) Report national numbers of PhD students and postdocs separately to other positions
Whilst individual departments have capacity to accurately record the ethnicity of their own PhD and postdocs, local and national data are required to monitor the wider impact of actions. Yet, UK data that are readily available (e.g. from the Higher Education Statistics Agency and Advance HE) do not report ethnicity of PhD students separate from other postgraduate research (PGR) students (such as master of research); nor do they report postdocs separate from other staff levels of similar seniority (see Methods). However, only a PhD typically qualifies as the first academic career step. Using PGR as a benchmark for BAME PhD students and several job groups as a proxy for BAME postdocs may over-estimate already low numbers. In the US, on the other hand, PhD recipients are separately reported.
(5c) Widen initiatives that work to increase representation of minority ethnic students on PhD programmes
Some pioneering initiatives in the UK and US have driven a two to four-fold increase in the proportion of PhD students from minority ethnic backgrounds in life sciences and physics over the last 3–6 years (Hodapp and Woodle, 2017; Frank Bayliss, Tetrad Programme Office and Nadine Mogford personal communications). Where measured, retention of PhD students is also higher than the national average in these schemes (Hodapp and Woodle, 2017). These are the London (UK) Interdisciplinary Doctorate programme (LIDo), Tetrad PhD programme at UCSF, and the American Physical Society (APS) Bridge Programme (which has also increased female doctorates in physics). Proportion of minority ethnic students on PhD programmes overall at UCSF have also increased in the past five years (Office for Institutional Research). There may be other programmes that have also had success unknown to the author. Common to the success of these UK and US programmes is:
Removing admission exam criteria known to have an unexplained ethnicity award gap. APS Bridge and Tetrad (and 17/19 of UCSF programmes overall as of August 2020) have removed the Graduate Record Examinations (GRE) test, and LIDo have removed the highest undergraduate degree class (first class) as advantage for selection for interview or award of a PhD place. Many other US PhD programmes, particularly in the life sciences, are also removing the GRE from their selection criteria (Langin, 2019; see also https://beyondthegre.org/ for original studies and further information). It is also suggested that candidates’ names are removed from applications, which LIDo have had partial success with. However, an issue that remains is how to ensure 100% of referees use applicant number instead of name in their letters of recommendation.
Actively encourage minority ethnic students to apply. Both the LIDo and UCSF schemes have links with undergraduate institutions in which minority ethnic students are more likely to attend (minority-serving institutions in the US and low- and medium-tariff universities in the UK). The APS Bridge scheme links prospective PhD students with available places at a number of participating universities, supports their applications and mentors them afterwards. An added benefit of these schemes is that they incorporate opportunities for current doctorate students from minority backgrounds to act as role models in such a way that also contributes to their own career development.
Increase the competitiveness of historically marginalised and underrepresented minority ethnic candidates by removing other known barriers to their selection. Both LIDo and UCSF run salaried-summer research training schemes aimed at undergraduate students from minority ethnic backgrounds and other disadvantaged groups. In the UK, proportionally twice as many white (34.9%) than Black (16.3%) students attend the most research-intensive universities, whilst applicants from Asian ethnic groups are slightly more likely to have attended medium-intensive ones (HESA, 2020). These figures are almost exactly mirrored in the US: among its American citizens and permanent residents, proportionally twice the number of white (90%) than minority ethnic undergraduates (43%) attend research-intensive universities (estimated from table 2.1 available as separate source data from NSF, 2019b and data within NASEM, 2019). Yet prior research experience is one of the top criteria for selecting candidates for interview. The APS Bridge Scheme recognises that financial constraints disproportionally lower the competitiveness of applicants from minority ethnic groups and takes that into account when selecting candidates (Hodapp and Woodle, 2017).
In part, the success of these three programmes is due to the specific training that their recruitment panels receive, and that some use a common rubric rating scale for selecting applicants. Ethnic diversity on selection panels is also an ongoing concern – it directly relates to the high loss of potential senior academics early in the pipeline to professor (detailed in the introduction), and some universities (including UCL) are implementing initiatives to increase representation of minority ethnic staff on panels.
$10 million from the US National Science Foundation has now been awarded to extend the APS Bridge Programme to chemistry, geosciences, astronomy and material sciences. In the UK, Research England and Office for Students have also recently announced a joint funding call to support initiatives to increase access and participation for minority ethnic postgraduate research students, initially planned for release in Autumn 2020 (but delayed due to COVID-19).
Conclusion
Many caring academic and other university staff are driven to eliminate the unexplained, undergraduate degree award gap, but it is an immense challenge. What seems missing is sufficient and sustained investment to create enough time, resources and training for them to do so. In addition, there needs to be more funding (such as through an alliance of stakeholders) for scientific approaches to research the fundamental causes of this gap, and implement and identify which of the existing recommendations work.
Whilst the award gap persists, parallel actions on monitoring and changing recruitment practices are more widely needed across society in all jobs that employ graduates, to accelerate equal opportunity. Combining both sets of actions (Policies 1–5) will widen opportunity for increased numbers of BAME individuals to access the trajectory that leads to the more senior academic positions. This may positively feedback on itself, as students consider the lack of ethnic diversity among senior leaders as the number one cause of the gap (Amos and Doku, 2019).
Methods
Definition of terms and international variations
In the UK, BAME (and also BME) is a nationally used term to represent all ethnic groups within Black, Asian, mixed ethnicity and other minority ethnic individuals (which includes white minority ethnic groups). It is recognised here, that individuals have different opinions about using these terms. ‘Minority’ is relative to the country’s total demographic. Students select their own ethnicity when they enrol at university, standardised across UK higher education institutions (https://www.hesa.ac.uk/collection/c18051/a/ethnic).
In the US, underrepresented minority (also known as URM) is instead more widely used and can refer to ethnicity or other qualifier; where ‘underrepresented’ indicates proportionally fewer than the proportion of that group in the population as a whole. The US has a higher proportion of minority ethnic people (36% of the total population) compared to the UK’s 14%. BAME groups are broadly comparable to URM ethnic groups in the US. The exception are Asian groups which, whilst are minority groups in both countries, have variable degree award gaps when compared to white Americans, at least in medicine (discussed in Kleshinski et al., 2009), and score higher than white students in some other degree subjects (Alexander et al., 2009). Also Asian Americans, like white Americans, are overrepresented in PhD positions (Hodapp and Woodle, 2017; NSF, 2019a), which is linked to these two groups scoring higher than all other ethnicities (and Asian higher than white) in graduate record exams (Miller and Stassun, 2014). Other underrepresented minority ethnic groups also reflect regional populations in different countries.
Here, the term ‘award gap’, or ‘ethnicity award gap’ refer to the gap in scores awarded to different ethnic groups for their degree or its components. Note, in some other literature, the term ‘attainment’ or 'achievement' gap has also been used for this purpose. The term ‘good’ refers to award of one of the top two UK grade bands (first or 2i class) for the undergraduate degree or when assessing a component (for more details see An exploration of the award gap in cell biology courses at University College London).
The terms 'course' and 'module' are used interchangeably and refer to a single body of work within a degree.
It is recognised that in some fields, measuring the results of a survey would be considered a quantitative method. However, for clarity, in this study a strict definition of quantitative evidence is used, where the raw source of information is itself numerical (for example, marks awarded). If the original source is answering questions, recounting lived or other experience, or providing opinions such as in a survey, interview, discussion or other type of feedback, this is defined as qualitative in this study.
Students included and excluded from the study
UCL classifies a student as having completed a module if a non-zero mark is awarded for the module overall; and only these ‘completed’ students were included in the analysis. A small minority of included students (4.5%: 36/792) completed the course (non-zero mark awarded), but UCL did not return a mark for either the exam (35 students), or exam and coursework (one student). These are almost certainly authorised extenuating circumstances, which permits exclusion of the component from the final mark awarded to the student or delays in updating the student record. UCL assesses the final mark for these students based on the components that they complete and any other relevant material.
Hence in the figures, total student number in the categories of final mark, exam and coursework may vary slightly (see exact N in Figure 2—source data 1). For completeness (detailed further in An exploration of the award gap in cell biology courses at University College London), N = 8 students (included) directly joined the year 1–2 pathway at year 2.
Estimating number of students in the year 1–2 pathway that are in the year 3 study
From the year 2 data it was possible to determine how many students (112/250; 44.8%) in the year 1–2 pathway (cohorts 1–3) flowed into course A, B, or C in year 3. It was not possible to identify the year 3 destinations of the fourth cohort because these students had not yet completed their year 3 when records were extracted. The same proportion of 44.8% was used to approximate the number that would have flowed from the fourth cohort (44.8% of 94 year 2 students = 42). The exact N for each cohort is reported in Figure 2—source data 1.
From the year 2 data provided, it was not possible to track which students in the year 1–2 pathway took course D in year 3. However, using information on the degree programme that was included with the year 3 data, it was possible to identify a further 28 students that must have flowed from the year 1–2 pathway, resulting in a total of 182 (140 exact and 42 estimated) students that were in both studies.
Student cohorts, student flows and interrupted studies
All students in this study are undergraduate students and they could select whether to graduate with a bachelor’s (3 year course) or a master’s (4 year course) undergraduate degree.
Here, >99% (N = 787/792) of students stayed with their cohort. For ease of quantification for the <1% of students who interrupted their studies, the data in the figures, tables, source data and supplements are parsed by the academic year in which each individual student took each individual course.
Data extraction, research ethics and data protection
UCL department of Student Data extracted results from the university’s Student Record, which includes the ethnicity of each student. The identity of each student is not available from the datasets supplied to the author. UCL legal services advise that in the context of external publishing, the data is considered fully anonymised and aggregated and thus is exempt from UK General Data Protection 2018 and the super-ceded Data Protection 1998 legislation and from Record of Processing Activity statutory requirement. Hence, they further advise explicit consent is not required. Students give their general consent through a privacy notice that they agree to when enrolling at UCL. The notice explains that their data, including special category (in this case ethnicity) and their marks awarded may be processed (such as this work here), and the legal basis for doing so. Here, that basis is to meet UCL’s legal obligation of monitoring equality of opportunity and treatment (as is the case for all UK universities). Students may opt out of providing certain data such as gender and ethnicity and is recorded as ‘unknown’ by UCL.
UCL conditions to publish externally have been met: module code and precise titles are not provided, and undergraduate, PhD and postdoctoral data are anonymous and aggregated. The project is registered with UCL Data Protection and has UCL Research Ethics Committee approval (17663/001).
Cell biology assessed components
The exams were invigilated and for the year 1 cell biology courses were mainly multiple-choice questions (machine-marked, student identity-blind) and for the year 2 and year 3 cell biology courses mainly long-answer essays (manually marked, student identity-blind). Students did not see the exam in advance. Coursework comprised one or more of the following types of activities: lab practical work, open-book work questions, discursive pieces, and/or a project (all marked blind).
Quantification
In this study the following was calculated for the indicated cohort or course: the average A-level entrance tariff, proportion of each A-level grade awarded, the percentage of BAME and white students awarded a specified grade for different components of the course, and mean of all marks awarded to students on the course or in the cohort. The mean of all cohorts or courses in each year was then calculated along with the standard error of the mean (SEM). The difference in the mean percent of BAME and white students awarded a good mark (first or 2i) or first class mark-only was then used to determine the award gap for each year, except in the following case:
It was not possible to calculate the award gap in first class marks in this way for year two due to insufficient white and BAME students awarded first class marks in the exam component for each cohort. So instead the award gap was calculated based on the aggregated data of either three (cohorts 1, 2 and 3) or all four cohorts (noted in text).
Frequencies of raw marks awarded to BAME students were normalized to white students (Figure 3) by multiplying by factors 1.14–1.19 (provided in Figure 3—figure supplement 1—source data 1). This enabled fair comparison of these two ethnic groups where BAME student raw total population was smaller than white students.
Assessing significance of results
Due to the relatively small number of cohorts or courses studied for each year (N = 4), a statistical test of significance between the different award gaps between white and BAME students were not calculated and the raw data were evaluated instead, as recommended (Krzywinski and Altman, 2013; Vaux, 2012).
Attrition of BAME researchers occurs early in the academic trajectory to professor (Introduction)
This is an approximate guide as UK data, other than for undergraduates and full professors, are not precisely reported at the national level (discussed in Policy 5b). The academic trajectory was constructed from source data in section 3 of two reports published by AdvanceHE, which included all degree subjects and ethnicity of all UK academic staff and students (AdvanceHE, 2020a and AdvanceHE, 2020b).
Out of all the students and staff included in the report, the following percent self-identified as BAME: 23.69% of graduates (with a bachelor’s or undergraduate master’s degree); 18.07% of PhD students (proxy - PGR); 10.7% postdoc researchers (proxy – academic level K which includes researcher and research fellow, but also some other very junior academic staff); 10.9% of assistant professors (academic level J); 9.9% of associate professors (academic level I); 9.1% of full professors (level ‘5A’).
Tracing the evidence underlying recommendations on how to close the award-gap (Policy 2)
The type of evidence that informed the 197 recommendations summarised in Figure 4 was identified either from: ECU and HEA, 2008, Berry and Loke, 2011, Amos and Doku, 2019, or by back-tracing the evidence from other studies or reflective papers from participating higher education institutes, cited therein. These were carefully checked at the original source. Most recommendations seemed based on informal observation (74.62%; 147/197) and a few (4.57%; 9/197) could not be traced back to any obvious evidence. The other 41 recommendations were informed by data as described in the main text.
Ethnicity of respondents was not reported in 15/30 of surveys, interviews or discussions or other feedback included or cited in these three papers: ECU and HEA, 2008, Berry and Loke, 2011, Amos and Doku, 2019. Out of the 15 that did report ethnicity, 66.7% (10) only included responses from minority ethnic staff and students.
Calculation of UK funding of award gap research (Policy 3)
UK Government Office for Students (‘catalyst funding’) and university (typically ‘matched’ funding) was identified from ‘Addressing Barriers to Student Success Programme’, which also includes funds that are specifically aimed at reducing the award gap (10/17 projects).
UCL was part of the Kingston University-lead consortium, which funded development and production of the ‘UCL inclusive curriculum toolkit’ and a small team to provide data and advise faculty deans. Total funding for the ten projects was £9,183,471 to be spent over typically three years (March 2017- October 2019). The British Medical Council has awarded an additional £85,000 to individual researchers. There are 360,650 UK-domiciled, BAME undergraduate students in the UK (Higher Education Statistics Agency). Thus, UK government and other funding is £8.49 per BAME student per year (and the funding has now ended).
Calculation of funding per dementia patient (Policy 4)
The Dementia Discovery Fund is £250 million and there are about 850,000 dementia patients in the UK (as of 2021) giving £294 funding per patient.
COVID-19 statement
This study predates the COVID-19 pandemic and all data (including all citations) are of original assessments and degree classifications as they stood prior to universities changing them in March 2020 as a result of the pandemic.
Data availability
The study looked at individual academic results of human subjects and for legal reasons can only be published as aggregated data. The individual grades of each student are therefore not included. Raw values used to generate the figures in the article have been included in the source data. See the methods section for further details.
References
-
ReportImproving the Degree Attainment of Black and Minority Ethnic StudentsEquality Challenge Unit and Higher Education Academy.
-
ReportEthnicity, Gender and Degree Attainment Project: Final ReportEquality Challenge Unit and Higher Education Academy (Now AdvanceHE).
-
A bridge between undergraduate and doctoral degreesPhysics Today 70:50–56.https://doi.org/10.1063/PT.3.3464
-
Impact of preadmission variables on USMLE step 1 and step 2 performanceAdvances in Health Sciences Education 14:69–78.https://doi.org/10.1007/s10459-007-9087-x
-
ReportWomen, Minorities and Persons with Disabilities in Science and Engineering: 2019National Science Foundation.
-
Impact of supplemental instruction in entry-level chemistry courses at a mid-sized public universityJournal of Chemical Education 89:449–455.https://doi.org/10.1021/ed100337a
-
Ethnic and social disparities in different types of examinations in undergraduate pre-clinical trainingAdvances in Health Sciences Education 21:1023–1046.https://doi.org/10.1007/s10459-016-9676-7
-
Do underrepresented minority medical students differ from non-minority students in problem-solving ability?Teaching and Learning in Medicine 13:86–91.https://doi.org/10.1207/S15328015TLM1302_3
-
The mediators of minority ethnic underperformance in final medical school examinationsBritish Journal of Educational Psychology 83:135–159.https://doi.org/10.1111/j.2044-8279.2011.02060.x
Decision letter
-
Julia DeathridgeReviewing Editor; eLife, United Kingdom
-
Peter RodgersSenior Editor; eLife, United Kingdom
-
Tamsin MajerusReviewer; University of Nottingham, United Kingdom
-
Kaushika PatelReviewer; De Montfort University, United Kingdom
-
Juliet CoatesReviewer; University of Birmingham, United Kingdom
In the interests of transparency, eLife publishes the most substantive revision requests and the accompanying author responses.
Thank you for submitting your article "Alternative strategies to reduce the race-gap in undergraduate degree scores and career progression" to eLife for consideration as a Feature Article.
Your article has been reviewed by three peer reviewers, and the evaluation has been overseen by two members of the eLife Features Team (Julia Deathridge and Peter Rodgers). The following individuals involved in review of your submission have agreed to reveal their identity: Tamsin Majerus (Reviewer #1); Kaushika Patel (Reviewer #2); Juliet Coates (Reviewer #3).
We have discussed the reviews and drafted this decision letter to help you prepare a revised submission.
Summary
This work provides a detailed analysis of the differences in grades awarded to white and Black, Asian or Minority Ethnic (BAME) students on a cell biology degree at a university in the UK. Unlike previous studies, this paper does not just look at the overall degree mark but at the individual assessments that make up the degree, and finds that exams contribute the most to the 'award-gap' in the degree studied. Although this finding may not be representative of all degrees, the methodology provides a framework that can be used to investigate the award-gap of other courses or programs, beyond the sciences, which may also have multiple exam and coursework components. The paper also provides general policy recommendations that will be of interest to leaders of Higher Education Institutes (HEIs) who are engaged in identifying and implementing strategies for closing the awarding gap. However, there are also a number of points that need to be addressed to make the article suitable for publication.
Essential revisions:
1) In the policy recommendations there is a strong emphasis on research funding and increased staffing. However, much research has already gone into 'why' the attainment-gap exists, and the recommendations should focus more on how HEIs can improve the experiences of BAME students. We, therefore, suggest removing policy 3, and adding the following recommendations to policy 2:
a) To spend more funding and resources on interrogating every process of the academy: the curriculum, appointment processes, assessments, the training delivered around racism (would probably fit into policy 2a).
b) To provide more training for academic staff so they are better at recognizing and calling out the toxic behaviours often experienced by BAME students, such as microaggressions. BAME students acutely feel a lack of similar role models in the academy and lack a sense of belonging. We, therefore, need to work on building supportive communities that really listen to the experiences of BAME students and collaborates with them on the process of making academia more inclusive so that barriers can be removed compassionately (Atkinson 2002).
c) Academic staff should also receive mandatory training in how to assess and grade work, avoiding implicit bias (techniques other than anonymising which is a good start, might include clear, specific rubrics and mark schemes). There is a reason that multiple-choice exams marked by machines tend not to show a bias and in part that is because the answer is either right or wrong, not subjective. This could be added to policy 2a.
2) For policy 4 to work, we need to find people who believe they will benefit from the change and put them in positions of power. Race is an uncomfortable subject for many who are unwilling (consciously or unconsciously) to confront their privilege. It might be worth adding a comment to that effect.
3) Please incorporate the following suggestions into policy 5:
a) For policy 5b to include removing the requirement for a 1st class degree to get a PhD place and to do shortlisting for recruitment based on anonymous CVs.
b) More resource needs to go into the training and diversity of recruitment panels.
c) Encouraging more BAME applicants will require more visible role models at higher levels but there is a worry around overburdening the minority, and this may be worth discussing.
4) Please link policy recommendations to pre-existing charter marks/professional awards. The two that are obvious are the Race Equality Charter (REC) and the Teaching Excellence Framework (TEF). A major step forward would be to require a REC award and clear evidence of action and plans to eliminate award gaps as fundamental criteria for the TEF.
5) Please remove the term 'race-gap' from the title and elsewhere in the text.
Using the term 'race-gap' is problematic for two reasons: first, it implies that there is a gap in race, not award (some places the text uses race award gap). The other issue is with the term 'race' itself. Mostly 'ethnicity' is used and this is a 'better' term. 'Race' has a problematic definition and its use simply muddies waters that need not be muddied! Please, therefore, stick to using 'ethnicity' and 'award-gap' consistently throughout the manuscript.
6) Please can you clarify the description of A level grades obtained by BAME and White students on the cell biology course (lines 233-236).
From Figure 1 A it seems as if the vast majority of students got one A* and 2As. Whereas the text (lines 233-236) suggests that students got a mix of A* and As. On the face of it then this could vary from 3A* grades to 3A grades (via A*A*A, A*AA). This leaves one question unanswered (except possibly by presumption that virtually all students regardless of ethnicity got A*AA) and that is was there a difference if the top grades are divided into the 5 possible combinations? It would help if this detail could be added/explained. This is important because the conclusion (lines 239-241) is only robust if this underlying assumption is correct.
7) In the literature review, please include more detail on how the awarding gaps for BAME students impact their 'academic' career progression. This will help strengthen the overall aim of the manuscript.
8) Please add the following to the Limitations section:
a) The methodology is clear and can be replicated but only where a combination of coursework and examinations make up the assessment components. If a degree, module, or specific subject within a degree only utilises one assessment type then the methodology will either not be relevant or will need adaptation.
b) One limitation of the study is perhaps that the cohorts, degree streams, and course selection is very complex as many different types of students take cell biology courses. Although the data is analysed appropriately using two different approaches, it means that any nuances around achievement for students on different degree programs (who may experience differently supportive learning environments) are masked.
c) The manuscript also aims to identify how the alternative strategy will look to reduce gaps in career progression. Although the outcomes of the study demonstrate the differences in awarding based on component assessments, it is not specific with regards to challenges for career progression for BAME graduates. The narratives around the impact of the awarding gap and the recommendations and policies do provide a direct link to how changing assessment methodologies could improve outcomes and in time career progression but this could be considered as a 'by-product' of the alternative strategy.
9) Another limitation is that the data analysis focuses on 'good honours', a first or 2.1 degree. We have carried out similar (unpublished) analyses at my institution that suggest that the 'first class' awarding gap is much bigger than that for good honours. Would it be possible to analyse firsts-only? The current analysis suggests that marking coursework identity-blind (largely) eliminates the awarding gap but (again based on my own data analyses) I wonder if looking at firsts-only would tell a different story.
If this is not possible, please include it as a limitation of the study in the revised manuscript and explain why you have decided not to address it in your point-by-point response to this letter.
10) To disaggregate the ethnicity data. "BAME" is a blanket term that includes groups in addition to people of colour. Moreover, previous data shows that Black students tend to fare worse than, for example, Asian students. Could you specifically look at the awarding gap for Black students?
If this is not possible, please include it as a limitation of the study in the revised manuscript and explain why you have decided not to address it in your point-by-point response to this letter.
Note: Here for your information are the original reviews, from which the above list of major comments have been taken.
Reviewer #1:
This is a very interesting and timely paper, discussing the important issue of the 'award gap' which is clearly an issue impacting on degree outcomes as well as career progression and opportunity. The paper provides welcome subject-level consideration and generalised policy recommendations to address the issues discussed. I absolutely think it should be published subject to the author addressing a small number of suggested corrections/amendments.Reviewer #2:
This manuscript will be of interest to all academics and leaders of Higher Education Institutes (HEIs) who are engaged in identifying and implementing a ranges of strategies for closing the awarding gap. The data presented in the manuscript clearly provides a basis for the full range of degrees who assess via both examination and coursework to consider the marking differentials between the two methods and their impact on either maintaining, worsening or closing the awarding gap.
The manuscript has the potential of significant impact across a range of degrees, beyond the sciences, due to its exploration of marks at component level and through the comparison of exams and coursework. It does provide a methodology which can be readily replicated across other disciplines and institutions.
A challenge to be considered is the emphasis within the recommendations (policies) around research funding and increased staffing. A great deal of insight has already been achieved with one of the key areas of focus landing on the levels of cultural competence and feelings of identity and belonging which need to be developed and improved within HEI's which although recognised within the recommendations does feature as less significant.
This manuscripts provides a clear overview of the 'race awarding' gap issue within western institutions and provides a clear outline of the range of research undertaken over a 10 year period with little progression in closing the race awarding gap.
The manuscript aims to identify alternative strategies in reducing the gap and certainly the methodology used, as outlined, does provide a different perspective in looking at assessment components. The methodology is clear and can be replicated but only where a combination of course work and examinations make up the assessment components. If a degree, module or specific subject within a degree only utilises one assessment type then the methodology will either not be relevant or will need adaptation.
The manuscript also aims to identify how the alternative strategy will look to reduce gaps in career progression. The outcomes of the study do demonstrate the differences in awarding based on component assessments but what the strategy does not do is be more specific with regards to challenges for career progression for BAME graduates. The narratives around the impact of the awarding gap and the recommendations and policies do provide a direct link to how changing assessment methodologies could improve outcomes and in time career progression but this could be considered as a 'by product' of the alternative strategy.
The HEI sector is currently becoming more aware of issues of racial inequality and the impetus generated by the Black Lives Matter movement both here and across the world has provided a spotlight on these racial inequalities in all sectors and particularly in higher education where the discrimination exacerbates overall life chances of a significant part of the university population. And so although the awarding/attainment gap has been researched, reviewed and action planned for many many years the BLM spotlight has provided a new energy and drive to address this significant inequality with a new and particular focus over the last few years away from the 'student deficit' model and more towards the 'institutional responsibility' model. So in this very current context this work will be particularly relevant in the wider 'race equality' context the sector finds itself in.
The manuscript would be strengthened to deliver on its aim if the connection to awarding gaps for BAME students and their 'academic' career progression were emphasised more in the literature review.Reviewer #3:
This paper provides a detailed breakdown of the awarding gap between BAME students and white students on a cell biology degree programme (with multiple pathways) at a single institution with a large BAME population. This detailed analysis shows that the biggest awarding gap lies in the exam component of the assessment and suggests some policies to close the gap going forward. There are some limitations to the analysis (should include first class marks as well as good honours) and suggested policies (e.g. vagueness around asking for funding) that I will address in detail in my review.In this study, the author examines the awarding gap that exists between BAME students and white students on cell biology degree programs. Unlike previous studies, the research does not just look at overall degree classification but examines individual assessments that make up the degree. The research concludes that it is specifically the exam component of assessment that contributes towards the awarding gap in Cell Biology degrees at UCL. Although these conclusions may not be representative of all programmes and institutions, the study provides a welcome framework to enable others to carry out this kind of detailed analysis if they have not started doing so already and shows that it is possible to carry out these analyses even in complex degree streams and pathways. From the data analysis, clear policy recommendations are put forward although I would caution against advocating more funding into research around 'why' the gap exists and instead repurpose such money for investing in proper resource to tackle the problem including by creating compassionate communities within institutions of BAME students working together with allies who have the power to instigate change.
Specific points – strengths, and issues to address, around data analysis.
1) The introduction sets the context for the pervasive awarding gap (and other factors that may contribute to it) extremely well and raises the issue of variability between subjects.
2) The data is collected from seven student cohorts across all three years of the degrees, including only students who completed the course. All marking for this dataset was carried out by machine or candidate identity-blind, which is a strength of the institution's assessment process as it eliminates human bias, conscious or unconscious.
3) One limitation of the study is perhaps that the cohorts, degree streams, and course selection is very complex as many different types of students take cell biology courses. Given that, the data is analysed appropriately using two different approaches, but that does mean that any nuances around achievement for students on different degree programs (who may experience differently supportive learning environments) is masked.
4) Another limitation is that the data analysis focuses on 'good honours', a first or 2.1 degree. We have carried out similar (unpublished) analyses at my institution that suggest that the 'first class' awarding gap is much bigger than that for good honours. Would it be possible to analyse firsts-only? The current analysis suggests that marking coursework identity-blind (largely) eliminates the awarding gap but (again based on my own data analyses) I wonder if looking at firsts-only would tell a different story. I think that this would be an important addition to the study.
5) I wonder if it is also possible (as this is a large dataset) to disaggregate the ethnicity data. "BAME" is a blanket term that includes groups in addition to people of colour. Moreover, previous data shows that Black students tend to fare worse than, for example, Asian students. Could we specifically look at the awarding gap for Black students is the largest?
6) A thought about the statistical analysis: a t-test is not appropriate for non-parametric (%) data unless normality has been tested for or a correction has been applied. Has this been done? It is not clear from the methods.
7) Showing figure 2c as continuous data points joined by a line is unclear: it would be more consistent to use bars as in Figure
Some thoughts about the discussion and policy recommendations.
I absolutely agree with the suggestions of policy 1 and policy 2. However, Policy 3 needs to be careful and specific otherwise it is not convincing to "Increase Direct Funding to Research the Factors that Cause the Award Gap", in fact I would be tempted to remove this section and expand Policy 2 as outlined in the next couple of paragraphs.
Much "why" research has already been carried out over the last 30 years that all points in the same direction: there are huge systemic, structural barriers that are put in place by people of privilege and power that disadvantage BAME students in education and the problems start before University, although are reinforced in higher education. It is the 'business as usual' approach has to change as this is what causes the problem (see, for example, much of David Gillborn's research including Gillborn et al. (2017)). Racism is subtle, common and can be well intentioned/paternalistic ('we know best how to fix you'). Funding and resource would be better spent on Policy 2 and in addition an interrogation of every process of the academy: the curriculum, appointment processes, assessments, the training delivered around racism – this would probably fit under Policy 2a.
More thoughts on Policy 2a: We need to resource local support that involves the relevant students. Building supportive communities is key. We need to really listen to student experiences of all the academy's processes and involve students in the process of change as collaborators so that barriers can be removed compassionately (Atkinson 2002). My own anecdotal listening plus institutional training shows that BAME students are subject to daily micro-aggressions and more training is needed to increase the number of allies who are confident to call out toxic behaviour. BAME students acutely feel a lack of similar role models in the academy and lack a sense of belonging. Thus, changing recruitment processes is a key step (see policy 5 below).
For policy 4 to work, we need to find people who believe they will benefit from the change and put them in positions of power. Race is an uncomfortable subject for many who are unwilling (consciously or unconsciously) to confront their privilege. It might be worth adding a comment to that effect.
Policy 5: I absolutely agree. I would advocate for policy 5b to include removing the requirement for a 1st class degree to get a PhD place (this is partly why I made my earlier point about extending the data analysis beyond good honours if at all possible) and to do shortlisting for recruitment based on anonymous CVs. More resource needs to go into the training and diversity of recruitment panels. Encouraging more BAME applicants will require more visible role models at higher levels but there is a worry around over burdening the minority with this work perhaps this could be discussed a little too.
References:
Atkinson J (2002) Trauma Trails, recreating song lines: The transgenerational effects of trauma in indigenous Australia p.13-17 (Spinifex Press).
Gillborn D et al. (2017) Moving the goalposts: Education policy and 25 years of the Black/White achievement gap. British Educational Research Journal 43 p.848-874.
https://doi.org/10.7554/eLife.58971.sa1Author response
[Editor’s note: Further changes were made following revisions to the manuscript in response to queries and discussions with the editor. As a result, some of the comments below may differ from the published version of the article.]
Essential revisions:
1) In the policy recommendations there is a strong emphasis on research funding and increased staffing. However, much research has already gone into 'why' the attainment-gap exists, and the recommendations should focus more on how HEIs can improve the experiences of BAME students. We, therefore, suggest removing policy 3, and adding the following recommendations to policy 2:
a) To spend more funding and resources on interrogating every process of the academy: the curriculum, appointment processes, assessments, the training delivered around racism (would probably fit into policy 2a).
b) To provide more training for academic staff so they are better at recognizing and calling out the toxic behaviours often experienced by BAME students, such as microaggressions. BAME students acutely feel a lack of similar role models in the academy and lack a sense of belonging. We, therefore, need to work on building supportive communities that really listen to the experiences of BAME students and collaborates with them on the process of making academia more inclusive so that barriers can be removed compassionately (Atkinson 2002).
c) Academic staff should also receive mandatory training in how to assess and grade work, avoiding implicit bias (techniques other than anonymising which is a good start, might include clear, specific rubrics and mark schemes). There is a reason that multiple-choice exams marked by machines tend not to show a bias and in part that is because the answer is either right or wrong, not subjective. This could be added to policy 2a.
As suggested these reviewer recommendations around funding (1a), resources (1a) and training (1a-c) have been incorporated into extended Policy 1 (old Policy 2) and elsewhere: addition to Policy 4; new Figure 4; within the main conclusion. In the original manuscript previous recommendations on how to close the award-gap were restricted as a whole to citations of previous studies to enable the current manuscript to focus on new ideas. However, the point is well taken that may have inadvertently given less space to a key anchor “Widespread or sustained delivery of the reported solutions can’t be working sufficiently then…” which is now addressed.
Of note, a critical objective in the revised manuscript was to fully meet these reviewer suggestions on previous recommendations, but also to ensure the manuscript simultaneously remained focused on addressing “why the award-gap is only closing slowly”.
This aim seems met by providing a summary of all previous recommendations distributed by category (new Figure 4). This was achieved by careful assessment and quantification of three, major substantive reports representing the past decade (nearly 200 recommendations). In addition, it was thought important to capture substantive previous work in a balanced way (to represent across all ideas as well as the reviewer ones suggested) and this is reflected in Figure 4.
New Figure 4 explicitly includes the category suggested by the reviewer (comment 1, improve the experiences of BAME students).
In new Figure 4, legend non-exhaustive examples of the top three categories of previous recommendations (infrastructure, student experience, teaching and learning) are listed. The reviewer suggestions to provide resources and training (reviewer comments 1a-c), are included as important examples within this list, and specifically all the ones listed by the reviewer in 1a-c.
The reviewer comment, “Spend more funding…” (start of comment 1) is taken to mean invest in existing recommendations to ensure resources and training (comment 1a-c) is implemented, is now an explicit part of the revised version: raised as an issue in the introduction to the policy section; in the title of Policy 1; in the introduction to Policy 1; in the content of new Policy 1d; and in the title and content of modified Policy 4.
Responding to the other part of reviewer comment 1 “…much research has already gone into 'why' the attainment-gap exists…” and “We, therefore, suggest removing policy 3,..”.
This comment is understood; there has been a lot of research and these were cited for example in the original manuscript and now stated more directly in the revised version “At first glance it may appear there is plenty of evidence on causes of the award-gap… However, on closer inspection there seem two large gaps in the evidence base.”
In retrospect perhaps, more details on how these evidence-gaps were originally identified and more clarity on the concept of ‘unexplained’ ethnic award-gap would have been helpful and both these are now expressed more clearly in the revised version.
Unexplained ethnic degree award-gap: Previous research (cited in the introduction) tested >20 different external factors (for example, poverty, age, study habits, type of previous school) as possible explanations for why the ethnic degree award-gap exists, but found that a large gap remained; this larger gap is known as the unexplained award-gap. It is thought to arise through being at university and is the one that universities have been charged to remove and the focus of the manuscript. This is now made more explicit in the introduction (literature review) of the revised version and in the introduction to the policy section.
Gaps in the evidence base: it is now made explicit, that gaps in the evidence are around those that seek causes of the unexplained (university-driven) award-gap: in the introduction to the policy section; in the title of new Policy 2 (old Policy 3); in the titles of new Figures 4 and 5. These identified gaps in the evidence are limited diverse types of evidence (in particular quantitative as defined by the raw data is numerical) and limited scientific approaches as defined by the principle of conducting a ‘fair test’; both these are reflected in the new title to Policy 2.
How limited diverse types of evidence and limited scientific approaches were identified:
i. Limited quantitative approaches were identified by careful and thorough mapping the types of evidence that underlies ~200 recommendations, representative of the past decade (new Figure 5), which have previously suggested to universities how to reduce the unexplained award-gap (new Figure 4).
Please note, it is acknowledged in the revised manuscript that “Clearly, much has been quantified, particularly the size of award-gaps, however to date this has almost exclusively been used as evidence that the problem exists, as a benchmark or as attempts to identify the size (if any) of a number of potential, contributory external factors […] Yet, these do not in themselves identify the larger, university-driven (unexplained) causes of the gap.”
Note it is also acknowledged in the revision, that whilst this investigation has identified that quantitative approaches seem under-represented in seeking causes of the unexplained gap (it was found to be only ~0.5% of the evidence base), it is also made plain in the text to Policy 2, that the existing main evidence (qualitative: as defined by the raw data is dialogue with students and staff) are critical too. The point is that to close the unexplained gap faster (one of the main aims of the paper) likely requires a balance in quantitative and qualitative approaches.
ii. When this research was started, there did not seem many other scientific approaches in the literature. This was also recently observed by a large collaboration between the National Union of Students, Universities UK and 99 HEIs. Baroness Amos and Amatey Doku conclude “Universities need to take a far more scientific approach to tackling the attainment gap…” as one of the top 5 outstanding actions required to successfully reduce the award-gap (page 2 in Amos and Doku 2019).
There are several benefits to increasing the diversity of approaches and scientific evidence: they have the potential of contributing to reducing the award-gap in ways less amenable by other methods; one example is the findings in this paper (Figure 1-3) another is facilitating impact-evidence on what works, and equally important can guide prioritisation of allocation of valuable resources (for further details, please see Policy 2).
This manuscript might contribute to awareness that these gaps in the evidence base seem to exist; but practically, funding is required to address it. This is highlighted in modified original Policy 3 and it is then suggested that creation of a funding alliance could generate the necessary funds in Policy 4.
Note, it is also suggested in the revised version that this alliance could also be used to fund the implementation of existing recommendations and resources (as raised by the reviewer in comment 1) and scientifically test which ones work.
2) For policy 4 to work, we need to find people who believe they will benefit from the change and put them in positions of power. Race is an uncomfortable subject for many who are unwilling (consciously or unconsciously) to confront their privilege. It might be worth adding a comment to that effect.
Absolutely. In the original manuscript it was proposed that the Nuffield Foundation house such an alliance, exactly for this reason. The revised text now makes plain this point, “Strong leaders who believe what society has to gain from such an alliance are required for success; it is proposed then to take advantage of a pre-existing structure such as the UK’s Nuffield Foundation, which already seems to demonstrate such a belief both in its strategy document 2017-2021 and it its funding of projects widely across education, welfare and justice; their housing of the suggested alliance may speed up its creation.”
3) Please incorporate the following suggestions into policy 5:
a) For policy 5b to include removing the requirement for a 1st class degree to get a PhD place.
This was in the original text, it is now rephrased to make clearer: “…have removed the highest undergraduate degree class (1st class) as advantage for selection for interview or award of a PhD place (LIDo)”.
And to do shortlisting for recruitment based on anonymous CVs.
This is an important point and has been attempted by some PhD programmes. To address the reviewer’s point, a sentence has been added to policy 5b: “It is also suggested that candidates’ names are removed from CVs and LIDo have had partial success with anonymous CVs; the main issue remaining is how to ensure 100% of referees use applicant number instead of name in their letters of recommendation.”
b) More resource needs to go into the training and diversity of recruitment panels.
This is now added to a new section in policy 5b:
“(iv) In part, the success of these three programmes is that there seems specific training of recruitment panels and at least for some, a common rubic for selection of applicants. Diversity on selection panels is an ongoing concern – it directly relates to the high loss of potential senior academics early in the pipeline to professor (detailed in the introduction) and some universities (including UCL) are implementing initiatives to increase representation of minority ethnic staff on panels.”
c) Encouraging more BAME applicants will require more visible role models at higher levels but there is a worry around overburdening the minority, and this may be worth discussing.
Role models seem inherently part of the success of policy 5bii (establishing relationships between highly competitive PhD programmes and HEIs where minority ethnic undergraduate students are more likely to attend) and appear to work without any sense of overburden. At UCSF, minority (and other) ethnic doctorate students have the opportunity to visit minority serving colleges, some of which were their own undergraduate colleges to reinforce the cycle of success in informal ambassador type roles. At Bridge, there is a cycle of visible mentorship which seems to function in a similar way. At LIDo PhD students serve as ambassadors at interview days and mentor undergraduate students on summer placement schemes, whom are recruited mainly from lower tariff universities. Space limitations probably preclude these details, however the point is noted and encompassed in additional text: “An added benefit of these schemes is that they incorporate opportunities for current minority ethnic doctorate students on the PhD programmes to act as role models in such a way that also contributes to their own career development.”
4) Please link policy recommendations to pre-existing charter marks/professional awards. The two that are obvious are the Race Equality Charter (REC) and the Teaching Excellence Framework (TEF). A major step forward would be to require a REC award and clear evidence of action and plans to eliminate award gaps as fundamental criteria for the TEF.
There is some hesitation here from the experience of working on the Athena Swan (AS) charter marks (our department was one of the first in the UK to receive Gold in 2016 and was awarded Gold again in 2020). What seems to have been discussed at AdvanceHE (who run the AS and RE charter marks) is the acknowledgement of substantial and disproportionate burden on female staff engaging in the AS charter mark work (which is very high). Without explicitly linking contributions to these charter marks to promotion criteria, may result in similar disproportionate overburden for minority ethnic staff working on the REC/TEF. Some (if not all) HEIs include an expectation of citizenship in promotion applications, however there seems variability – both to the weighting/clarity of how much that work counts to promotion and that some HEIs do not appear to permit promotion on contribution to citizenship alone.
Another possible idea is to link the REC as a requirement to grant applications. However, that too has now changed; whereas a silver AS award was required, some participating grant award bodies have now (reported locally in 2020) withdrawn the requirement, no reason was given; possibly connected to disproportionate load or other reasons.
The reviewer suggestion could work very well (gains in reducing the gender professor-gap may have come from similar links in the AS charter marks), however space would be required in the manuscript to discuss these other significant factors.
(Somewhat related, however, the REC and fellow of HEA awards are now linked to a point in Policy 2).
5) Please remove the term 'race-gap' from the title and elsewhere in the text.
Using the term 'race-gap' is problematic for two reasons: first, it implies that there is a gap in race, not award (some places the text uses race award gap). The other issue is with the term 'race' itself. Mostly 'ethnicity' is used and this is a 'better' term. 'Race' has a problematic definition and its use simply muddies waters that need not be muddied! Please, therefore, stick to using 'ethnicity' and 'award-gap' consistently throughout the manuscript.
Ethnic is used throughout the manuscript, other than where it is a title such as Race Equality Charter.
6) Please can you clarify the description of A level grades obtained by BAME and White students on the cell biology course (lines 233-236).
From Figure 1 A it seems as if the vast majority of students got one A* and 2As.
Indeed, the average tariff was the equivalent of A*AA for almost all students. This is now directly shown in new Figure 1A. To be able to determine the average entrance score for each individual student, grades were converted to the UK standard tariff of: A* = 56; A = 48; B = 40 (no student obtained lower than a B), then the cohort mean determined:
“The mean admission tariff for these BAME (50.53+/- 0.15) and White (50.29+/- 0.33) students were virtually identical (Figure 1A): the equivalent of nearly all students in each of these ethnic groupings gaining one A* grade and two A grades (which would be a mean tariff of 50.7). These data are very similar to the mean entrance tariff for all BAME (50.27 +/-0.06) and all white (50.03 +/- 0.01) students at UCL who enter with A levels for the same cohort years as these cell biology students (2013, 2014, 2015 entrants), thus in this context cell biology students in this study are typical for the university.”
Whereas the text (lines 233-236) suggests that students got a mix of A* and As. On the face of it then this could vary from 3A* grades to 3A grades (via A*A*A, A*AA).
It is realised that the description here could have been confusing. What was quantified is the total number of each grade to each cohort (in other words what was the total number of A grades awarded to all the BAME students entering in 2013, then in 2014, 2015 and repeated for all the different grades). The text is now rephrased and the data is now in Figure 1B, as:
“An alternative approach to assess admission qualifications is to look at the distribution of the total number of each individual grade (A*, A, B, C or lower) awarded across each cohort: as expected distributions for BAME and White students were nearly identical (Figure 1B); of the total grades awarded to BAME students 95.45% +/- 1.01 were A* or A, and to White students this figure was 95.02% +/- 0.61 (Figure 1C).”
This leaves one question unanswered (except possibly by presumption that virtually all students regardless of ethnicity got A*AA) and that is was there a difference if the top grades are divided into the 5 possible combinations? It would help if this detail could be added/explained. This is important because the conclusion (lines 239-241) is only robust if this underlying assumption is correct.
A*AA was the equivalent tariff for virtually all students; please see new data in new Figure 1A, described above.
7) In the literature review, please include more detail on how the awarding gaps for BAME students impact their 'academic' career progression. This will help strengthen the overall aim of the manuscript.
More details have been provided, in particular: how loss of potential minority ethnic professors is directly linked to less competitive undergraduate degree scores, is more clearly explained; and more details on how selection criteria for PhD positions (which create barriers for minority ethnic students) is directly linked to data and suggested actions in the paper. Other changes to the title, abstract and introduction to the policy section also help strengthen the overall aim of the manuscript in this context.
8) Please add the following to the Limitations section:
a) The methodology is clear and can be replicated but only where a combination of coursework and examinations make up the assessment components. If a degree, module, or specific subject within a degree only utilises one assessment type then the methodology will either not be relevant or will need adaptation.
The limitations section has been modified to incorporate the reviewer comment:
“The study is restricted to certain courses at one university. The wider applicability of the written exam and coursework findings, require testing in cell biology in other universities and in other subjects across institutions. Most degree subjects (if not all) are composed of different types of activities and assessed components, the method described here is also envisaged to be readily adaptable to look systematically at whichever ones are relevant to any particular subject.”
b) One limitation of the study is perhaps that the cohorts, degree streams, and course selection is very complex as many different types of students take cell biology courses. Although the data is analysed appropriately using two different approaches, it means that any nuances around achievement for students on different degree programs (who may experience differently supportive learning environments) are masked.
This good point seems more appropriate for the Discussion section as relative award-gap sizes are not limited when comparing the exam and coursework components to each other; the same student on their particular degree pathway would be in the same learning environment for both components. However different supportive environments may explain relative gap-sizes when comparing the same component-type between year-1, -2 and year-3 cell biology courses. This possibility has been added to other possibilities in the discussion that might explain relative gap-size in this context:
“It is also not yet possible to distinguish whether precise size of the exam and coursework award-gaps comparing the same component across the different year-1, -2 and year-3 cell biology courses (observable in Figure 2E, compare years; and perhaps also Figure 2D) is a manifestation of a difference in the precise curriculum activity on that course or how it is delivered or for example, other factors such as supportive environments that students may encounter differently on different degree routes or several of these factors combined.”
c) The manuscript also aims to identify how the alternative strategy will look to reduce gaps in career progression. Although the outcomes of the study demonstrate the differences in awarding based on component assessments, it is not specific with regards to challenges for career progression for BAME graduates. The narratives around the impact of the awarding gap and the recommendations and policies do provide a direct link to how changing assessment methodologies could improve outcomes and in time career progression but this could be considered as a 'by-product' of the alternative strategy.
This has been addressed by clarifying the aims of the paper in the title, abstract, introduction and policy section and more clearly describing direct links between the award-gap and academic progression (as explained in response to comment 7). In brief, one of the main purposes of the paper is to provide an account of ‘what works’ to increase academic career progression and to convey the concept of the need for parallel action. In other words, careers matter now; hence it is suggested to i) address the award-gap by asking what could speed progress which, in time would then directly contribute to career progression, as noted by the reviewer; and ii) whilst the award-gap still exists also take parallel (separate) action on addressing the career-gap directly. In the USA funding schemes to promote academic career progression for example seem more widely developed and discussed (cited in the paper).
Please find an extract from the revised introduction, as an example of how these comments have been addressed: “Then by focusing on asking the question of why the UK ethnic award-gap is only shrinking very slowly, some likely causes of the slow pace are identified. […] Given this award-gap directly reduces chance of career progression, dialogue with PhD programme organisers or analysis of published initiatives that have successfully increased proportion and retention of under-represented, minority ethnic doctorial students are also presented.”
9) Another limitation is that the data analysis focuses on 'good honours', a first or 2.1 degree. We have carried out similar (unpublished) analyses at my institution that suggest that the 'first class' awarding gap is much bigger than that for good honours. Would it be possible to analyse firsts-only? The current analysis suggests that marking coursework identity-blind (largely) eliminates the awarding gap but (again based on my own data analyses) I wonder if looking at firsts-only would tell a different story.
If this is not possible, please include it as a limitation of the study in the revised manuscript and explain why you have decided not to address it in your point-by-point response to this letter.
This has been addressed with a substantial new body of work in the year 2 and year 3 cell biology courses (Figure 3 and Figure 3—figure supplement 1). The possibility of potentially hidden larger, coursework award-gaps was tested in the original manuscript, however a considerably deeper and wider test going beyond 1st class grades, seeking any hidden gaps in the entire range of marks awarded from <30% to 100% in 5% intervals was performed and no larger gap in the coursework could be found (Figure 3, compare histograms).
As expected from these frequency distributions, the coursework award-gap remains small in either the analysis of 1st class marks-only or all good marks combined and at least 2-fold smaller than the exam award-gap (which is also smaller at 1st class marks-only) and the coursework award-gap at 1st class-marks is not significant (Figure 3—figure supplement 1; Figure 3—figure supplement 1-Source data 1).
It was not feasible to fully assess year 1-cell biology though there was also no significant gap in the coursework in 1st class marks in the available data and this is explained in the limitation of the study.
Overall, these new analyses and the original ones strengthen the view that the award-gap in these 6 cell biology courses is largely derived from the exam.
It was not possible to compare these new data to the unpublished work the reviewer mentioned, however, the UK average is that the award-gap at the level of 1st class marks-only is smaller than at all good marks (AdvanceHE 2019b) which is consistent with the findings in these cell biology courses (above) (Figure 3 and Figure 3—figure supplement 1). None-the-less an assessment of other UK statistics (also in AdvanceHE 2019b) and other data at UCL, both looking at a finer grain reveals that there are at least 5 different patterns evident on the relative contribution from 1st class marks and 2i marks to the overall ethnic award-gap in good grades – and one of these other patterns might be consistent with the unpublished data mentioned by the reviewer. This might be expected when looking at a finer grain (and this point and the existence of these 5 other patterns is acknowledged in the new version of the manuscript).
10) To disaggregate the ethnicity data. "BAME" is a blanket term that includes groups in addition to people of colour. Moreover, previous data shows that Black students tend to fare worse than, for example, Asian students. Could you specifically look at the awarding gap for Black students?
If this is not possible, please include it as a limitation of the study in the revised manuscript and explain why you have decided not to address it in your point-by-point response to this letter.
3% of the population has a Black ethnic background (2011 Census) similar to the ~2% of the cell biology students in this study. The study-size would therefore have to be far larger to be able to assess Black ethnic students-only. Some preliminary findings are reported in the limitation section of the paper:
“Preliminary data, which is consistent with the UK pattern, looking at year-3 cell biology courses, the proportion of Black students awarded good grades for the final course mark (~38%) and for the exam (~38%) was up to 2-times lower than all minority ethnic students (BAME) for these two components (72.7% +/- 3.7 and 64.1% +/- 2.6 respectively). However, the proportion of Black students awarded good grades for cell biology coursework (~87%) was at least equally as high as all BAME students (82.1% +/- 2.0) and White students (87.5% +/- 1.5).”
https://doi.org/10.7554/eLife.58971.sa2Article and author information
Author details
Funding
No external funding was received for this work. The UK Medical Research Council, grant code MCU12266B provided space to write parts of the manuscript.
Acknowledgements
Many thanks to Nadine Mogford, the Tetrad PhD programme office and Frank Bayliss for sharing data and details of their successful efforts to increase the proportion of minority ethnic students on the LIDo and UCSF PhD programmes, respectively. Thank you Lucy Newman for data on recruitment of PhD students to LMCB programmes. Data shared was either final impact (Nadine Mogford) or raw (all others) which were then quantified. Thanks to Kath Woolf for sharing background information in medicine, and Claire Herbert for the idea to refer to the ‘attainment gap’ as an ‘award gap’ (abstract, UK Education Conference 2019). Also, thanks to Ijeoma Uchegbu and Charmian Dawson for discussion on the UK award gap and Frank Bayliss for additional resources on the GRE; and Ijeoma Uchegbu, Rob de Bruin and Haley Flower for helpful comments on the manuscript.
Ethics
Human subjects: No explicit consent was required. This is described in detail in its own section in the methods.
Publication history
- Received:
- Accepted:
- Version of Record published:
Copyright
© 2021, Cramer
This article is distributed under the terms of the Creative Commons Attribution License, which permits unrestricted use and redistribution provided that the original author and source are credited.
Metrics
-
- 5,165
- views
-
- 388
- downloads
-
- 13
- citations
Views, downloads and citations are aggregated across all versions of this paper published by eLife.
Citations by DOI
-
- 13
- citations for umbrella DOI https://doi.org/10.7554/eLife.58971
Download links
A two-part list of links to download the article, or parts of the article, in various formats.
Downloads (link to download the article as PDF)
Open citations (links to open the citations from this article in various online reference manager services)
Cite this article (links to download the citations from this article in formats compatible with various reference manager tools)
Equity, Diversity and Inclusion: Alternative strategies for closing the award gap between white and minority ethnic students
eLife 10:e58971.
https://doi.org/10.7554/eLife.58971


