Meta-Research: A retrospective analysis of the peer review of more than 75,000 Marie Curie proposals between 2007 and 2018
- Research Executive Agency, European Commission, Belgium
- Department for Research in Biomedicine and Health, University of Split School of Medicine, Croatia
- Department of Psychology, University of Split School of Humanities and Social Sciences, Croatia
Figures
Figure 1
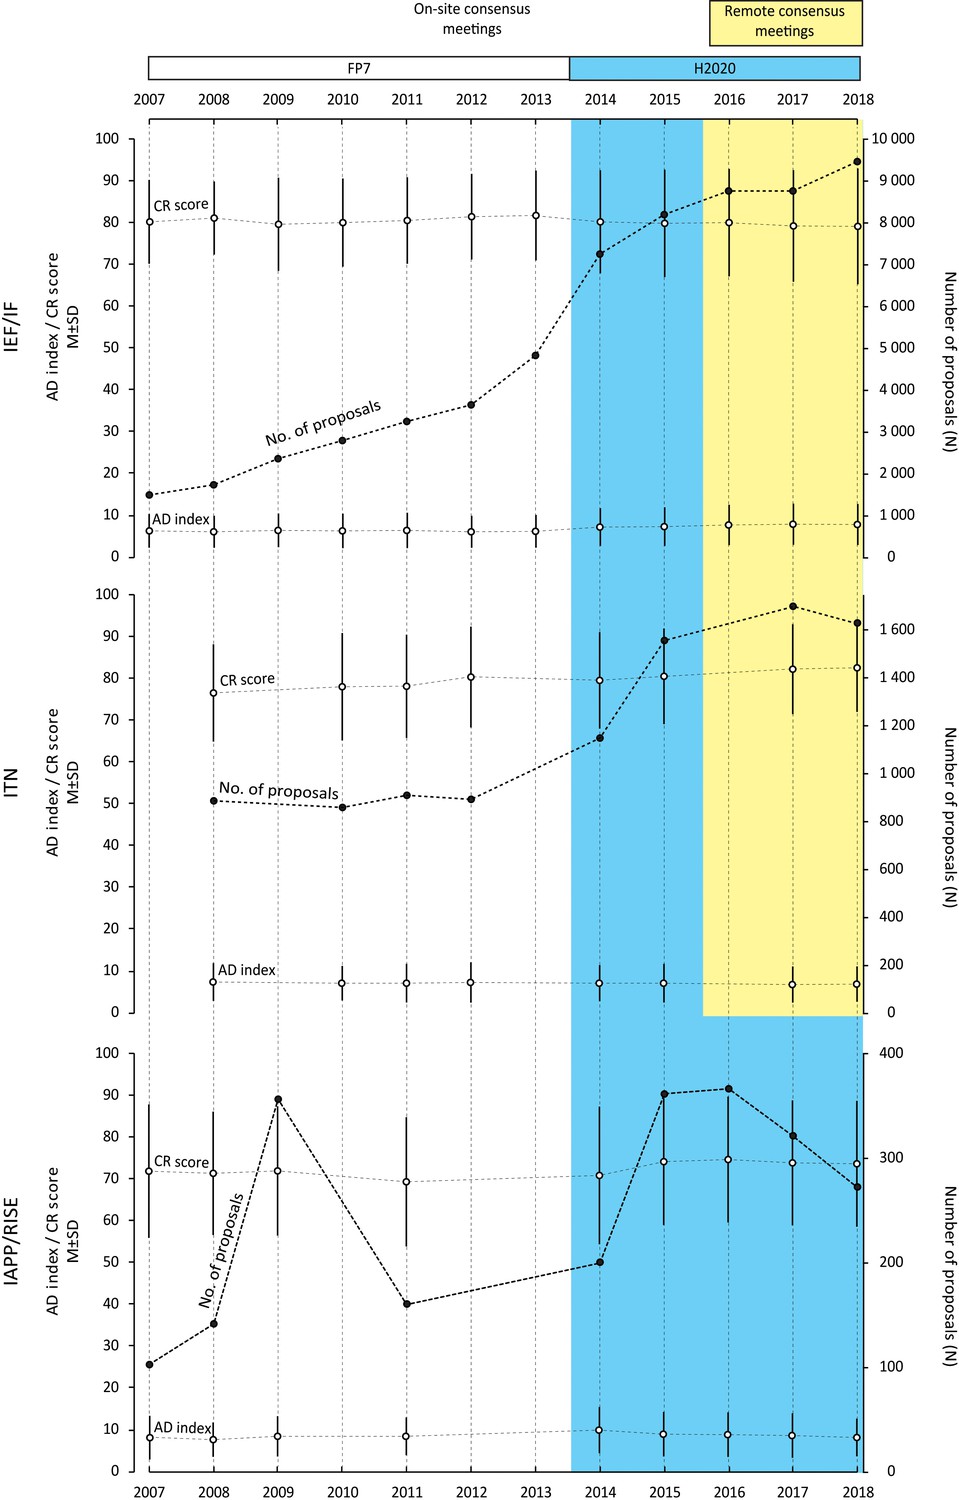
Number of proposals, CR scores (mean and SD) and AD indices (mean and SD) for the three different Marie Curie actions between 2007 and 2018.
We studied 75,624 proposals evaluated under the EU's Marie Curie funding programme between 2007 and 2018 to investigate if two changes to the way peer review is organized – a reduction in the number of evaluation criteria in 2014, and a move from in-person to remote consensus meetings in 2016 – influenced the outcome of the peer review process. In the white region (which corresponds to FP7) four or more criteria were used to evaluate proposals and consensus meetings were in-person. In the coloured region (which correspond to H2020) three criteria were used to evaluate proposals: consensus meetings remained in-person in the blue region, but became remote/virtual in the yellow region. The Results section describes how the three Marie Curie actions (IEF/IF, ITN and IAPP/RISE) changed over this period. Data for certain calls were not considered for the following reasons. ITN 2007: organized as a two-stage evaluation process; ITN 2008 and IAPP 2010: no calls organized for these years; ITN 2013, IAPP 2012 and IAPP 2013: data not accessible for technical reasons; ITN 2016: organized with four reviewers per proposal.
Figure 2
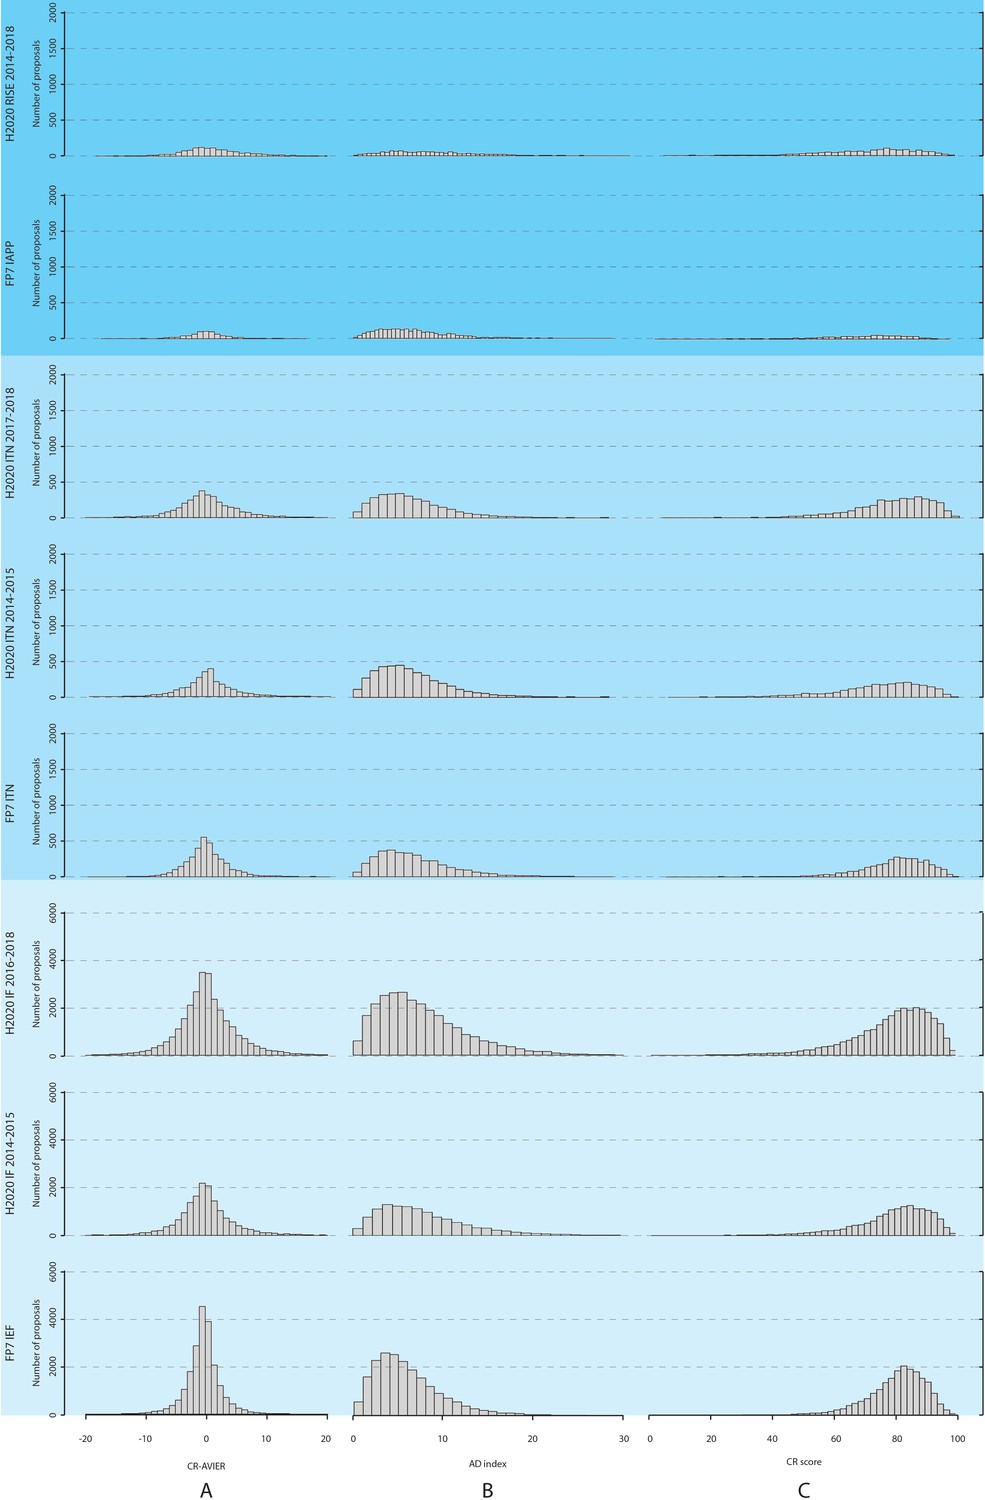
Distributions of CR scores, AD indices, and the difference between the CR scores and the average of for IER scores, for the three different Marie Curie actions between 2007 and 2018.
Proposals are evaluated by three reviewers to produce Individual Evaluation Reports (IER), which are then consolidated to produce a Consensus Report (CR); this process also involves agreeing a CR score, which does not have to be the average of the IER scores. (A) The left column shows the distribution of the difference between the CR scores and the average of the IER scores; (B) the middle column shows the distribution of the AD (average deviation) indices; and (C) the left column shows the distribution of the CR scores. The distributions are shown for the three Marie Curie actions (IEF/IF, ITN and IAPP/RISE) during different time periods. The Results section describes how these actions changed over this period.
Figure 3
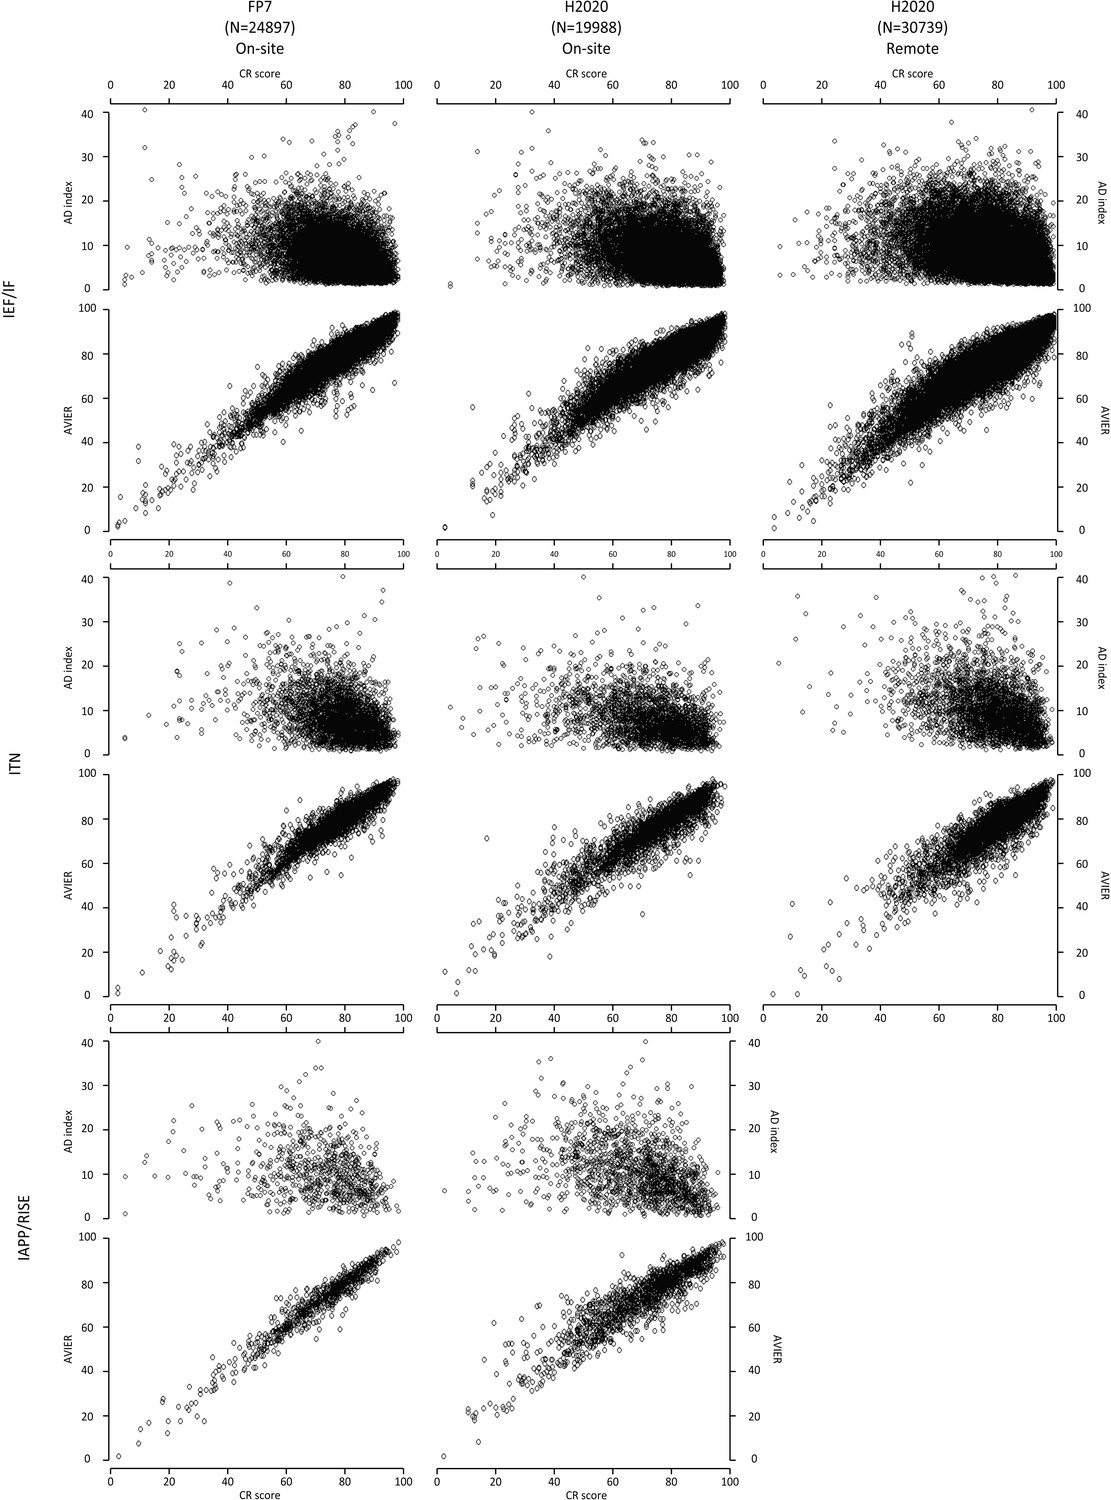
Scatter plots showing AD indices and the average of IER scores versus CR scores for the three different Marie Curie actions between 2007 and 2018.
The upper panel plots average deviation (AD) indices versus Consensus Report (CR) scores; the lower panel plots the average of the Individual Evaluation Reports (AVIER) scores versus the CR scores. The distributions are shown for the three Marie Curie actions (horizontally) during different time periods (vertically). The Results section describes how these actions changed over this period.
Tables
Table 1
Number of proposals, number of evaluation criteria, and format of the consensus phase for the three different Marie Curie actions between 2007 and 2018.
| Grant call* | 2007 | 2008 | 2009 | 2010 | 2011 | 2012 | 2013 | 2014 | 2015 | 2016 | 2017 | 2018 | |
|---|---|---|---|---|---|---|---|---|---|---|---|---|---|
| IEF/IF | No. proposals | 1686 | 1753 | 2392 | 2835 | 3302 | 3708 | 4917 | 7397 | 8364 | 8805 | 8940 | 9658 |
| No. evaluation criteria | 5 | 5 | 5 | 5 | 5 | 5 | 5 | 3 | 3 | 3 | 3 | 3 | |
| Consensus format | on-site | on-site | on-site | on-site | on-site | on-site | on-site | on-site | on-site | remote | remote | remote | |
| ITN | No. proposals | † | 886 | † | 858 | 909 | 892 | † | 1149 | 1558 | † | 1702 | 1634 |
| No. evaluation criteria | 4 | 4 | 4 | 4 | 3 | 3 | 3 | 3 | |||||
| Consensus format | on-site | on-site | on-site | on-site | on-site | on-site | remote | remote | |||||
| IAPP/RISE | No. proposals | 102 | 141 | 356 | † | 160 | † | † | 200 | 361 | 366 | 321 | 272 |
| No. evaluation criteria | 4 | 4 | 4 | 4 | 3 | 3 | 3 | 3 | 3 | ||||
| Consensus format | on-site | on-site | on-site | on-site | on-site | on-site | on-site | on-site | on-site |
-
*The Results section describes how the three actions within the EU's Marie Curie funding programme (IEF/IF, ITN and IAPP/RISE) changed between 2007 and 2018.
† Data for these calls were not considered for the following reasons. ITN 2007: organized as a two-stage evaluation process; ITN 2008 and IAPP 2010: no calls organized for these years; ITN 2013, IAPP 2012 and IAPP 2013: data not accessible for technical reasons; ITN 2016: organized with four reviewers per proposal instead of three.
Table 2
Results of interrupted time series analyses for mean CR scores and mean AD indices for the three different Marie Curie actions between 2007 and 2018.
| Pre-intervention slope coefficient (95% CI)* | Post-intervention slope coefficient (95% CI)* | Change in slope (95% CI)* | |||
|---|---|---|---|---|---|
| Change in the number of evaluation criteria† | AD index | IEF/IF | -0.01 (-0.06 to 0.04) | 0.19 (0.09 to 0.29) | 0.20 (0.09 to 0.31) |
| ITN | -0.03 (-0.18 to 0.24) | -0.09 (-0.30 to 0.12) | -0.06 (-0.24 to 0.36) | ||
| IAPP/RISE | 0.11 (-0.26 to 0.48) | -0.39 (-0.65 to -0.13) | -0.50 (-0.95 to -0.05) | ||
| CR Score | IEF/IF | 0.22 (-0.05 to 0.49) | -0.29 (-0.73 to 0.16) | -0.51 (-1.02 to 0.01) | |
| ITN | 1.15 (0.41 to 1.89) | 1.07 (0.32 to 1.81) | -0.08 (-1.13 to 0.96) | ||
| IAPP/RISE | -0.69 (-2.06 to 0.68) | 0.53 (-0.44 to 1.50) | 1.22 (-0.44 to 2.88) | ||
| Change in the consensus format† | AD index | IEF/IF | 0.12 (-0.02 to 0.26) | 0.09 (-0.47 to 0.65) | -0.02 (-0.56 to 0.60) |
| ITN | -0.04 (-0.13 to -0.06) | 0.10 (-0.47 to 0.67) | 0.14 (-0.44 to 0.72) | ||
| CR Score | IEF/IF | 0.02 (-0.03 to 0.03) | -0.49 (-1.76 to 0.78) | -0.51 (-1.81 to 0.79) | |
| ITN | 0.76 (0.24 to 1.27) | 0.30 (-2.7 to 3.39) | -0.46 (-3.59 to 2.67) |
-
* Positive (negative) values of the slope coefficient can be interpreted as an increase (decrease) in the average points per call (on a scale of 1–100).
† The change in the number of evaluation criteria occurred in 2014 with the transition from FP7 to H2020; the change in the consensus format occurred in 2016 for IF and ITN. The Results section describes how the three actions within the EU's Marie Curie funding programme (IEF/IF, ITN and IAPP/RISE) changed between 2007 and 2018.
-
AD index: average deviation index; CI: confidence interval; CR: Consensus Report.
Table 3
Number of proposals, CR scores (mean and SD) and AD indices (mean and SD), broken down by scientific panel, for the three different Marie Curie actions for three time periods between 2007 and 2018.
| No. proposals (% total) | Mean CR score (SD) | Mean AD index (SD) | ||||||||
|---|---|---|---|---|---|---|---|---|---|---|
| 2007–13 | 2014–15 | 2016–18 | 2007–13 | 2014–15 | 2016–18 | 2007–13 | 2014–15 | 2016–18 | ||
| IEF/IF | Overall | 20,593 | 15,761 | 27,403 | 80.4 (10.4) | 79.6 (12.6) | 79.0 (13.3) | 6.1 (4.0) | 7.1 (4.6) | 7.6 (4.9) |
| CHE | 2204 (10.7) | 1837 (11.7) | 3449 (12.6) | 81.1 (9.2) | 79.8 (11.3) | 79.9 (12.6) | 5.6 (3.6) | 6.5 (4.1) | 6.9 (4.4) | |
| ECOSOC | 4228 (20.5) | 3473 (22.0) | 6614 (24.1) | 78.7 (12.4) | 78.2 (14.3) | 76.5 (15.0) | 7.6 (4.7) | 8.3 (5.1) | 9.0 (5.5) | |
| ENG | 1888 (9.2) | 1935 (12.3) | 3249 (11.9) | 78.0 (11.2) | 76.6 (13.7) | 77.4 (14.5) | 6.4 (4.1) | 7.8 (4.7) | 7.9 (5.1) | |
| ENV | 2731 (13.3) | 2058 (13.1) | 3531 (12.9) | 81.1 (9.7) | 79.7 (12.7) | 79.7 (12.9) | 5.7 (3.7) | 6.8 (4.4) | 7.5 (4.6) | |
| LIF | 6408 (31.1) | 4304 (27.3) | 7065 (25.8) | 81.5 (9.5) | 81.3 (11.2) | 80.9 (12.1) | 5.5 (3.5) | 6.5 (4.2) | 7.2 (4.5) | |
| MAT | 665 (3.2) | 369 (2.3) | 611 (2.2) | 78.4 (10.1) | 79.0 (13.3) | 79.4 (12.9) | 6.2 (4.1) | 7.5 (4.8) | 7.1 (4.5) | |
| PHY | 2469 (12.0) | 1785 (11.3) | 2884 (10.5) | 81.0 (9.0) | 81.4 (10.4) | 80.1 (11.1) | 5.4 (3.5) | 5.9 (4.0) | 6.2 (4.0) | |
| 2007–13 | 2014–15 | 2017–18 | 2007–13 | 2014–15 | 2017–18 | 2007–13 | 2014–15 | 2017–18 | ||
| ITN | Overall | 3545 | 2707 | 3336 | 78.0 (12.2) | 79.9 (11.5) | 82.1 (10.6) | 7.2 (4.5) | 7.1 (4.5) | 6.8 (4.3) |
| CHE | 398 (11.2) | 316 (11.7) | 397 (11.9) | 79.4 (10.4) | 81.6 (9.9) | 84.7 (8.7) | 7.0 (4.3) | 6.2 (4.3) | 6.2 (3.7) | |
| ECOSOC | 381 (10.7) | 245 (9.1) | 363 (10.9) | 73.6 (15.1) | 78.0 (13.5) | 81.1 (12.3) | 8.7 (5.3) | 8.7 (5.5) | 7.8 (4.8) | |
| ENG | 799 (22.5) | 794 (29.3) | 1039 (31.1) | 76.4 (12.3) | 78.3 (12.3) | 80.5 (10.5) | 7.5 (4.4) | 7.3 (4.3) | 7.0 (4.1) | |
| ENV | 428 (12.1) | 335 (12.4) | 404 (12.1) | 78.1 (11.3) | 80.0 (11.0) | 83.2 (10.9) | 6.7 (4.3) | 6.6 (4.0) | 6.6 (4.2) | |
| LIF | 1047 (29.5) | 764 (28.2) | 868 (26.0) | 79.3 (12.5) | 80.7 (11.0) | 82.6 (10.6) | 7.0 (4.4) | 7.1 (4.3) | 6.9 (4.5) | |
| MAT | 60 (1.7) | 42 (1.6) | 44 (1.3) | 77.3 (8.2) | 77.2 (9.6) | 79.7 (10.6) | 8.1 (4.3) | 8.0 (5.5) | 6.5 (4.6) | |
| PHY | 432 (12.2) | 211 (7.8) | 221 (6.6) | 80.6 (10.2) | 82.3 (9.5) | 83.8 (9.1) | 6.5 (4.3) | 6.2 (4.0) | 5.9 (3.8) | |
| 2007–13 | 2014–18 | 2007–13 | 2014–18 | 2007–13 | 2014–18 | |||||
| IAPP/RISE | Overall | 759 | 1520 | 70.9 (15.3) | 73.3 (15.2) | 8.1 (4.7) | 8.7 (5.2) | |||
| CHE | 63 (8.3) | 142 (9.3) | 69.4 (15.3) | 77.6 (13.5) | 7.6 (4.6) | 7.2 (4.5) | ||||
| ECOSOC | 68 (9.0) | 283 (18.6) | 67.1 (18.1) | 71.3 (16.1) | 8.4 (5.2) | 9.4 (5.5) | ||||
| ENG | 296 (39.0) | 462 (30.4) | 71.3 (13.6) | 72.0 (15.8) | 7.8 (4.5) | 8.9 (5.1) | ||||
| ENV | 84 (11.1) | 204 (13.4) | 72.1 (16.3) | 74.5 (15.4) | 8.4 (4.5) | 8.9 (5.5) | ||||
| LIF | 203 (26.7) | 231 (15.2) | 63.9 (16.3) | 72.4 (14.5) | 8.5 (4.6) | 9.1 (5.2) | ||||
| MAT | 6 (0.8) | 47 (3.1) | 63.9 (24.6) | 73.2 (14.4) | 9.2 (4.6) | 8.1 (5.3) | ||||
| PHY | 39 (5.1) | 151 (9.9) | 75.0 (11.5) | 77.0 (16.1) | 8.2 (5.6) | 7.7 (4.6) | ||||
-
The Results section describes how the three actions within the EU's Marie Curie funding programme (IEF/IF, ITN and IAPP/RISE) changed between 2007 and 2018.
CHE: Chemistry; ECOSOC: Economics and social sciences and humanities; ENG: Engineering; ENV: Environment; LIF: Life sciences; MAT: Mathematics; PHY: Physics.
Table 4
CR scores (mean and SD), broken down by level of agreement between reviewers, for the three different H2020 Marie Skłodowska-Curie actions between 2014 and 2018.
| Mean CR score (SD), number (%) | ||||
|---|---|---|---|---|
| Full agreement | No agreement | Other | ||
| 2014 | IF (n = 7,397) | 85.2 (10.0), n = 2,032 (27.5%) | 69.7 (12.9), n = 771 (10.4%) | 79.1 (11.8), n = 4,594 (62.1%) |
| ITN (n = 1,149) | 84.1 (9.4), n = 309 (26.9%) | 71.8 (11.3), n = 136 (11.8%) | 78.6 (11.5), n = 704 (61.3%) | |
| RISE (n = 200) | 83.3 (12.6), n = 23 (11.5%) | 65.5 (13.7), n = 51 (25.5%) | 70.1 (12.5), n = 126 (63.0%) | |
| 2015 | IF (n = 8,364) | 84.8 (10.6), n = 2,242 (26.8%) | 70.9 (13.7), n = 950 (11.6%) | 78.8 (12.5), n = 5,172 (61.8%) |
| ITN (n = 1,558) | 84.1 (10.0), n = 413 (26.5%) | 74.1 (12.2), n = 159 (10.2%) | 79.7 (11.3), n = 986 (63.3%) | |
| RISE (n = 361) | 81.1 (15.0), n = 66 (18.3%) | 68.4 (12.4), n = 64 (17.7%) | 73.3 (15.1), n = 231 (64.0%) | |
| 2016 | IF (n = 8,805) | 85.4 (10.7), n = 2,189 (24.9%) | 71.0 (13.4), n = 1,117 (12.7%) | 79.0 (12.3), n = 5,499 (62.4%) |
| RISE (n = 366) | 79.1 (15.0), n = 73 (19.9%) | 67.3 (13.9), n = 68 (18.6%) | 74.8 (14.6), n = 225 (61.5%) | |
| 2017 | IF (n = 8,940) | 85.1 (11.0), n = 2,142 (23.9%) | 69.6 (13.5), n = 1,125 (12.6%) | 78.2 (12.9), n = 5,673 (63.5%) |
| ITN (n = 1,702) | 86.7 (8.5), n = 473 (27.8%) | 72.7 (11.6), n = 141 (8.3%) | 81.2 (10.4), n = 1,088 (63.9%) | |
| RISE (n = 321) | 82.4 (10.5), n = 61 (19.0%) | 64.1 (14.7), n = 57 (17.8%) | 73.5 (14.4), n = 203 (63.2%) | |
| 2018 | IF (n = 9,658) | 85.2 (11.6), n = 2,345 (24.3%) | 69.3 (13.4), n = 1,247 (12.9%) | 78.2 (13.4), n = 6,066 (62.8%) |
| ITN (n = 1,634) | 86.5 (9.1), n = 427 (26.1%) | 72.7 (11.0), n = 161 (9.9%) | 81.2 (10.1), n = 1,046 (64.0%) | |
| RISE (n = 272) | 80.4 (16.8), n = 45 (16.5%) | 65.2 (14.1), n = 37 (13.6%) | 73.2 (14.0), n = 190 (69.9%) | |
-
* One-way ANOVA, all differences significant at p<0.001 level. The method to divide proposals between Full Agreement, No Agreement and Other is described in the Results section.
CR: Consensus Report; SD: standard deviation.
Table 5
CR scores (mean and SD), broken down by level of agreement between reviewers and scientific panel, for the three different H2020 Marie Skłodowska-Curie actions for 2014–2015 and 2016–2018.
| Mean CR score (SD) | |||||||
|---|---|---|---|---|---|---|---|
| Full agreement | No agreement | Other | |||||
| IF | 2014–15 | 2016–18 | 2014–15 | 2016–18 | 2014–15 | 2016–18 | |
| Overall | 85.0 (10.4) | 85.2 (11.1) | 70.4 (13.3) | 70.0 (13.4) | 78.9 (12.2) | 78.5 (12.9) | |
| CHE | 84.4 (9.4) | 85.2 (10.5) | 70.9 (13.0) | 70.5 (13.8) | 78.8 (10.9) | 79.1 (12.1) | |
| ECOSOC | 85.2 (12.3) | 84.0 (13.6) | 70.0 (14.2) | 69.7 (13.9) | 78.1 (13.7) | 76.3 (14.7) | |
| ENG | 83.4 (11.8) | 83.6 (12.8) | 67.8 (12.7) | 68.2 (13.2) | 76.1 (13.3) | 77.1 (14.2) | |
| ENV | 85.0 (10.7) | 85.4 (10.8) | 70.3 (13.7) | 70.2 (13.2) | 78.7 (12.3) | 79.5 (12.4) | |
| LIF | 85.7 (9.1) | 86.7 (10.2) | 72.1 (12.5) | 71.4 (12.9) | 80.4 (11.0) | 80.1 (11.5) | |
| MAT | 83.1 (12.3) | 85.5 (9.9) | 70.1 (14.6) | 68.9 (14.1) | 79.5 (12.6) | 78.9 (12.1) | |
| PHY | 84.8 (9.5) | 85.2 (8.4) | 72.5 (11.3) | 69.1 (12.3) | 80.4 (10.0) | 78.8 (10.7) | |
| ITN | 2014–15 | 2017–18 | 2014–15 | 2017–18 | 2014–15 | 2017–18 | |
| Overall | 84.1 (9.8) | 86.6 (8.8) | 73.0 (11.8) | 73.8 (11.3) | 79.2 (11.4) | 81.4 (10.3) | |
| CHE | 84.6 (7.7) | 87.8 (8.0) | 73.6 (13.0) | 76.9 (10.2) | 80.8 (10.0) | 84.3 (8.3) | |
| ECOSOC | 85.2 (9.7) | 85.1 (11.8) | 73.5 (13.4) | 73.7 (11.5) | 77.1 (13.7) | 80.1 (12.3) | |
| ENG | 83.1 (11.5) | 84.3 (9.6) | 71.0 (12.3) | 71.9 (11.8) | 77.9 (11.9) | 80.1 (10.0) | |
| ENV | 84.3 (8.5) | 89.1 (7.4) | 71.3 (12.8) | 71.9 (11.8) | 79.3 (10.8) | 82.2 (10.5) | |
| LIF | 84.0 (10.2) | 87.8 (7.5) | 74.3 (10.0) | 72.7 (13.0) | 80.4 (11.0) | 81.6 (10.2) | |
| MAT | 79.3 (10.4) | 85.6 (8.8) | 76.2 (6.3) | 70.9 (6.0) | 76.5 (9.9) | 77.3 (10.6) | |
| PHY | 85.7 (8.3) | 87.1 (7.2) | 77.1 (9.5) | 74.1 (11.7) | 81.2 (9.6) | 82.9 (9.0) | |
| RISE | 2014–18 | 2014–18 | 2014–18 | ||||
| Overall | 80.9 (14.2) | 66.3 (13.9) | 73.3 (14.9) | ||||
| CHE | 82.6 (11.3) | 67.3 (16.3) | 77.9 (12.4) | ||||
| ECOSOC | 81.1 (13.5) | 65.5 (13.7) | 70.5 (16.4) | ||||
| ENG | 78.0 (15.8) | 66.0 (14.7) | 72.3 (15.6) | ||||
| ENV | 80.2 (19.1) | 67.5 (11.2) | 74.8 (14.4) | ||||
| LIF | 79.9 (11.1) | 68.4 (13.8) | 72.4 (14.8) | ||||
| MAT | 84.4 (4.9) | 57.6 (14.2) | 74.4 (12.0) | ||||
| PHY | 65.9 (13.5) | 65.9 (13.5) | 76.8 (10.5) | ||||
-
* One-way ANOVA, all differences were significant at p<0.001 level. CR: Consensus Report; SD: standard deviation. CHE: Chemistry; ECOSOC: Economics and social sciences; ENG: Engineering; ENV: Environment; LIF: Life sciences; MAT: Mathematics; PHY: Physics.
Additional files
-
Supplementary file 1
Evaluation scores for all the Marie Curie proposals (n = 75,624) analysed in this study.
For each proposal, the total score for the Consensus Report (CR) and the respective scores given by reviewers in their Individual Evaluation Report (IER) are reported.
- https://cdn.elifesciences.org/articles/59338/elife-59338-supp1-v1.xlsx
-
Supplementary file 2
Table A1 and Table A2.
- https://cdn.elifesciences.org/articles/59338/elife-59338-supp2-v1.docx
-
Transparent reporting form
- https://cdn.elifesciences.org/articles/59338/elife-59338-transrepform-v1.pdf
Download links
A two-part list of links to download the article, or parts of the article, in various formats.
Downloads (link to download the article as PDF)
Open citations (links to open the citations from this article in various online reference manager services)
Cite this article (links to download the citations from this article in formats compatible with various reference manager tools)
Meta-Research: A retrospective analysis of the peer review of more than 75,000 Marie Curie proposals between 2007 and 2018
eLife 10:e59338.
https://doi.org/10.7554/eLife.59338


