Meta-Research: A retrospective analysis of the peer review of more than 75,000 Marie Curie proposals between 2007 and 2018
- Research Executive Agency, European Commission, Belgium
- Department for Research in Biomedicine and Health, University of Split School of Medicine, Croatia
- Department of Psychology, University of Split School of Humanities and Social Sciences, Croatia
Abstract
Most funding agencies rely on peer review to evaluate grant applications and proposals, but research into the use of this process by funding agencies has been limited. Here we explore if two changes to the organization of peer review for proposals submitted to various funding actions by the European Union has an influence on the outcome of the peer review process. Based on an analysis of more than 75,000 applications to three actions of the Marie Curie programme over a period of 12 years, we find that the changes – a reduction in the number of evaluation criteria used by reviewers and a move from in-person to virtual meetings – had little impact on the outcome of the peer review process. Our results indicate that other factors, such as the type of grant or area of research, have a larger impact on the outcome.
Introduction
Peer review is widely used by journals to evaluate research papers (Bornmann, 2011; Bornmann et al., 2010; Jackson et al., 2011; Baethge et al., 2013), and by funding agencies to evaluate grant applications (Cicchetti, 1991; Wessely, 1998; Reinhart, 2009; Guthrie et al., 2018). However, research into the use of peer review to assess grant applications has been hampered by the unavailability of data and the range of different approaches to peer review adopted by funding agencies. As such, the majority of studies have relied on relatively small samples (Cole et al., 1981; Fogelholm et al., 2012; Hodgson, 1997; Mayo et al., 2006; Pier et al., 2018), although some studies have been performed on larger samples (see, for example, Mutz et al., 2012). To date most studies acknowledge the need for improvements (Demicheli et al., 2007; Gallo et al., 2014; Graves et al., 2011; Jirschitzka et al., 2017; Marsh et al., 2008; Sattler et al., 2015; Shepherd et al., 2018; Bendiscioli, 2019): in particular, it has been shown that the peer review of grant applications is subject to various forms of bias (Lee et al., 2013; Witteman et al., 2019).
The peer review process at many funding agencies concludes with an in-person meeting at which the reviewers discuss and compare the applications they have reviewed. However, some funding agencies are replacing these meetings with virtual ones to reduce both their cost and carbon footprint, and to ease the burdens placed on reviewers. A number of small-scale studies have shown that moving from in-person to virtual meetings had little impact on the outcome of the peer-review process (Gallo et al., 2013; Carpenter et al., 2015; Obrecht et al., 2007), and a large-scale study by some of the present authors involving almost 25,000 grant applications to the European Union's Seventh Framework Programme (FP7) reported (along with other findings) that evaluating research proposals remotely would be, to a certain extent, feasible and reliable (Pina et al., 2015).
Here we explore if two changes in the way peer review was used to evaluate proposals to a number of European Union (EU) funding programmes had any impact on the outcome of the peer review process. The first change came in 2014, when FP7 gave way to the Horizon 2020 (H2020) programme: one consequence of this was that the number of evaluation criteria applied to assess applications was reduced from four or more to three: excellence, impact, and implementation. The second change was the replacement of in-person meetings by virtual meetings for a number of funding actions.
Ensuring that the evaluation process remained stable and reliable during these changes was a priority for the EU. To assess the impact of these two changes we analyzed almost 25,000 proposals to FP7 and more than 50,000 proposals to H2020 over a period of 12 years.
Results
The European Union has been funding researchers and projects under actions named after Marie Curie since 1996. Marie Curie Actions (MCA) were part of FP7, which ran from 2007 to 2013, and were renamed Marie Skłodowska-Curie Actions (MSCA) when H2020 started in 2014. MCA had a budget of €4.7 billion, which increased to €6.2 billion for MCSA. The MCSA programme awards funding to several actions, namely the Individual Fellowships (partial successor of the Intra-European Fellowships in FP7), Innovative Training Networks (called Initial Training Networks in FP7), and Research and Innovation Staff Exchange (partial successor of the Industry-Academia Pathways and Partnerships in FP7). In terms of number of applications, Individual Fellowships (IF) is the largest action, receiving more than 43,000 applications between 2014 to 2018. The success rate for applications varies from below 10% for Innovative Training Networks (ITN) to about 15% for Individual Fellowships and around 20–30% for Research and Innovation Staff Exchange (RISE), depending on the year. Calls for proposals are organized on a yearly basis, and the number of proposals evaluated each year make MCA/MSCA well suited as a system for studying the peer review of grant applications and proposals.
The MCA/MSCA evaluation process has been explained elsewhere (Pina et al., 2015), and consists of two steps. The first step, the individual evaluation, is done entirely remotely: each proposal is assessed by (typically) three reviewers, with each reviewer producing an Individual Evaluation Report (IER), and scoring each criterion on a scale from 0 (fail) to 5 (excellent), with a single decimal resolution. During this step, the three reviewers are unaware of each other’s identity.
Once the IER are completed, a consensus meeting is organized for each proposal, with the reviewers agreeing on a consolidated set of comments and scores that are summarized in a Consensus Report (CR). Although based on the initial IER scores, the final CR score is usually not an average of these scores. The CR is corrected for typos and other clerical errors to produce an Evaluation Summary Report (ESR): however, in practice, this has the same content and score as the CR, so we will refer to the CR score throughout this article. Ranked lists of proposals are established based on their CR scores, determining the priority order for funding, and the top-scored proposals get funded up to the available call budget.
Under H2020, all MSCA proposals are scored (for both IER and CR) on three evaluation criteria: excellence (which accounts for 50% of the score), impact (30%), and implementation (20%). Under FP7, the number of evaluation criteria varied with the type of action, as did the weighting attached to each: there were five criteria for Intra-European Fellowships (IEF) and four for Initial Training Networks (ITN) and Industry-Academia Pathways and Partnerships (IAPP). Under both FP7 and H2020 the IER and CR scores are a number between 0 and 100.
In our analysis, for each proposal we used the average deviation (AD) index as a measure of the (dis)agreement between the reviewers (Burke et al., 1999; Burke and Dunlap, 2002). This index is the sum of the absolute differences between each individual reviewer's score (IER) and the average (mean) score for a given proposal (AVIER), divided by the number of reviewers. For a proposal evaluated by three reviewers with scores IER1, IER2 and IER3, then the AD index is (|IER1 − AVIER| + |IER2 − AVIER| + |IER3 − AVIER|)/3. The AD index does not require the specification of null distribution and returns value in the units of the original scale (0–100 in our case), making its interpretation easier and more pragmatic (Smith-Crowe et al., 2013): the closer the AD index is to zero, the greater the agreement between reviewers. We also calculated the difference between the CR score and the AVIER (CR-AVIER) for each proposal.
Categorical data are presented as aggregated sums, frequencies and percentages, and continuous data as means and standard deviations. The differences between agreement groups were tested with one-way ANOVA. We assessed the associations between the CR scores and the average of IER scores, and between the CR scores and AD indices using Pearson’s correlation coefficient. We used the interrupted time series analysis to assess how changes in the organization of peer review influenced CR scores and AD indices over the years (Cochrane Effective Practice and Organisation of Care (EPOC), 2017).
Table 1 shows the number of evaluated proposals to each of the three actions (IEF/IF, ITN, IAPP/RISE) between 2007 and 2018, along with the number of evaluation criteria and the format of the consensus meeting (ie, on-site or remote). For each of the three actions Figure 1 plots the number of proposals, the mean CR scores and the mean AD indices over the same period. The two changes to the organization of peer review made during this period appear to have had very little impact on the mean CR scores or the mean AD indices, with the changes due to the reduction in the number of evaluation criteria being more pronounced than those due to the move from in-person to remote or virtual meetings (Table 2). The changes observed were very small and non-systematic, implying that it may probably be attributable to the large number of analyzed proposals and relatively few observation points, rather than some meaningful trend.
Table 1
Number of proposals, number of evaluation criteria, and format of the consensus phase for the three different Marie Curie actions between 2007 and 2018.
| Grant call* | 2007 | 2008 | 2009 | 2010 | 2011 | 2012 | 2013 | 2014 | 2015 | 2016 | 2017 | 2018 | |
|---|---|---|---|---|---|---|---|---|---|---|---|---|---|
| IEF/IF | No. proposals | 1686 | 1753 | 2392 | 2835 | 3302 | 3708 | 4917 | 7397 | 8364 | 8805 | 8940 | 9658 |
| No. evaluation criteria | 5 | 5 | 5 | 5 | 5 | 5 | 5 | 3 | 3 | 3 | 3 | 3 | |
| Consensus format | on-site | on-site | on-site | on-site | on-site | on-site | on-site | on-site | on-site | remote | remote | remote | |
| ITN | No. proposals | † | 886 | † | 858 | 909 | 892 | † | 1149 | 1558 | † | 1702 | 1634 |
| No. evaluation criteria | 4 | 4 | 4 | 4 | 3 | 3 | 3 | 3 | |||||
| Consensus format | on-site | on-site | on-site | on-site | on-site | on-site | remote | remote | |||||
| IAPP/RISE | No. proposals | 102 | 141 | 356 | † | 160 | † | † | 200 | 361 | 366 | 321 | 272 |
| No. evaluation criteria | 4 | 4 | 4 | 4 | 3 | 3 | 3 | 3 | 3 | ||||
| Consensus format | on-site | on-site | on-site | on-site | on-site | on-site | on-site | on-site | on-site |
-
*The Results section describes how the three actions within the EU's Marie Curie funding programme (IEF/IF, ITN and IAPP/RISE) changed between 2007 and 2018.
† Data for these calls were not considered for the following reasons. ITN 2007: organized as a two-stage evaluation process; ITN 2008 and IAPP 2010: no calls organized for these years; ITN 2013, IAPP 2012 and IAPP 2013: data not accessible for technical reasons; ITN 2016: organized with four reviewers per proposal instead of three.
Figure 1
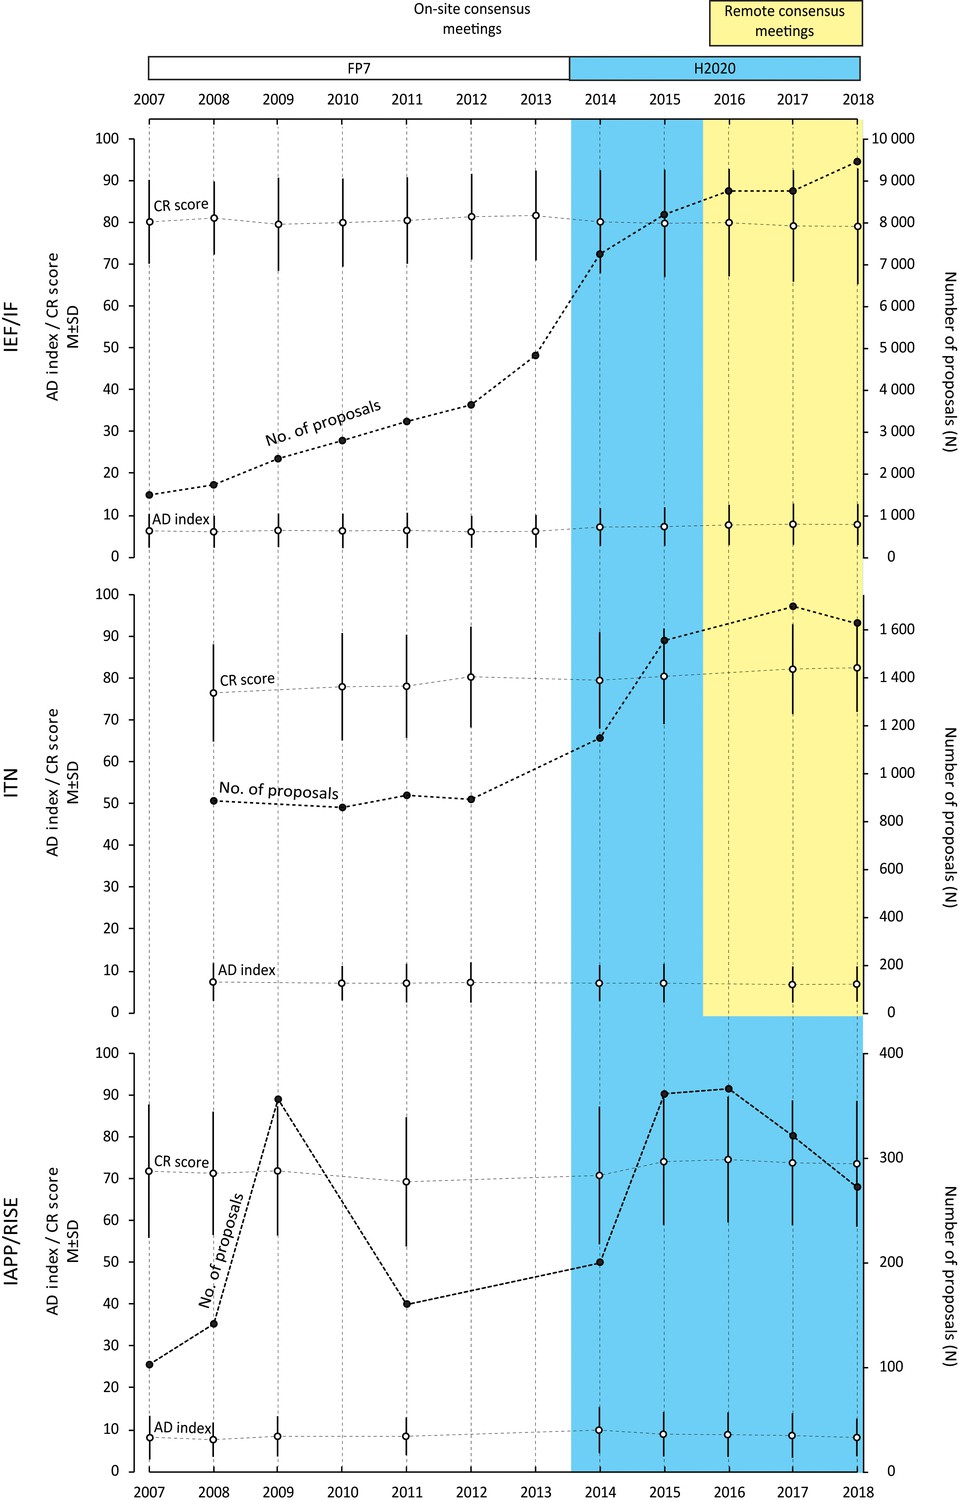
Number of proposals, CR scores (mean and SD) and AD indices (mean and SD) for the three different Marie Curie actions between 2007 and 2018.
We studied 75,624 proposals evaluated under the EU's Marie Curie funding programme between 2007 and 2018 to investigate if two changes to the way peer review is organized – a reduction in the number of evaluation criteria in 2014, and a move from in-person to remote consensus meetings in 2016 – influenced the outcome of the peer review process. In the white region (which corresponds to FP7) four or more criteria were used to evaluate proposals and consensus meetings were in-person. In the coloured region (which correspond to H2020) three criteria were used to evaluate proposals: consensus meetings remained in-person in the blue region, but became remote/virtual in the yellow region. The Results section describes how the three Marie Curie actions (IEF/IF, ITN and IAPP/RISE) changed over this period. Data for certain calls were not considered for the following reasons. ITN 2007: organized as a two-stage evaluation process; ITN 2008 and IAPP 2010: no calls organized for these years; ITN 2013, IAPP 2012 and IAPP 2013: data not accessible for technical reasons; ITN 2016: organized with four reviewers per proposal.
Table 2
Results of interrupted time series analyses for mean CR scores and mean AD indices for the three different Marie Curie actions between 2007 and 2018.
| Pre-intervention slope coefficient (95% CI)* | Post-intervention slope coefficient (95% CI)* | Change in slope (95% CI)* | |||
|---|---|---|---|---|---|
| Change in the number of evaluation criteria† | AD index | IEF/IF | -0.01 (-0.06 to 0.04) | 0.19 (0.09 to 0.29) | 0.20 (0.09 to 0.31) |
| ITN | -0.03 (-0.18 to 0.24) | -0.09 (-0.30 to 0.12) | -0.06 (-0.24 to 0.36) | ||
| IAPP/RISE | 0.11 (-0.26 to 0.48) | -0.39 (-0.65 to -0.13) | -0.50 (-0.95 to -0.05) | ||
| CR Score | IEF/IF | 0.22 (-0.05 to 0.49) | -0.29 (-0.73 to 0.16) | -0.51 (-1.02 to 0.01) | |
| ITN | 1.15 (0.41 to 1.89) | 1.07 (0.32 to 1.81) | -0.08 (-1.13 to 0.96) | ||
| IAPP/RISE | -0.69 (-2.06 to 0.68) | 0.53 (-0.44 to 1.50) | 1.22 (-0.44 to 2.88) | ||
| Change in the consensus format† | AD index | IEF/IF | 0.12 (-0.02 to 0.26) | 0.09 (-0.47 to 0.65) | -0.02 (-0.56 to 0.60) |
| ITN | -0.04 (-0.13 to -0.06) | 0.10 (-0.47 to 0.67) | 0.14 (-0.44 to 0.72) | ||
| CR Score | IEF/IF | 0.02 (-0.03 to 0.03) | -0.49 (-1.76 to 0.78) | -0.51 (-1.81 to 0.79) | |
| ITN | 0.76 (0.24 to 1.27) | 0.30 (-2.7 to 3.39) | -0.46 (-3.59 to 2.67) |
-
* Positive (negative) values of the slope coefficient can be interpreted as an increase (decrease) in the average points per call (on a scale of 1–100).
† The change in the number of evaluation criteria occurred in 2014 with the transition from FP7 to H2020; the change in the consensus format occurred in 2016 for IF and ITN. The Results section describes how the three actions within the EU's Marie Curie funding programme (IEF/IF, ITN and IAPP/RISE) changed between 2007 and 2018.
-
AD index: average deviation index; CI: confidence interval; CR: Consensus Report.
Table 3 shows the number of evaluated proposals, the mean CR scores and the mean AD indices for each of the three actions over three time periods (2007–2013; 2014–2015; 2016–2018), broken down by scientific panels (see Methods). The two panels with the most proposals for Individual Fellowships during the whole 2007–2018 period were life sciences and economics and social sciences and humanities; whereas for ITN the panels with the most applications were life sciences and engineering, and for IAPP/RISE there was a predominance of engineering proposals. The mean CR scores and AD indices remained stable over the period studied.
Table 3
Number of proposals, CR scores (mean and SD) and AD indices (mean and SD), broken down by scientific panel, for the three different Marie Curie actions for three time periods between 2007 and 2018.
| No. proposals (% total) | Mean CR score (SD) | Mean AD index (SD) | ||||||||
|---|---|---|---|---|---|---|---|---|---|---|
| 2007–13 | 2014–15 | 2016–18 | 2007–13 | 2014–15 | 2016–18 | 2007–13 | 2014–15 | 2016–18 | ||
| IEF/IF | Overall | 20,593 | 15,761 | 27,403 | 80.4 (10.4) | 79.6 (12.6) | 79.0 (13.3) | 6.1 (4.0) | 7.1 (4.6) | 7.6 (4.9) |
| CHE | 2204 (10.7) | 1837 (11.7) | 3449 (12.6) | 81.1 (9.2) | 79.8 (11.3) | 79.9 (12.6) | 5.6 (3.6) | 6.5 (4.1) | 6.9 (4.4) | |
| ECOSOC | 4228 (20.5) | 3473 (22.0) | 6614 (24.1) | 78.7 (12.4) | 78.2 (14.3) | 76.5 (15.0) | 7.6 (4.7) | 8.3 (5.1) | 9.0 (5.5) | |
| ENG | 1888 (9.2) | 1935 (12.3) | 3249 (11.9) | 78.0 (11.2) | 76.6 (13.7) | 77.4 (14.5) | 6.4 (4.1) | 7.8 (4.7) | 7.9 (5.1) | |
| ENV | 2731 (13.3) | 2058 (13.1) | 3531 (12.9) | 81.1 (9.7) | 79.7 (12.7) | 79.7 (12.9) | 5.7 (3.7) | 6.8 (4.4) | 7.5 (4.6) | |
| LIF | 6408 (31.1) | 4304 (27.3) | 7065 (25.8) | 81.5 (9.5) | 81.3 (11.2) | 80.9 (12.1) | 5.5 (3.5) | 6.5 (4.2) | 7.2 (4.5) | |
| MAT | 665 (3.2) | 369 (2.3) | 611 (2.2) | 78.4 (10.1) | 79.0 (13.3) | 79.4 (12.9) | 6.2 (4.1) | 7.5 (4.8) | 7.1 (4.5) | |
| PHY | 2469 (12.0) | 1785 (11.3) | 2884 (10.5) | 81.0 (9.0) | 81.4 (10.4) | 80.1 (11.1) | 5.4 (3.5) | 5.9 (4.0) | 6.2 (4.0) | |
| 2007–13 | 2014–15 | 2017–18 | 2007–13 | 2014–15 | 2017–18 | 2007–13 | 2014–15 | 2017–18 | ||
| ITN | Overall | 3545 | 2707 | 3336 | 78.0 (12.2) | 79.9 (11.5) | 82.1 (10.6) | 7.2 (4.5) | 7.1 (4.5) | 6.8 (4.3) |
| CHE | 398 (11.2) | 316 (11.7) | 397 (11.9) | 79.4 (10.4) | 81.6 (9.9) | 84.7 (8.7) | 7.0 (4.3) | 6.2 (4.3) | 6.2 (3.7) | |
| ECOSOC | 381 (10.7) | 245 (9.1) | 363 (10.9) | 73.6 (15.1) | 78.0 (13.5) | 81.1 (12.3) | 8.7 (5.3) | 8.7 (5.5) | 7.8 (4.8) | |
| ENG | 799 (22.5) | 794 (29.3) | 1039 (31.1) | 76.4 (12.3) | 78.3 (12.3) | 80.5 (10.5) | 7.5 (4.4) | 7.3 (4.3) | 7.0 (4.1) | |
| ENV | 428 (12.1) | 335 (12.4) | 404 (12.1) | 78.1 (11.3) | 80.0 (11.0) | 83.2 (10.9) | 6.7 (4.3) | 6.6 (4.0) | 6.6 (4.2) | |
| LIF | 1047 (29.5) | 764 (28.2) | 868 (26.0) | 79.3 (12.5) | 80.7 (11.0) | 82.6 (10.6) | 7.0 (4.4) | 7.1 (4.3) | 6.9 (4.5) | |
| MAT | 60 (1.7) | 42 (1.6) | 44 (1.3) | 77.3 (8.2) | 77.2 (9.6) | 79.7 (10.6) | 8.1 (4.3) | 8.0 (5.5) | 6.5 (4.6) | |
| PHY | 432 (12.2) | 211 (7.8) | 221 (6.6) | 80.6 (10.2) | 82.3 (9.5) | 83.8 (9.1) | 6.5 (4.3) | 6.2 (4.0) | 5.9 (3.8) | |
| 2007–13 | 2014–18 | 2007–13 | 2014–18 | 2007–13 | 2014–18 | |||||
| IAPP/RISE | Overall | 759 | 1520 | 70.9 (15.3) | 73.3 (15.2) | 8.1 (4.7) | 8.7 (5.2) | |||
| CHE | 63 (8.3) | 142 (9.3) | 69.4 (15.3) | 77.6 (13.5) | 7.6 (4.6) | 7.2 (4.5) | ||||
| ECOSOC | 68 (9.0) | 283 (18.6) | 67.1 (18.1) | 71.3 (16.1) | 8.4 (5.2) | 9.4 (5.5) | ||||
| ENG | 296 (39.0) | 462 (30.4) | 71.3 (13.6) | 72.0 (15.8) | 7.8 (4.5) | 8.9 (5.1) | ||||
| ENV | 84 (11.1) | 204 (13.4) | 72.1 (16.3) | 74.5 (15.4) | 8.4 (4.5) | 8.9 (5.5) | ||||
| LIF | 203 (26.7) | 231 (15.2) | 63.9 (16.3) | 72.4 (14.5) | 8.5 (4.6) | 9.1 (5.2) | ||||
| MAT | 6 (0.8) | 47 (3.1) | 63.9 (24.6) | 73.2 (14.4) | 9.2 (4.6) | 8.1 (5.3) | ||||
| PHY | 39 (5.1) | 151 (9.9) | 75.0 (11.5) | 77.0 (16.1) | 8.2 (5.6) | 7.7 (4.6) | ||||
-
The Results section describes how the three actions within the EU's Marie Curie funding programme (IEF/IF, ITN and IAPP/RISE) changed between 2007 and 2018.
CHE: Chemistry; ECOSOC: Economics and social sciences and humanities; ENG: Engineering; ENV: Environment; LIF: Life sciences; MAT: Mathematics; PHY: Physics.
We also studied the difference between the CR scores and the average of the IER scores, and the distribution of this difference is plotted in Figure 2 (along with the distributions for the AD indices and CR scores) for the three actions over different time periods. The distribution for the difference in scores is bell-shaped, with a maximum at zero difference; moreover, we found that the absolute value of this difference was two points or less (on a scale of 0–100) for 37,900 proposals (50.1% of the total), and 10 points or less for 72,527 proposals (95.9%). We also found (using Pearson’s correlation coefficients) that the CR scores and the average of the IER scores were highly correlated for all three types of grants (Table A1 in Supplementary file 2). Higher CR scores also tended to have lower AD indices for all three actions (Figure 3), with some panels (economics and social sciences and humanities) and some actions (IAPP/RISE) having higher mean AD indices than other panels and actions (Table 3). Overall, for all proposals included in the analysis, the mean value of the AD indices was 7.02 (SD = 4.56), with 59,500 proposals (78.7% of the total) having an AD index of 10 or less (on a scale of 0–100). This suggests a high level of agreement between the reviewers.
Figure 2
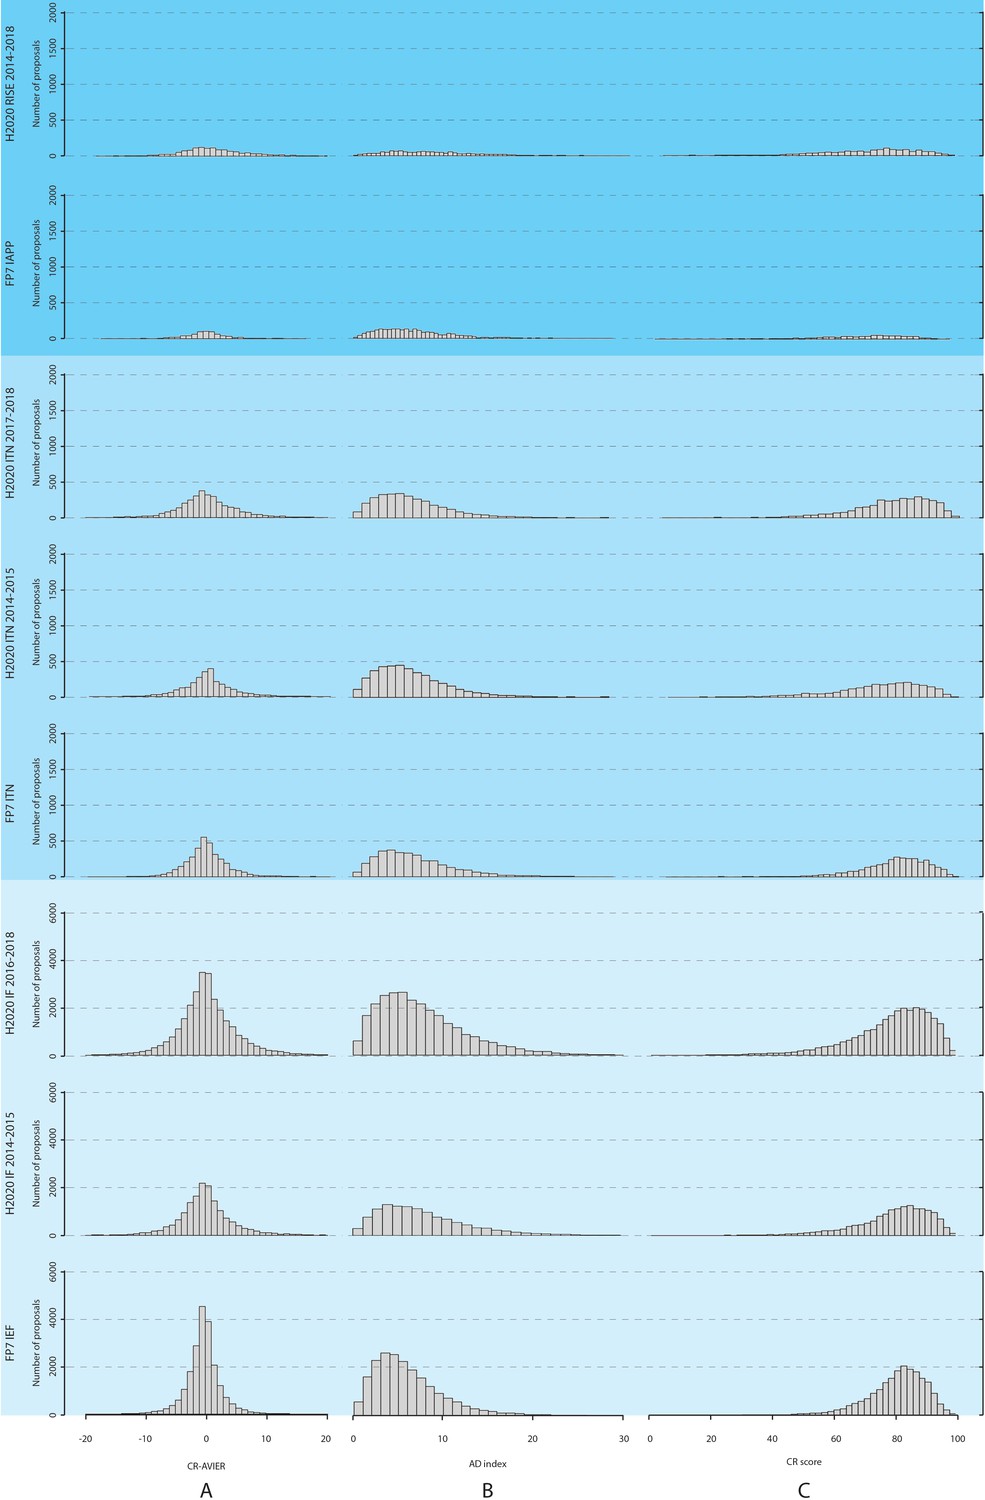
Distributions of CR scores, AD indices, and the difference between the CR scores and the average of for IER scores, for the three different Marie Curie actions between 2007 and 2018.
Proposals are evaluated by three reviewers to produce Individual Evaluation Reports (IER), which are then consolidated to produce a Consensus Report (CR); this process also involves agreeing a CR score, which does not have to be the average of the IER scores. (A) The left column shows the distribution of the difference between the CR scores and the average of the IER scores; (B) the middle column shows the distribution of the AD (average deviation) indices; and (C) the left column shows the distribution of the CR scores. The distributions are shown for the three Marie Curie actions (IEF/IF, ITN and IAPP/RISE) during different time periods. The Results section describes how these actions changed over this period.
Figure 3

Scatter plots showing AD indices and the average of IER scores versus CR scores for the three different Marie Curie actions between 2007 and 2018.
The upper panel plots average deviation (AD) indices versus Consensus Report (CR) scores; the lower panel plots the average of the Individual Evaluation Reports (AVIER) scores versus the CR scores. The distributions are shown for the three Marie Curie actions (horizontally) during different time periods (vertically). The Results section describes how these actions changed over this period.
To explore if there was a relationship between the level of agreement (or disagreement) among the reviewers and the CR scores, we divided the H2020 proposals into three groups and calculated the mean CR scores for each group. In the 'full agreement' group all the three absolute differences between IER scores of each pair of reviewers were 10 points or less. In the 'no agreement' group all the absolute differences were above 10 points. In the 'other' group at least one absolute difference was 10 points or less, and at least one was more than 10 points. Of the 50,727 proposals we studied, most (31,803; 62.7% of the total) were in the 'other' group, followed by the 'full agreement' group (12,840; 25.3%), and the 'no agreement' group (6,084; 12.0%). In all cases, the 'full agreement' group had the highest mean CR scores, followed by the 'other' group and the 'no agreement' group (Table 4). For the IF and ITN actions the 'full agreement' group was generally bigger than the 'no agreement' group by a factor of about two; for RISE the two groups tended to be comparable in size (with the exception of 2014, when the 'no agreement' group was much larger). We also looked at these three groups by scientific panel and found no deviations from the general trends observed at the action level (Table 5). Across all H2020 proposals, those in the 'full agreement' group had an average CR score of 85.1 (SD = 10.8), whereas those in the 'no agreement' group had a CR score of 70.3 (SD = 13.3).
Table 4
CR scores (mean and SD), broken down by level of agreement between reviewers, for the three different H2020 Marie Skłodowska-Curie actions between 2014 and 2018.
| Mean CR score (SD), number (%) | ||||
|---|---|---|---|---|
| Full agreement | No agreement | Other | ||
| 2014 | IF (n = 7,397) | 85.2 (10.0), n = 2,032 (27.5%) | 69.7 (12.9), n = 771 (10.4%) | 79.1 (11.8), n = 4,594 (62.1%) |
| ITN (n = 1,149) | 84.1 (9.4), n = 309 (26.9%) | 71.8 (11.3), n = 136 (11.8%) | 78.6 (11.5), n = 704 (61.3%) | |
| RISE (n = 200) | 83.3 (12.6), n = 23 (11.5%) | 65.5 (13.7), n = 51 (25.5%) | 70.1 (12.5), n = 126 (63.0%) | |
| 2015 | IF (n = 8,364) | 84.8 (10.6), n = 2,242 (26.8%) | 70.9 (13.7), n = 950 (11.6%) | 78.8 (12.5), n = 5,172 (61.8%) |
| ITN (n = 1,558) | 84.1 (10.0), n = 413 (26.5%) | 74.1 (12.2), n = 159 (10.2%) | 79.7 (11.3), n = 986 (63.3%) | |
| RISE (n = 361) | 81.1 (15.0), n = 66 (18.3%) | 68.4 (12.4), n = 64 (17.7%) | 73.3 (15.1), n = 231 (64.0%) | |
| 2016 | IF (n = 8,805) | 85.4 (10.7), n = 2,189 (24.9%) | 71.0 (13.4), n = 1,117 (12.7%) | 79.0 (12.3), n = 5,499 (62.4%) |
| RISE (n = 366) | 79.1 (15.0), n = 73 (19.9%) | 67.3 (13.9), n = 68 (18.6%) | 74.8 (14.6), n = 225 (61.5%) | |
| 2017 | IF (n = 8,940) | 85.1 (11.0), n = 2,142 (23.9%) | 69.6 (13.5), n = 1,125 (12.6%) | 78.2 (12.9), n = 5,673 (63.5%) |
| ITN (n = 1,702) | 86.7 (8.5), n = 473 (27.8%) | 72.7 (11.6), n = 141 (8.3%) | 81.2 (10.4), n = 1,088 (63.9%) | |
| RISE (n = 321) | 82.4 (10.5), n = 61 (19.0%) | 64.1 (14.7), n = 57 (17.8%) | 73.5 (14.4), n = 203 (63.2%) | |
| 2018 | IF (n = 9,658) | 85.2 (11.6), n = 2,345 (24.3%) | 69.3 (13.4), n = 1,247 (12.9%) | 78.2 (13.4), n = 6,066 (62.8%) |
| ITN (n = 1,634) | 86.5 (9.1), n = 427 (26.1%) | 72.7 (11.0), n = 161 (9.9%) | 81.2 (10.1), n = 1,046 (64.0%) | |
| RISE (n = 272) | 80.4 (16.8), n = 45 (16.5%) | 65.2 (14.1), n = 37 (13.6%) | 73.2 (14.0), n = 190 (69.9%) | |
-
* One-way ANOVA, all differences significant at p<0.001 level. The method to divide proposals between Full Agreement, No Agreement and Other is described in the Results section.
CR: Consensus Report; SD: standard deviation.
Table 5
CR scores (mean and SD), broken down by level of agreement between reviewers and scientific panel, for the three different H2020 Marie Skłodowska-Curie actions for 2014–2015 and 2016–2018.
| Mean CR score (SD) | |||||||
|---|---|---|---|---|---|---|---|
| Full agreement | No agreement | Other | |||||
| IF | 2014–15 | 2016–18 | 2014–15 | 2016–18 | 2014–15 | 2016–18 | |
| Overall | 85.0 (10.4) | 85.2 (11.1) | 70.4 (13.3) | 70.0 (13.4) | 78.9 (12.2) | 78.5 (12.9) | |
| CHE | 84.4 (9.4) | 85.2 (10.5) | 70.9 (13.0) | 70.5 (13.8) | 78.8 (10.9) | 79.1 (12.1) | |
| ECOSOC | 85.2 (12.3) | 84.0 (13.6) | 70.0 (14.2) | 69.7 (13.9) | 78.1 (13.7) | 76.3 (14.7) | |
| ENG | 83.4 (11.8) | 83.6 (12.8) | 67.8 (12.7) | 68.2 (13.2) | 76.1 (13.3) | 77.1 (14.2) | |
| ENV | 85.0 (10.7) | 85.4 (10.8) | 70.3 (13.7) | 70.2 (13.2) | 78.7 (12.3) | 79.5 (12.4) | |
| LIF | 85.7 (9.1) | 86.7 (10.2) | 72.1 (12.5) | 71.4 (12.9) | 80.4 (11.0) | 80.1 (11.5) | |
| MAT | 83.1 (12.3) | 85.5 (9.9) | 70.1 (14.6) | 68.9 (14.1) | 79.5 (12.6) | 78.9 (12.1) | |
| PHY | 84.8 (9.5) | 85.2 (8.4) | 72.5 (11.3) | 69.1 (12.3) | 80.4 (10.0) | 78.8 (10.7) | |
| ITN | 2014–15 | 2017–18 | 2014–15 | 2017–18 | 2014–15 | 2017–18 | |
| Overall | 84.1 (9.8) | 86.6 (8.8) | 73.0 (11.8) | 73.8 (11.3) | 79.2 (11.4) | 81.4 (10.3) | |
| CHE | 84.6 (7.7) | 87.8 (8.0) | 73.6 (13.0) | 76.9 (10.2) | 80.8 (10.0) | 84.3 (8.3) | |
| ECOSOC | 85.2 (9.7) | 85.1 (11.8) | 73.5 (13.4) | 73.7 (11.5) | 77.1 (13.7) | 80.1 (12.3) | |
| ENG | 83.1 (11.5) | 84.3 (9.6) | 71.0 (12.3) | 71.9 (11.8) | 77.9 (11.9) | 80.1 (10.0) | |
| ENV | 84.3 (8.5) | 89.1 (7.4) | 71.3 (12.8) | 71.9 (11.8) | 79.3 (10.8) | 82.2 (10.5) | |
| LIF | 84.0 (10.2) | 87.8 (7.5) | 74.3 (10.0) | 72.7 (13.0) | 80.4 (11.0) | 81.6 (10.2) | |
| MAT | 79.3 (10.4) | 85.6 (8.8) | 76.2 (6.3) | 70.9 (6.0) | 76.5 (9.9) | 77.3 (10.6) | |
| PHY | 85.7 (8.3) | 87.1 (7.2) | 77.1 (9.5) | 74.1 (11.7) | 81.2 (9.6) | 82.9 (9.0) | |
| RISE | 2014–18 | 2014–18 | 2014–18 | ||||
| Overall | 80.9 (14.2) | 66.3 (13.9) | 73.3 (14.9) | ||||
| CHE | 82.6 (11.3) | 67.3 (16.3) | 77.9 (12.4) | ||||
| ECOSOC | 81.1 (13.5) | 65.5 (13.7) | 70.5 (16.4) | ||||
| ENG | 78.0 (15.8) | 66.0 (14.7) | 72.3 (15.6) | ||||
| ENV | 80.2 (19.1) | 67.5 (11.2) | 74.8 (14.4) | ||||
| LIF | 79.9 (11.1) | 68.4 (13.8) | 72.4 (14.8) | ||||
| MAT | 84.4 (4.9) | 57.6 (14.2) | 74.4 (12.0) | ||||
| PHY | 65.9 (13.5) | 65.9 (13.5) | 76.8 (10.5) | ||||
-
* One-way ANOVA, all differences were significant at p<0.001 level. CR: Consensus Report; SD: standard deviation. CHE: Chemistry; ECOSOC: Economics and social sciences; ENG: Engineering; ENV: Environment; LIF: Life sciences; MAT: Mathematics; PHY: Physics.
We also identified 3,097 H2020 proposals for which the difference between the CR scores and the average of the IER scores was greater than 10 points (Table A2 in Supplementary file 2): in 38.9% of cases the difference was positive (meaning that the CR score was higher than the average of the IER scores), and in 61.1% of cases was negative (meaning that the CR score was lower than the average of the IER scores). The mean CR score for this subsample (67.8, SD = 18.37) was lower than that for all (FP7 and H2020) proposals (79.5, SD = 12.4), and the mean AD index (12.86, SD = 6.33) was higher than that for H2020 proposals (7.38, SD = 4.74).
That result indicates that proposals having a greater discrepancy between CR scores and the average of the IER scores show higher AD indices, and end up being more difficult to reach consensus. Another clear finding of our study is that the more reviewers disagree about a proposal, the lower the proposal’s final score. This trend was observed consistently over the years, for all type of actions, and in all scientific fields, confirming the observations from the FP7 dataset (Pina et al., 2015).
Discussion
Our analysis of over 75,000 thousand proposals from both FP7 and H2020, covering the period from 2007 to 2018, suggests that the peer review process used to evaluate these proposals is resistant to organizational changes, such as the reduction of the number of evaluation criteria and the format of the consensus meeting. In particular, our results suggest that face-to-face consensus meetings do not guarantee a better consensus, at least if one considers an outcome where the opinions of all reviewers involved would weigh equally in the final score (Gallo et al., 2013). Our results also suggest that the level of (dis)agreement among reviewers is more dependent on the type of action or the scientific panel, rather than the way peer review is organized.
Our study has some limitations. As a retrospective analysis focusing only on reviewer scores, it cannot provide an insight into the reasons why reviewers agree or disagree on a particular proposal. Reviewers may have diverse perceptions of their role during the evaluation process, and/or interpret the evaluation criteria differently (Abdoul et al., 2012). Disagreement could also arise from inherent characteristics of the proposals, with a recent study showing that interdisciplinary proposals tend to score lower (Bromham et al., 2016), or from reviewers taking a conservative approach to controversial proposals (Luukkonen, 2012). Also, our analysis does not explore if proposals with higher scores are more likely to be successful (in terms of future outputs) than proposals with lower scores. Indeed, the ability of peer review to predict future success, as measured by scientific productivity and impact, has been subject to contradictory findings (Bornmann and Daniel, 2005; Bornmann et al., 2008; Li and Agha, 2015; Fang et al., 2016; Lindner and Nakamura, 2015; van den Besselaar and Sandström, 2015). Finally, projects funded by the various Marie Curie actions require researchers to be mobile, and this might limit the relevance of our findings to other grant evaluation systems, though we have tried to guard against this by analysing three different types of actions, each with different levels of complexity and different success rates.
The MSCA evaluation process is currently evolving towards a system in which reviewers write Individual Evaluation Reports that do not contain numerical scores. The IF action started operating this way in 2019, and ITN and RISE followed in 2020. Although it will no longer be possible to undertake the sort of retrospective analysis of IER and CR scores we have performed here, as IER will not have scores anymore, it will still be possible to observe the overall distribution of CR scores over time and thus monitor the consistency of the process comparing current/future evaluation exercises with previous ones. We also suggest performing such analyses for other EU funding research programmes, as happens at other major funding agencies (Pier et al., 2018; Kaplan et al., 2008; Fang et al., 2016; Lindner and Nakamura, 2015; Martin et al., 2010). This would improve our understanding of the use of peer review to evaluate grant applications and proposals (Azoulay, 2012). The COVID-19 pandemic means that the use of remote consensus meetings is likely to increase under Horizon Europe, the successor to H2020 (European Commission, 2020). As such, this study gives us confidence that the outcomes of the grant peer review process will not be impacted by this change.
Methods
The EU's Marie Curie funding programme
The data for this study consisted of 24,897 proposals evaluated under MCA (IEF, ITN, IAPP; Pina et al., 2015) as part of the Seventh Framework Programme (FP7; 2007–2013), and 50,727 proposals evaluated under MSCA (IF, ITN, RISE; Table 1) as part of Horizon 2020 (H2020; 2014–2020). The Intra-European Fellowships (IEF) action and the Individual Fellowships (IF) action funded individual postdoctoral fellowships for mobile researchers. The Initial Training Networks (ITN) action and the Innovative Training Networks (also ITN) action funded projects that trained mobile doctoral candidates. The Industry-Academia Pathways and Partnerships (IAPP) action and the Research and Innovation Staff Exchange (RISE) action funded projects that promoted the mobility of staff between organizations from both public and private sectors.
The scoring scale used in FP7 and H2020 was based on five ordinal qualitative descriptors (0=fail, 1=poor, 2=fair, 3=good, 4=very good, and 5=excellent), with reviewers scoring MCA/MSCA proposals with one-digit decimal. In that context, a difference of 0.5 points or less (ie, 10 points or less when converted to a 0–100 scale for the final IER and CR scores) can be considered as a reasonably good agreement. The evaluation criteria used under FP7 were: (i) scientific and technological quality; (ii) training (ITN and IEF) or transfer of knowledge (IAPP); (iii) implementation; (iv) impact; (v) fellow candidate's CV (IEF only). The evaluation criteria used under H2020: (i) excellence; (ii) impact; (iii) implementation.
MCA/MSCA proposals were evaluated within one of the following panels: chemistry (CHE), economic sciences (ECO), information science and engineering (ENG), environment and geosciences (ENV), life sciences (LIF), mathematics (MAT), physics (PHY), and social sciences and humanities (SOC). For most of the period analysed, proposals in economic sciences and in social sciences and humanities were evaluated by the same pool of reviewers, so we have treated ECO and SOC as a single panel for the purposes of this study.
Data and analyses
The dataset in Supplementary file 1 includes data on all the proposals (n = 75,624) analysed in this study, sorted by type of action, call year and scientific panel. For each proposal, scores for the Consensus Report (CR) and the respective scores given by reviewers in their Individual Evaluation Report (IER) are reported. All analyses were performed with JASP statistical software v. 0.11.1.0. (JASP team, 2020), R v.3.6.3. (R Development Core Team, 2020), and SPSS Statistics for Windows v.19.0 (Corp, 2010).
Disclaimer
All views expressed in this article are strictly those of the authors and may in no circumstances be regarded as an official position of the Research Executive Agency or the European Commission.
Data availability
All data presented in this study are included in the manuscript and supporting files.
References
-
Scientific peer reviewAnnual Review of Information Science and Technology 45:199–245.https://doi.org/10.1002/aris.2011.1440450112
-
On average deviation indices for estimating interrater agreementOrganizational Research Methods 2:49–68.https://doi.org/10.1177/109442819921004
-
Estimating interrater agreement with the average deviation index: A user’s guideOrganizational Research Methods 5:159–172.https://doi.org/10.1177/1094428102005002002
-
The reliability of peer review for manuscript and grant submissions: A cross-disciplinary investigationBehavioral and Brain Sciences 14:119–135.https://doi.org/10.1017/S0140525X00065675
-
Peer review for improving the quality of grant applicationsCochrane Database of Systematic Reviews 214:MR000003.https://doi.org/10.1002/14651858.MR000003.pub2
-
Panel discussion does not improve reliability of peer review for medical research grant proposalsJournal of Clinical Epidemiology 65:47–52.https://doi.org/10.1016/j.jclinepi.2011.05.001
-
How reliable is peer review? An examination of operating grant proposals simultaneously submitted to two similar peer review systemsJournal of Clinical Epidemiology 50:1189–1195.https://doi.org/10.1016/S0895-4356(97)00167-4
-
Bias in peer reviewJournal of the American Society for Information Science and Technology 64:2–17.https://doi.org/10.1002/asi.22784
-
Conservatism and risk-taking in peer review: Emerging ERC practicesResearch Evaluation 21:48–60.https://doi.org/10.1093/reseval/rvs001
-
Peering at peer review revealed high degree of chance associated with funding of grant applicationsJournal of Clinical Epidemiology 59:842–848.https://doi.org/10.1016/j.jclinepi.2005.12.007
-
SoftwareR: A Language and Environment for Statistical ComputingR Foundation for Statistical Computing, Vienna, Austria.
-
Assessing interrater agreement via the average deviation index given a variety of theoretical and methodological problemsOrganizational Research Methods 16:127–151.https://doi.org/10.1177/1094428112465898
Decision letter
-
Cassidy R SugimotoReviewing Editor; Indiana University Bloomington, United States
-
Peter RodgersSenior Editor; eLife, United Kingdom
-
Jesper Wiborg SchneiderReviewer; Aarhus University, Denmark
In the interests of transparency, eLife publishes the most substantive revision requests and the accompanying author responses.
Thank you for submitting your article "Meta-research: On-site or remote grant evaluation do not affect reviewers' agreement and scores of Marie Curie proposals" to eLife for consideration as a Feature Article. Your article has been reviewed by three peer reviewers, and the evaluation has been overseen by Cassidy Sugimoto as the Reviewing Editor. The following individual involved in review of your submission has agreed to reveal their identity: Jesper Wiborg Schneider (Reviewer #3).
The reviewers have discussed the reviews with each other and the Reviewing Editor has drafted this decision letter to help you prepare a revised submission.
Summary:
This paper aims at analyzing the effect of location of review (on-site or remote) on reviewers' agreements and evaluation, using proposals submitted to the Marie (Skłodowska-)Curie Actions proposals under the EU's Seventh Research Framework program (FP7; 2007-2013) and then the Horizon 2020 (H2020; 2014-2018) framework program for research and innovation over a period of 12 year. The analysis is performed using time-series analysis, comparing the Seventh Framework Programme (25,000 proposals) and Horizon 2020 (52,000 proposals), focusing on the difference between onsite and remote meetings. Results show that no important differences were observed between the organization of reviews, and that reviewers' agreement were similar in all cases.
The creation of this evidence-base for directing policy decisions is to be highly commended. And importantly, the variables examined were very stable over the observed period, providing some evidence that the move from the FP7 program to the H2020 was not greatly affected over time. In the current COVID situation, these findings have clear policy implications for the grant review process. Significant revisions, however, are necessary to improve the quality of the manuscript and the robustness of the results.
Essential revisions:
1) The work lacks proper motivation and contextualization with the current literature. Several highly relevant contemporary studies have been overlooked as well as fundamental research within the area. Some suggested references include:
Witteman, H. O., Hendricks, M., Straus, S., and Tannenbaum, C. (2019). Are gender gaps due to evaluations of the applicant or the science? A natural experiment at a national funding agency. The Lancet, 393(10171), 531-540.
Lee, C. J., Sugimoto, C. R., Zhang, G., and Cronin, B. (2013). Bias in peer review. Journal of the American Society for Information Science and Technology, 64(1), 2-17.
Murray, D., Siler, K., Larivière, V., Chan, W. M., Collings, A. M., Raymond, J., and Sugimoto, C. R. (2019). Gender and international diversity improves equity in peer review. BioRxiv, 400515.
The work generally motivates on the assumption that there is "fear that shifting from on-site to remote consensus meetings negatively affects the quality and the robustness of the evaluation process." This motivation could be strengthened with engagement with the literature, particularly that which reviews mode shifting as well as different approaches to peer review. While the rationale for the study is implied, it should be made explicit.
2) eLife is read by an international audience. Therefore, more information on the evaluation process is warranted, to ensure that the readership is familiar with the various programs and systems. A schematic representation or references to external sources would be helpful. The use of acronyms and the changing variables over time make it difficult to understand and evaluate.
3) A limitation of the present analysis is on the particularistic aspects of the program (i.e., an elite program focused on young researchers). The authors should discuss generalizability and potential limitations. The broader meta-research interests of this study should be emphasized.
4) The main focus of this study is on the comparison between remote and in-person reviewing. However, there seems to be considerable ambiguity in the comparison. Questions regarding the data are listed below:
a) Data from the FP7 program is only from in person reviews, whereas data from the 2014-2016 H2020 program includes in-person and remote reviews. It is not entirely clear what the proportion of in person and remote reviews was. Then, it seems there is a complete shift to remote reviews happened in 2016 for H2020. While initially some comparisons are listed in the manuscript between the H2020 program before and after the 2016 switch, later comparisons seem to be made between all FP7 data and all H2020 data (Table 1 and Figure 2), which presumably are not fair comparisons (at least to address the effect of review format), because some of the H2020 data are in person and some are remote. Particularly, it would be useful to include histogram comparisons of before 2016 and after for H2020.
b) In addition, it seems in 2016, for the ITN program 4 reviewers were used instead of 3 for other H2020 years, as well as 3 for FP7. Yet it still seems the ITN data with 4 reviewers was included in the analysis for Figure 2, but was removed for the agreement analysis in Table 2/3. It is unclear why this data wasn't removed from the analysis in Figure 2, as it is unclear what effect different # of reviewers might have on these histograms.
c) Other differences exist as well, including 4 criteria used for FP7 and 3 for H2020, while individual fellowships had a fifth criterion. Also, different Actions had different weighting of criteria scores to calculate the overall score, and therefore it is not entirely clear these comparisons are appropriate.
d) Also, the number of proposals (and presumably the funding success rates) are significantly different between FP7 and H2020, but how this effects the results is not discussed.
e) In Figure 3, again it seems all the H2020 data are compared to FP7. Also, it looks as though the mean square error for H2020 in Figure 3 is larger than FP7, perhaps indicating more robust/impactful discussion. It may be interesting to compare these results to other work examining scoring patterns before and after discussion for in person and remote panels (Carpenter et al., 2015).
f) The use of different reviewer scores are generally hard to follow. It is not clear when the authors analyze the proposals based on reviewer scores from the Individual Evaluation Reports (IER) or the Consensus Report (CR). One example are the analyses based on CR scores and AD indices presented in Table 1. The authors show that the mean CR score appears stable between the two periods, but also that the Absolute Deviation (AD) Index is stable. The CR score is obviously the consensus score from the reviewers' consensus meeting, but the AD index must be from the Individual Evaluation Reports (?). Why would we expect these individual review scores, and the deviation between them, to differ across the time periods when the policy change relates to the way consensus meetings are conducted? This is important as the authors argue that consensus meetings could feasibly be held remotely because review score deviations does not depend on a remote/non-remote meeting. This comes across as largely a strawman argument.
5) There are also several concerns about analysis:
a) As there are many changing factors, a bit more focus on directly comparable data sub-sets (controlling as many variables as possible) which are centered on a specific issue (in-person vs remote reviews, 4 vs 3 reviewers, 4 vs 3 criteria, hi/lo success rate etc.) would be helpful. It may be useful to use a multi-level regression approach to examine blocks of factors and their relative effect on CR score, AVIER-CR score and AD so one can more easily assess their importance.
b) The authors argue that proposals with higher CR scores also exhibit lower reviewer disagreement (i.e. low AD index). Figure 3 shows the raw scatter plot of these variables, but it seems that the correlation is very week, with e.g. AD scores of 10 being widely scattered across CR values of 50-100.
c) In the Transparent reporting form the authors state that they "did not perform sample size estimation" because they included "[a]ll available proposals from 2007 to 2018" in the analysis and therefore analyses the "entire population". Nevertheless, frequentists inferential statistics are employed which seem odd; there is no real stochastic data generation mechanism to be studied. It is not clear how CI and p-values should be interpreted in this context – it would be some imaginary sampling process to a non-existing super-population which makes it all a bit far out for a proper comprehension.
d) It is not clear how the comparison strategy for interrupted-time-series were planned. One could argue that the lumping together of all years before and after dampens any effect if indeed such an effect were present.
6) What evidence is available regarding the construction of aggregate consensus scores? Can the authors discuss why "consensus negotiations" seem to end up in the same region repeatedly?
7) Finally, the authors also do not discuss the likelihood that subtle differences between remote and in person reviews might still exist that are not detected with these analyses. For instance, it has been reported that discussion time is shorter for remote reviews (Gallo et al., 2013), which may suggest less robust reviews. Less discussion may also yield more biased reviews, which would represent a decrease in review quality.
8) While it seems rather obvious for the reader that there is no practical difference between conditions in most of the comparisons, yet the authors seem to make the claims based on the "statistical significance filter". That is problematic for several reasons; one is given above in point 7. Another is the logical fallacy of claiming "no difference" due to a failure to reject the null hypothesis. Yes, the difference in minuscule -0,.22 [CI = -1.47 – 1.02] – but failing to reject a null hypothesis cannot be translated into a claim of "no difference" – that claim has to be warranted by other means. Interestingly, just below this statement is one that firmly claims an effect, this time the difference is 1.06 points [CI = 0.75 – 1.37] and it is "statistically significant". This is selection on "significance". Yes, the point estimate is more precisely estimated but it is still very low. Which raise the question of why the "non-significant" estimate above fails the test given it large sample size? Why study the compatibility of data under (a false) H0 in an imaginary infinite random sampling procedure?
9) This also undermines the statements where the authors claim that the large sample sizes produce the "statistical significance" (which in principle is correct), and then further state that "so the statistical differences can be attributed to sample size rather than actual meaningful differences". "Statistical significance" is a complicated and misunderstood concept. It is very hard to interpret when examining non-experimental data such as an apparent population. And "statistical differences" – no matter how they are produced – cannot tell you to what extent such differences might be meaningful.
10) To enhance the policy relevance, the work should engage more deeply with the contemporary literature in the discussion. The work may also want to particularly engage with literature that discusses mode shifting in the pandemic across several sectors. This will help situate the contribution more firmly.
https://doi.org/10.7554/eLife.59338.sa1Author response
Essential revisions:
1) The work lacks proper motivation and contextualization with the current literature. Several highly relevant contemporary studies have been overlooked as well as fundamental research within the area. Some suggested references include:
Witteman, H. O., Hendricks, M., Straus, S., and Tannenbaum, C. (2019). Are gender gaps due to evaluations of the applicant or the science? A natural experiment at a national funding agency. The Lancet, 393(10171), 531-540.
Lee, C. J., Sugimoto, C. R., Zhang, G., and Cronin, B. (2013). Bias in peer review. Journal of the American Society for Information Science and Technology, 64(1), 2-17.
Murray, D., Siler, K., Larivière, V., Chan, W. M., Collings, A. M., Raymond, J., and Sugimoto, C. R. (2019). Gender and international diversity improves equity in peer review. BioRxiv, 400515.
The work generally motivates on the assumption that there is "fear that shifting from on-site to remote consensus meetings negatively affects the quality and the robustness of the evaluation process." This motivation could be strengthened with engagement with the literature, particularly that which reviews mode shifting as well as different approaches to peer review. While the rationale for the study is implied, it should be made explicit.
We thank the editors and reviewers for their observation, and we redrafted the Introduction in order to focus on the main purpose of the study, which is to assess whether organizational changes in the evaluation process affected the scoring behaviour and level of agreement among reviewers. The comment that there is “fear that shifting {…] evaluation process” has been removed.
2) eLife is read by an international audience. Therefore, more information on the evaluation process is warranted, to ensure that the readership is familiar with the various programs and systems. A schematic representation or references to external sources would be helpful. The use of acronyms and the changing variables over time make it difficult to understand and evaluate.
We thank the editors and reviewers for suggesting to add a schematic representation of the data analysed. We now introduced a new Table 1, where we indicated, for each year of evaluation (call year) and type of actions under study, the number of proposals, number of evaluation criteria applicable for that call, and the review format (on-site or remote consensus). We also describe MSCA grant system in detail in the Analytical Framework part of the Methods section.
3) A limitation of the present analysis is on the particularistic aspects of the program (i.e., an elite program focused on young researchers). The authors should discuss generalizability and potential limitations. The broader meta-research interests of this study should be emphasized.
We thank the editors and reviewers for flagging this study limitation. We have addressed this in the Discussion section where we state that the results cannot be generalized to other grant systems. Nevertheless, we would like to stress the fact that the MSCA program has an important global impact on research, as mobility funding is not restricted to Europe but to the global scientific community.
4) The main focus of this study is on the comparison between remote and in-person reviewing. However, there seems to be considerable ambiguity in the comparison. Questions regarding the data are listed below:
a) Data from the FP7 program is only from in person reviews, whereas data from the 2014-2016 H2020 program includes in-person and remote reviews. It is not entirely clear what the proportion of in person and remote reviews was. Then, it seems there is a complete shift to remote reviews happened in 2016 for H2020. While initially some comparisons are listed in the manuscript between the H2020 program before and after the 2016 switch, later comparisons seem to be made between all FP7 data and all H2020 data (Table 1 and Figure 2), which presumably are not fair comparisons (at least to address the effect of review format), because some of the H2020 data are in person and some are remote. Particularly, it would be useful to include histogram comparisons of before 2016 and after for H2020.
We thank the editors and reviewers for this observation and acknowledge the need to disambiguate the data under study. We now reorganized the study, with each type of action being analysed separately, throughout the article, and by focusing on the effect of the two relevant organizational changes occurring over time, i.e. the reduction of the number of evaluation criteria in 2014, and the shift in the consensus format, from on-site to remote consensus meetings, for ITN and IF (happening in 2016-17). All figures and tables are now presented with the data of the three type of actions shown separately. We also changed the title of the manuscript to reflect these changes.
b) In addition, it seems in 2016, for the ITN program 4 reviewers were used instead of 3 for other H2020 years, as well as 3 for FP7. Yet it still seems the ITN data with 4 reviewers was included in the analysis for Figure 2, but was removed for the agreement analysis in Table 2/3. It is unclear why this data wasn't removed from the analysis in Figure 2, as it is unclear what effect different # of reviewers might have on these histograms.
We thank the editors and reviewers for this remark. In order to make the analysis coherent and comparable, we excluded the data related to ITN 2016 from all analyses.
c) Other differences exist as well, including 4 criteria used for FP7 and 3 for H2020, while individual fellowships had a fifth criterion. Also, different Actions had different weighting of criteria scores to calculate the overall score, and therefore it is not entirely clear these comparisons are appropriate.
The difference in the number of evaluation criteria is now one of the two organizational changes under study, together with the transition from on-site to remote consensus for ITN and IF. Also, as mentioned under point 4.a. the three type of actions ( IEF/IF, ITN and IAPP/RISE) are now presented separately, which makes the analysis of the effect of the reduction of the number of evaluation criteria possible. Therefore, the analysis allows now for the assessment of a single change at the time, for each of the three type of actions.
d) Also, the number of proposals (and presumably the funding success rates) are significantly different between FP7 and H2020, but how this effects the results is not discussed.
Success rates are not so different between FP7 and H2020. The number of proposals generally increased over the years, but so did the available funding. The differences in success rates are mostly a characteristic of the type of action. For instance, ITN remained always the most competitive with a success rate around 10%, both in FP7 and H2020. We now clarify this in more detail in the Analytical framework paragraph under Methods section.
e) In Figure 3, again it seems all the H2020 data are compared to FP7. Also, it looks as though the mean square error for H2020 in Figure 3 is larger than FP7, perhaps indicating more robust/impactful discussion. It may be interesting to compare these results to other work examining scoring patterns before and after discussion for in person and remote panels (Carpenter et al., 2015).
We thank the editors and reviewers for this remark. As reported for point 4)a, we now decided to present the results separately for each of the three type of actions (the new Figure 3). Therefore, the data are not presented anymore as aggregate numbers for FP7 vs H2020, but rather as data for IEF/IF, ITN and IAPP/RISE. We also assessed the two organizational changes observed over time for each of the action type.
f) The use of different reviewer scores are generally hard to follow. It is not clear when the authors analyze the proposals based on reviewer scores from the Individual Evaluation Reports (IER) or the Consensus Report (CR). One example are the analyses based on CR scores and AD indices presented in Table 1. The authors show that the mean CR score appears stable between the two periods, but also that the Absolute Deviation (AD) Index is stable. The CR score is obviously the consensus score from the reviewers' consensus meeting, but the AD index must be from the Individual Evaluation Reports (?). Why would we expect these individual review scores, and the deviation between them, to differ across the time periods when the policy change relates to the way consensus meetings are conducted? This is important as the authors argue that consensus meetings could feasibly be held remotely because review score deviations does not depend on a remote/non-remote meeting. This comes across as largely a strawman argument.
Thank you for your comment. As a result of the way how results are presented in this new version of the manuscript, by type of action and considering the two changing events in the evaluation process, all tables and figures were reworked accordingly.
We agree with the reviewers that the AD index is related to the IER phase and as such should not be affected by the way consensus meetings are organized. However, we also assessed the effect of the transition from FP7 to H2020 where the number of criteria changed and that may have had an effect on individual raters' agreement (i.e. AD indices). Furthermore, we drew our conclusions about the effect of change in the organization of consensus meeting from the CR scores (Table 2) and the differences between CR scores and average IER scores (Figure 2A). In that sense, the AD indices show evidence about the stability of the IER phase. This is an important piece of information for building our argument. In case that we had found the effect, the stable AD indices would strengthen the argument for attributing that effect to the change from the "on-site" to "remote" consensus meeting. Given that we found no effect, the AD indices seem superfluous, yet we could not make any conclusions if we did not have evidence of basic stability of IER phase.
5) There are also several concerns about analysis:
a) As there are many changing factors, a bit more focus on directly comparable data sub-sets (controlling as many variables as possible) which are centered on a specific issue (in-person vs remote reviews, 4 vs 3 reviewers, 4 vs 3 criteria, hi/lo success rate etc.) would be helpful. It may be useful to use a multi-level regression approach to examine blocks of factors and their relative effect on CR score, AVIER-CR score and AD so one can more easily assess their importance.
Thank you for your comment. We agree that a multilevel analysis would be very interesting; however, we do not have the proper data to perform a multilevel regression analysis because if we would like to have a comparison between the high and low success rates, 3 vs 4 reviewers and across the calls, we should have all combinations for each project call. For example, we should have IAPP/RISE which would have low success rate and 3 reviewers vs IAPP/RISE with high success and 3 reviewers, then the same combination with 4 reviewers, and the same for IF and ITN.
As it can be noted from Table 1, that condition was not satisfied and therefore we decided to provide more granular data for each call by analysing them separately. So, presenting the results across the calls is already the segmentation of scores across smaller parts, and we used the same procedure to examine the differences across different calls.
b) The authors argue that proposals with higher CR scores also exhibit lower reviewer disagreement (i.e. low AD index). Figure 3 shows the raw scatter plot of these variables, but it seems that the correlation is very week, with e.g. AD scores of 10 being widely scattered across CR values of 50-100.
Thank you for your comment. This statement was removed in the revised manuscript.
c) In the "transparent reporting form" the authors state that they "did not perform sample size estimation" because they included "[a]ll available proposals from 2007 to 2018" in the analysis and therefore analyses the "entire population". Nevertheless, frequentists inferential statistics are employed which seem odd; there is no real stochastic data generation mechanism to be studied. It is not clear how CI and p-values should be interpreted in this context – it would be some imaginary sampling process to a non-existing super-population which makes it all a bit far out for a proper comprehension.
Confidence intervals were removed, and we introduced standard deviation as a measure of dispersion, as we analysed the whole dataset (the whole population). However, in the ITS analysis we decided to keep the confidence intervals to assess the significance of the differences, as well as the potential size of the differences.
d) It is not clear how the comparison strategy for interrupted-time-series were planned. One could argue that the lumping together of all years before and after dampens any effect if indeed such an effect were present.
Thank you for your comment. We refined our analysis across the calls now, and we provided the additional explanation for ITS procedure. Now we have separate comparisons for separate calls and this provides a comprehensive overview of the assessment shift across calls.
6) What evidence is available regarding the construction of aggregate consensus scores? Can the authors discuss why "consensus negotiations" seem to end up in the same region repeatedly?
Thank you for your comment. This is now resolved by separate ITS analysis and the answer to this question is under 5)d.
7) Finally, the authors also do not discuss the likelihood that subtle differences between remote and in person reviews might still exist that are not detected with these analyses. For instance, it has been reported that discussion time is shorter for remote reviews (Gallo et al., 2013), which may suggest less robust reviews. Less discussion may also yield more biased reviews, which would represent a decrease in review quality.
We thank the editors and reviewers for this pertinent observation. In the context of the Marie Curie programme, the remote consensus meetings are organized in a way that they have the same discussion time as when the meetings were held on-site, face-to-face. A statement on this issue has been added to the Discussion section of the revised manuscript.
8) While it seems rather obvious for the reader that there is no practical difference between conditions in most of the comparisons, yet the authors seem to make the claims based on the "statistical significance filter". That is problematic for several reasons; one is given above in point 7. Another is the logical fallacy of claiming "no difference" due to a failure to reject the null hypothesis. Yes, the difference in minuscule -0,.22 [CI = -1.47 – 1.02] – but failing to reject a null hypothesis cannot be translated into a claim of "no difference" – that claim has to be warranted by other means. Interestingly, just below this statement is one that firmly claims an effect, this time the difference is 1.06 points [CI = 0.75 – 1.37] and it is "statistically significant". This is selection on "significance". Yes, the point estimate is more precisely estimated but it is still very low. Which raise the question of why the "non-significant" estimate above fails the test given it large sample size? Why study the compatibility of data under (a false) H0 in an imaginary infinite random sampling procedure?
We thank the editors and reviewers for this remark. We redrafted the text to state that the differences were significant but extremely small. Furthermore, instead of stating that there was no difference between the groups, we now state that the scores were similar between groups.
9) This also undermines the statements where the authors claim that the large sample sizes produce the "statistical significance" (which in principle is correct), and then further state that "so the statistical differences can be attributed to sample size rather than actual meaningful differences". "Statistical significance" is a complicated and misunderstood concept. It is very hard to interpret when examining non-experimental data such as an apparent population. And "statistical differences" – no matter how they are produced – cannot tell you to what extent such differences might be meaningful.
We agree with the editors and reviewers about the difficulty in interpreting the concept of “statistical significance”. Therefore, we decided to remove this phrase in the text so that it does not cause confusion.
10) To enhance the policy relevance, the work should engage more deeply with the contemporary literature in the discussion. The work may also want to particularly engage with literature that discusses mode shifting in the pandemic across several sectors. This will help situate the contribution more firmly.
We thank the editors and reviewers in proposing to expand the discussion in view of the current COVID-19 pandemic. We highlighted relevant implication that this study entails in the revised manuscript.
https://doi.org/10.7554/eLife.59338.sa2Article and author information
Author details
Funding
Hrvatska Zaklada za Znanost (IP-2019-04-4882)
- Ana Marušić
The funders had no role in study design, data collection and interpretation, or the decision to submit the work for publication.
Publication history
- Received:
- Accepted:
- Version of Record published:
- Version of Record updated:
Copyright
© 2021, Pina et al.
This article is distributed under the terms of the Creative Commons Attribution License, which permits unrestricted use and redistribution provided that the original author and source are credited.
Metrics
-
- 3,366
- views
-
- 231
- downloads
-
- 20
- citations
Views, downloads and citations are aggregated across all versions of this paper published by eLife.
Citations by DOI
-
- 20
- citations for umbrella DOI https://doi.org/10.7554/eLife.59338
Download links
A two-part list of links to download the article, or parts of the article, in various formats.
Downloads (link to download the article as PDF)
Open citations (links to open the citations from this article in various online reference manager services)
Cite this article (links to download the citations from this article in formats compatible with various reference manager tools)
Meta-Research: A retrospective analysis of the peer review of more than 75,000 Marie Curie proposals between 2007 and 2018
eLife 10:e59338.
https://doi.org/10.7554/eLife.59338


