Group size and composition influence collective movement in a highly social terrestrial bird
- Max Planck Institute of Animal Behavior, Department of Collective Behavior, Universitätsstraße, Germany
- University of Konstanz, Department of Biology, Universitätsstraße, Germany
- University of Konstanz, Center for the Advanced Study of Collective Behaviour, Universitätsstraße, Germany
- Kenya Wildlife Service, Kenya
- Department of Ornithology, National Museums of Kenya, Kenya
Figures
Figure 1
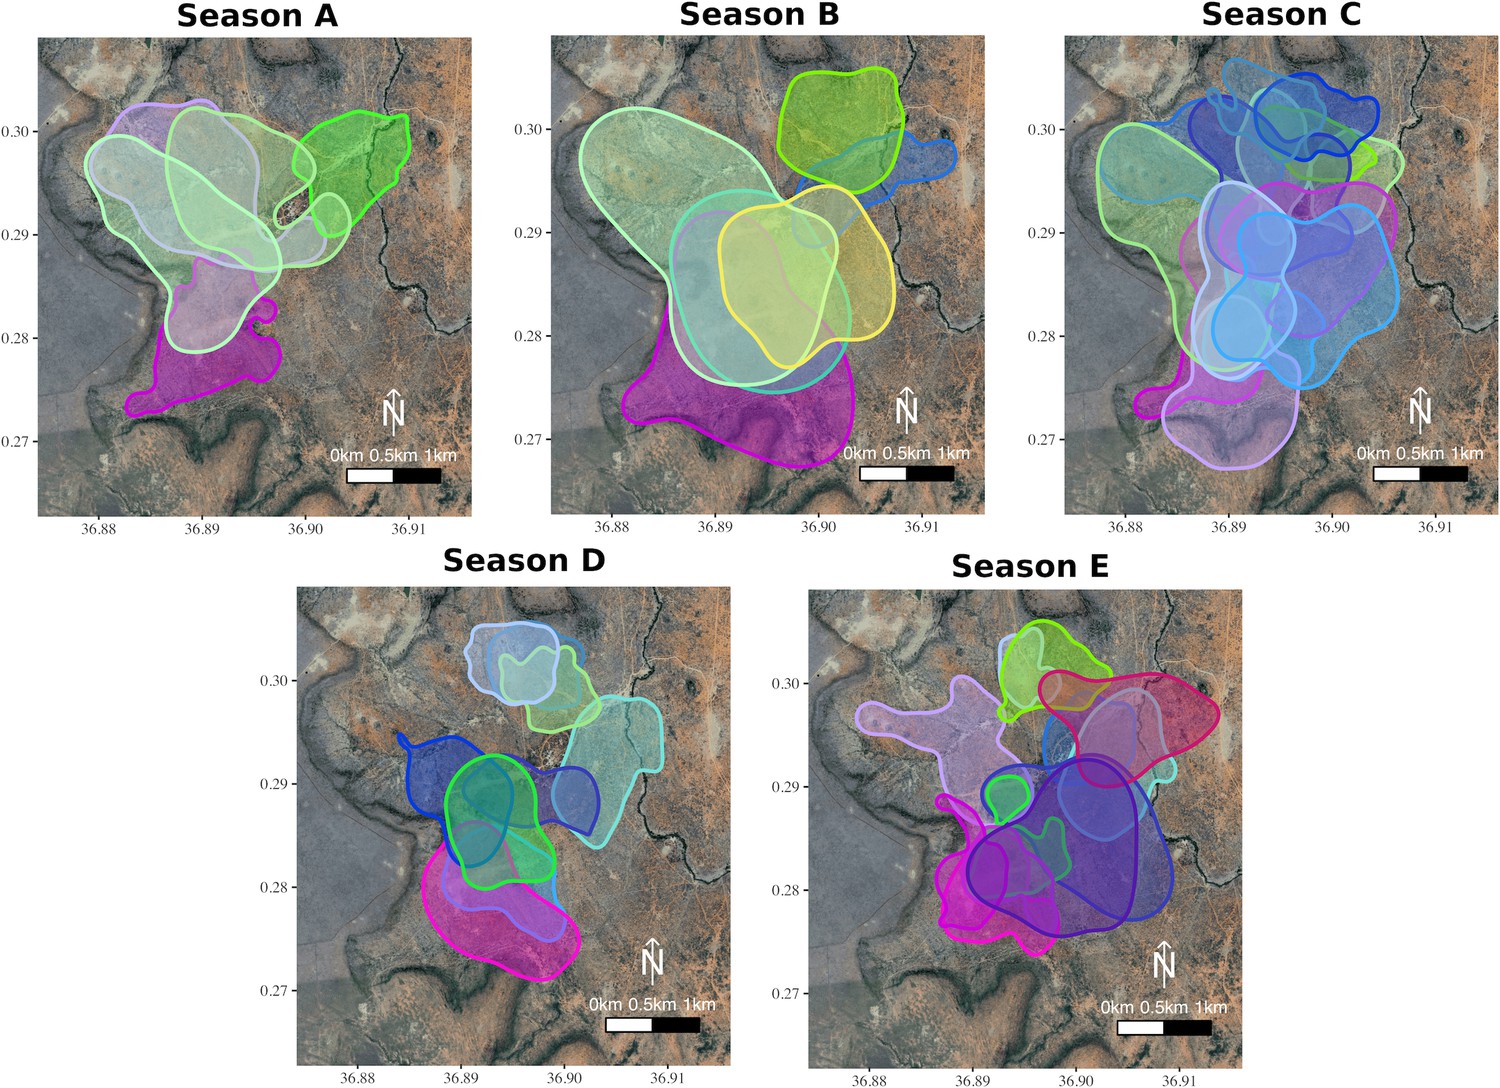
Group home-ranges in each of the study seasons.
The overlapping home-ranges (95% Auto-correlated Kernel Density Estimate; Fleming et al., 2015 of each the groups (up to 21 per season) across five different seasons calculated from the ctmms). Seasonal data were collected during periods of two months defined as being intermediate in terms of rainfall and greenness, as groups split to reproduce during twice-yearly breeding seasons and make exceptional movements to find water during droughts (see Materials and methods). These seasons were (A) 30.5.2017 to 1.8.2017, (B) 15.12.2017 to 15.2.2018, (C) 1.8.2018 to 29.9.2018, (D) 10.6.2019 to 9.8.2019, and (E) 14.1.2020 to 16.3.2020. Group membership was determined from daily census observations, and one GPS-tagged individual was selected at random from each group to define the group’s movement. Each distinct group is represented by a specific colour, and group colours are kept consistent across seasons.
Figure 2

The distribution of number of adults in each of the focal groups is bimodal.
The most common group sizes were either smaller or larger, with fewer groups having an intermediate group size.
Figure 3
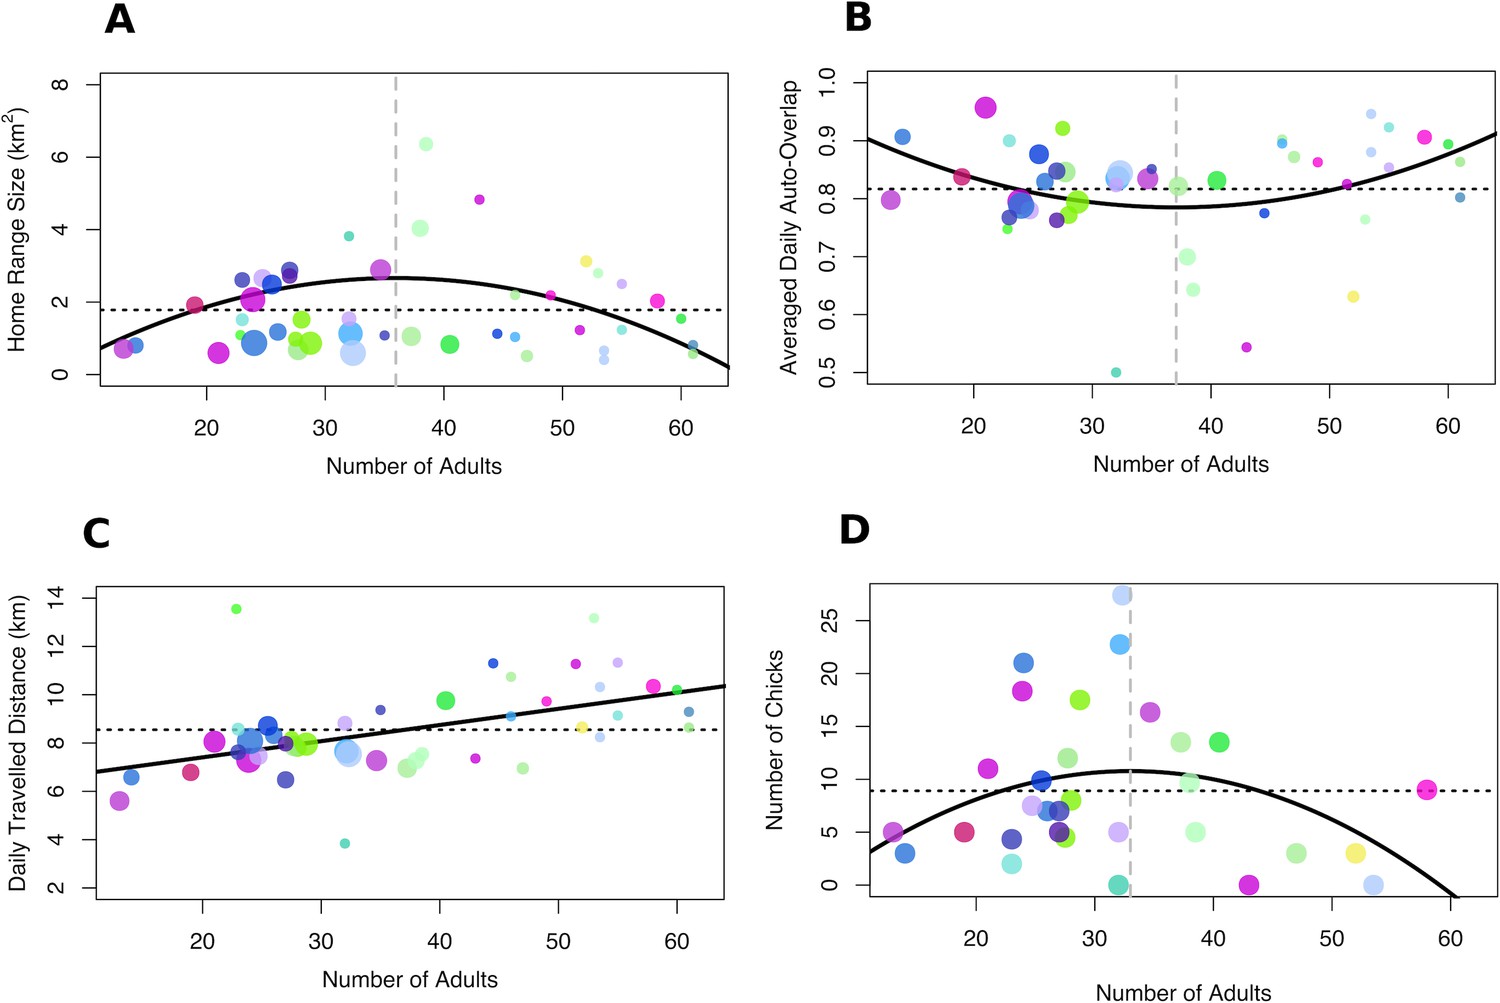
Relationship between group size, collective movement parameters and fitness.
(A) Home-range size and (B) average daily home-range overlap were maximised and minimised at intermediate group sizes, respectively. By contrast, (C) average daily distance travelled increased with group size. (D) Fitness, measured as the number of chicks per group in seasons when chicks were present in the population, was maximised for intermediate-sized groups. Each dot represents one group in one season and the colours for each group remain consistent with Figure 1. The size of the dots represents the number of chicks in the group for panels A–C. Solid black lines represent the fit of the data (in the absence of chicks for panels A–C), dashed black lines represent the mean across all group sizes and vertical dashed grey lines in A, B, and D represent the group size for which the curve of the response variable reaches a maximum (A and D) or a minimum (B).
Figure 4
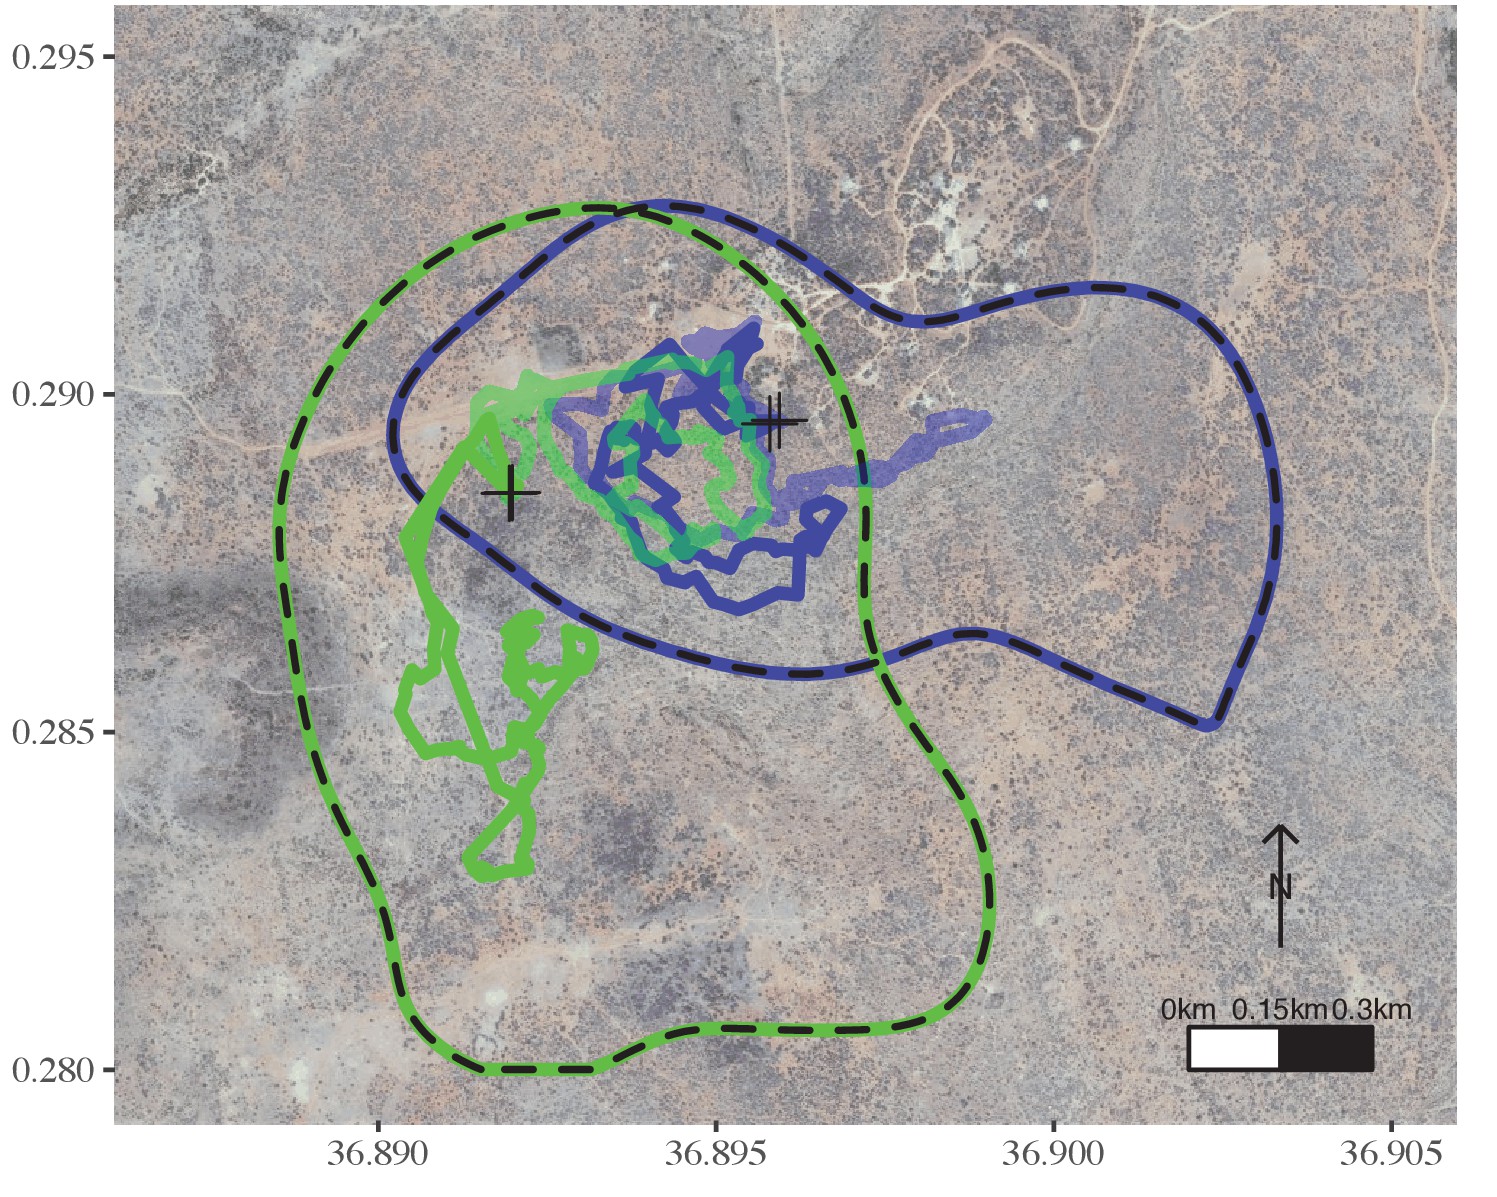
Movement characteristics of intermediate-sized groups differ from those of large groups.
In a given season, a group of intermediate size (green) ranged in a wider area than a larger group (blue) and explored different areas on consecutive days, while the two groups overlapped at the same areas on the same days. Neither of these groups had chicks. The dashed lines represent the 95% AKDE for Season D for each focal group. The transparent and non-transparent tracks are from 2 consecutive days. Crosses represent the night roosts for these 2 consecutive days. Groups are coloured as in Figures 1 and 3.
Tables
Table 1
Summary of the GEE results.
| Response variable | Model ID | Independent variables | Estimate | Standard error | Wald | P | R2 | QIC | |
|---|---|---|---|---|---|---|---|---|---|
| A | Home range | m18 | Intercept | −1.37 | 1.12 | 1.50 | 0.221 | 0.187 | 60 |
| Number of Adults | 0.224 | 0.08 | 7.86 | 0.005 | |||||
| Number of Adults2 | −0.003 | 0.001 | 8.42 | 0.004 | |||||
| Number of Adults:Number of Chicks | −0.006 | 0.002 | 7.91 | 0.005 | |||||
| Number of Adults2:Number of Chicks | 1.225 × 10⁻⁴ | 4.93 × 10⁻⁵ | 6.16 | 0.013 | |||||
| B | Average temporal overlap in space use | m6 | Intercept | 1.025 | 0.10 | 101.31 | <0.001 | 0.098 | 3.58 |
| Number of Adults | −0.013 | 0.01 | 4.64 | 0.031 | |||||
| Number of Adults2 | 1.744 × 10⁻⁴ | 7.577 × 10⁻⁵ | 5.30 | 0.021 | |||||
| C | Average daily distance travelled | m11 | Intercept | 6.068 | 0.68 | 79.97 | <0.001 | 0.247 | 116 |
| Number of Adults | 0.067 | 0.02 | 16.51 | <0.001 | |||||
| D | Speed while Travelling (m/s) | m14 | Intercept | 0.143 | 0.03 | 21.70 | <0.001 | 0.191 | 3.78 |
| Number of Adults | 0.002 | 2 × 10⁻³ | 1.43 | 0.232 | |||||
| Number of Adults2 | 1.602 × 10⁻⁵ | 2.73 × 10⁻⁵ | 0.35 | 0.556 | |||||
| E | Number of chicks | m73 | Intercept | −6.491 | 7.04 | 0.85 | 0.357 | 0.123 | 1295 |
| Number of Adults | 1.047 | 0.49 | 4.65 | 0.031 | |||||
| Number of Adults2 | −0.016 | 0.01 | 4.76 | 0.029 |
Additional files
-
Supplementary file 1
Summary data and GEEs.
(A) includes the summary data for each group across the five study seasons. (B-F) present all GEEs fitted. Those with the lowest QIC, for each response variable, are also presented in the main text.
- https://cdn.elifesciences.org/articles/59902/elife-59902-supp1-v1.xlsx
-
Transparent reporting form
- https://cdn.elifesciences.org/articles/59902/elife-59902-transrepform-v1.pdf
Download links
A two-part list of links to download the article, or parts of the article, in various formats.
Downloads (link to download the article as PDF)
Open citations (links to open the citations from this article in various online reference manager services)
Cite this article (links to download the citations from this article in formats compatible with various reference manager tools)
Group size and composition influence collective movement in a highly social terrestrial bird
eLife 9:e59902.
https://doi.org/10.7554/eLife.59902


