Meta-Research: Task specialization across research careers
- Delft Institute of Applied Mathematics, Delft University of Technology, Netherlands
- Centre for Science and Technology Studies, Leiden University, Netherlands
- Centre for Research on Evaluation, Science and Technology (CREST), Stellenbosch University, South Africa
- School of Informatics, Computing, and Engineering, Indiana University Bloomington, United States
- École de bibliothéconomie et des sciences de l'information, Université de Montréal, Canada
Figures
Figure 1
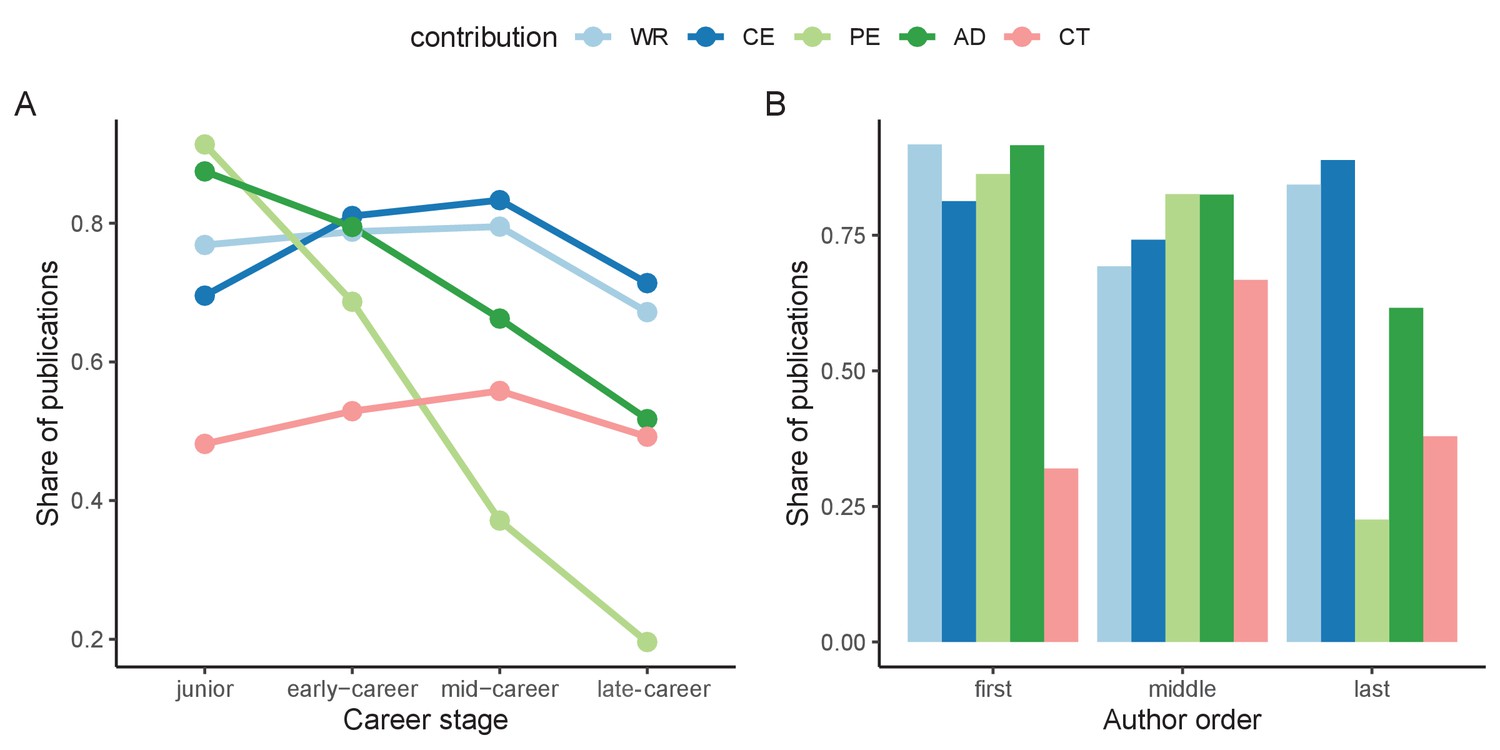
Distribution of contributions by career stage and author order.
(A) Share of publications of authors by contributorship at each career stage. (B) Share of publications of authors by contributorship based on their author position in each paper. Only publications with at least 3 authors are included for B. Career stages: junior stage (< 5 years since first publication); early-career stage (≥ 5 and < 15 since first publication); mid-career stage (≥ 15 and < 30 years since first publication); and full career stage (≥ 30 years since first publication). WR (wrote the paper); AD (analyzed the data); CE (conceived and designed the experiments); CT (contributed reagents/materials/analysis tools); PE (performed the experiments); NC (number of contributions).
Figure 2 with 1 supplement
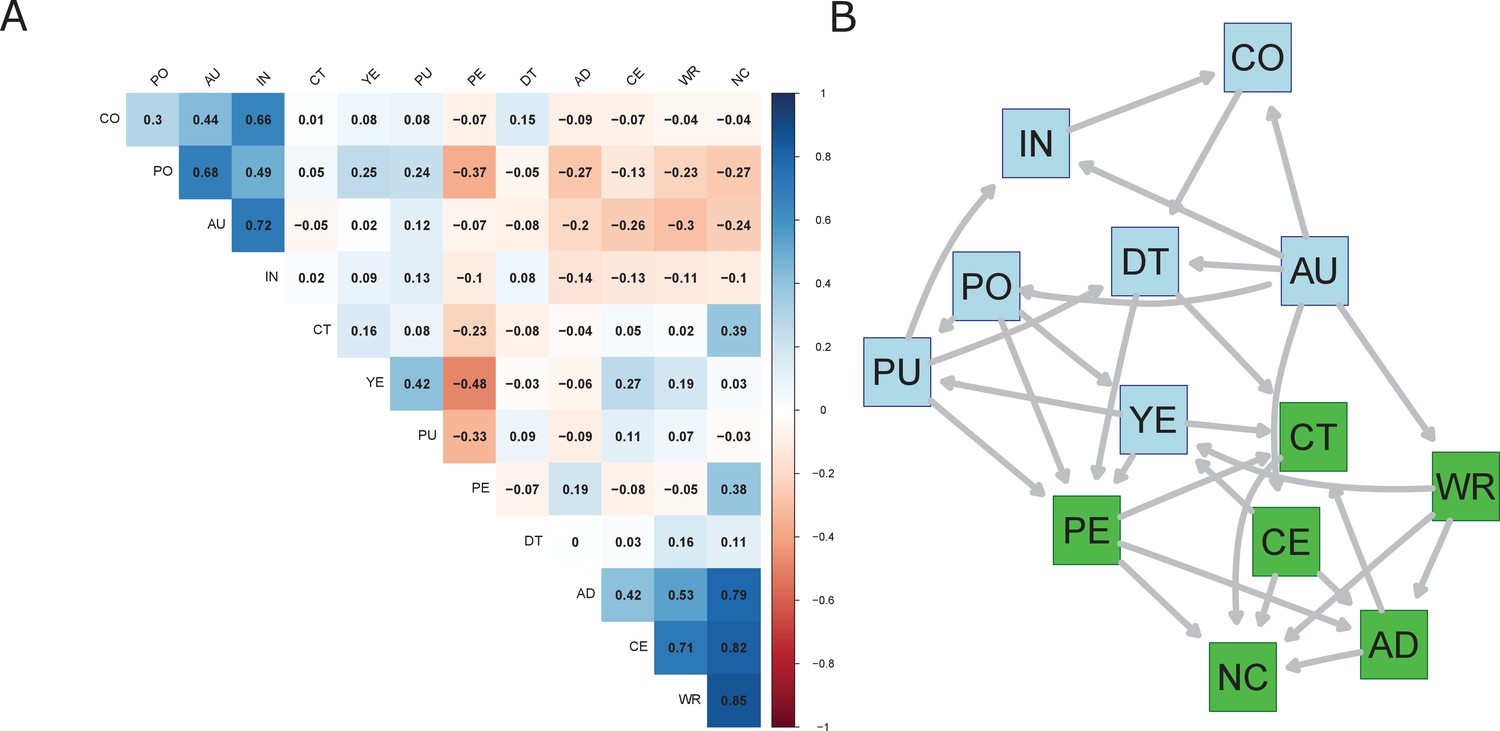
Mixed correlation matrix of contributorship and bibliometric variables (A) and the Bayesian network used for predicting contributorship (B).
Contribution variables are in green, bibliometric variables are in blue. Bibliometric variables: PO (author’s position); AU (number of authors); DT (document type); CO (number of countries); IN (number of institutions); YE (years since first publication); PU (average number of publications). Contribution variables: WR (wrote the paper); AD (analyzed the data); CE (conceived and designed the experiments); CT (contributed reagents/materials/analysis tools); PE (performed the experiments); NC (number of contributions).
Figure 2—figure supplement 1
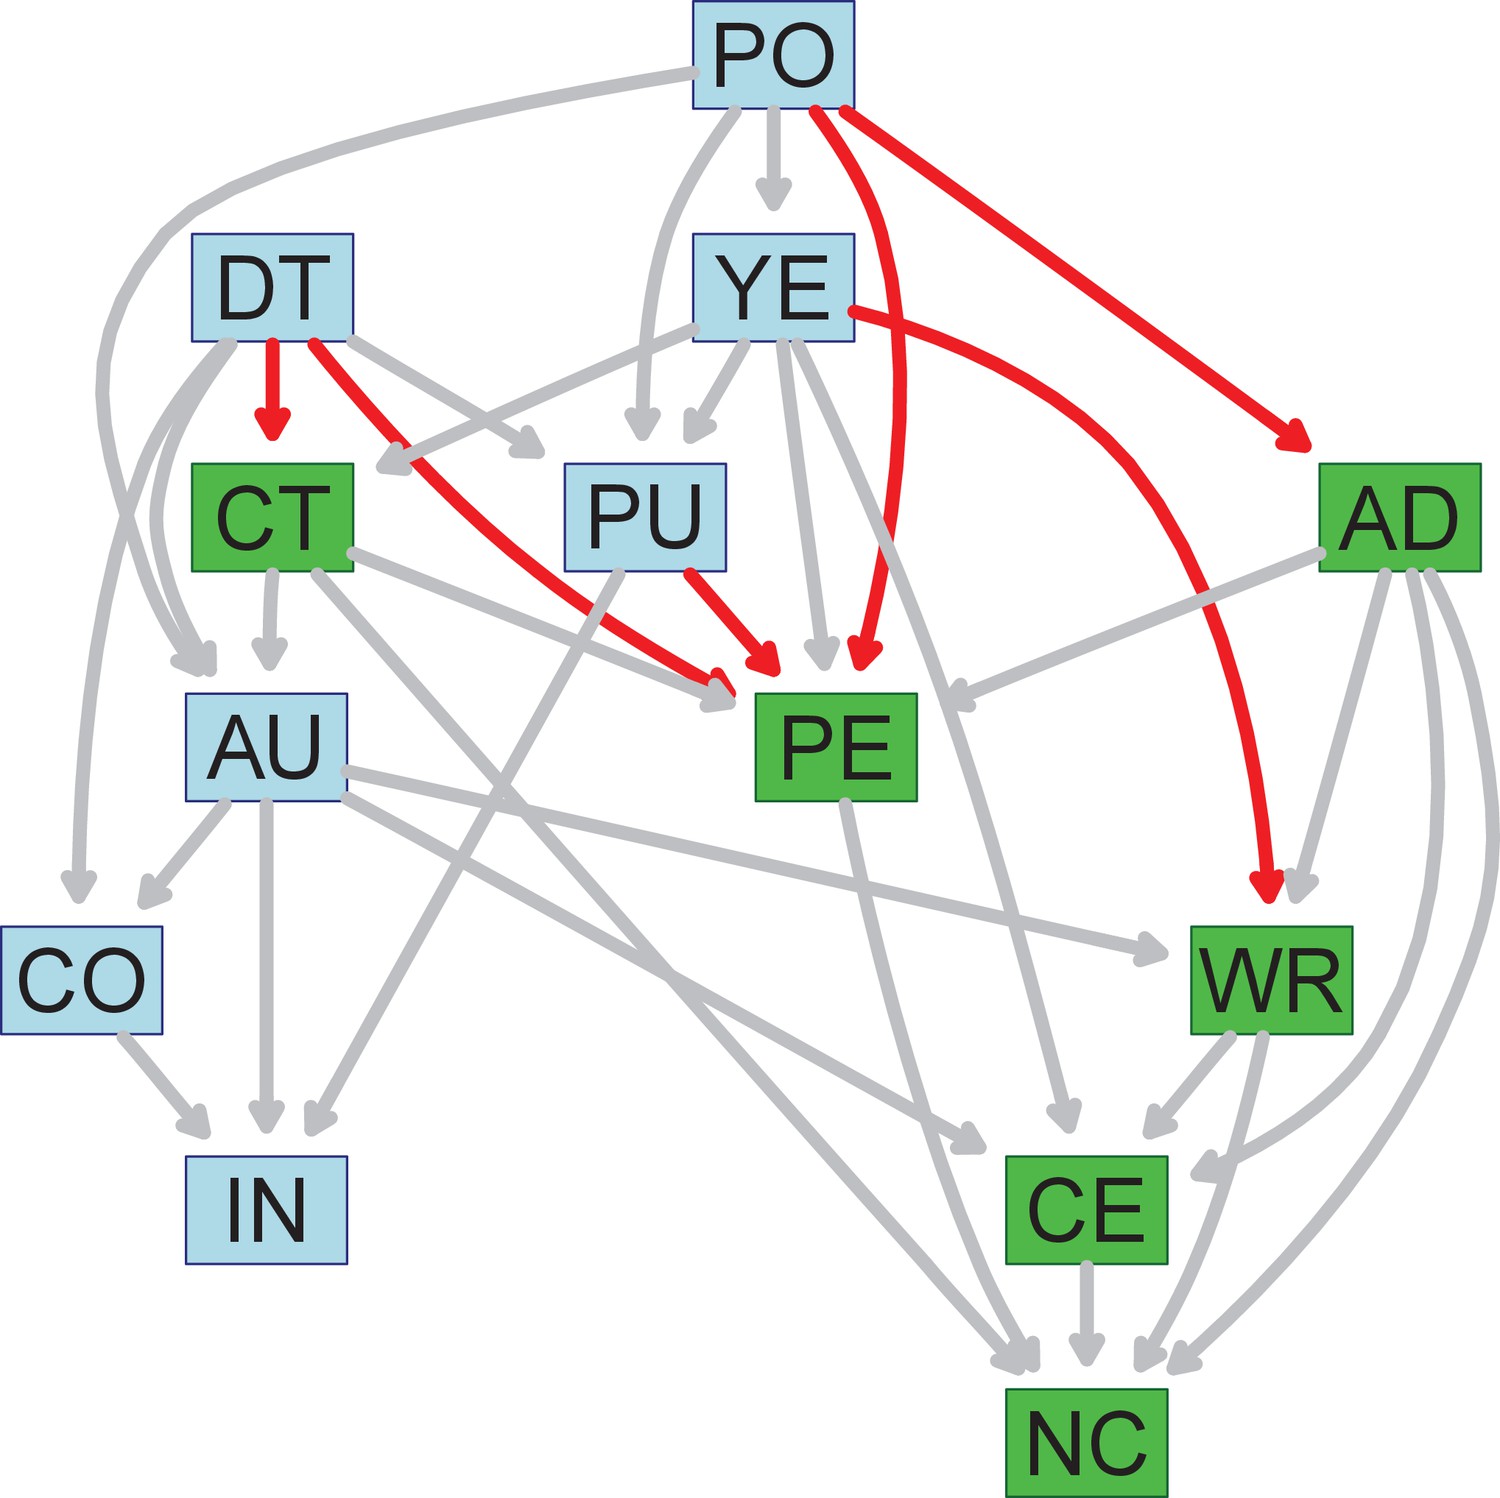
Bayesian network structure used for predicting contributorship highlighting whitelisted arc relations.
Contribution variables are in green, bibliometric variables are in blue. Red arcs correspond to white listed relations, that is, those arcs which, although identified by the algorithm, have modified directionality to allow predictions on contributorship based on bibliometric information.
Figure 3
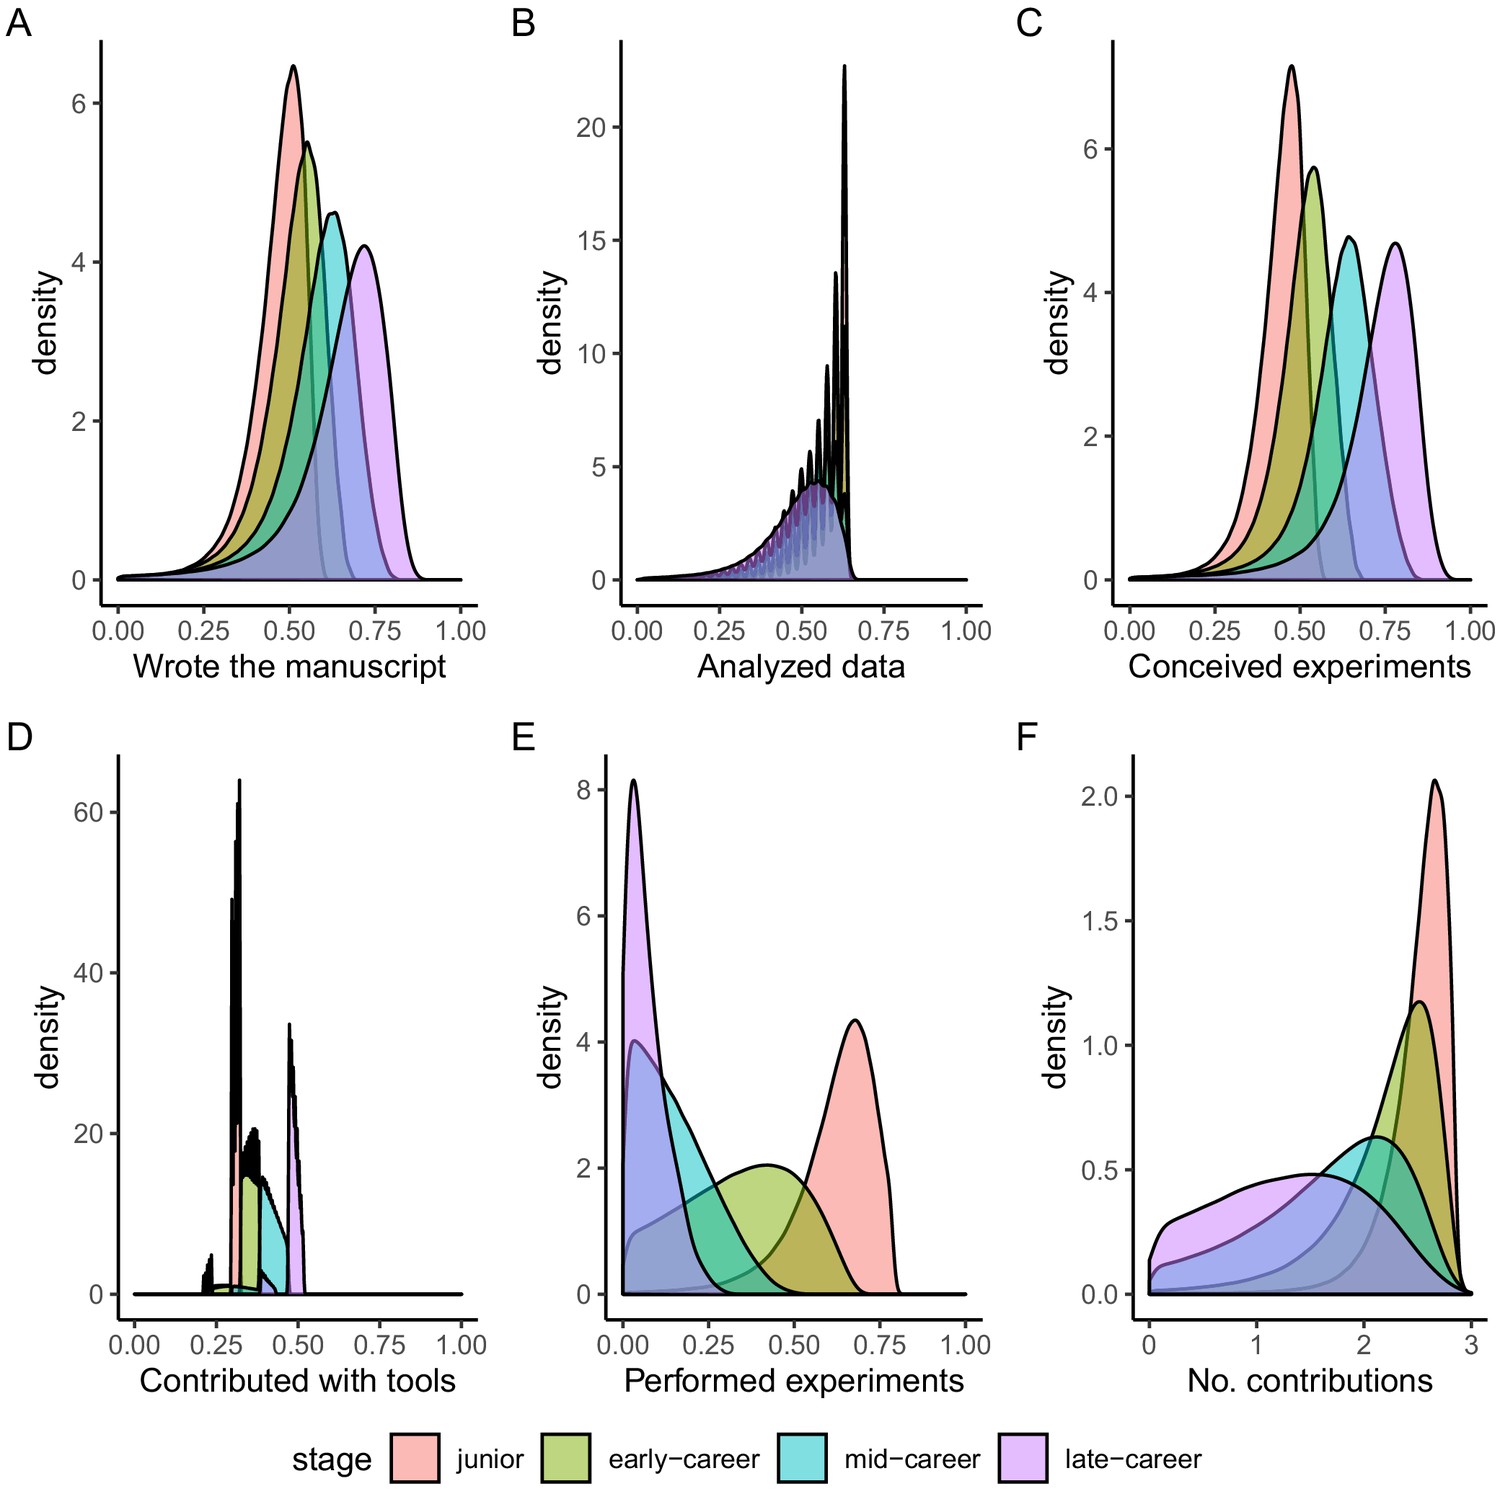
Probability density functions of contribution roles predicted using the Bayesian Network model.
Distributions are aggregated by career stage. (A) Probability distributions for the contributorship Wrote the manuscript. (B) Probability distributions for the contributorship Analyzed the data. (C) Probability distributions for the contributorship Conceived and designed the experiments. (D) Probability distributions for the contributorship Contributed with tools. (E) Probability distributions for the contributorship Performed the experiments. (F) Probability distributions for estimated Number of contributions of an author. Red color refers to scientists’ junior stage, green to early-career stage, blue to mid-career stage and purple to late-career stage.
Figure 4 with 1 supplement
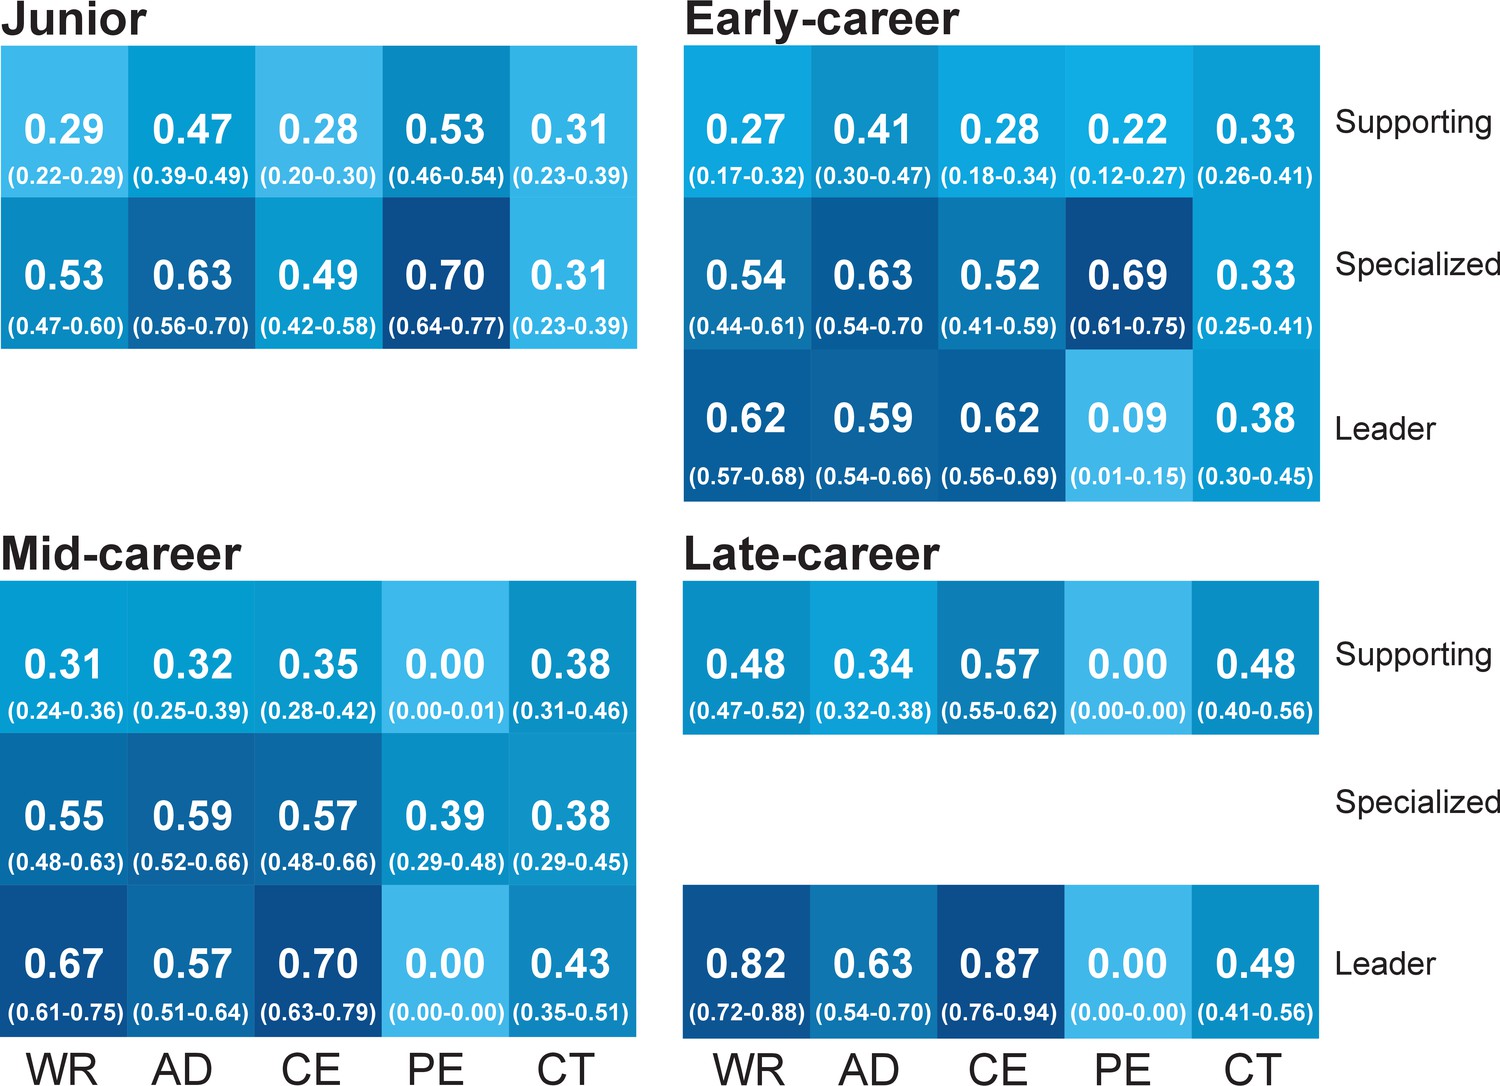
Coefficient values of contributorships by archetype, per career stage.
Two archetypes are identified in the junior stage (Specialized and Supporting), three have been identified for the early- and mid-career (Leader, Specialized and Supporting) and two have been identified for the late-career stage (Leader and Supporting). Uncertainty intervals of coefficients are shown in brackets. Color grades reflect the value of the parameters. Contributions statements: WR, wrote the manuscript; AD, analyzed data; CE, conceived and designed the experiments; PE, performed the experiments; CT, contributed with tools.
Figure 4—figure supplement 1

Screeplots of the residual sum squares (RSS) which allows determining the number of archetypes for each career stage.
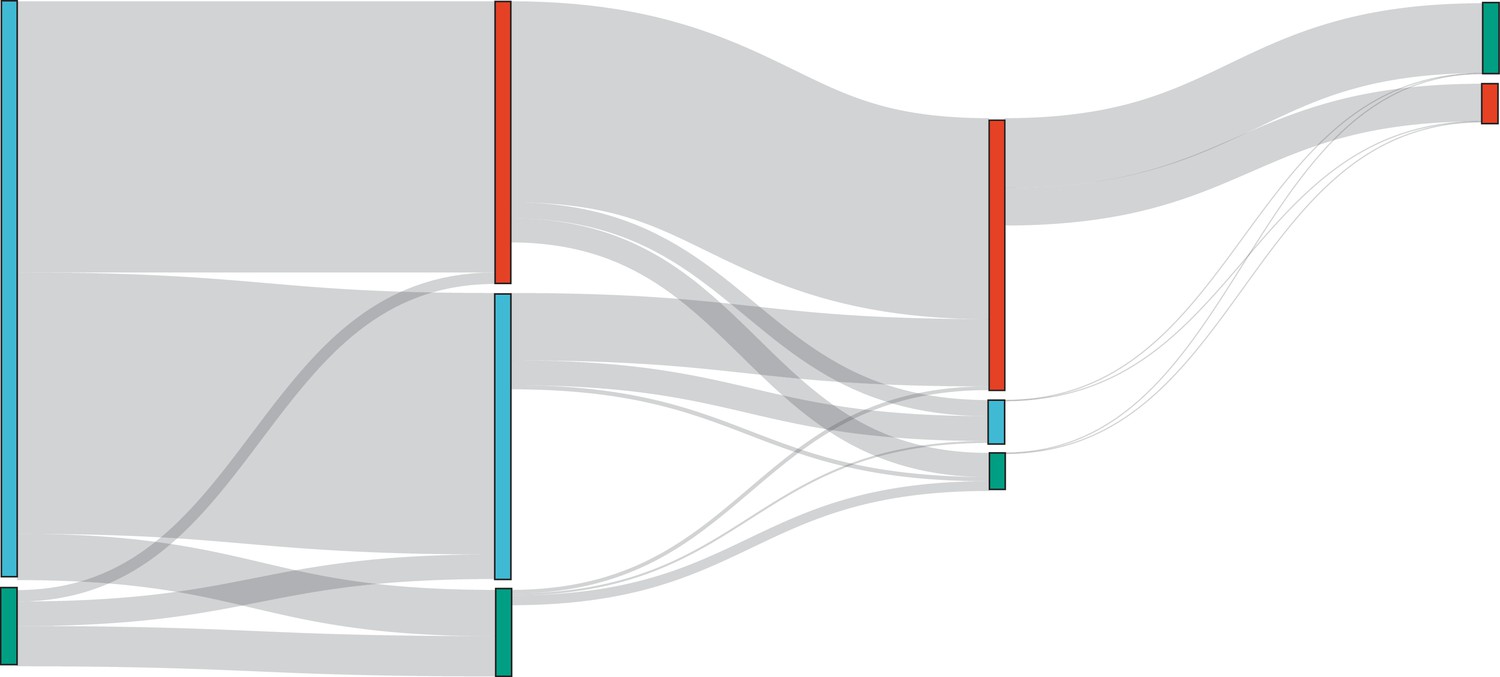
Figure 5 with 1 supplement

Career trajectories, productivity and citation impact boxplots by archetype.
(A) Sankey diagrams indicating the number of scientists by archetype at each career stage and transitions from one stage to the next, including changes on researchers’ archetype. (B) Productivity boxplots, by archetype and career stage. This is calculated based on the cumulative number of publications scientists had authored at each given stage. (C) Share of highly cited publications boxplots by archetype and career stage. Highly cited publications are defined as those which are among the 10% most highly cited publications in their field and year of publication. Red refers to the Leader archetype, Blue refers to the Specialized archetype and Green refers to the Supporting archetype.
Figure 5—figure supplement 1
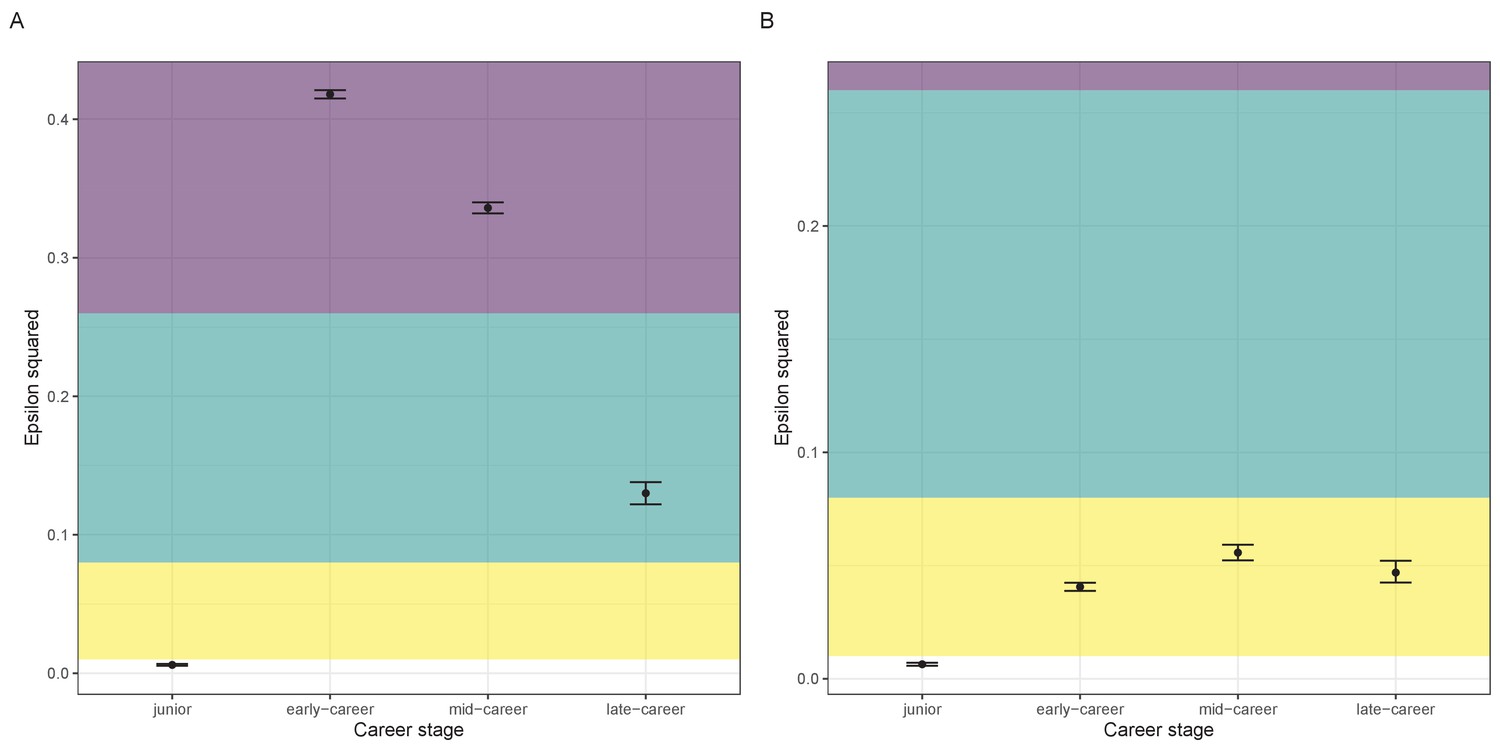
Effect size for the differences between archetypes within each career stage for A number of publications and B share of highly cited papers.
Colored areas provide descriptive interpretation. Yellow indicates a small effect size, green indicates medium and purple indicates a large effect size. size.
Figure 6 with 3 supplements

Estimated proportion of scientists, along with 95% confidence intervals, by gender and career stage for each archetype.
Top-left panel refers to the junior stage in which only two archetypes are present: specialized and supporting. Top-right refers to the early-career stage. Bottom-left refers to the mid-career stage. Bottom-right refers to the late-career stage, again here only two archetypes are observed: leader and supporting. Blue refers to women scientists and yellow to men scientists.
Figure 6—figure supplement 1
Sankey diagram indicating the number of male scientists by archetype at each career stage and transitions from one stage to the next, including changes on researchers’ archetypes.
Red refers to the Leader archetype, Blue refers to the Specialized archetype and Green refers to the Supporting archetype. .
Figure 6—figure supplement 2
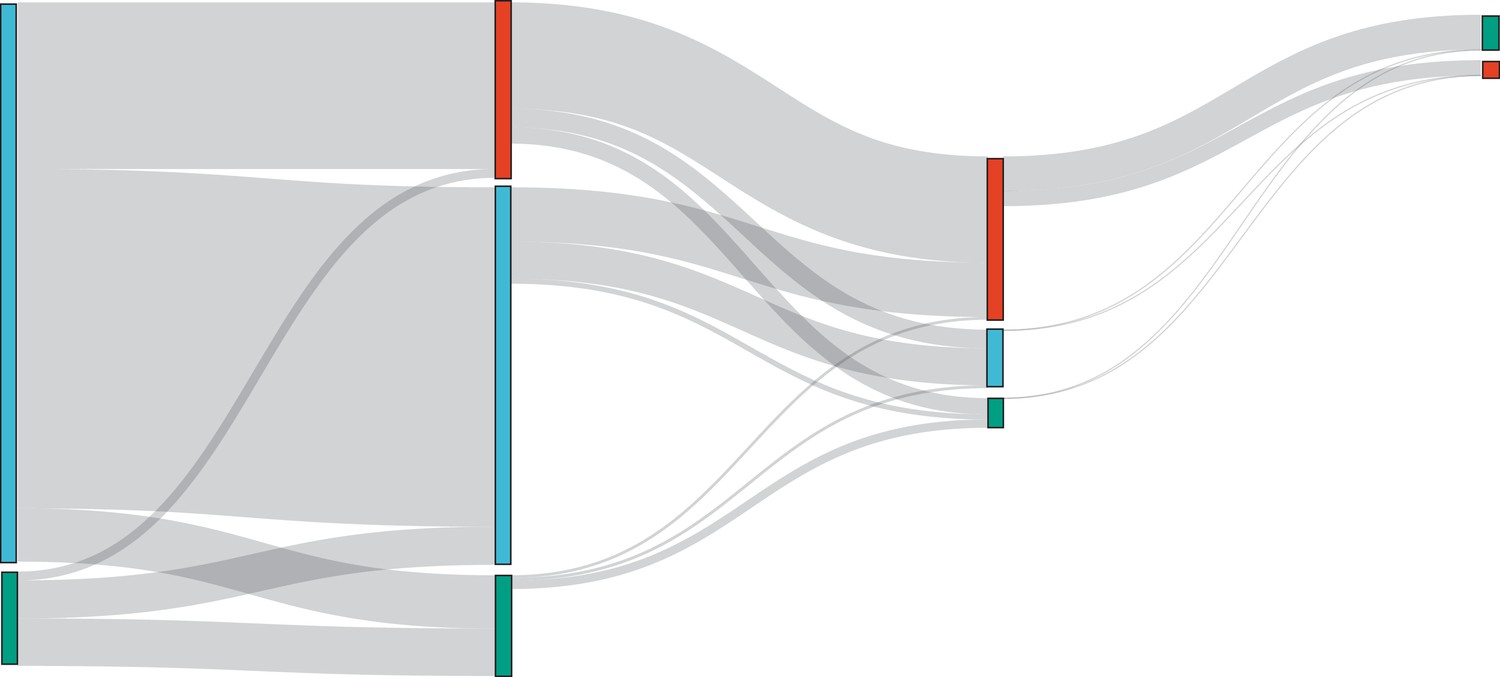
Sankey diagram indicating the number of female scientists by archetype at each career stage and transitions from one stage to the next, including changes on researchers’ archetypes.
Red refers to the Leader archetype, Blue refers to the Specialized archetype and Green refers to the Supporting archetype.
Figure 6—figure supplement 3

Effect sizes for proportion tests to identify differences by gender and archetype at each career stage.
Colored areas provide descriptive interpretation. Yellow indicates small effect size, green indicates medium and purple indicates large effect. Values for all archetypes in junior and late-career stage are overlapping.
Figure 7 with 1 supplement

Percentage of scientists by author position, along with 95% confidence intervals, for each archetype and career stage.
Top-left panel refers to the junior stage in which only two archetypes are present: specialized and supporting. Top-right refers to the early-career stage. Bottom-left refers to the mid-career stage. Bottom-right refers to the late-career stage, again here only two archetypes are observed: leader and supporting. Blue refers to share of scientists publishing as first authors, green refers to those publishing as middle authors, and pink refers to those publishing as last authors.
Figure 7—figure supplement 1

Effect sizes for differences in proportions by author position and archetype at each stage.
Colored areas provide descriptive interpretation. Yellow indicates small effect size, green indicates medium and purple indicates large effect. Values for specialized and supporting and the junior stage and leader and supporting at the late-career are overlapped.
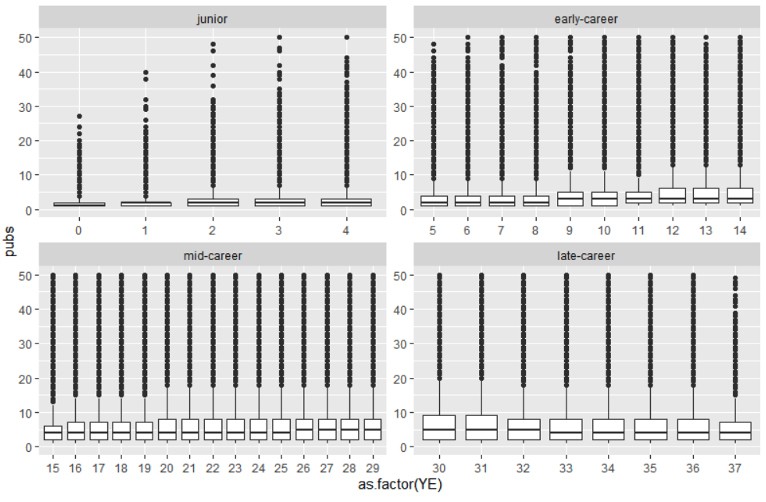
Author response image 1
Tables
Table 1
Definition of variables included in the dataset.
| Acronym | Definition | Source |
|---|---|---|
| Bibliometric variables | ||
| PO | Author’s position in the paper | WoS |
| AU | Total number of authors in the paper | WoS |
| DT | Document type. Letters are excluded | WoS |
| CO | Number of countries to which authors of the paper are affiliated | WoS |
| IN | Number of institutions to which authors of the paper are affiliated | WoS |
| YE | Number of years since first publication at the time the paper was published | WoS |
| PU | Average number of publications (full counting) per year | WoS |
| of the author at the time the paper was published | ||
| Contribution variables | ||
| WR | Wrote the paper | PLoS |
| AD | Analyzed the data | PLoS |
| PE | Performed the experiments | PLoS |
| CE | Conceived and designed the experiments | PLoS |
| CT | Contributed reagents/materials/analysis tools | PLoS |
| NC | Number of contributions | PLoS |
Table 2
Distribution of papers by journal of the seed dataset on contributions.
| Journal | No. of papers |
|---|---|
| PLOS ONE | 62,174 |
| PLOS GENETICS | 2408 |
| PLOS PATHOGENS | 1882 |
| PLOS COMPUTATIONAL BIOLOGY | 1684 |
| PLOS NEGLECTED TROPICAL DISEASES | 1432 |
| PLOS BIOLOGY | 697 |
| PLOS MEDICINE | 417 |
Table 3
Classification error rates from cross-validation of Bayesian Network model for the contribution variables.
For contributorships, the percentage of mis-classified predictions is shown, while for NC, the mean squared error between the predicted and the observed values is reported.
| Variables | Min. | Median | Mean | Max. |
|---|---|---|---|---|
| WR | 0.062 | 0.064 | 0.064 | 0.065 |
| AD | 0.064 | 0.067 | 0.067 | 0.069 |
| PE | 0.072 | 0.075 | 0.075 | 0.077 |
| CE | 0.062 | 0.064 | 0.064 | 0.066 |
| CT | 0.077 | 0.078 | 0.078 | 0.081 |
| NC | 0.120 | 0.125 | 0.125 | 0.127 |
Author response table 1
| WR | AD | CE | CT | PE | ||
|---|---|---|---|---|---|---|
| Precision | 0.98 | 0.88 | 0.89 | 0.89 | 0.87 | |
| Recall | 0.89 | 0.99 | 0.99 | 0.99 | 0.99 |
Author response table 2
| WR | 517008 | 0.48 | 0.50 |
| AD | 517008 | 0.52 | 0.50 |
| CE | 517008 | 0.48 | 0.50 |
| CT | 517008 | 0.35 | 0.48 |
| PE | 517008 | 0.51 | 0.50 |
| NC | 517008 | 2.46 | 1.32 |
Author response table 3
| Probability | All | Women | Men |
|---|---|---|---|
| P(early Leader) | 0.371 | 0.268 | 0.4314 |
| P(early Leader| Junior Specialized) | 0.4214 | 0.3379 | 0.2991 |
| P(mid Leader) | 0.356 | 0.249 | 0.415 |
| P(mid Leader|early Leader) | 0.685 | 0.606 | 0.71 |
| P(mid Leader|early Specialized) | 0.197 | 0.144 | 0.335 |
| P(late Leader) | 0.088 | 0.054 | 0.107 |
| P(late Leader|mid Leader) | 0.246 | 0.218 | 0.256 |
Author response table 4
| Junior stage | min | 1st quartile | median | mean | 3rd quartile | max |
|---|---|---|---|---|---|---|
| Spe. vs. supp. | -1,00 | -0,87 | -0,61 | -0,50 | -0,26 | 1,00 |
| Early-career | ||||||
| Lead. vs.spe. | -1,00 | -0,25 | 0,08 | 0,08 | 0,44 | 1,00 |
| Spe. vs. supp. | -1,00 | -0,08 | 0,25 | 0,19 | 0,48 | 1,00 |
| Lead. vs. supp. | -1,00 | -0,13 | 0,15 | 0,10 | 0,39 | 1,00 |
| Mid-career | ||||||
| Lead. vs.spe. | -1,00 | 0,18 | 0,51 | 0,41 | 0,76 | 1,00 |
| Lead. vs. supp. | -1,00 | 0,16 | 0,42 | 0,39 | 0,68 | 1,00 |
| Spe. vs. supp. | -1,00 | -0,14 | 0,06 | 0,02 | 0,23 | 1,00 |
| Late-career | ||||||
| Lead. vs. supp. | -1,00 | -0,41 | -0,17 | -0,12 | 0,11 | 1,00 |
Additional files
Download links
A two-part list of links to download the article, or parts of the article, in various formats.
Downloads (link to download the article as PDF)
Open citations (links to open the citations from this article in various online reference manager services)
Cite this article (links to download the citations from this article in formats compatible with various reference manager tools)
Meta-Research: Task specialization across research careers
eLife 9:e60586.
https://doi.org/10.7554/eLife.60586


