Climate-driven deoxygenation elevates fishing vulnerability for the ocean's widest ranging shark
- CIBIO/InBIO, Universidade do Porto, Campus Agrário de Vairão, Portugal
- MARE, Laboratório Marítimo da Guia, Faculdade de Ciências da Universidade de Lisboa, Av. Nossa Senhora do Cabo, Portugal
- Marine Biological Association of the United Kingdom, The Laboratory, Citadel Hill, United Kingdom
- Instituto de Investigaciones Marinas, Consejo Superior de Investigaciones Científicas (IIM-CSIC), Spain
- IMAR – Institute of Marine Research, Departamento de Oceanografia e Pescas, Universidade dos Açores, Portugal
- MARE – Marine and Environmental Sciences Centre, Faculdade de Ciências da Universidade de Lisboa, Portugal
- Okeanos - Departamento de Oceanografia e Pescas, Universidade dos Açores, Portugal
- Centre for Biological Sciences, Highfield Campus, University of Southampton, United Kingdom
- Ocean and Earth Science, National Oceanography Centre Southampton, Waterfront Campus, University of Southampton, United Kingdom
Figures
Figure 1 with 1 supplement
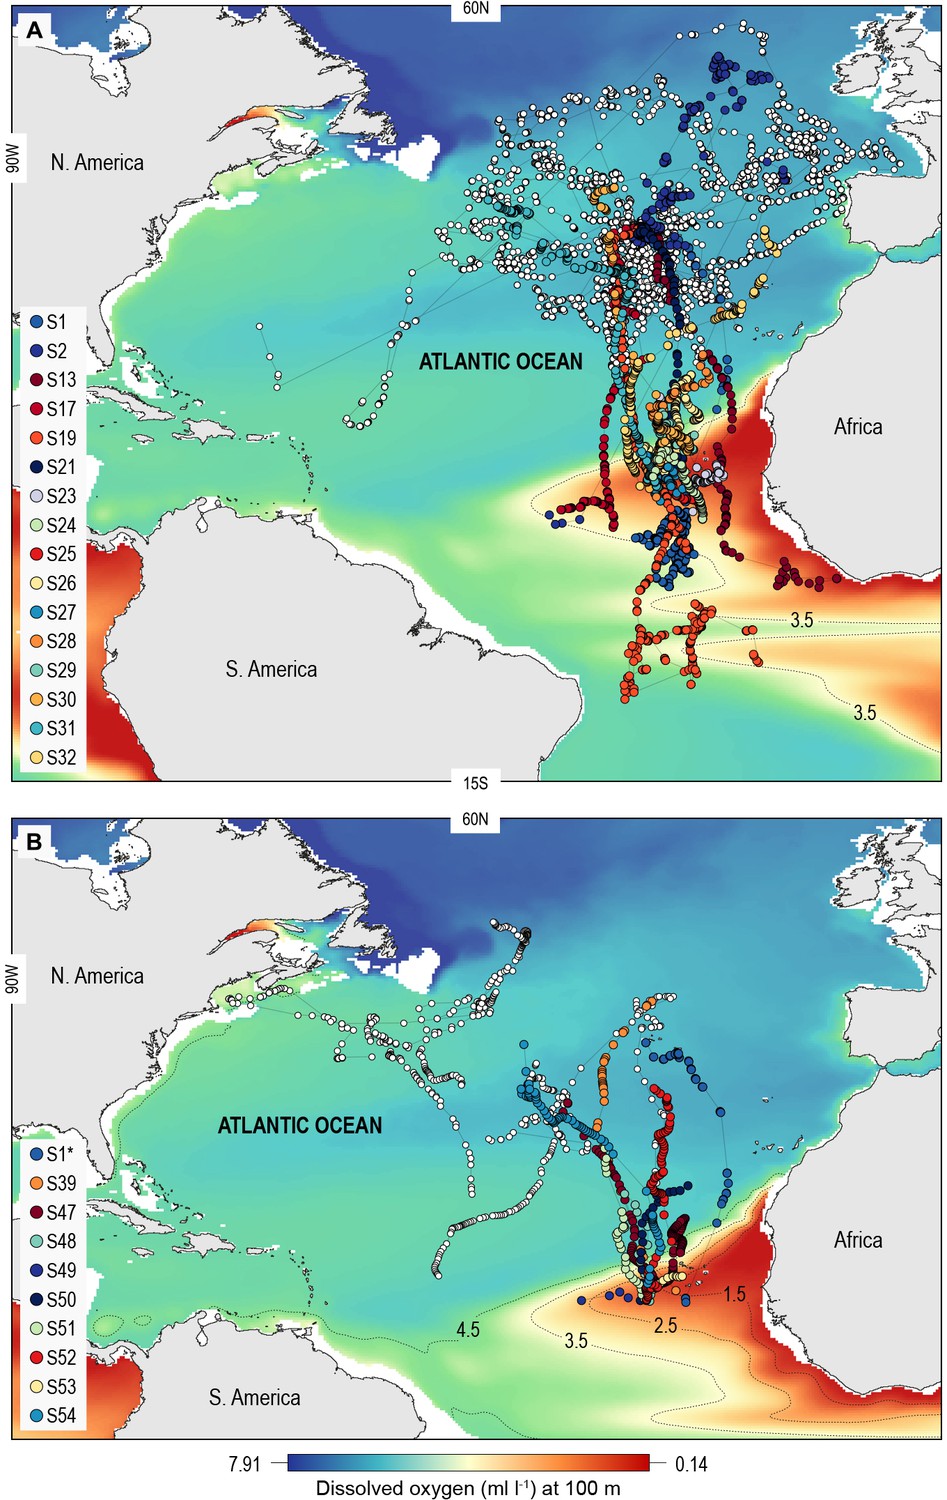
North Atlantic-wide movements of blue sharks in relation to the eastern tropical Atlantic (ETA) oxygen minimum zone (OMZ).
Sharks were tracked with (A) ARGOS satellite transmitters (deployed in the Azores and above the ETA OMZ) and (B) pop-off satellite-linked archival transmitters (PSAT) (deployed in west and central North Atlantic, and above the ETA OMZ) overlaid on modelled dissolved oxygen concentrations (at 100 m). Coloured trajectories indicate individual sharks that moved into waters above the OMZ, which is illustrated using different oxyclines (1.5–4.5 ml O2 l−1 at 100 m depth). Note that shark S1* was double-tagged and appears in both panels.
Figure 1—figure supplement 1
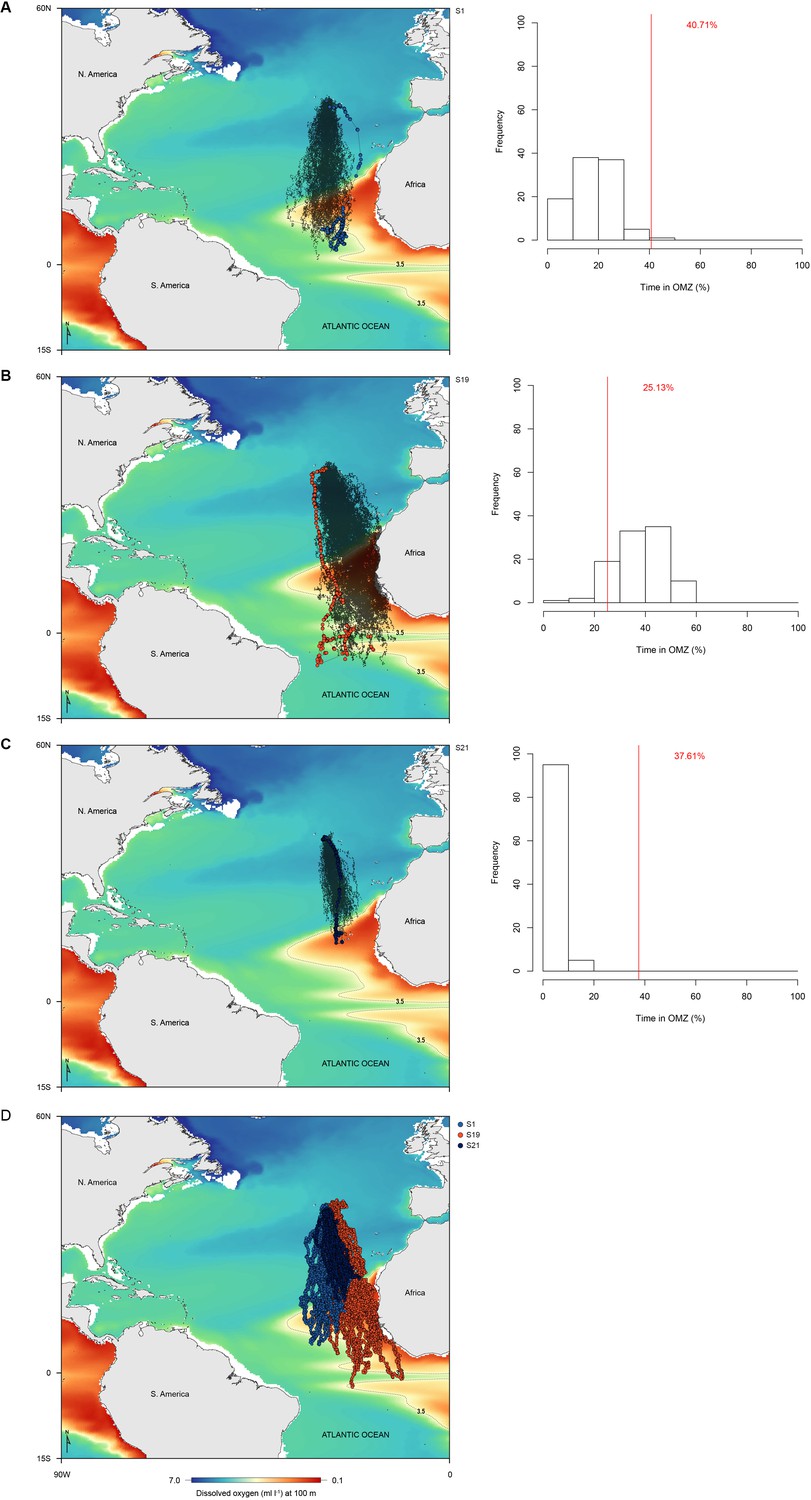
Assessing blue shark habitat preference for surface waters above the oxygen minimum zone (OMZ).
Correlated random walk models (black circles) for three representative sharks (A – S1, B – S34, and C – S36; coloured track) are overlaid on dissolved oxygen concentrations at 100 m (left panels). Histograms (right panels) indicate the proportion of time model sharks spent above the OMZ area (white bars) compared to that of each respective tracked shark (red line). Length and bearing angles were sampled independently (A–C), but we also tested sampling length and angles together (D) for the same tracks in A–C. Differences between produced random walk models were low. Note that randomised tracks do not spread out across the entire ocean basin as they would if random turn angles had been used.
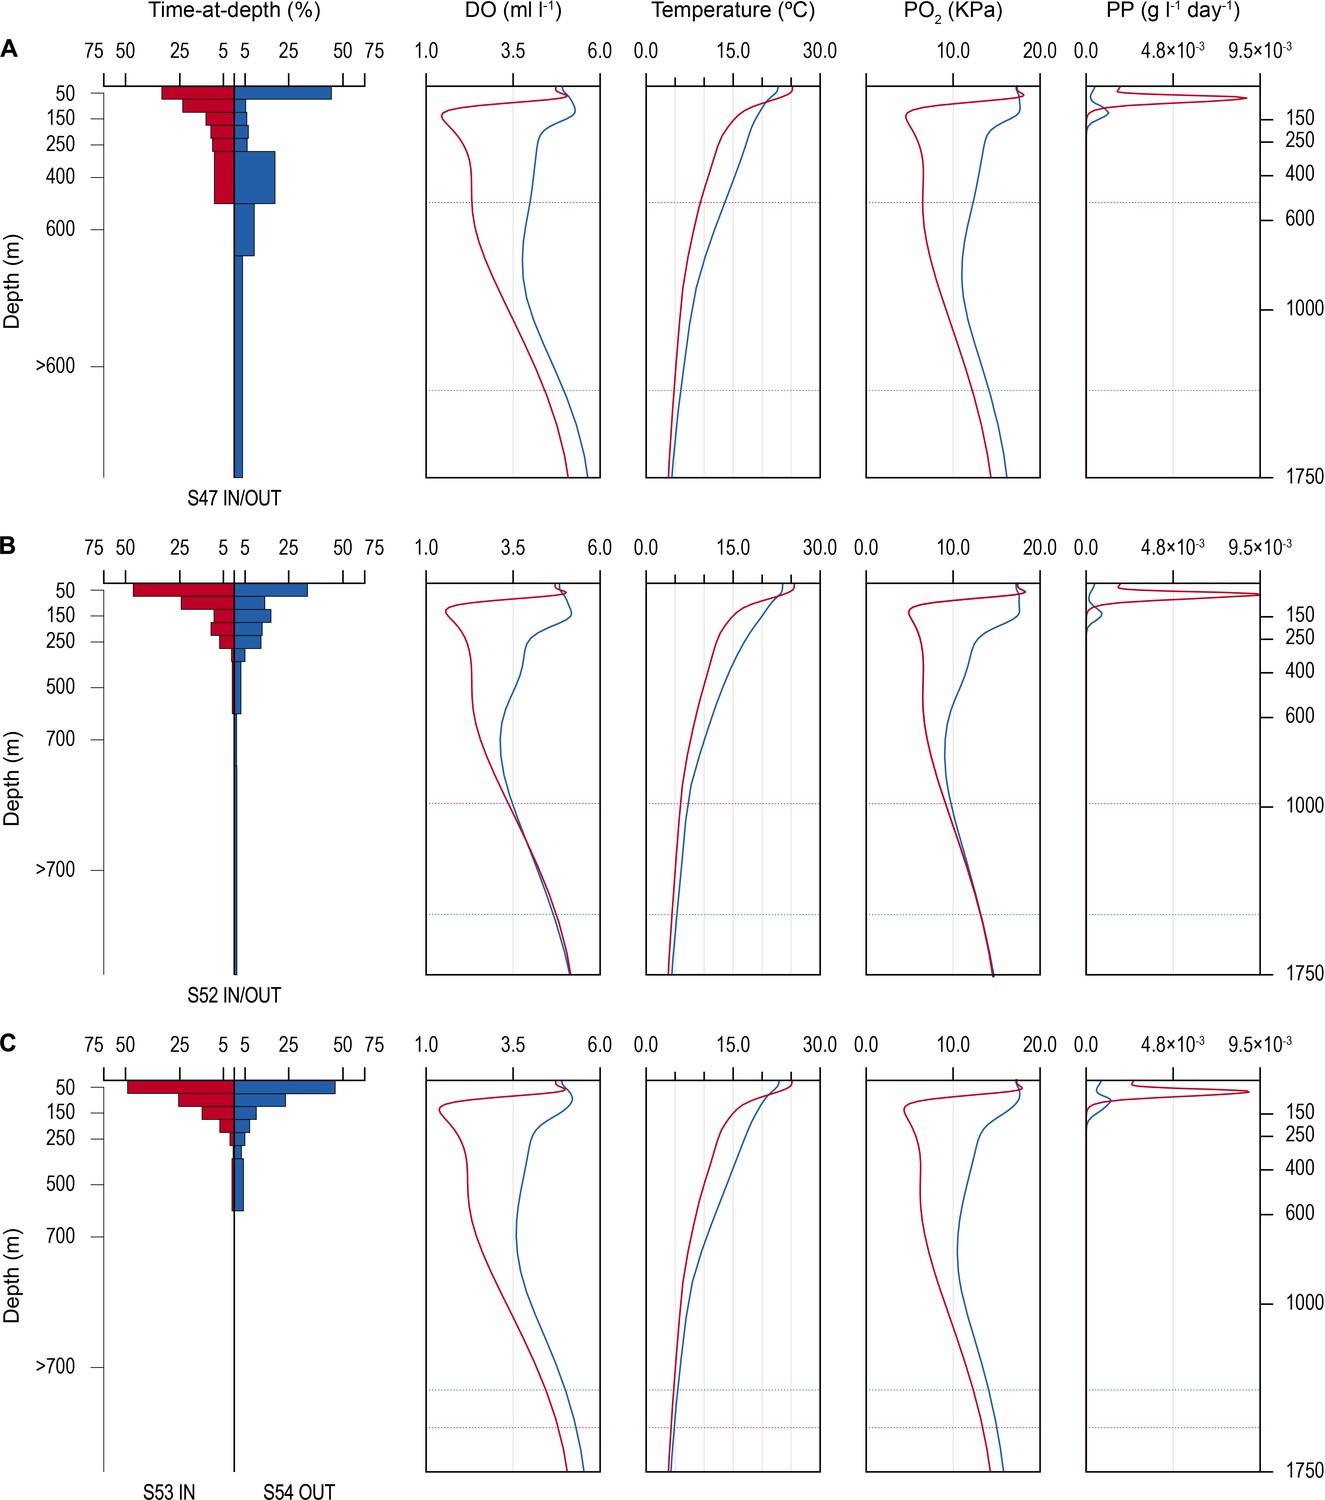
Figure 2 with 1 supplement
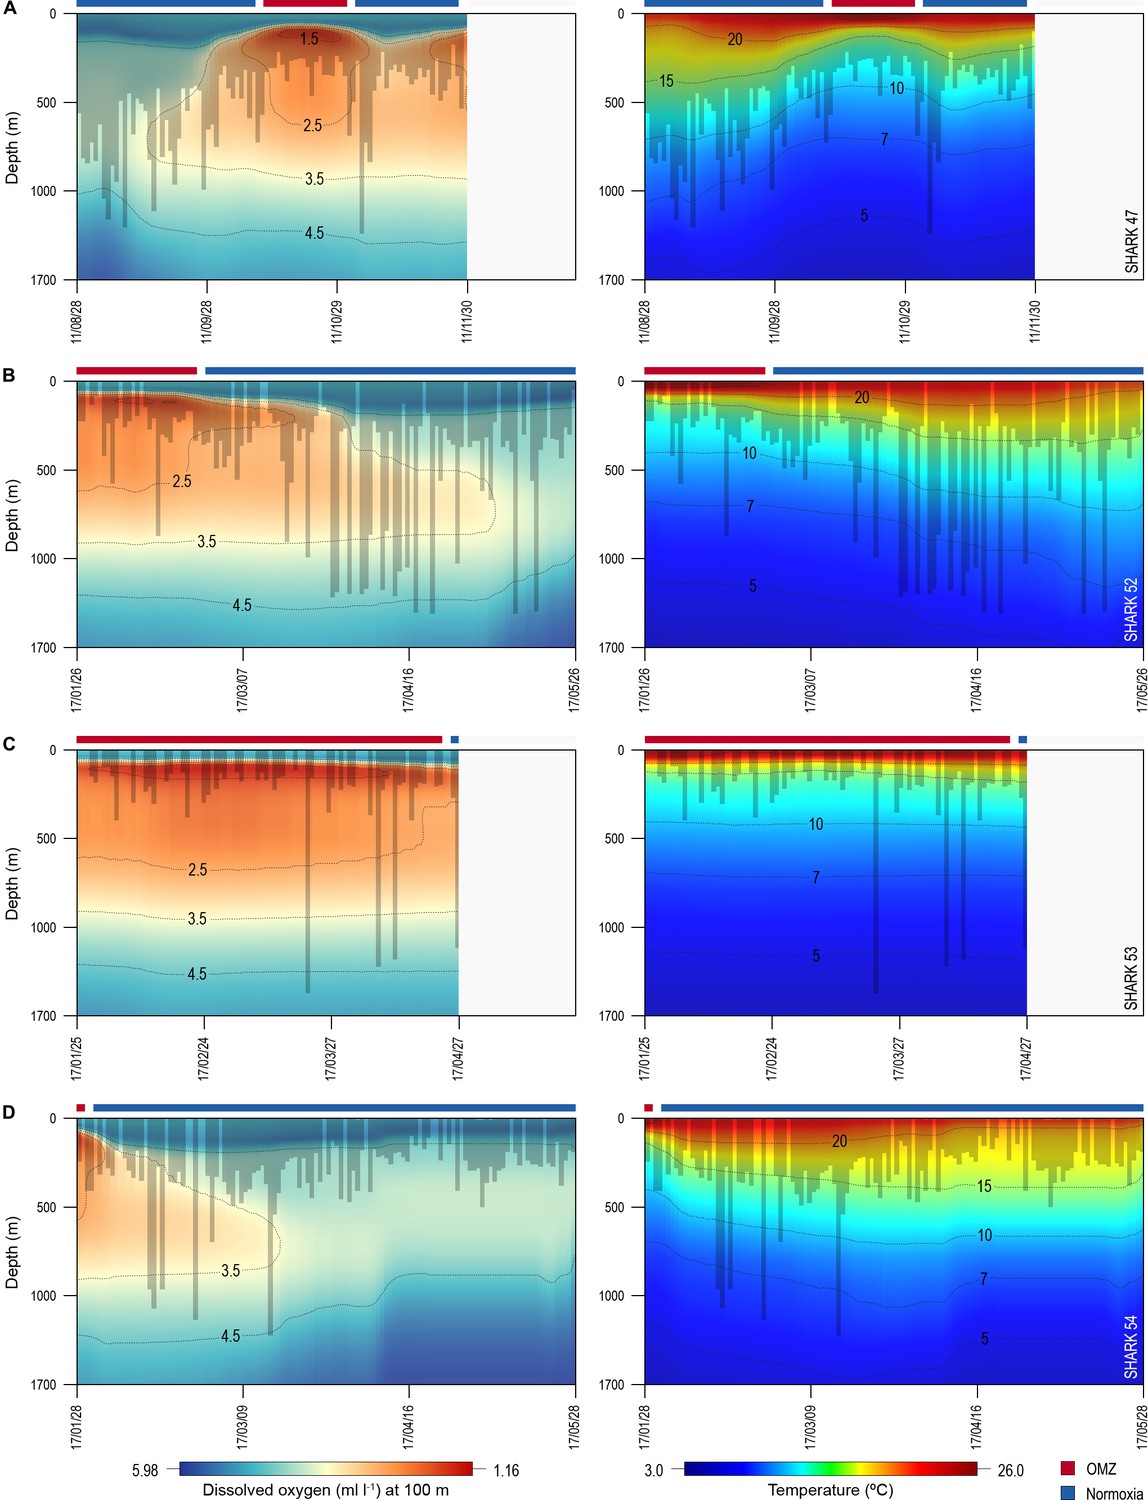
Vertical movements of blue sharks in relation to dissolved oxygen (DO) concentration and water temperature.
Daily minimum-maximum depth plots (shaded area) for sharks 47 and 52–54, overlaid on DO concentration data (left panels) and water temperature (right panels) from the surface to 1700 m. Red and blue bars at the top of each panel denote the period spent inside (red) and outside (blue) the area overlying the oxygen minimum zone (OMZ). Numbers in the right panels denote oxyclines (ml O2 l−1) and in the left panels isotherms (°C).
Figure 2—figure supplement 1
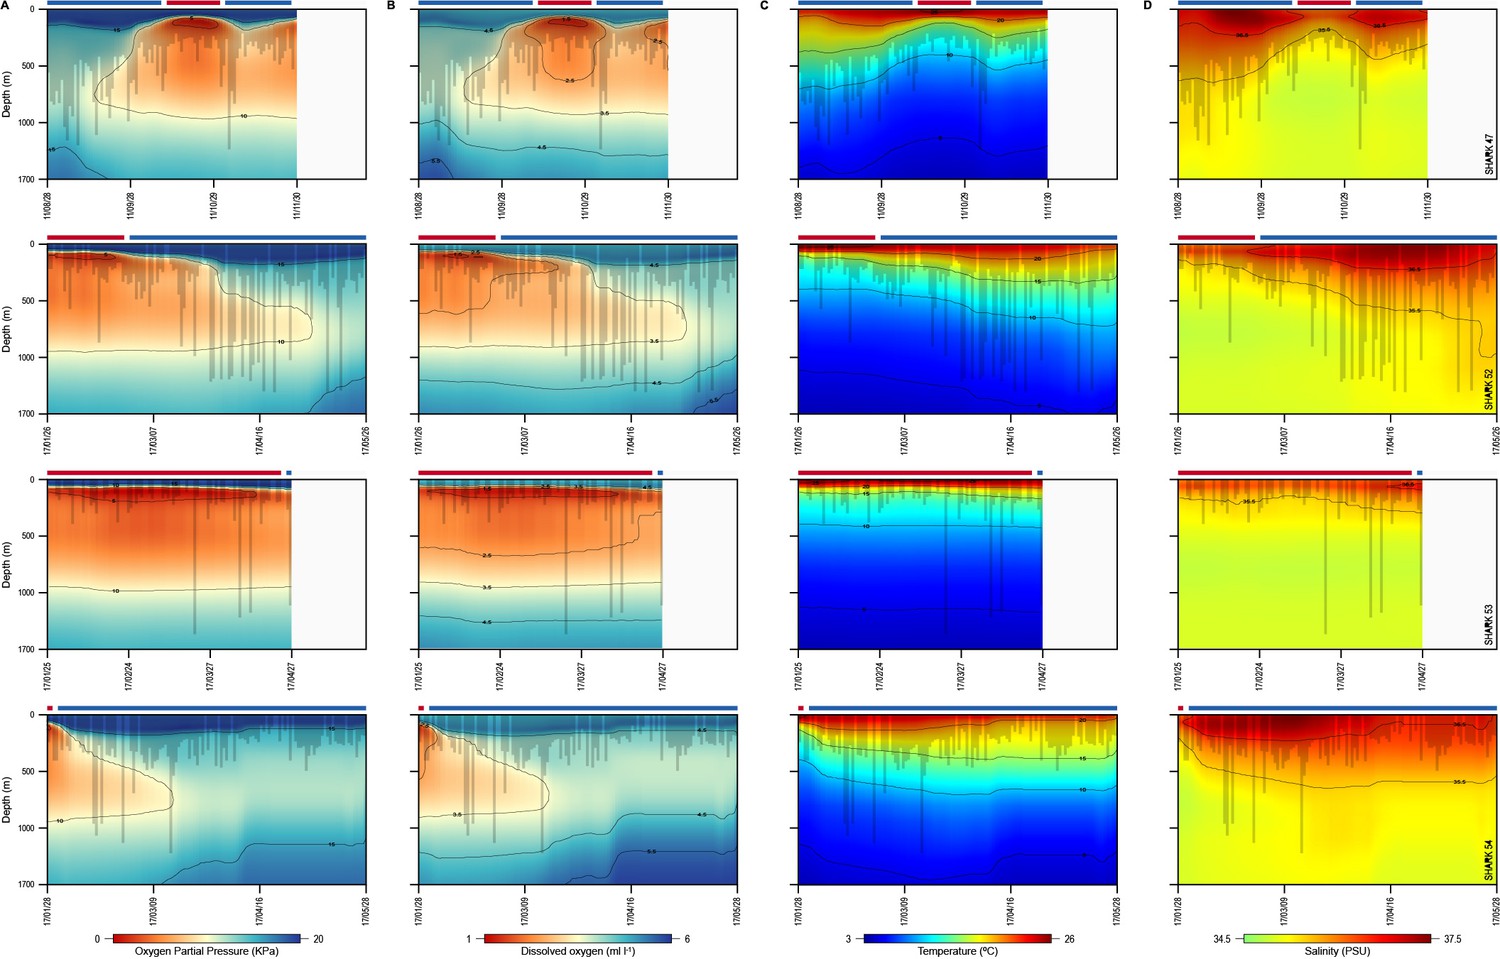
Vertical movements of blue sharks in relation to environmental variables.
Daily minimum–maximum depth plots (shaded area) for sharks 47 and 52–54, overlaid on oxygen partial pressure data, dissolved oxygen (DO), water temperature, and salinity from the surface to 1700 m. Oxygen partial pressure was calculated from DO, temperature, and salinity with depth (see Materials and methods). Red and blue bars at the top of each panel denote the period spent inside and outside the area overlying the oxygen minimum zone (OMZ), respectively.
Figure 3
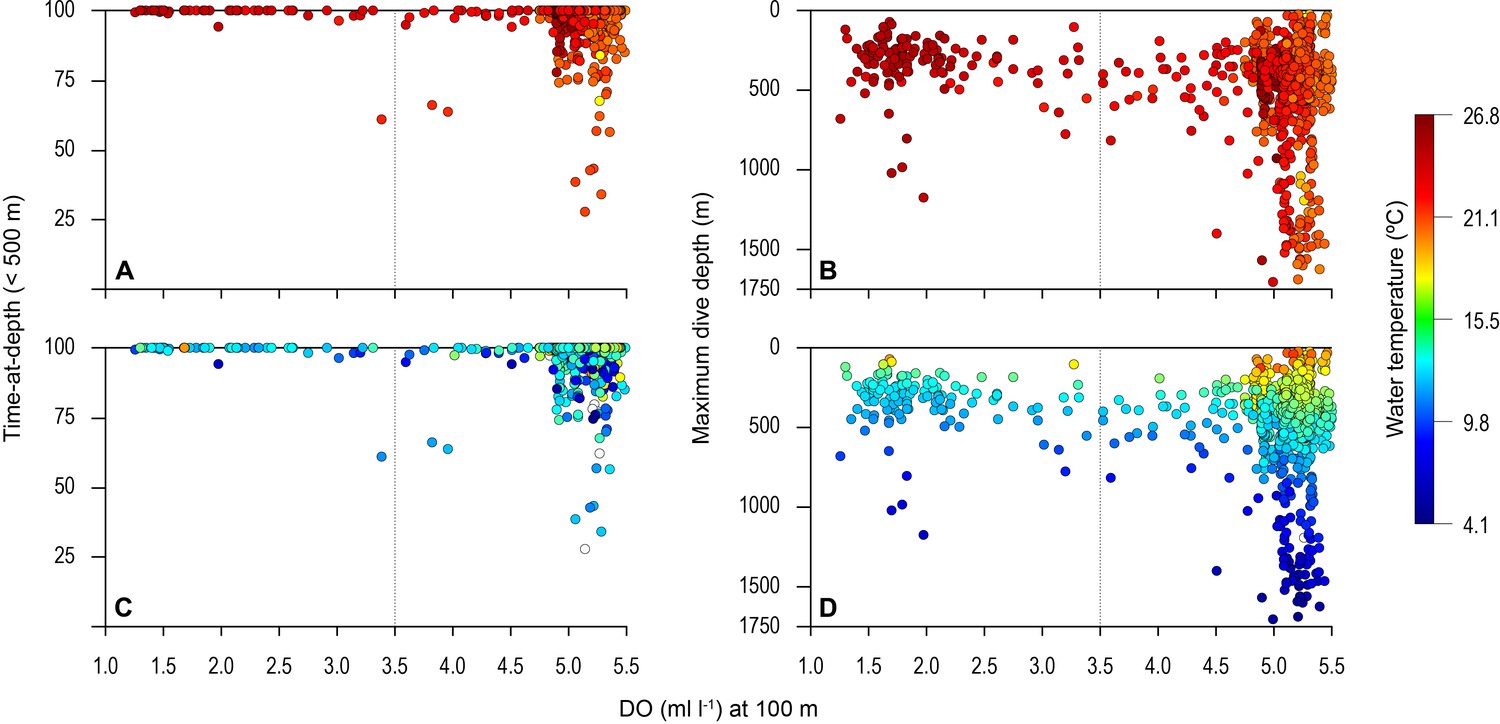
Vertical distribution of blue shark movements above oxygen minimum zone (OMZ) and adjacent waters.
The percentage of tag-recorded time spent by blue sharks per day in the upper 500 m of the water (A and C) and maximum daily dive (MDD) depths (B and D) in relation to the dissolved oxygen (DO) concentration at 100 m depth. Time-at-depth (TAD) and MDD depth are given in relation to sea surface temperature (SST) (A and B) and temperature at depth (C and D). Each marker plotted summarises percentage TAD for 1 day. The dashed vertical line in each panel denotes the lower DO concentration indicated by the generalised additive mixed model (GAMM) below which MDD depth begins to decrease (3.5 ml O2 l−1).
Figure 4
Time-at-depth of blue sharks in oxygen minimum zone (OMZ) and adjacent areas in relation to environmental variables.
Vertical depth use ratio (left panel) between waters above the OMZ (red) and adjacent waters outside the area of OMZ (blue) for sharks 47 and 52 (A and B); depth use ratio comparing depth distributions of shark 53 above the OMZ with shark 54 outside the area above the OMZ (C). In A–C, the panels on the right show the average dissolved oxygen (DO) concentration, water temperature, pO2, and net primary production (NPP) concentration between the surface and 1750 m, and horizontal dotted lines denote the MDD depth of each shark recorded inside (red) and outside (blue) the OMZ area.
Figure 5 with 1 supplement
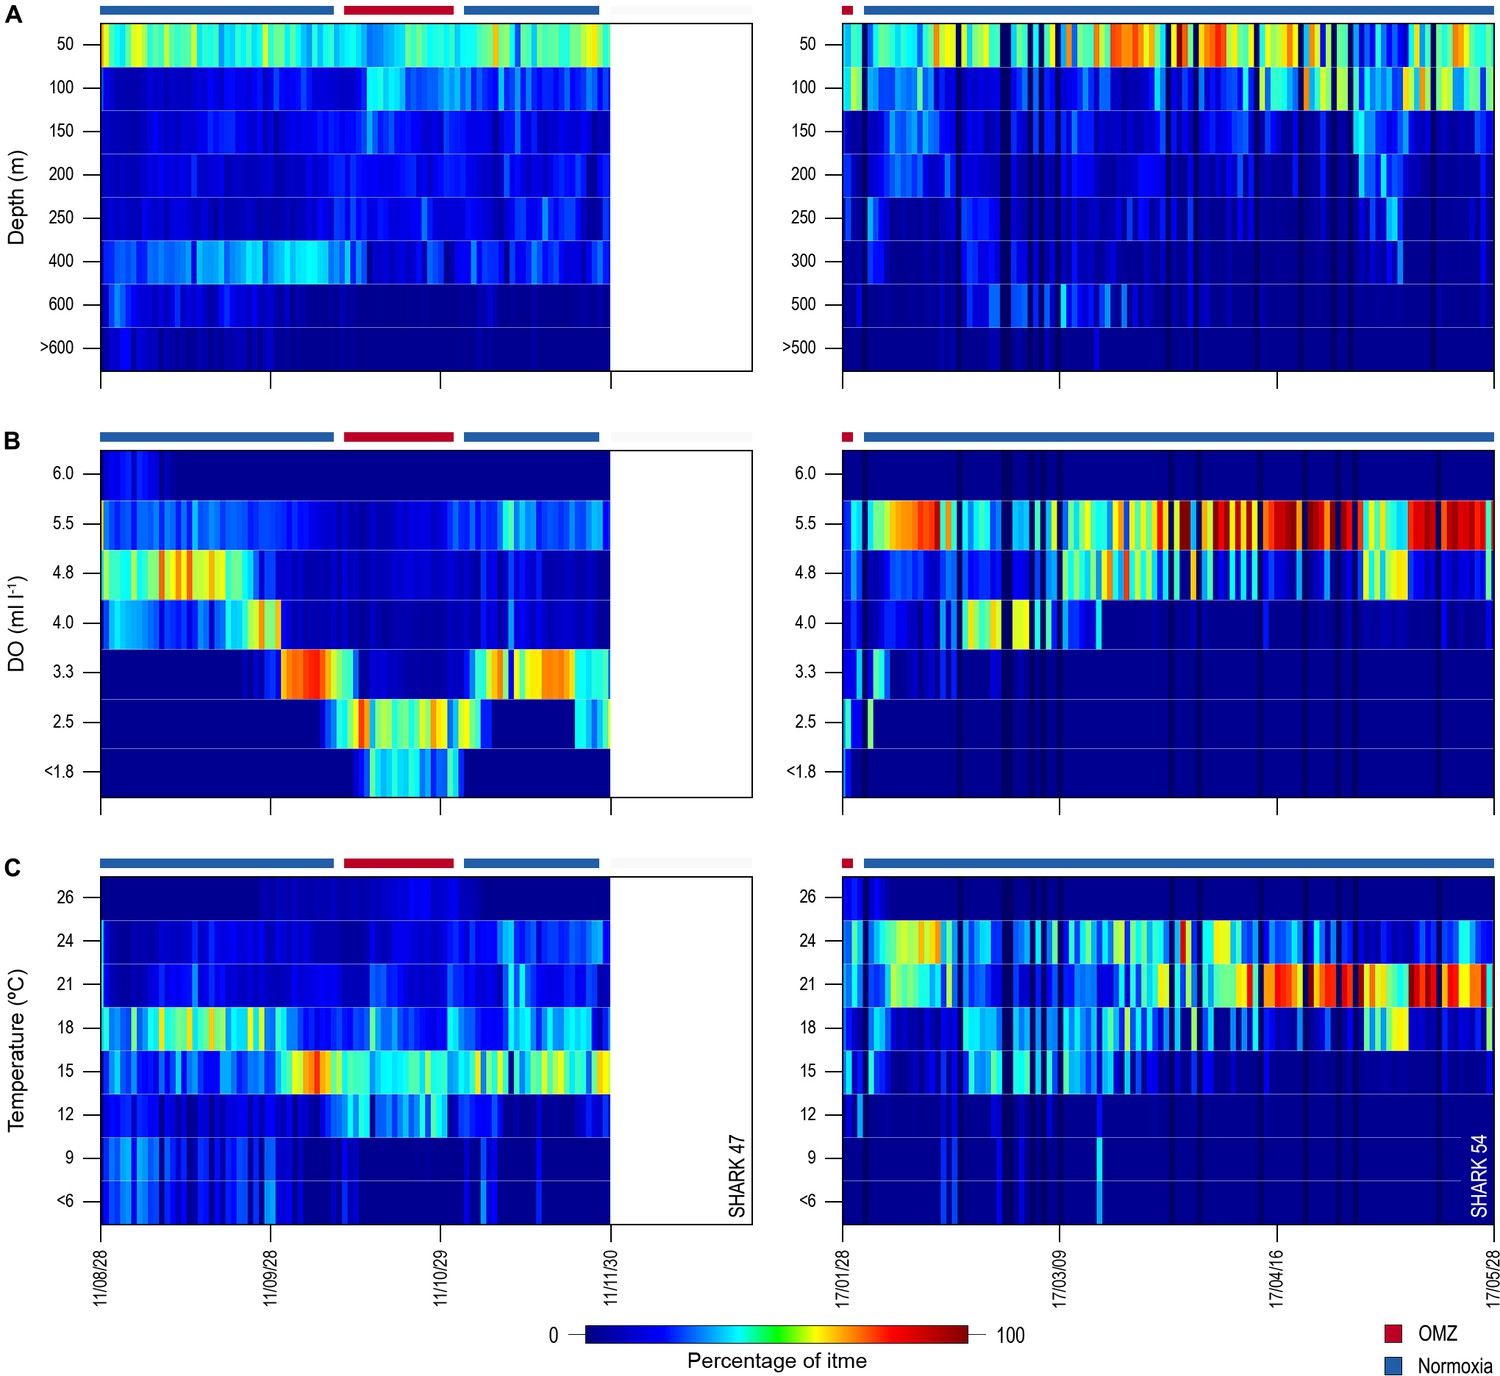
Changes in percentage time sharks spent at depth, dissolved oxygen (DO) concentrations, and water temperatures across oxygen minimum zone (OMZ) and adjacent areas.
Left panels show percentage times of shark 47 and the right panels show shark 54.
Figure 5—figure supplement 1
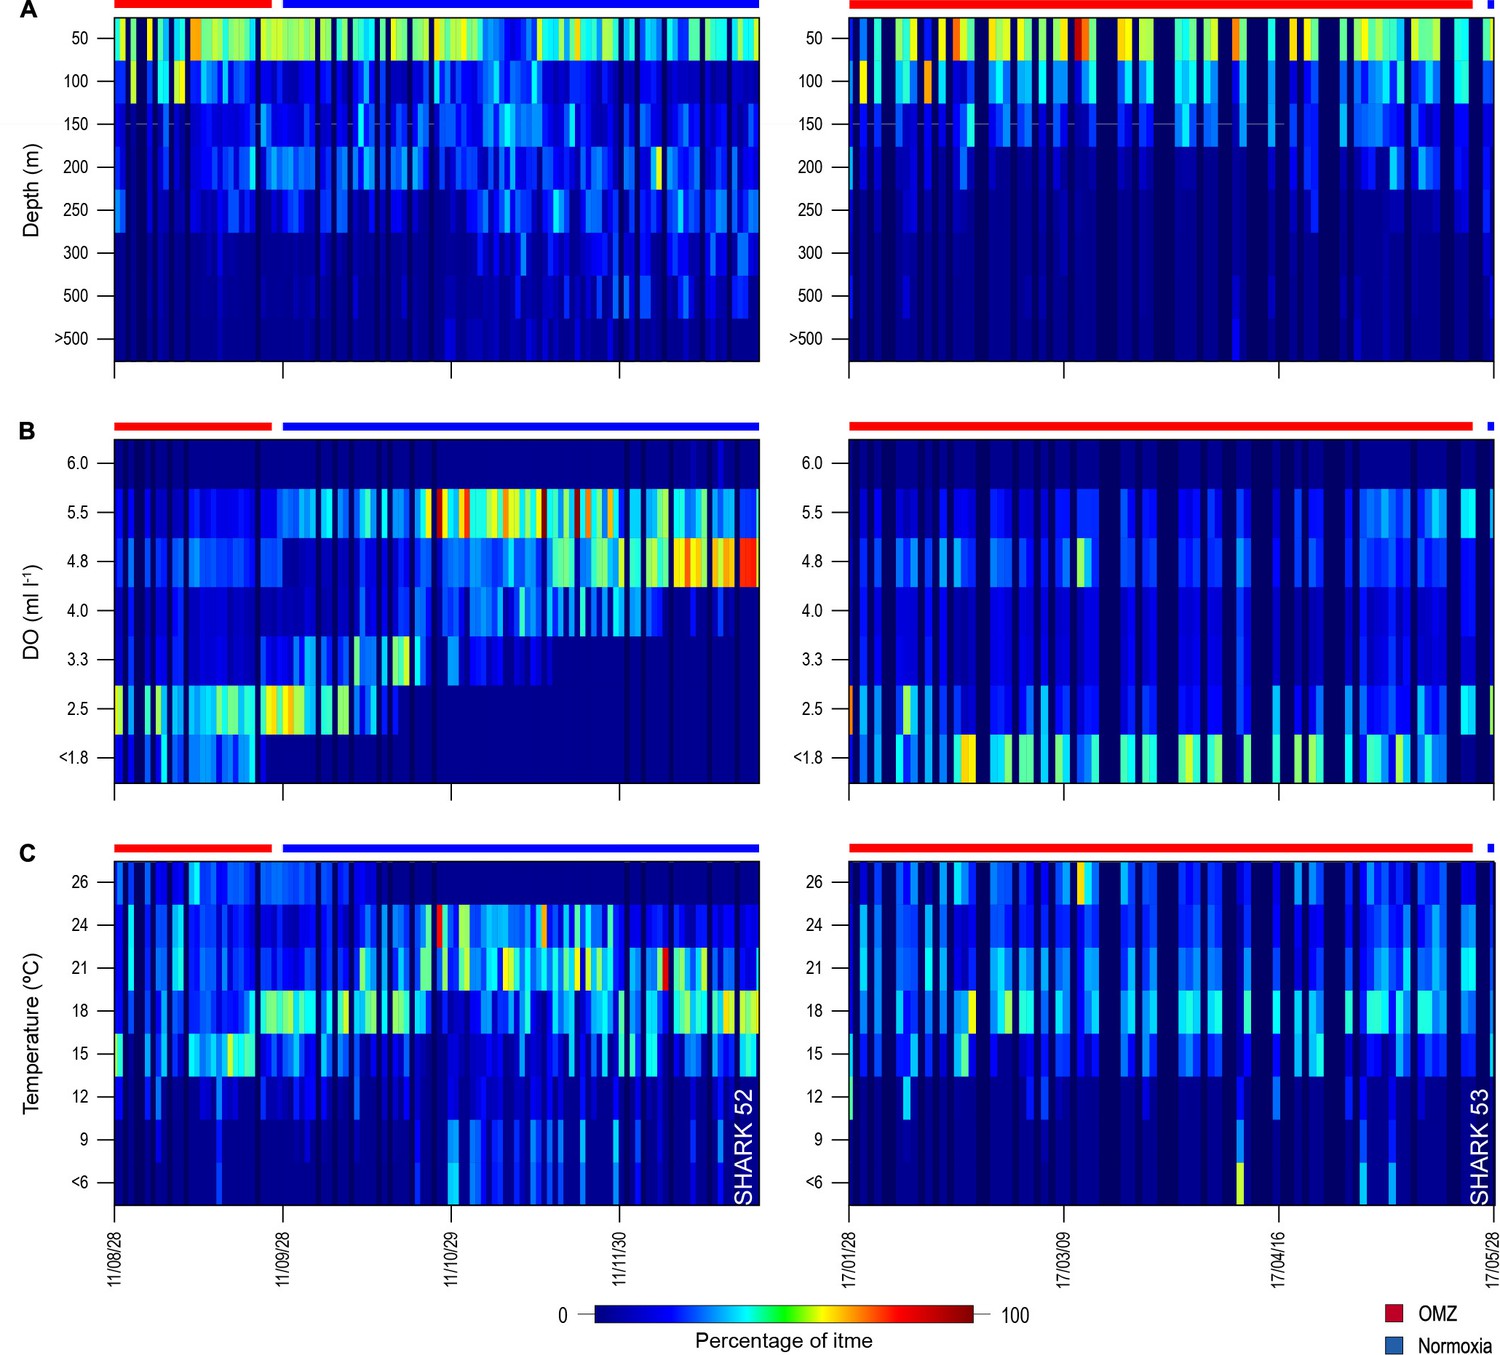
Changes in percentage time sharks spent at depth, dissolved oxygen (DO) concentrations, and water temperatures across oxygen minimum zone (OMZ) and adjacent areas.
Left panels show percentage times of shark 52 and right panels shark 53.
Figure 6
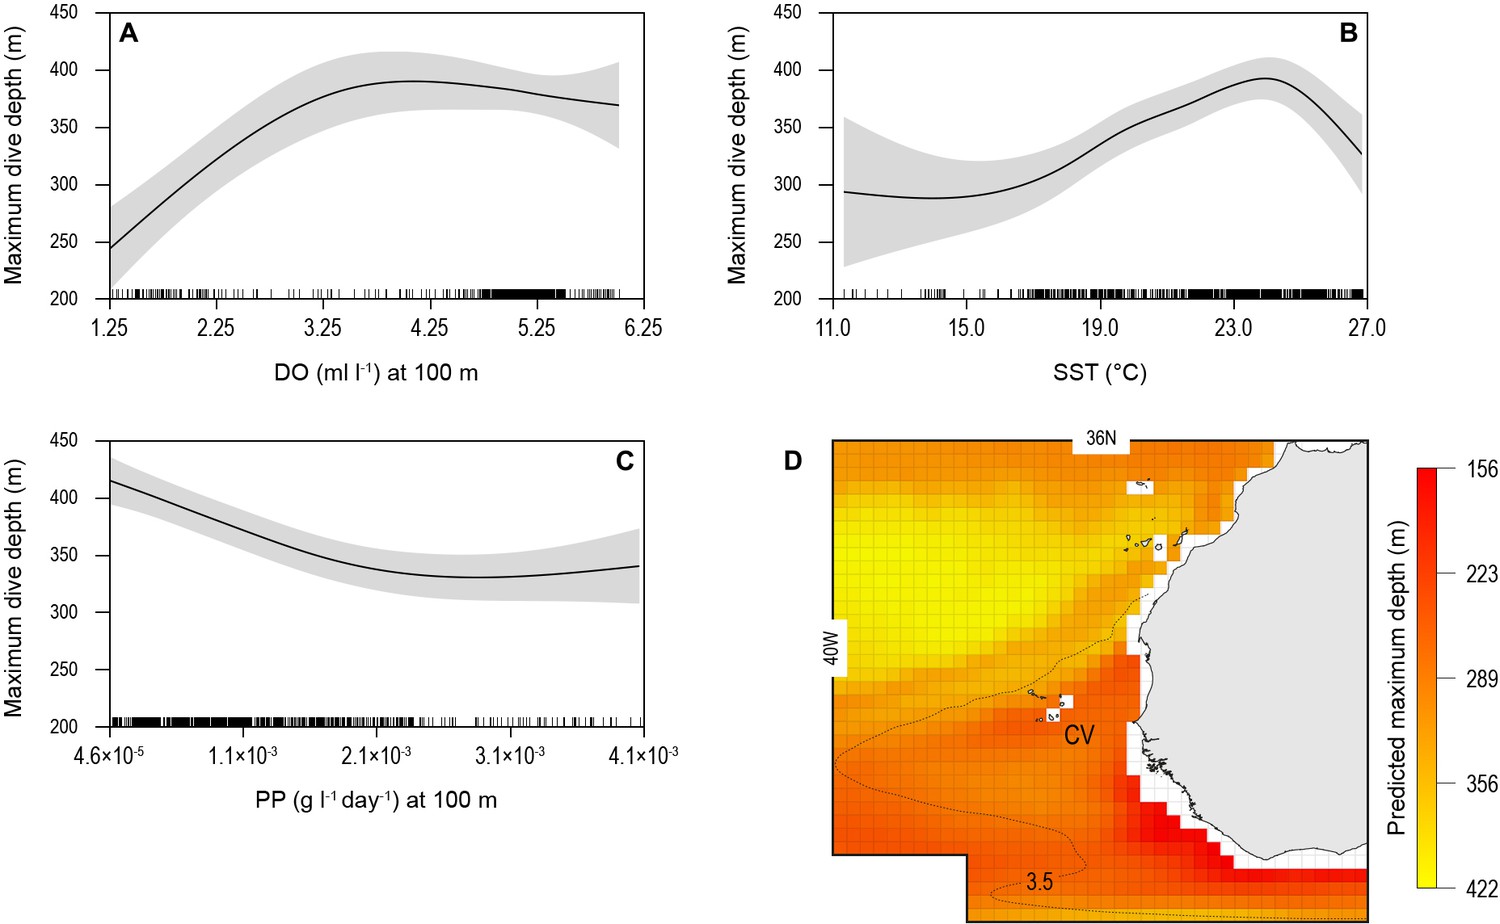
Generalised additive mixed model (GAMM) model relationships between blue shark dive depths and environmental variables with predicted present-day maximum daily dive (MDD) depths in the eastern tropical Atlantic (ETA) oxygen minimum zone (OMZ).
Predicted response of modelled shark MDD depth (m) to (A) dissolved oxygen (DO) at depth, (B) sea surface temperature (SST), and (C) net primary productivity at depth (NPP). Modelled shark MDD depth increases with increasing DO at depth, with a lower threshold DO concentration at about 3.5 ml O2 l−1 below which MDD starts decreasing (A), and with increasing SST up to ca. 24°C, above which MDD depths decrease (B). The model showed an inverse relationship of MDD depth with NPP at depth, where modelled MDD depth declines with increasing NPP at depth (C). Continuous lines represent mean modelled MDD depth and shaded areas represent the standard error. (D) The predicted present-day extent of blue shark MDD depths off western Africa determined with the GAMM model relationships. Black dotted line denotes position of the oxycline of 3.5 ml O2 l−1 at 100 m depth.
Figure 7
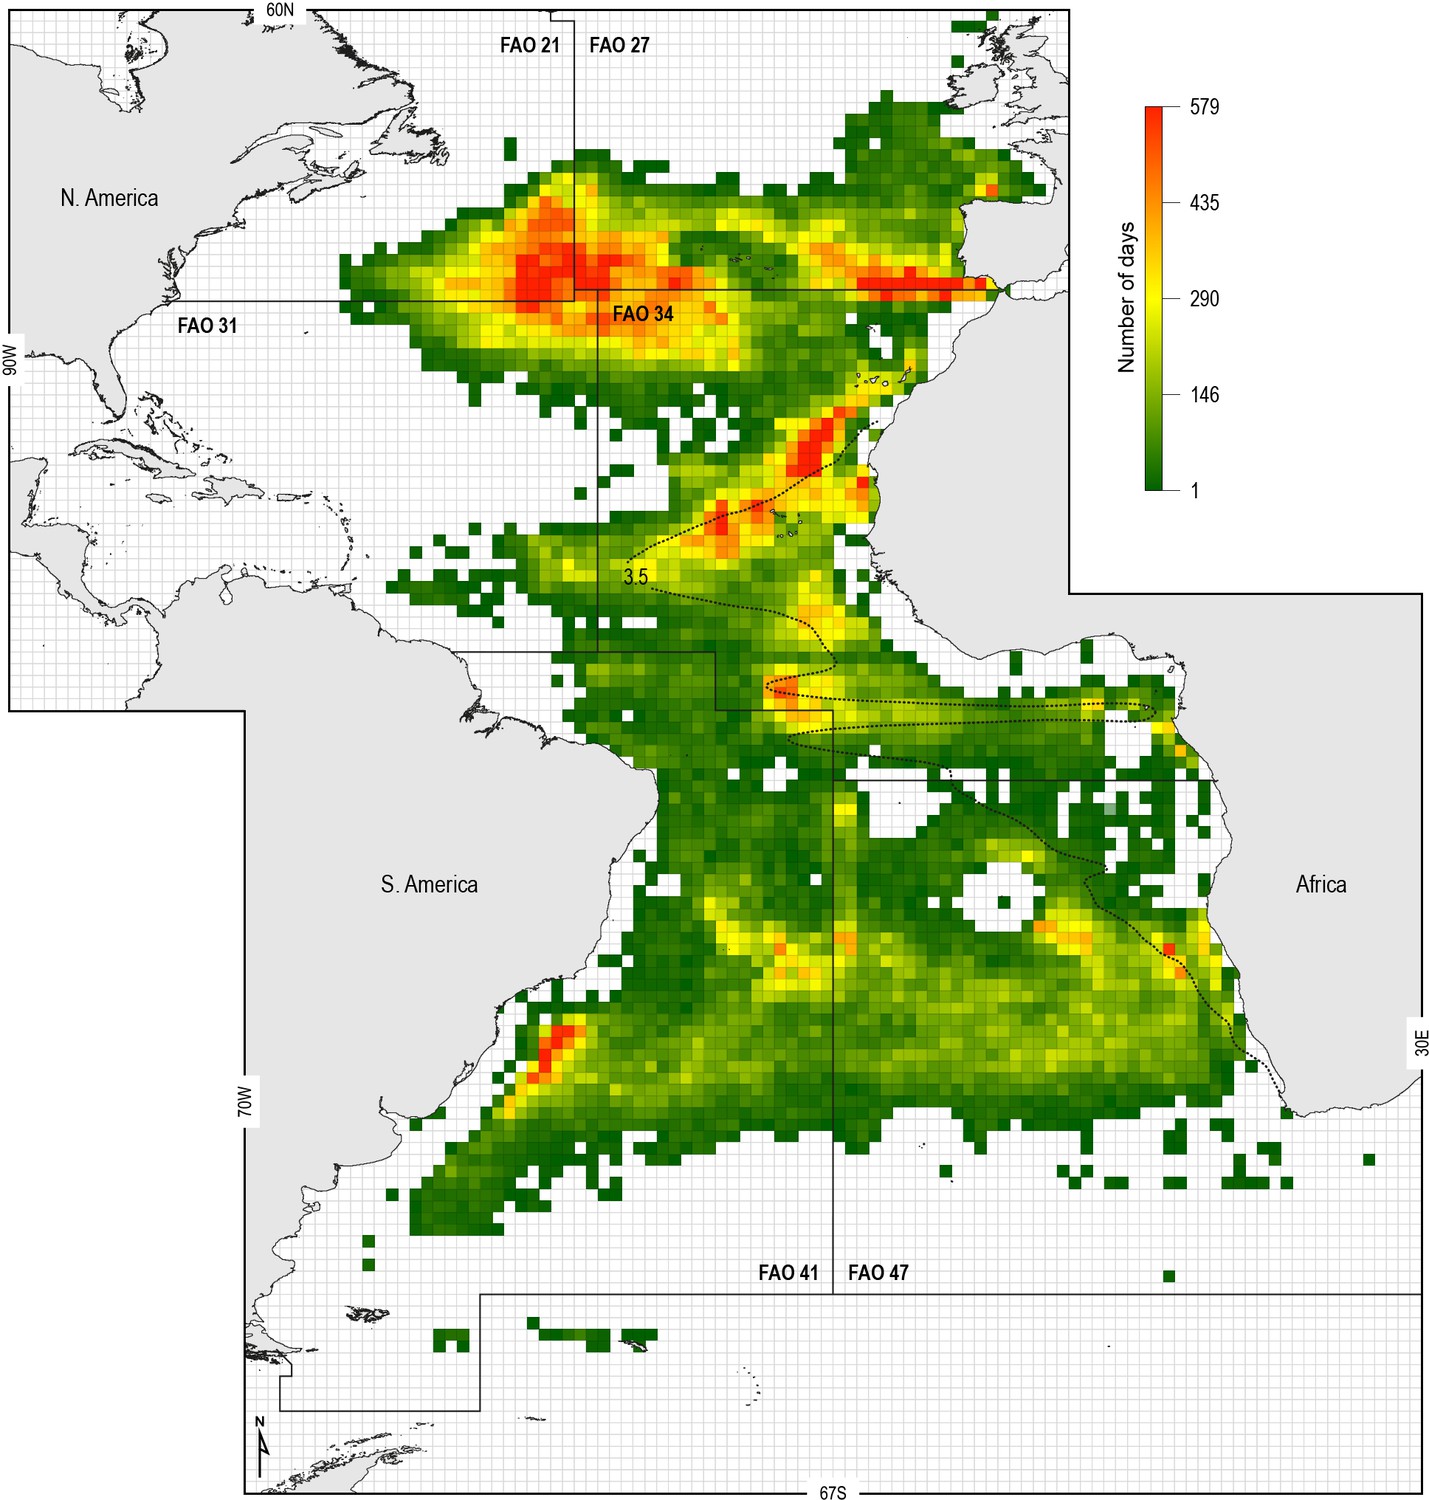
Spatial distribution of fishing effort of pelagic longline vessel fleets.
Spanish and Portuguese longline fishing vessels (n = 322) were GPS satellite-tracked between 2003 and 2011 with the vessel monitoring system (VMS). Black dotted line: oxycline (3.5 ml O2 l−1 at 100 m) used to denote the positions of the North and South Atlantic hypoxic zones that we define by the lower habitat boundary (hypoxia threshold) for blue shark estimated by our generalised additive mixed model (GAMM) (see Figure 6) for blue shark maximum daily dive (MDD) in relation to dissolved oxygen (DO) concentration. FAO boxes shown for reference provided arbitrary areas for use in vessel spatial analysis.
Figure 8 with 1 supplement

Longline catches of blue shark associated with the eastern tropical Atlantic (ETA) oxygen minimum zone (OMZ) and adjacent waters.
(A) The mean catch per unit effort (CPUE) of blue sharks by Spanish pelagic longline vessels in the area of the OMZ (2013–2018). Horizontal lines denote the six data transects shown in B–G. The dotted line denotes the 3.5 ml O2 l−1 oxycline at 100 m depth representing the lower habitat boundary (hypoxia threshold) for blue shark estimated by our generalised additive mixed model (GAMM) (see Figure 6). (B–G) panels show how mean CPUE changes along each transect in relation to dissolved oxygen (DO) concentration at 100 m depth. The horizontal dotted line in each panel denotes the 3.5 ml O2 l−1 oxycline.
Figure 8—figure supplement 1

Cumulative mean catch per unit effort (CPUE) along each transect in relation to dissolved oxygen (DO) concentration at 100 m.
(A) The mean CPUE of blue sharks by Spanish longliners in the area of the oxygen minimum zone (OMZ). Horizontal lines (B–G) denote the six data transects. Right-hand panels (B–G) indicate that catches of blue shark were maximally increasing as DO concentration at 100 m depth was decreasing (indicating OMZ shoaling). This suggests catches were more frequently larger when associated with strong vertical DO gradients.
Figure 9
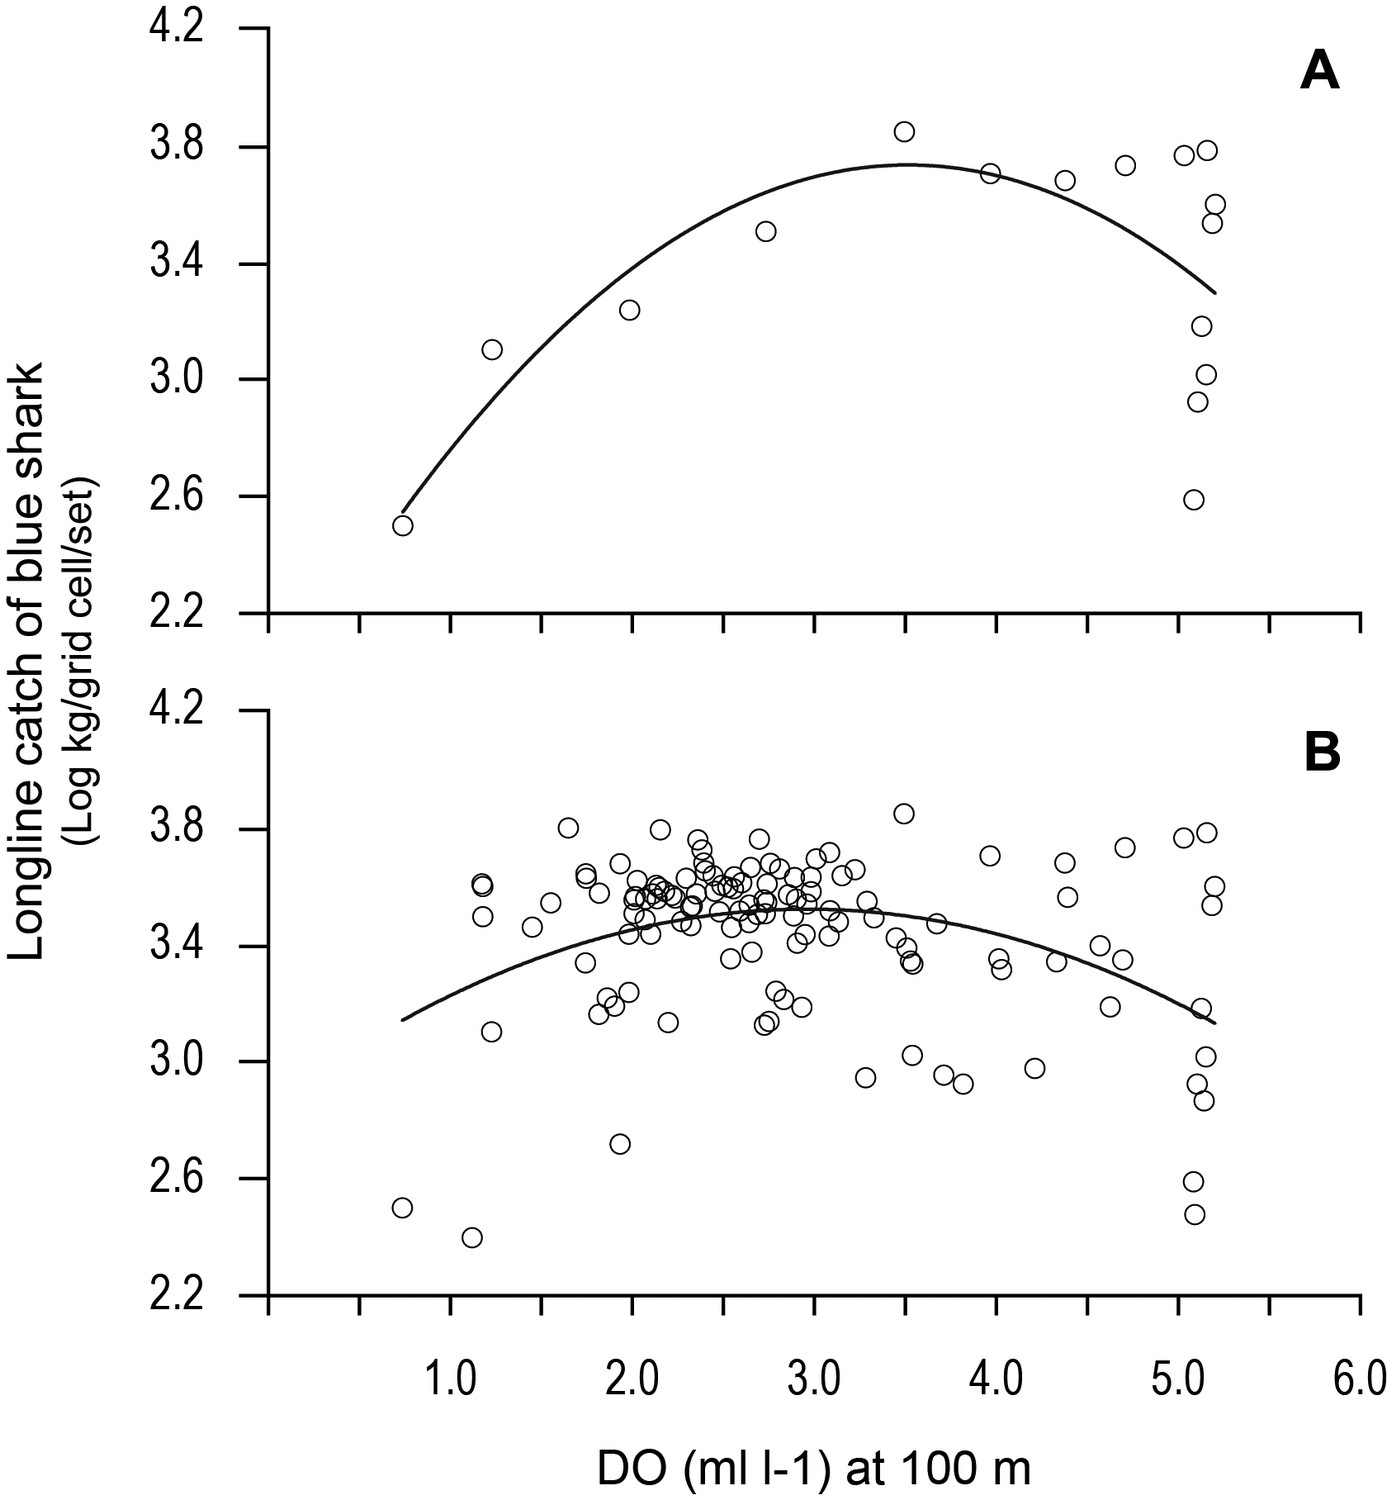
Variation in longline catches of blue shark along transects as a function of dissolved oxygen (DO) at depth.
Catch per unit effort of blue shark (mean CPUE: kilograms of blue shark/grid cell/fishing set) along (A) the 20.5°N transect of the northern boundary of the eastern tropical Atlantic (ETA) oxygen minimum zone (OMZ) and (B) CPUE for all grid cells along all six transects in relation to modelled DO (at 100 m depth). Solid lines are quadratic fits to the data to provide an estimate of the DO concentration at 100 m depth supporting an estimated peak catch of blue shark. Equations and statistics of the fitted quadratic models: (A) log10CPUE = 1.833 + 1.082 DO – 0.1539 DO^2 (n = 16, adj. r2 = 0.37, F = 5.49, p=0.019) and (B) log10CPUE = 2.846 + 0.4570 DO - 0.07732 DO^2 (n = 123, adj. r2 = 0.14, F = 10.88, p<0.0001).
Tables
Table 1
Summary of vertical movement data for pop-off satellite archival transmitter (PSAT)-tracked blue sharks that encountered waters above the oxygen minimum zone (OMZ) area.
DNR denotes a tag that did not report.
| Shark ID | % Time upper 250 m | Number dives below 600 m | Maximum dive depth | |||
|---|---|---|---|---|---|---|
| OMZ | Outside | OMZ | Outside | OMZ | Outside | |
| S1 | 59.7 | 69.9 | 2 | 6 | 680 | 696 |
| S39 | 98.5 | 83.8 | 0 | 19 | 288 | 1464 |
| S47 | 90.7 | 74.0 | 0 | 29 | 520 | 1400 |
| S48 | 88.8 | 92.9 | 2 | 7 | 1174 | 1390 |
| S49 | 98.6 | - | 1 | - | 930 | - |
| S50 | DNR | 85.7 | 1 | 2 | 804 | 1463 |
| S51 | 88.4 | 87.2 | 0 | 2 | 336 | 712 |
| S52 | 97.6 | 89.2 | 2 | 24 | 984 | 1480 |
| S53 | 98.0 | 84.7 | 3 | 1 | 1552 | 1264 |
| S54 | 97.9 | 92.1 | 0 | 7 | 272 | 1384 |
| Mean | 90.9 | 84.4 | 1.1 | 10.8 | 754.0 | 1250.3 |
| S.D. | 12.5 | 7.8 | 1.1 | 10.5 | 419.5 | 316.4 |
Table 2
Results of the GAMM model relating maximum daily dive (MDD) depth to environmental variables.
Std. error, standard error; R2 (adj), adjusted r-squared for the model; s, smooth; edf, estimated degrees of freedom; Ref df, estimated residual degrees of freedom. SST, sea surface temperature; DO, dissolved oxygen concentration at depth; PP, net primary productivity at depth.
| Estimate | Std. error | T value | p-value | ||
|---|---|---|---|---|---|
| MDD depth (m) (n = 1085) | (intercept) | 347.58 | 14.39 | 24.16 | <0.001 |
| edf | Ref. df | F | p-value | ||
| R2(adj) = 0.081 | s(DO) | 2.24 | 2.24 | 8.668 | <0.001 |
| s(PP) | 2.183 | 2.183 | 10.16 | <0.001 | |
| s(SST) | 3.895 | 3.895 | 4.144 | 0.002 |
Table 3
Fishing activity information for major fishing areas in the Atlantic with permanent OMZs indicate greater fishing intensity in waters above oxygen minimum zones (OMZs).
| FAO fishing area | Hypoxic (OMZ) or normoxic (more oxygenated) | Mean number of fishing days (per grid cell) | Fishing intensity (%) |
|---|---|---|---|
| FAO 34 (N Atlantic) | OMZ area | 72.7 | 65.0 |
| Normoxic area | 62.5 | 57.9 | |
| FAO 47 (S Atlantic) | OMZ area | 20.2 | 61.6 |
| Normoxic area | 31.3 | 56.7 |
Table 4
Summary of blue shark longline catch data across the eastern tropical Atlantic (ETA) oxygen minimum zone (OMZ).
Longline catch of blue sharks were taken from Spanish pelagic longline vessel logbooks and aggregated into 1 × 1° grid cells. Each data transect analysed extended from 15.5°W to 46.5°W.
| Transect latitude (°N) | Number of longline sets | Total blue shark catch in all transect grid cells (tonnes) | Peak catch per unit effort (CPUE) (kg/grid cell/day) | Dissolved oxygen (ml O2 l−1 at 100 m) at peak CPUE |
|---|---|---|---|---|
| 20.5 | 665 | 3148 | 7025.02 | 3.49 |
| 15.5 | 1045 | 4021 | 6195.48 | 2.16 |
| 12.5 | 399 | 1436 | 6294.53 | 1.65 |
| 11.5 | 506 | 2006 | 4778.71 | 2.39 |
| 10.5 | 477 | 1815 | 5736.87 | 2.36 |
| 9.5 | 377 | 1386 | 5769.6 | 2.70 |
Additional files
-
Supplementary file 1
Summary data for satellite-tagged blue sharks.
- https://cdn.elifesciences.org/articles/62508/elife-62508-supp1-v1.docx
-
Supplementary file 2
Testing habitat selection of blue sharks above the eastern tropical Atlantic (ETA) oxygen minimum zone (OMZ).
Real blue shark movements were compared to correlated random walk models for those sharks tagged in the Azores that encountered the ETA OMZ off western Africa. Proportion test described in Jaine et al., 2014; ns, non-significance.
- https://cdn.elifesciences.org/articles/62508/elife-62508-supp2-v1.docx
-
Supplementary file 3
Fishing activity information for the different major fishing areas in the Atlantic.
Shaded rows denote FAO area encompassing a permanent oxygen minimum zone.
- https://cdn.elifesciences.org/articles/62508/elife-62508-supp3-v1.docx
-
Transparent reporting form
- https://cdn.elifesciences.org/articles/62508/elife-62508-transrepform-v1.docx
Download links
A two-part list of links to download the article, or parts of the article, in various formats.
Downloads (link to download the article as PDF)
Open citations (links to open the citations from this article in various online reference manager services)
Cite this article (links to download the citations from this article in formats compatible with various reference manager tools)
Climate-driven deoxygenation elevates fishing vulnerability for the ocean's widest ranging shark
eLife 10:e62508.
https://doi.org/10.7554/eLife.62508


