Diversity and asynchrony in soil microbial communities stabilizes ecosystem functioning
- Department of Evolutionary Biology and Environmental Studies, University of Zürich, Switzerland
- Plant-Soil Interactions, Research Division Agroecology and Environment, Agroscope, Switzerland
- Fredericton Research and Development Centre, Agriculture and Agri-Food Canada, Canada
- Ecology and Biodiversity Group, Department of Biology, Utrecht University, Netherlands
- Department of Microbiological Sciences, North Dakota State University, United States
- Department of Geography, Remote Sensing Laboratories, University of Zürich, Switzerland
- Department of Plant and Microbial Biology, University of Zürich, Switzerland
Figures
Figure 1 with 6 supplements
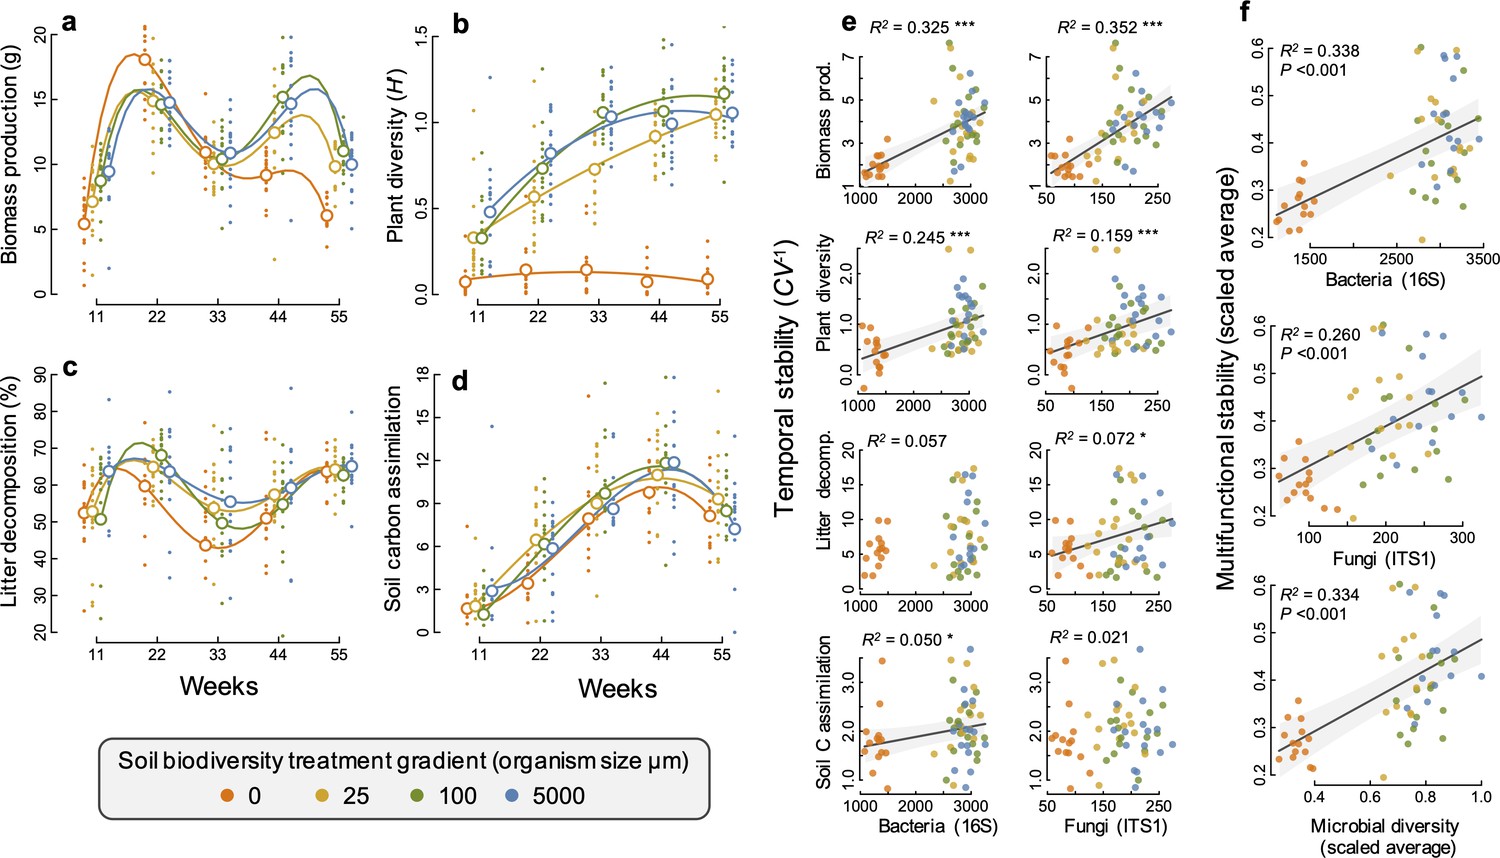
Changes in ecosystem functions through time and relationships between soil microbial diversity and multifunctional stability.
(a) Plant biomass production, (b) plant diversity, (c) litter decomposition, and (d) soil carbon assimilation, measured as the δ13C in the soil and scaled by the minimum value such that larger positive values indicate a greater amount of δ13C detected in the soil. Individual points are data from individual mesocosms and larger open points are the means for each time point and soil biodiversity treatment level. Polynomial regression lines are shown to highlight the temporal trends. (e) The relationship between the temporal stability (the inverse coefficient of variation, CV−1) of each of the four functions and the richness of bacteria and fungi. (f) Multifunctional stability, calculated as the scaled average of the stability of each of the four ecosystem functions shown in relation to the richness of bacteria, fungi, and microbial diversity (the scaled average of fungal and bacterial richness) are all highly significant. Regression lines and 95% confidence bands are shown for significant relationships (p<0.05).
Figure 1—figure supplement 1
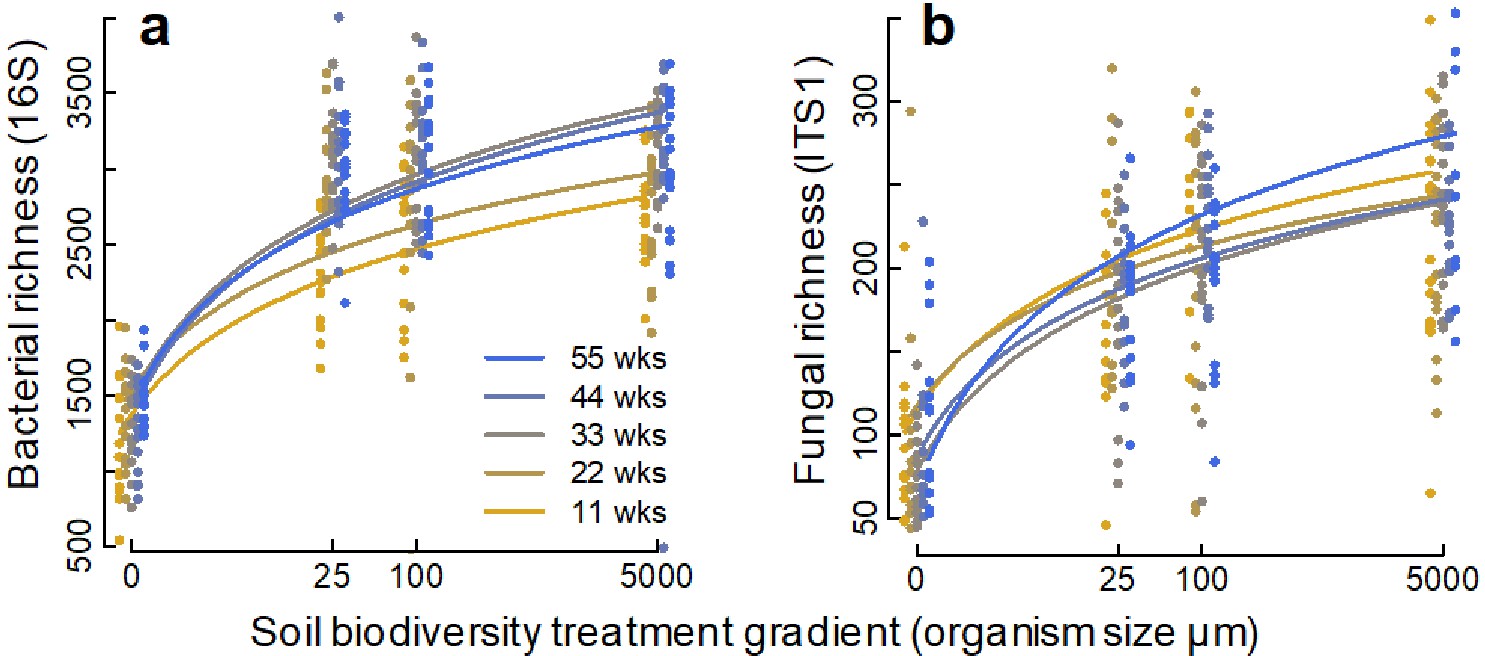
Changes in soil microbial diversity for each treatment along the diversity gradient.
Different colours indicate the different time point measurements in weeks (wks). (a) Bacterial richness, (b) fungal richness. Both bacterial and fungal richness declined along the soil biodiversity treatment gradient. Bacterial richness varied among sampling time points, where after 11 and 22 weeks, the richness was lower than at later sampling time points (a). However, the temporal change in bacterial richness was independent of soil biodiversity treatment gradient. Fungal richness did not vary through time and its relationship with the soil biodiversity treatment gradient did not change over time (time by biodiversity treatment gradient interaction). ANOVA model results are shown in Supplementary file 1 -Table 2.
Figure 1—figure supplement 2
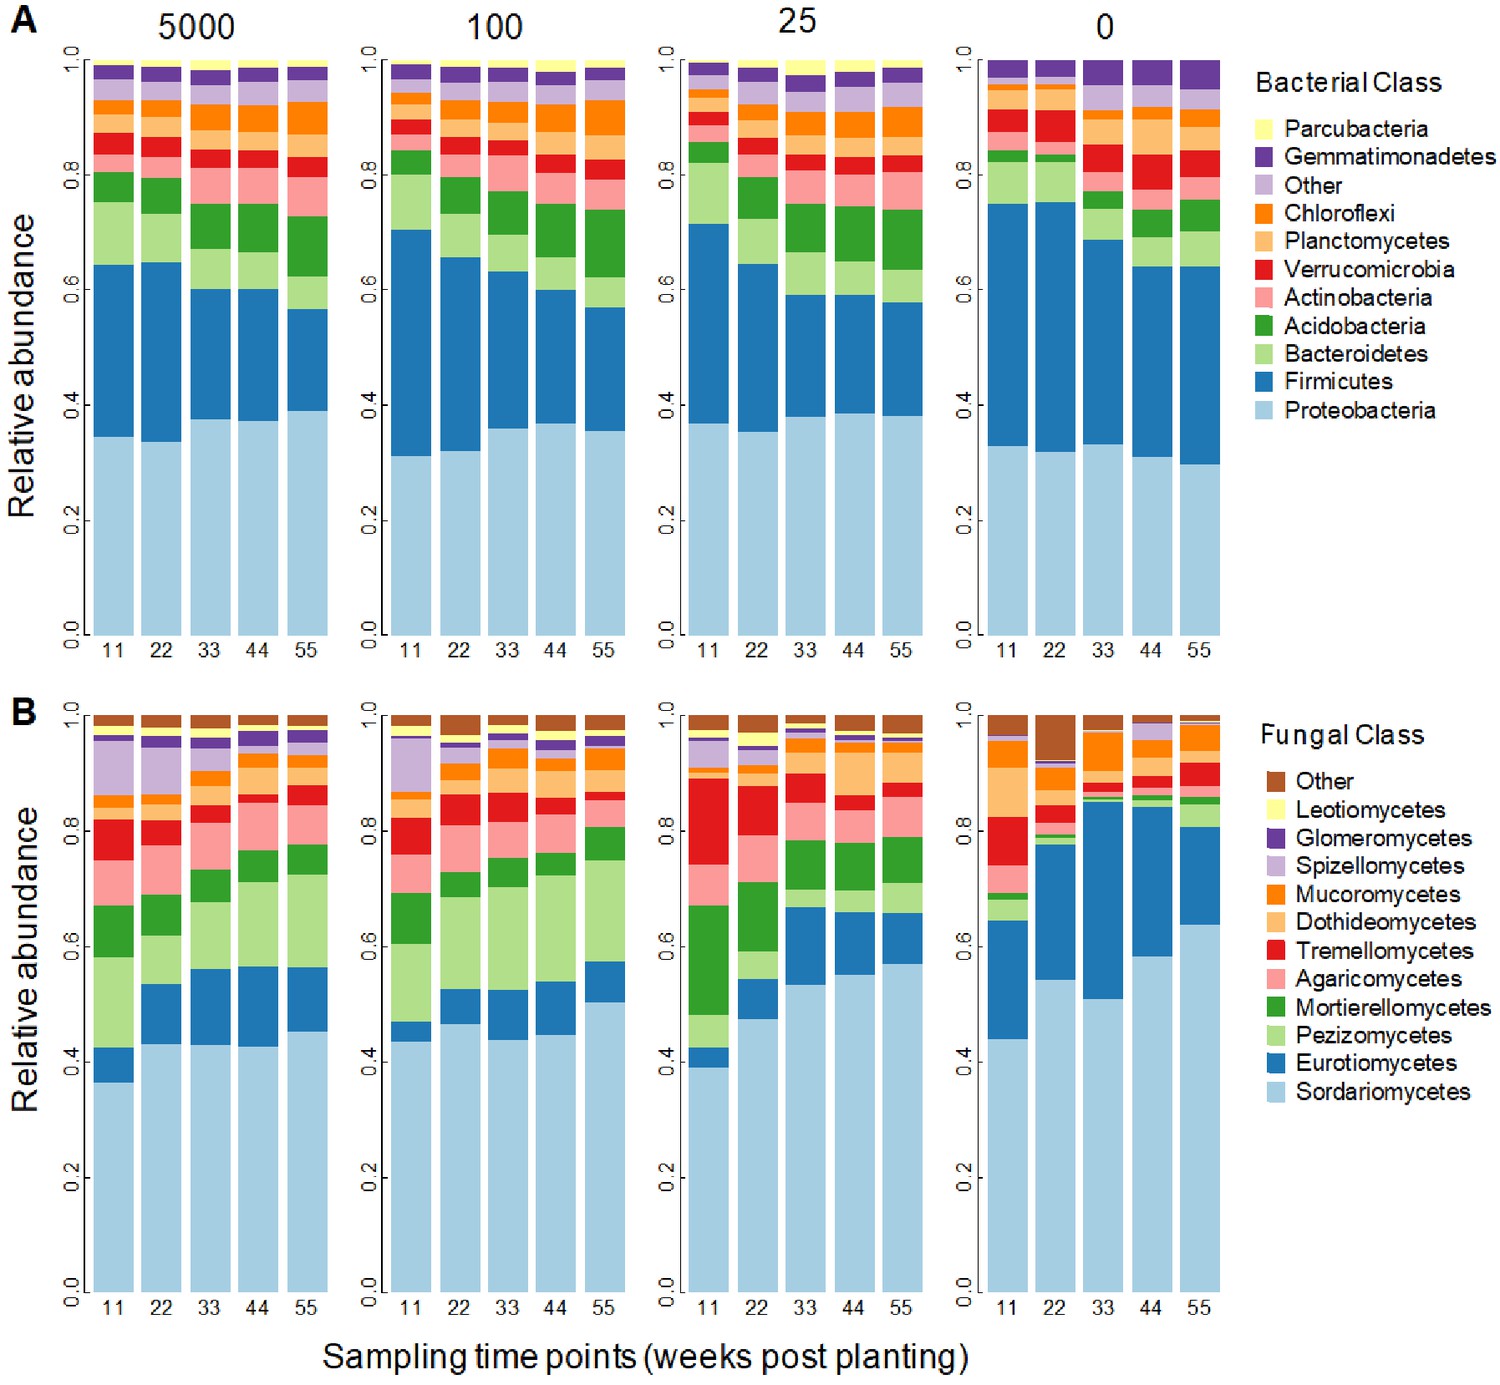
Proportional abundance of (A) fungal classes and (B) bacterial classes is shown for each time point (11, 22, 33, 44, and 55 weeks) and for the different inoculum treatments created by sieving soil through 5000, 100, 25 µm, and sterile, corresponding to 0 µm (shown in subpanels from left to right).
Figure 1—figure supplement 3
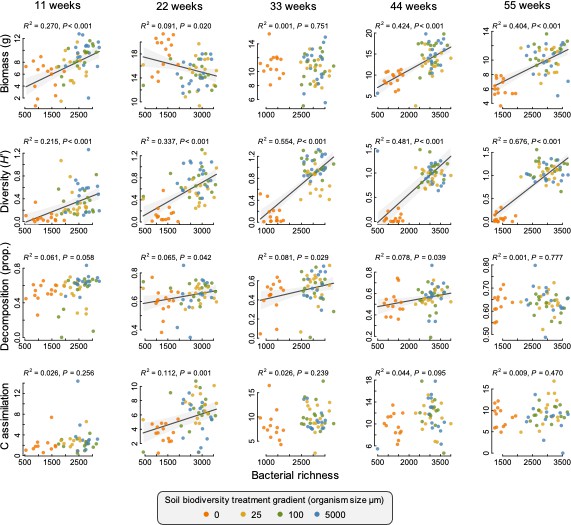
Bacterial richness-ecosystem function relationships for each time point.
Solid lines indicate a significant relationship (p<0.05), and the grey shaded region is the 95% confidence band for the relationship. Fit statistics (R2 and p-value) for each are also provided above each plot. Points are individual mesocosms coloured by their soil biodiversity treatment.
Figure 1—figure supplement 4
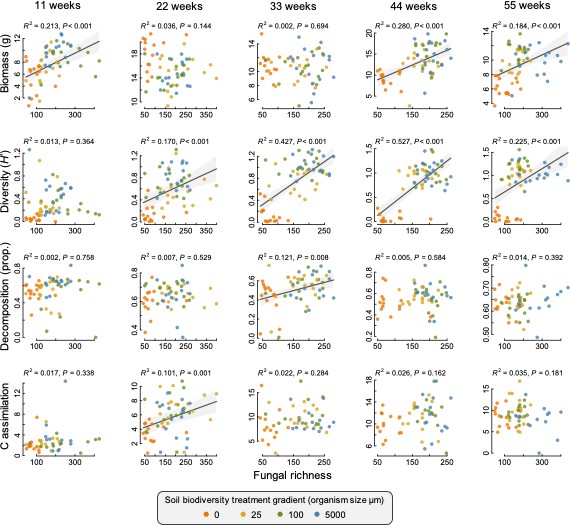
Fungal richness-ecosystem function relationships for each time point.
Solid lines indicate a significant relationship (p<0.05), and the grey shaded region is the 95% confidence band for the relationship. Fit statistics (R2 and p-value) for each are also provided above each plot. Points are individual mesocosms coloured by their soil biodiversity treatment. Fungal richness-ecosystem function relationships for each time point.
Figure 1—figure supplement 5
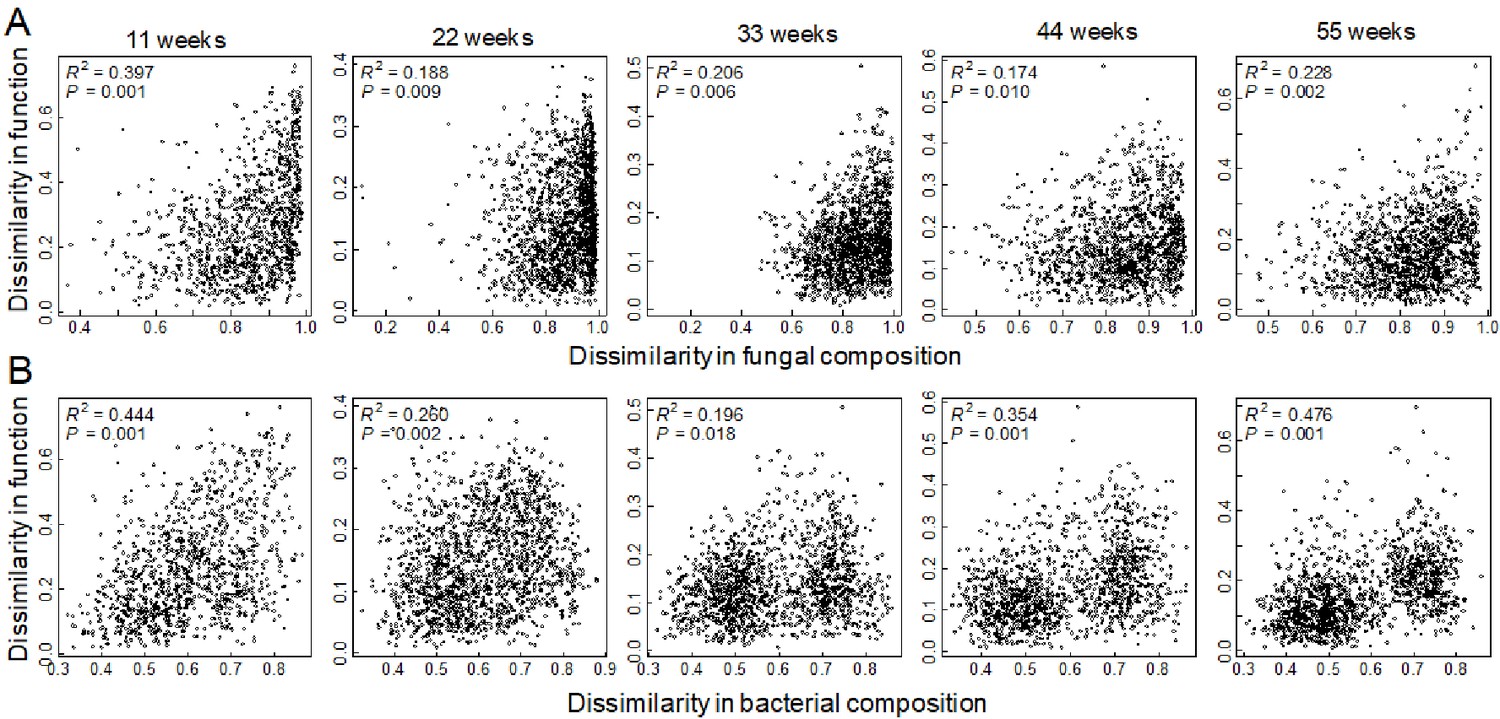
Mantel correlation tests associating the dissimilarity in ecosystem functioning and the dissimilarity in (A) the fungal and (B) the bacterial community compositions at each of the five sampling times.
Dissimilarity was calculated using Euclidean distance.
Figure 1—figure supplement 6
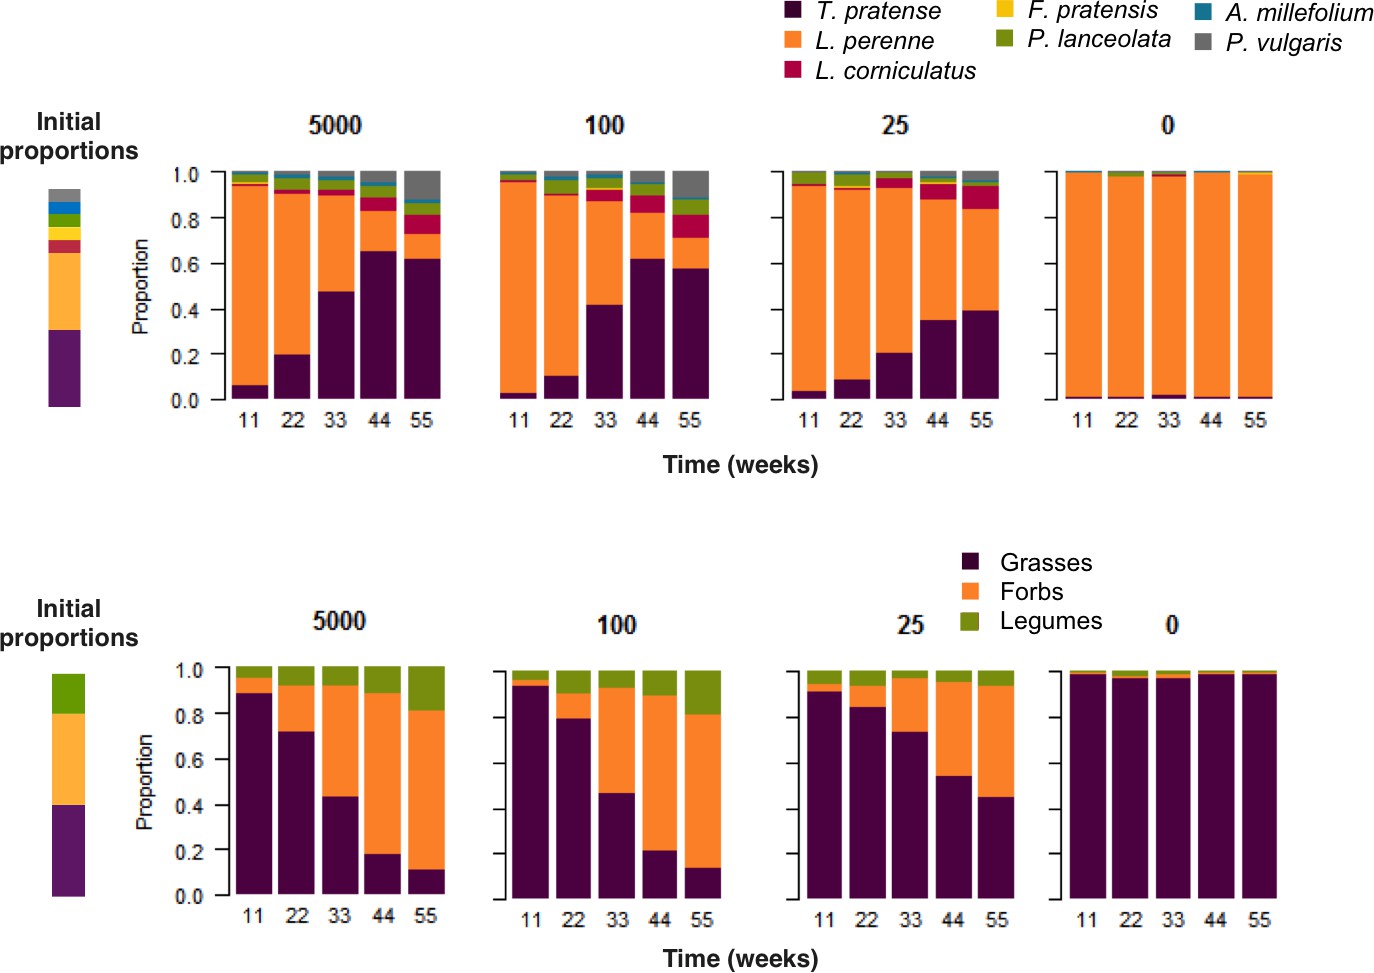
Plant species proportional abundance.
Different species are indicated by different colours. Proportions are shown for each harvest time (11, 22, 33, 44, and 55 weeks) and for the different inoculum treatments created by sieving soil through 5000, 100, 25 µm, and sterile, corresponding to 0 µm. Plant species proportional abundance.
Figure 2
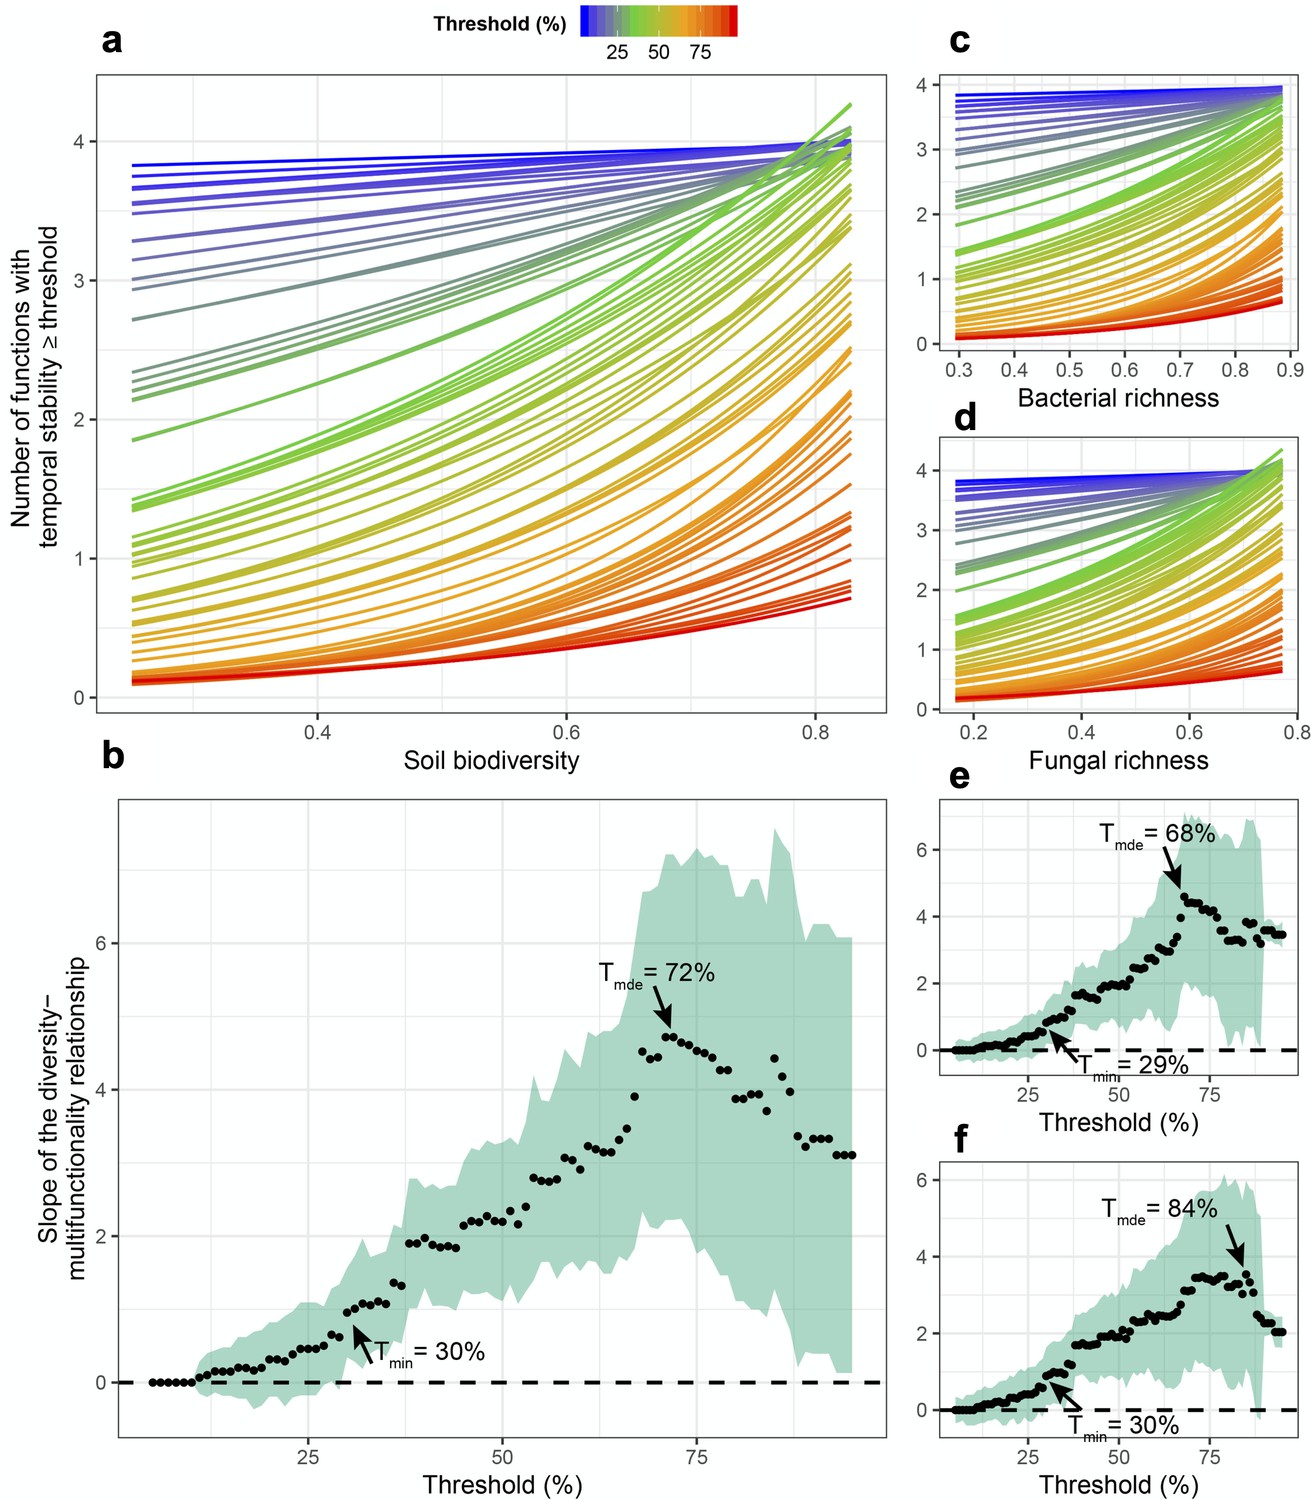
Soil microbial diversity effects on the temporal stability of ecosystem multifunctionality over a range of multifunctionality thresholds.
(a) Slopes of soil microbial diversity (average of scaled bacterial and fungal richness) relationship with ecosystem multifunctional stability are shown over a range of thresholds. Points are the slopes of the relationships and the shaded green area represents the 95% confidence intervals around the slope such that diversity effect on the stability of multifunctionality is significant when the intervals do not overlap the zero dashed line. (b) The effects of soil microbial diversity on the number ecosystem functions they stabilze above a threshold. Bold lines represent the minimum threshold above which (Tmin) and maximum threshold below which (Tmax) stability of multifunctionality is associated with diversity, and the realized maximum diversity effect (Rmde) where the slope of the diversity-stability of multifunctionality relationship is steepest. (c) The slopes of the richness-multifunctional stability relationships and the number of ecosystem functions supported for each threshold are shown for bacterial richness. (d) The slopes of the richness-multifunctional stability relationships and the number of ecosystem functions supported for each threshold are shown for fungal richness.
Figure 3 with 1 supplement
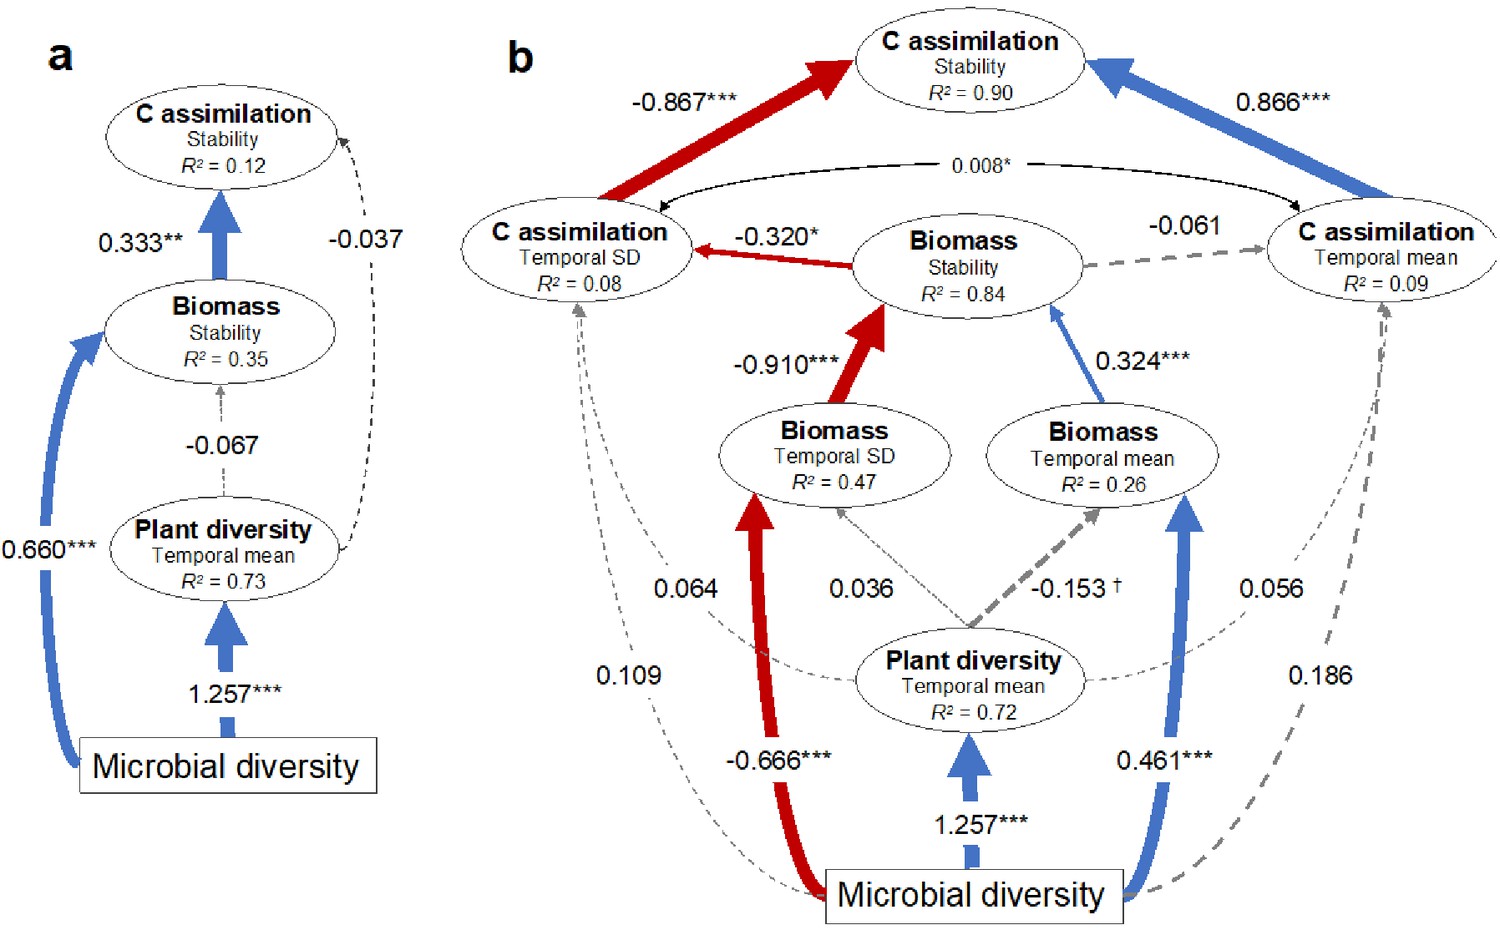
Structural equation models illustrating the indirect effects of soil microbial diversity on the stability of plant biomass production and soil carbon assimilation.
(a) Model illustrating that microbial diversity provides greater stability in biomass production that in turn stabilizes soil carbon assimilation. The microbial diversity to carbon assimilation was the least significant path and was removed so that the model was not fully saturated. Model fit: Chi-square = 0.003, p=0.954; RSEMA (Root Mean Squared Error of approximation) = 0, p=0.957; SRMR (Standardized Root Mean Square Residual) = 0.001, BIC (Bayesian Information Criterion) = −122.2. (b) Since stability is the ratio of the temporal mean and variance (SD), the effects of microbial diversity on stability through affecting the temporal mean and SD are shown. The model indicates that microbial diversity promotes biomass stability both by increasing biomass and reducing the variation in biomass production. The mean and SD of soil carbon assimilation were allowed to covary (indicated by the double arrow). Model fit: Chi-square = 15.9, p=0.144; RMSEA = 0.086, p=0.241; SRMR (Standardized Root Mean Square Residual) = 0.033, BIC (Bayesian Information Criterion) = −568.7. See figure supplement 1 for the effects of the temporal mean and variation of plant biomass production on the temporal mean and variation in soil carbon assimilation respectively that produced similar results. Red and blue arrows indicate negative and positive effects respectively and the standardized coefficients for each are show adjacent. Non-significant effects are indicated by grey dashed lines. Significance is indicated by †p<0.1, *p<0.05, **p<0.01, ***p<0.001. The marginal R2 for each endogenous variable is provided (within ellipses).
Figure 3—figure supplement 1
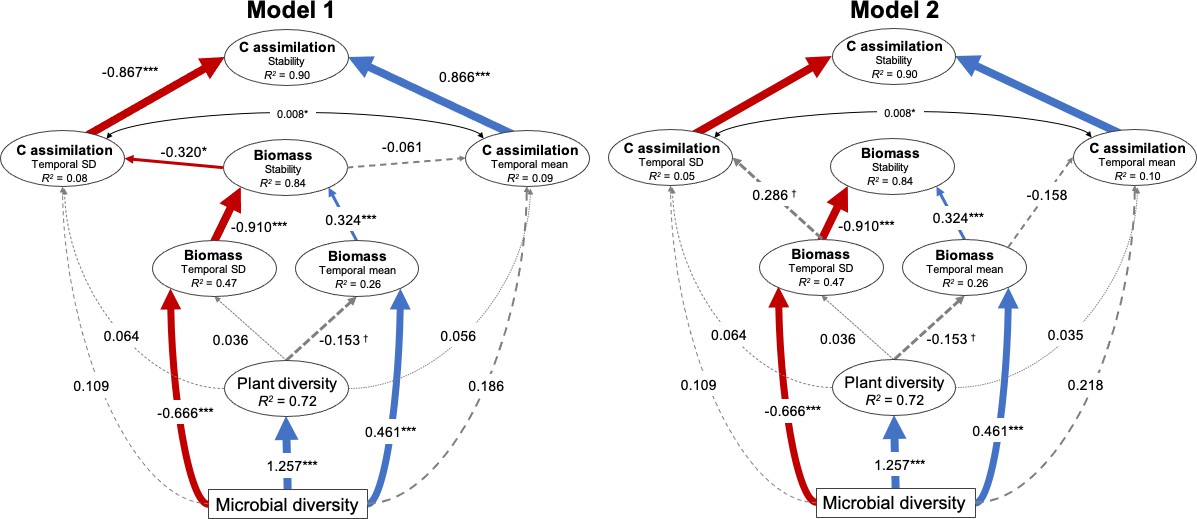
Structural equation model (SEM) results illustrating the direct and indirect effects of microbial diversity on the stability in plant biomass production and stability in soil carbon assimilation.
The model assesses the effects of the temporal mean and variation of plant biomass production on the temporal mean and variation in soil carbon assimilation respectively. Red and blue arrows indicate negative and positive effects respectively, and the standardized coefficients for each are show adjacent. Non-significant effects are indicated by grey dashed lines. Significance is indicated by †p<0.1, *p<0.05, **p<0.01, ***p<0.001. The temporal mean and variation in soil carbon assimilation were allowed to covary, indicated by the black double headed arrow. The marginal R2 for each endogenous variable is provided (within ellipses). Model fit statistics: Chi-square = 18.3, p=0.107; RSEMA (Root Mean Squared Error of approximation) = 0.094, p=0.194; SRMR (Standardized Root Mean Square Residual) = 0.043, BIC (Bayesian Information Criterion) = −570.4. Microbial diversity is the scaled average bacterial and fungal richness. SEM results illustrating the direct and indirect effects of microbial diversity on the stability in plant biomass production and stability in soil carbon assimilation.
Figure 4

The proportion of soil microbes that support ecosystem functions increases with the number of functions and time points considered.
A higher proportion of soil taxa affected ecosystem functioning, both positively (black bars) and negatively (grey bars), when more ecosystem functions (a, c, d) and number of time points (b, e, f) were independently considered. This result was found for the scaled average of fungal and bacterial taxa (a, b), the soil bacterial (c, e), and soil fungal taxa (d, f). Regression lines indicate generalized linear model fits and box plots summarize observed data.
Figure 5 with 1 supplement
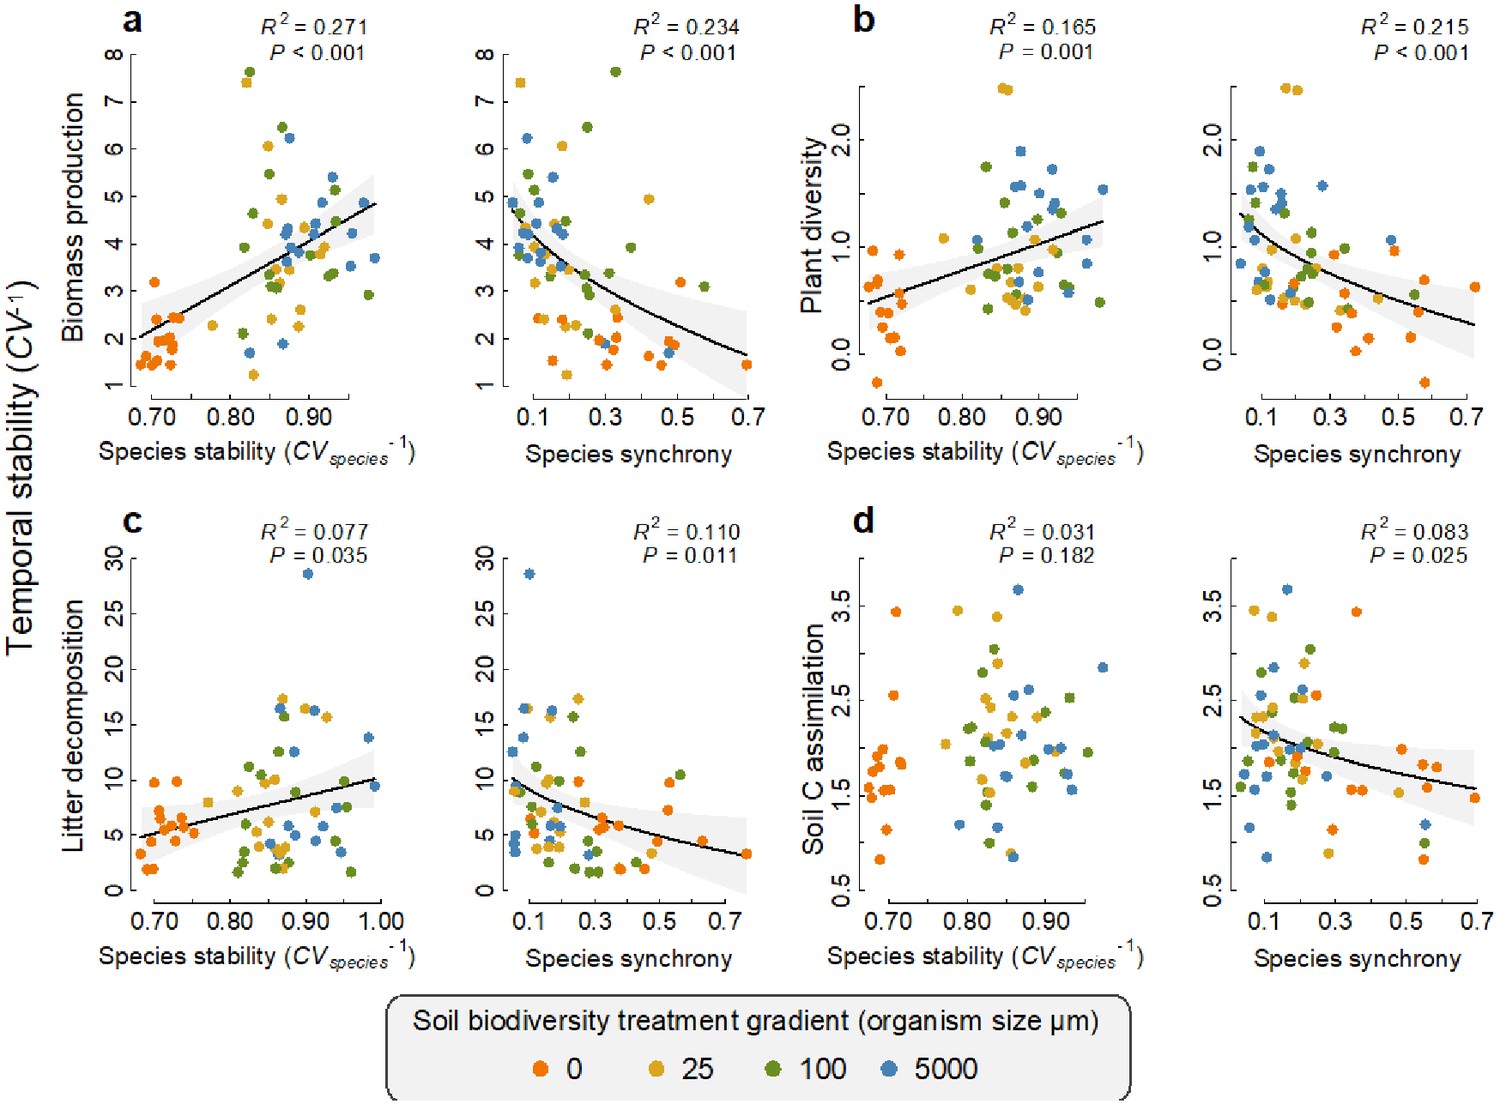
Relationships between the temporal stability of each ecosystem function with species temporal stability and synchrony.
(a) Temporal stability of plant biomass production, (b) temporal stability of plant diversity, (c) temporal stability of litter decomposition, and (d) temporal stability of soil carbon assimilation are shown in relation to the average stability in the abundance of the fungi and bacterial taxa (species stability) and the temporal synchrony among fungi and bacteria that were found to support each function. The relationships for fungi and bacteria are shown separately in figure 1. Regression lines and 95% confidence bands are shown for significant relationships (p<0.05).
Figure 5—figure supplement 1
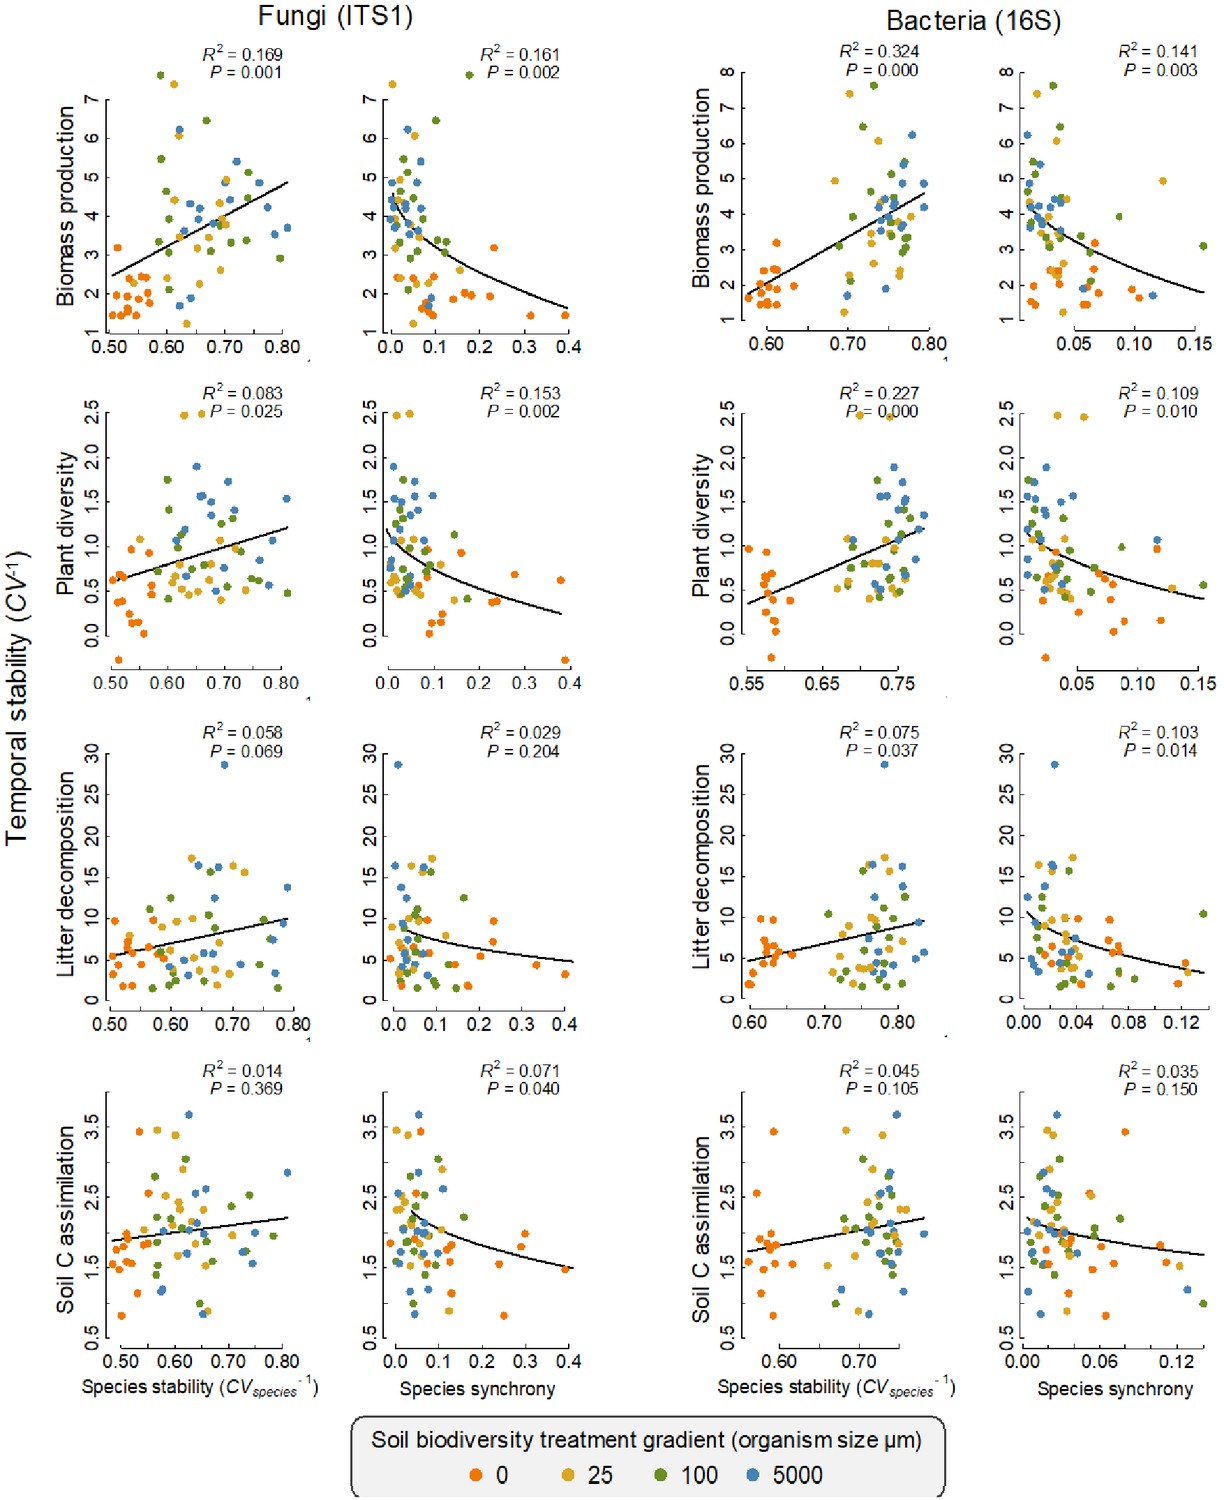
Temporal stability in ecosystem functions relationships with the temporal stability and synchrony in the abundance of individual fungal and bacterial taxa.
Species stability (CVspecies−1) and synchrony were calculated using the abundance of operational taxonomic units (OTUs) that were found to have an impact on the function. Solid lines highlight the relationship and the fit (R2) and significance (p) statistics are provided for each panel. Temporal stability in ecosystem functions relationships with the temporal stability and synchrony in the abundance of individual fungal and bacterial taxa.
Additional files
-
Supplementary file 1
Results of ANOVA models assessing the effects of soil biodiversity treatments on microbial richness, composition and ecosystem functions, and effect of microbial richness, asynchrony, and stability in the abundance of microbes on the stability of ecosystem functions.
- https://cdn.elifesciences.org/articles/62813/elife-62813-supp1-v1.docx
-
Supplementary file 2
Summary results for the taxonomic assignment of operational taxonomic units (OTUs) having a significant positive and negative association with an ecosystem function at each time point.
- https://cdn.elifesciences.org/articles/62813/elife-62813-supp2-v1.docx
-
Transparent reporting form
- https://cdn.elifesciences.org/articles/62813/elife-62813-transrepform-v1.docx
Download links
A two-part list of links to download the article, or parts of the article, in various formats.
Downloads (link to download the article as PDF)
Open citations (links to open the citations from this article in various online reference manager services)
Cite this article (links to download the citations from this article in formats compatible with various reference manager tools)
Diversity and asynchrony in soil microbial communities stabilizes ecosystem functioning
eLife 10:e62813.
https://doi.org/10.7554/eLife.62813


