Echolocating toothed whales use ultra-fast echo-kinetic responses to track evasive prey
- Sea Mammal Research Unit, University of St Andrews, United Kingdom
- Zoophysiology, Department of Biology, Aarhus University, Denmark
- BIOECOMAC, Department of Animal Biology, Edaphology and Geology, University of La Laguna, Spain
- Centre d’Etudes Biologiques de Chizé, CNRS, France
- Aarhus Institute of Advanced Studies, Aarhus University, Denmark
Figures
Figure 1
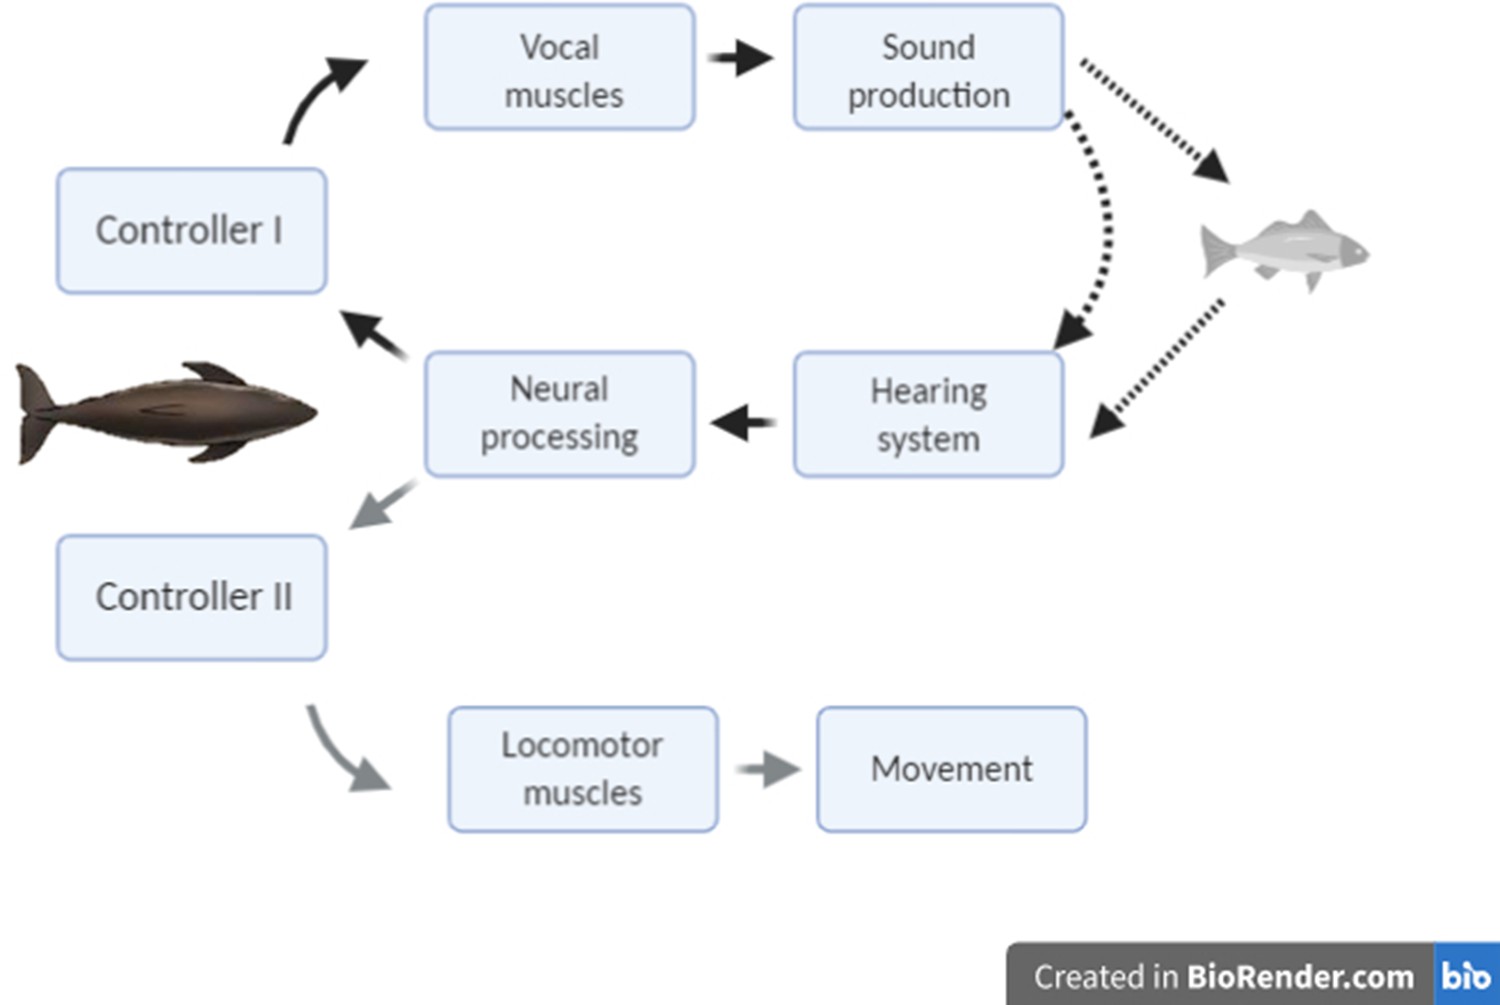
Conceptual schematic of the hypothesised feedback control mechanisms that act in response to changing target range in echolocation-mediated foraging.
The dark lines indicate acoustic paths in echolocation. The grey line indicates movement of the predator towards the prey.
Figure 2 with 2 supplements

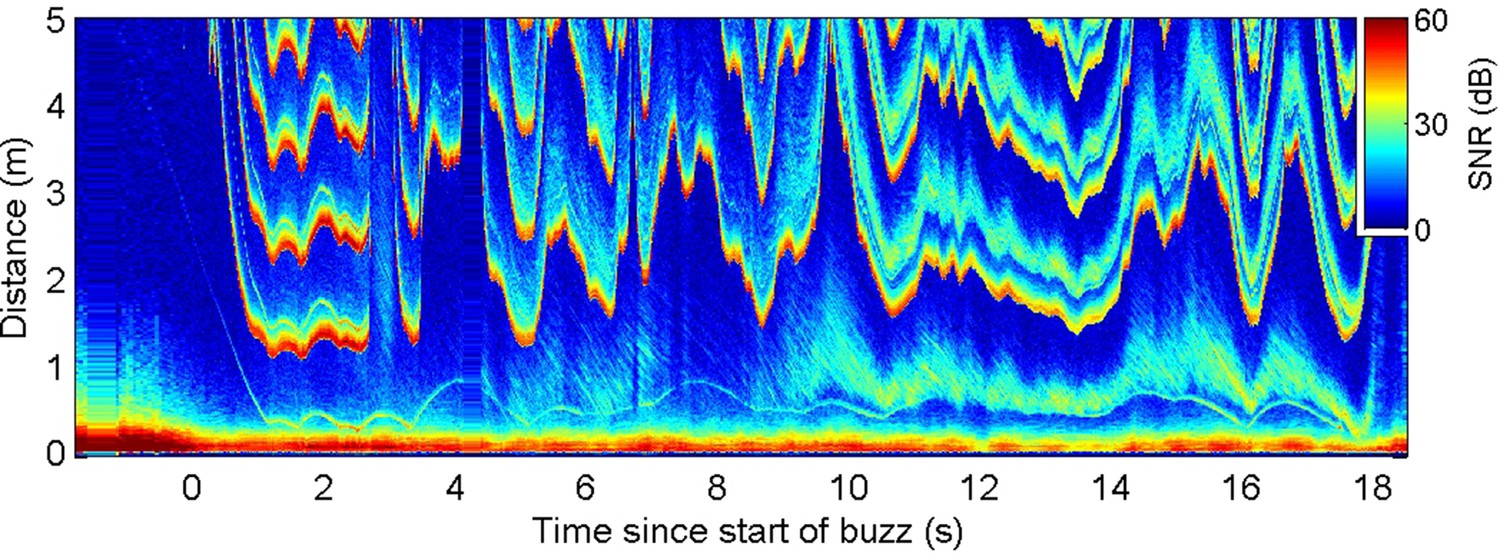
Echograms from a wild harbour porpoise (A) and a Blainville’s beaked whale (B) during close prey approaches (buzzes) show prey escape attempts (white arrows) and dynamics in inter-click interval (ICI, yellow arrows) that appear to be causally related.
These plots show echo strength (colour-coded by signal-to-noise ratio [SNR], in decibels [dB] as a function of distance from the predator [vertical axis] and time with respect to the start of the buzz [horizontal axis]). See Figure 2—figure supplements 1 and 2 for a guide to interpreting these plots. Boxplots below show the proportion of positive changes in ICI (δICI, i.e., an expansion of the acoustic depth of field) as a function of time before/after the first prey response in 74 buzzes by six harbour porpoises (C) and 36 buzzes by seven Blainville’s beaked whales (D). Due to differences in click repetition rate, 50 ms bins are used for harbour porpoise and 100 ms bins for Blainville’s beaked whales. Light grey boxes show the changes in ICI for randomised control data. * indicates bins in which >95% of observed proportions exceeded the randomised proportion of positive δICI for control data.
Figure 2—figure supplement 1
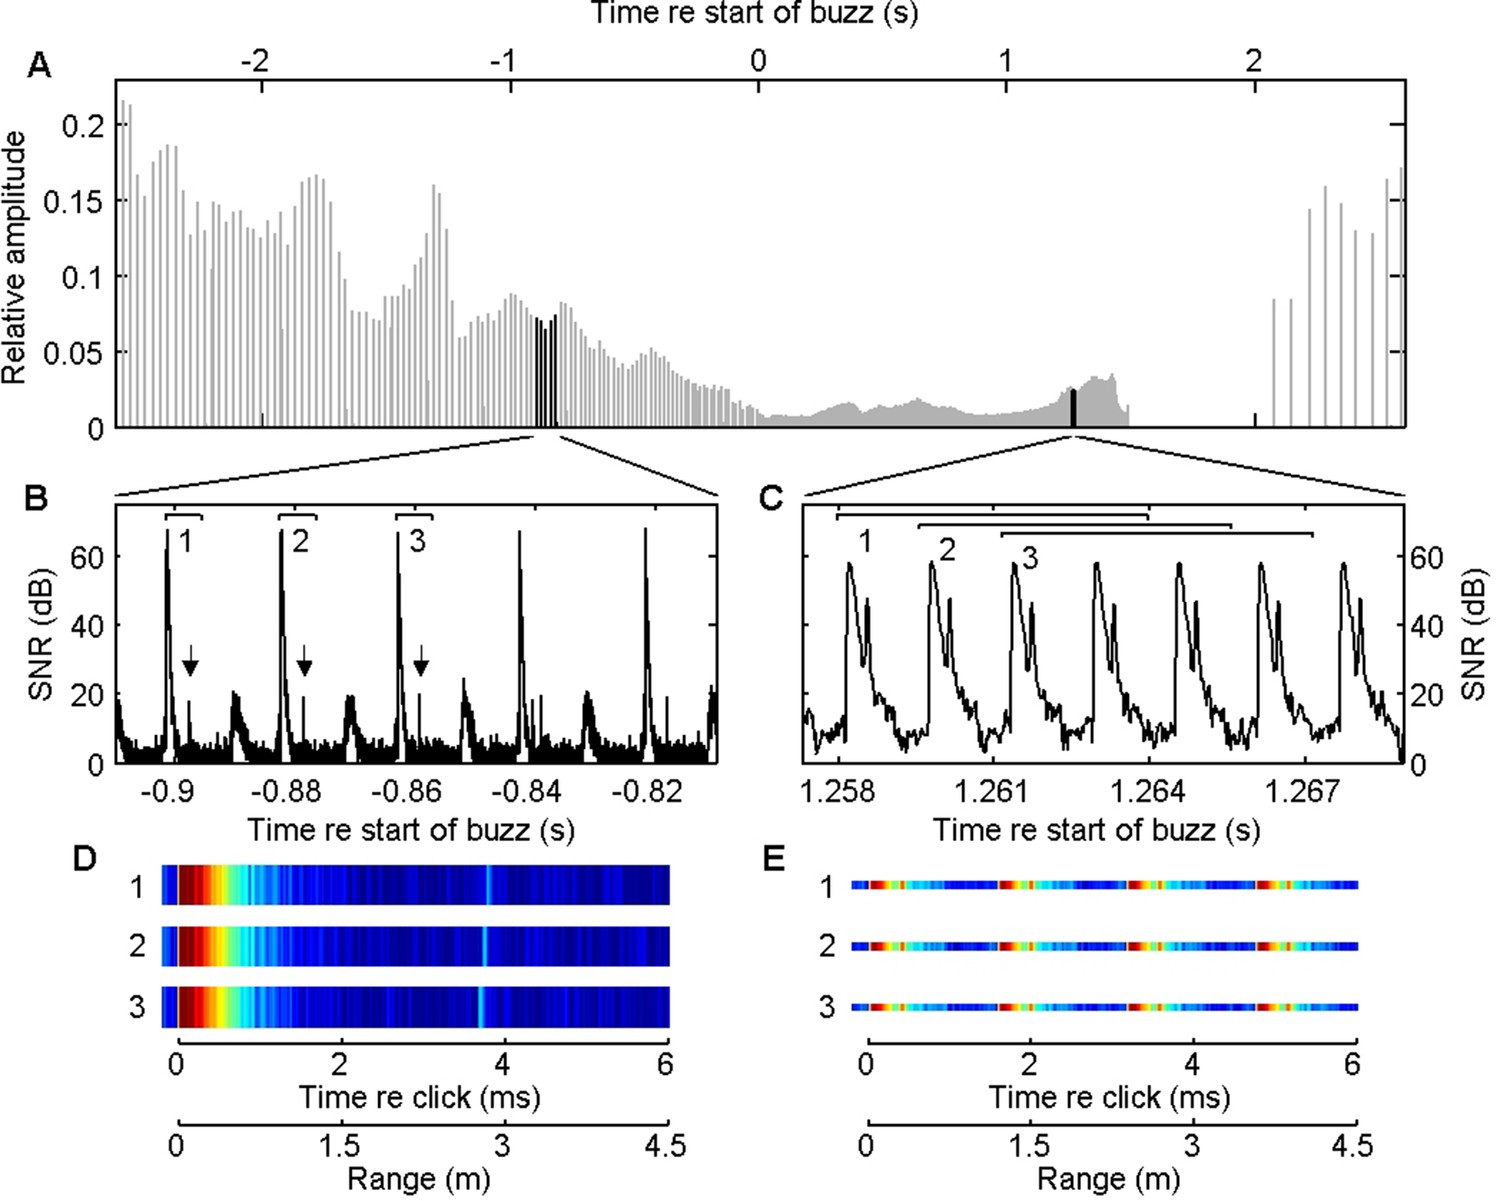
Generating an echogram from on-animal sound recordings involves several steps.
First foraging buzzes are located visually in spectrogram visualisations as rapid sequences of low-amplitude clicks. The sound data corresponding to each buzz is bandpass filtered to match the frequency range of the outgoing clicks and then the Hilbert envelope is computed (A). The timing of each click is determined using a threshold detector and a fixed interval of the envelope is extracted synchronised to each click (numbered brackets in B and C). To emphasise weak returning echoes, the logarithm of the envelope is used and the background noise level (inferred from the lowest envelope level) is subtracted to give a time series of signal-to-noise ratio (SNR) in decibels (B, C). The extracted SNR segments synchronised to each click are then represented as coloured bars (D, E). In this case, an interval of 6 ms following each click is shown. Echoes appear in these bars as light blue lines such as the one at 3.9 ms (the corresponding echoes are indicated by arrows in B). The target range corresponding to a given echo time delay can be computed by multiplying the time delay by the sound speed and dividing by 2 to account for the out and back travel. Finally, as the rate of clicking varies widely during buzzes, the width of each coloured bar is adjusted to match the time interval between successive clicks. This is done to produce an echogram that is indexed by elapsed time rather than click number. If the inter-click interval (ICI) is less than the interval length, multiple outgoing clicks will appear in each coloured bar (E). This results in a repeating pattern in the echogram that appears at multiples of the ICI × sound speed/2.
Figure 2—figure supplement 2
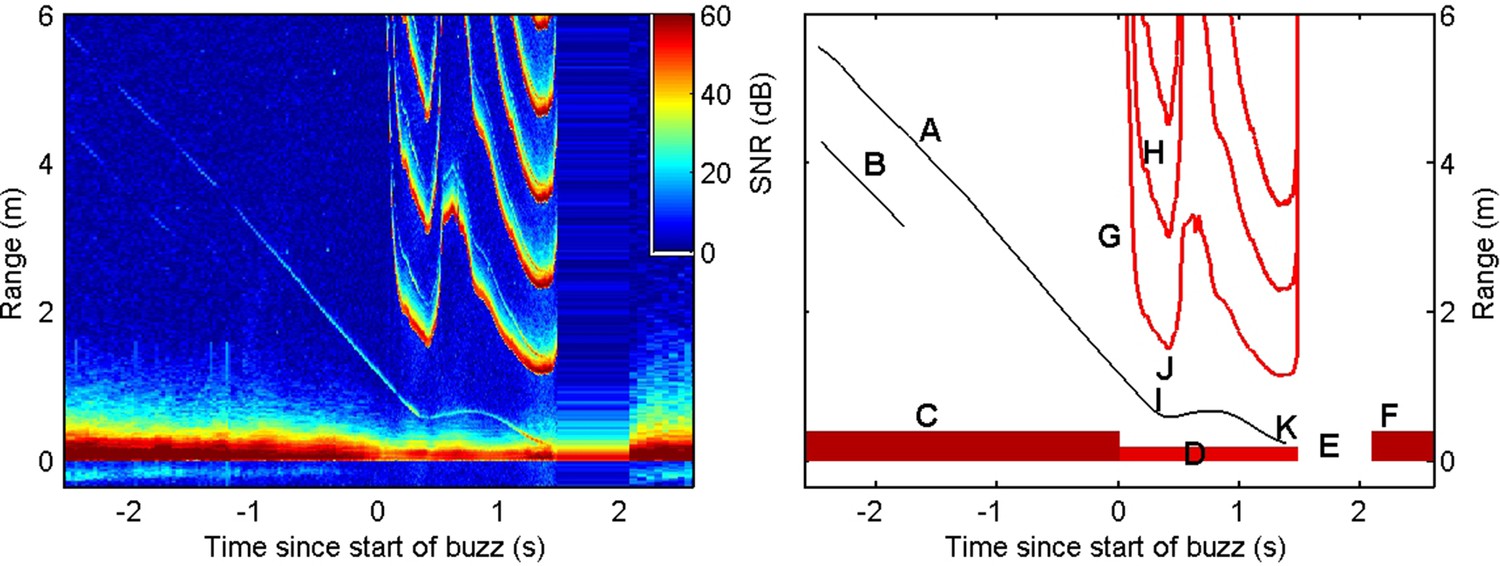
Individual coloured bars, generated following the process outlined in Figure 2—figure supplement 1 are stacked together and rotated by 90° to produce an echogram (left).
The resulting display has units of time on the horizontal axis and range in metres to potential echoic targets on the vertical axis. The colour of each pixel represents the instantaneous signal-to-noise ratio (SNR) of the received signal. Echograms require some practice to interpret, and the key features are indicated in the schematic representation on the right. Thin diagonal traces in the echogram (A, B) are echoes from small organisms in front of the porpoise. The slope of each echo trace indicates the closing speed (metres per second, a negative slope implies a positive closing speed). These organisms are likely initially moving slowly relative to the porpoise and so the closing speed is largely due to movement of the porpoise towards the targets. The high-intensity outgoing echolocation clicks (C) appear at distance 0 throughout the echogram and act as a reminder that the display represents a moving frame of view anchored to the porpoise. Clicks are produced at a rate of 10–50/s during searching and initial approach but a rapid acceleration in the clicking rate, termed a buzz, occurs during close approaches with prey (D). As per Johnson et al., 2006 and Wisniewska et al., 2012, rapid sequences of clicks are identified as foraging buzzes when the inter-click interval drops below 100 ms for beaked whales and 13 ms for harbour porpoise. In the example here, the buzz is followed by a short pause in clicking (E) before slower search clicking resumes (F). Due to the high speed of clicking during the buzz, outgoing clicks appear multiple times in the echogram (G, H) at spacings equal to the inter-click interval multiplied by one half of the sound speed. One of the echo traces from the organisms evident before the buzz (A) continues into the buzz and provides information about the movement of the organism (most likely a small fish) as it is targeted by the porpoise. The fish reacts to the porpoise’s approach at a distance of about 0.6 m (I) and attempts to escape as evidenced by a sharp change in the slope of the echo trace. Shortly thereafter the porpoise’s clicking rate suddenly begins decreasing (J) after a period of monotonic increase. This results in a V-shape in the repetition curves of the outgoing clicks (G). Although the prey can outswim the porpoise for a brief interval, leading to an increase in range between the porpoise and prey, it is ultimately overtaken and captured by the porpoise (K).
Figure 3
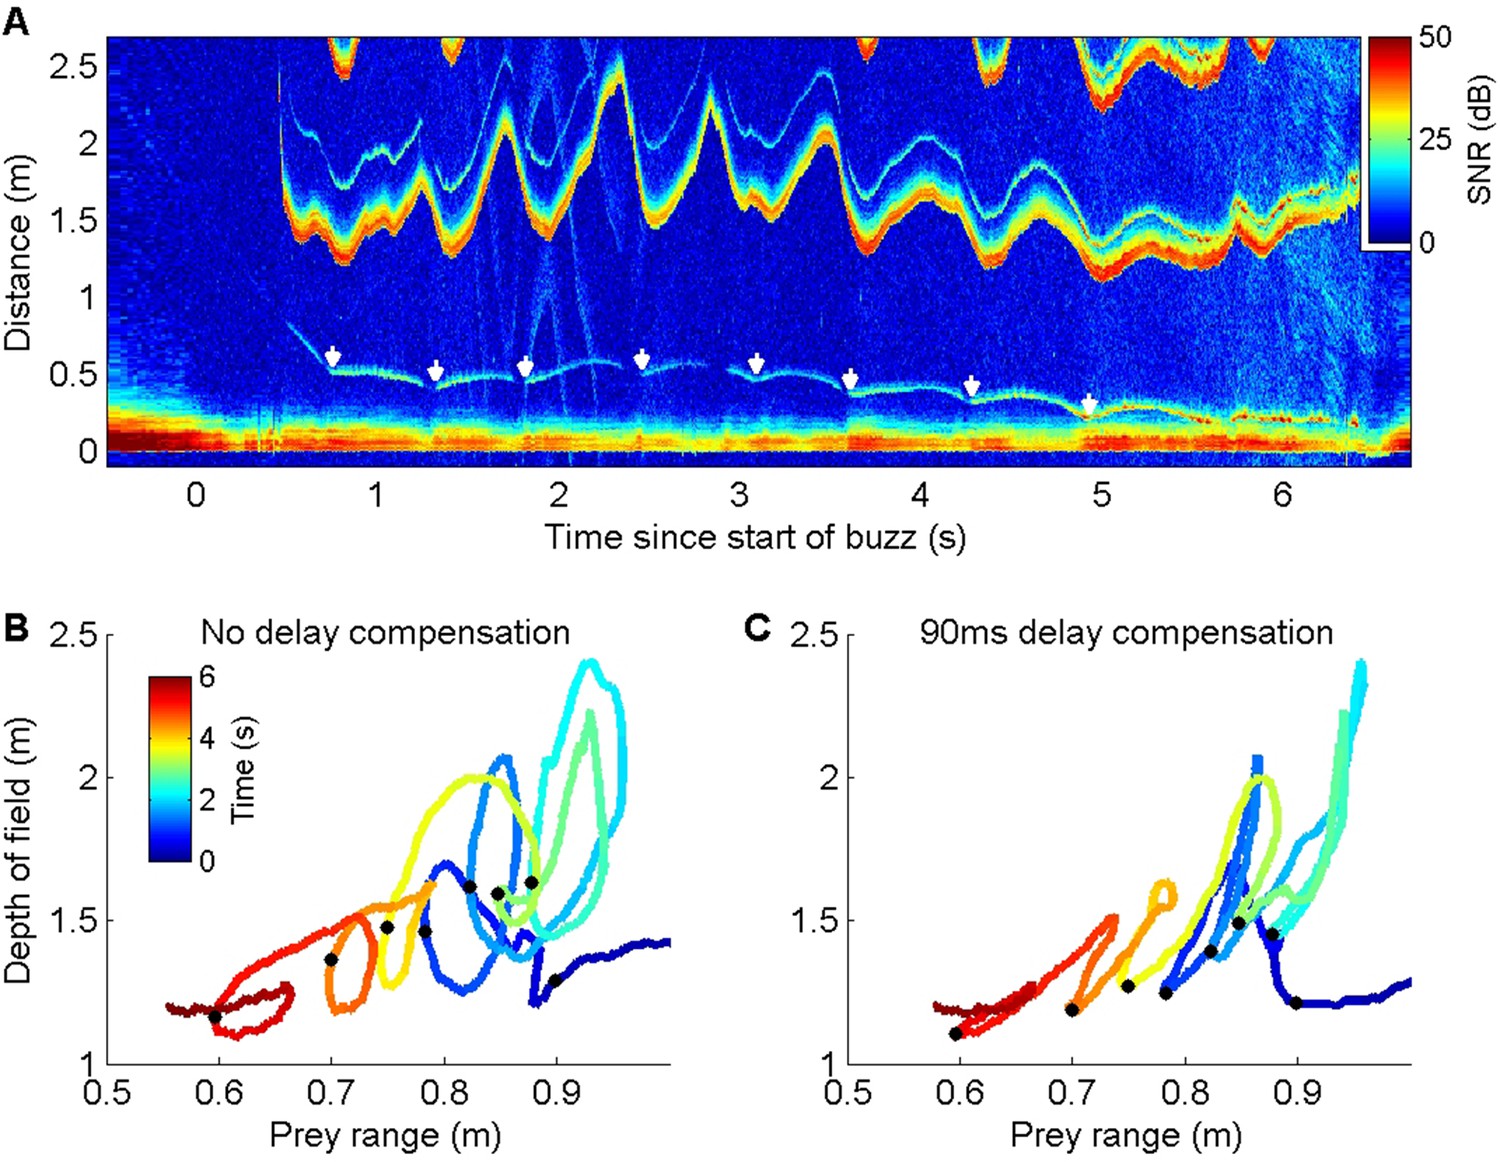
ICI responses of a wild harbour porpoise to repeated prey escape attempts.
(A) Echogram of a buzz performed by a wild harbour porpoise while chasing an elusive prey. The prey makes a series of escape attempts, marked with white arrows, and the inter-click interval (ICI) (the first yellow-red line above 1 m distance, here converted by the echogram scaling to the acoustic depth of field in metres, i.e., ICI × sound speed/2) varies cyclically with each prey movement. (B, C) Plots of prey range versus acoustic depth of field for the same echogram with the times of prey escapes indicated by black dots. Anti-clockwise loops in (B) indicate that ICI lags behind prey movements. Advancing the ICI by 90 ms flattens the loops (C), indicating that the ICI is consistently delayed by about this amount with respect to prey movements throughout the buzz.
Figure 4
Echogram during a buzz recorded from a wild harbour porpoise hunting near the seafloor.
Inter-click interval (ICI) adjustments (evidenced by the first yellow-red line in the plot at range >1 m) appear to respond to rapid changes in overall echo cross-section rather than the movements of the closest prey (e.g., at 9.5–10 s when the seafloor echo expands, due most likely to a change in orientation of the porpoise, while the prey trace stays at approximately the same range).
Figure 5

ICI and kinematic responses of two trained harbour porpoise approaching a moving target.
(A, B) Echograms recorded by tags attached to captive harbour porpoises Freja (A) and Sif (B) during controlled target movement trials are similar to echograms recorded during elusive prey captures by wild porpoises. The target echo in the echograms is the trace that moves suddenly outwards just after time 0. Other echo traces are from the water surface and from the target and water surface together (i.e., the sound reflects from the target and then the water surface, or vice versa, before returning to the porpoise). (C, D) Jerk magnitude, that is, the mechanical response of the porpoises, recorded by the tags and synchronised with the echograms.
Figure 6
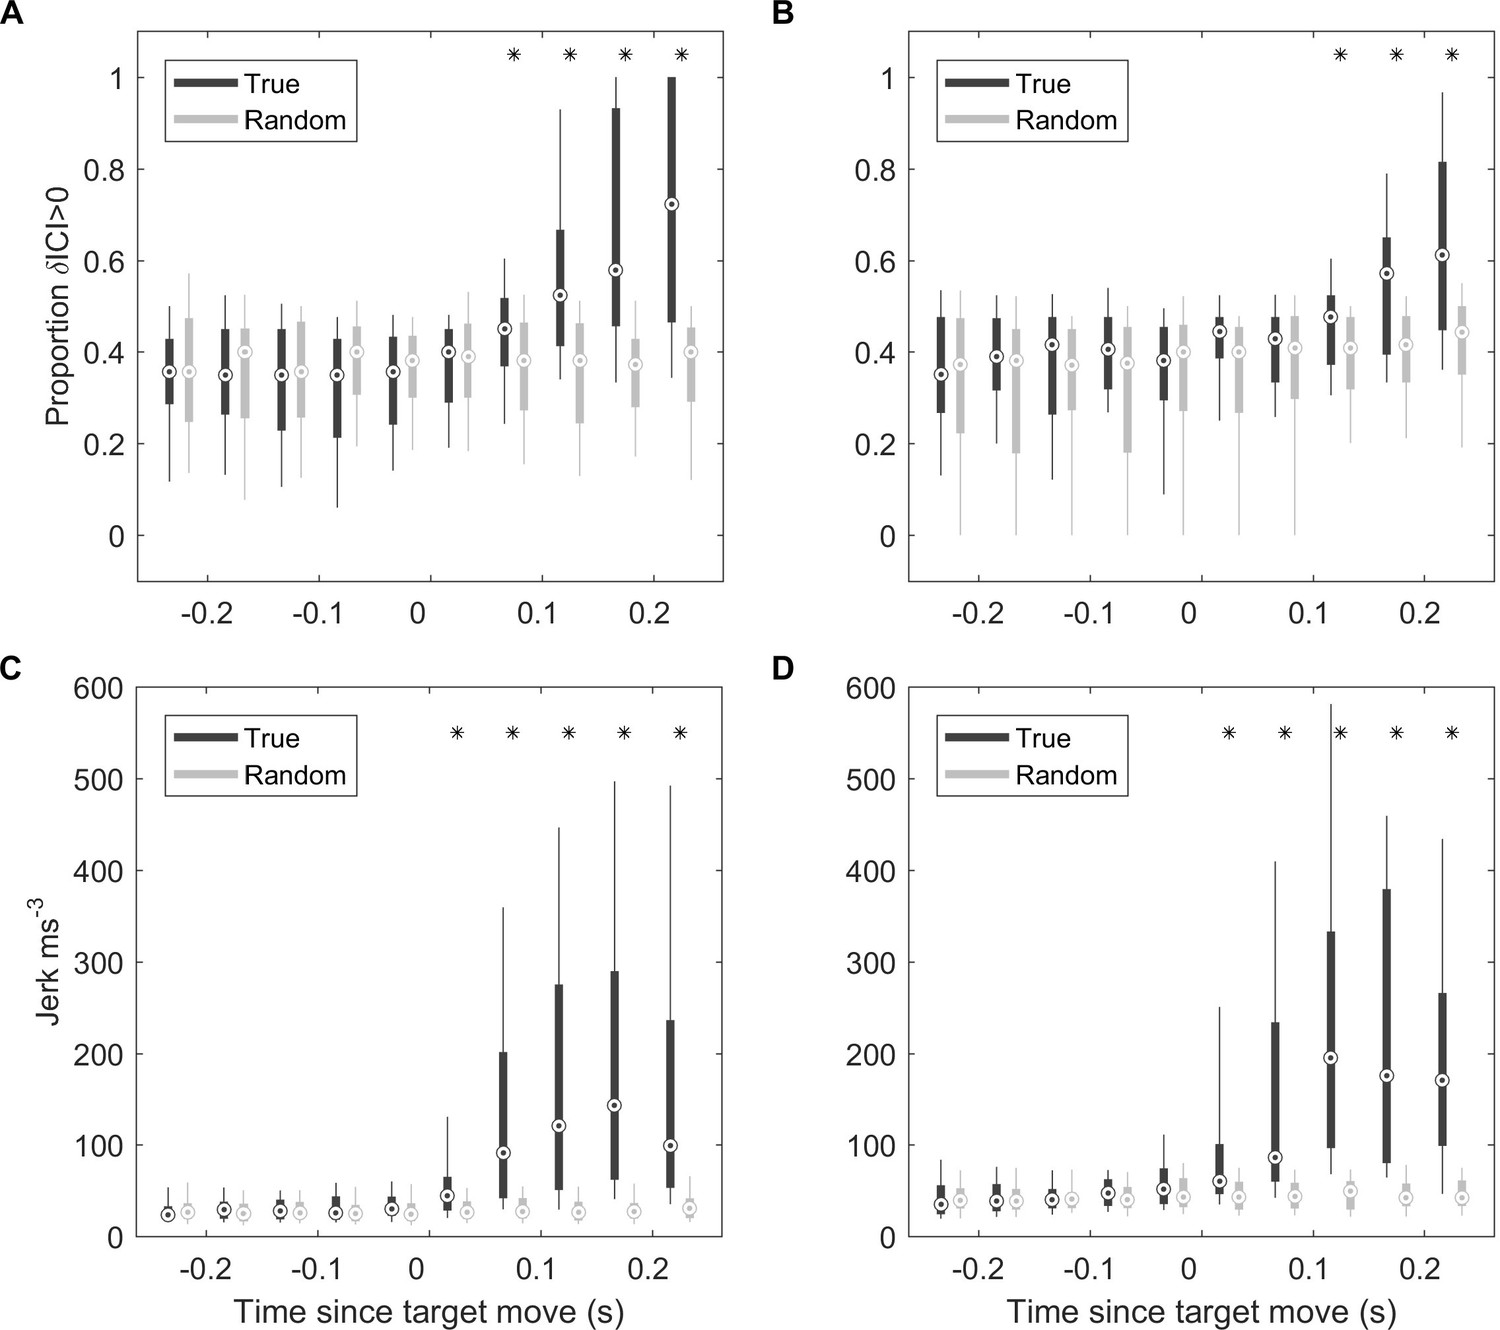
ICI and kinematic response latencies of two trained harbour porpoise during moving target trials.
(A, B) Boxplots of proportion of positive δICI (i.e., outward adjustments in the acoustic depth of field) in 50 ms bins synchronised to the start of the target movement for Freja (A) and Sif (B). Grey boxes indicate the results for control buzzes in which the target movement time was randomised. * indicates bins in which >95% of observed proportions exceeded the randomised proportion of positive δICI for control data. ICI: inter-click interval.(C, D) Boxplots of root-mean-square (RMS) jerk in 50 ms bins synchronised to the start of target movement for Freja (C) and Sif (D). Grey boxes indicate the results for control jerks in which the target movement time was randomised. * indicates bins in which >95% of observed jerks exceeded the randomised jerks.
Figure 7
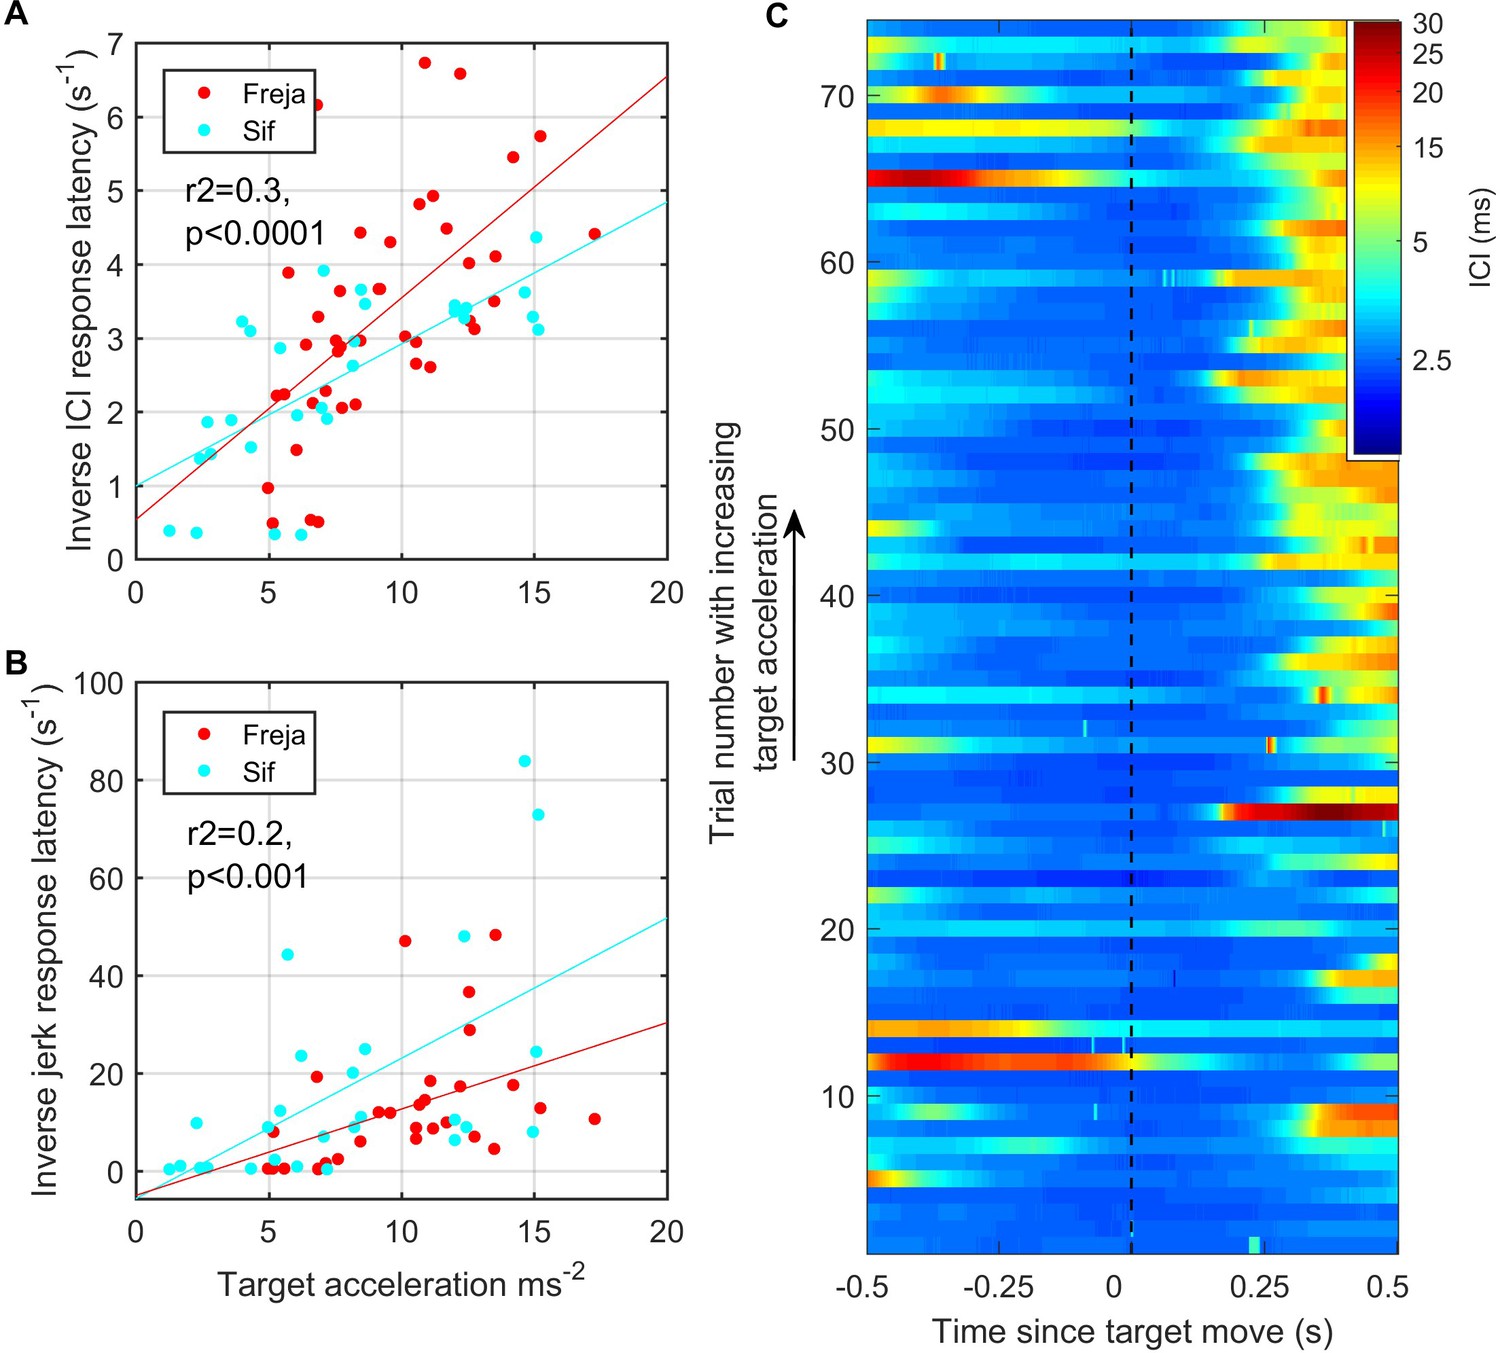
Fast target movements were associated with faster inter-click interval (ICI) and kinematic responses (A, B).
(A) shows the time delay between the start of target movement and the ICI exceeding 5 ms (corresponding to a depth of field greater than 3.75 m) for each trial for the two porpoises as a function of the root-mean-square (RMS) target acceleration. (B) shows the time delay from the start of target movement to a jerk exceeding 300 ms–3. The inverse latency is plotted in both cases to linearise the relationships for regression analysis. Reported regression results are for pooled data from Freja and Sif. (C) Stacked plot of ICI synchronised to the start of target movement for all analysed trials by Freja and Sif. Each horizontal line represents a single trial, and the colour indicates the ICI on a log scale. Trials are ordered in terms of increasing target acceleration such that trials at the top of the plot have the fastest initial target movement. ICI responses occur with shorter latency in these fast trials as compared to the trials with slower target movement at the bottom of the plot.
Additional files
Download links
A two-part list of links to download the article, or parts of the article, in various formats.
Downloads (link to download the article as PDF)
Open citations (links to open the citations from this article in various online reference manager services)
Cite this article (links to download the citations from this article in formats compatible with various reference manager tools)
Echolocating toothed whales use ultra-fast echo-kinetic responses to track evasive prey
eLife 10:e68825.
https://doi.org/10.7554/eLife.68825


