Using aquatic animals as partners to increase yield and maintain soil nitrogen in the paddy ecosystems
- College of Life Sciences, Zhejiang University, China
- Bioversity International, Italy
- Yunnan Academy of Agricultural Sciences, China
Figures
Figure 1

Yields of rice and aquatic animals (a), soil nitrogen content (b), and apparent N-use efficiency (c) in the field experiments.
In (a), rice yields are indicated by symbols and lines, and aquatic animal yields are indicated by bars. Values are means ± SE (n = 6).
-
Figure 1—source data 1
Related to data in Figure 1a–c.
- https://cdn.elifesciences.org/articles/73869/elife-73869-fig1-data1-v1.xlsx
Figure 2
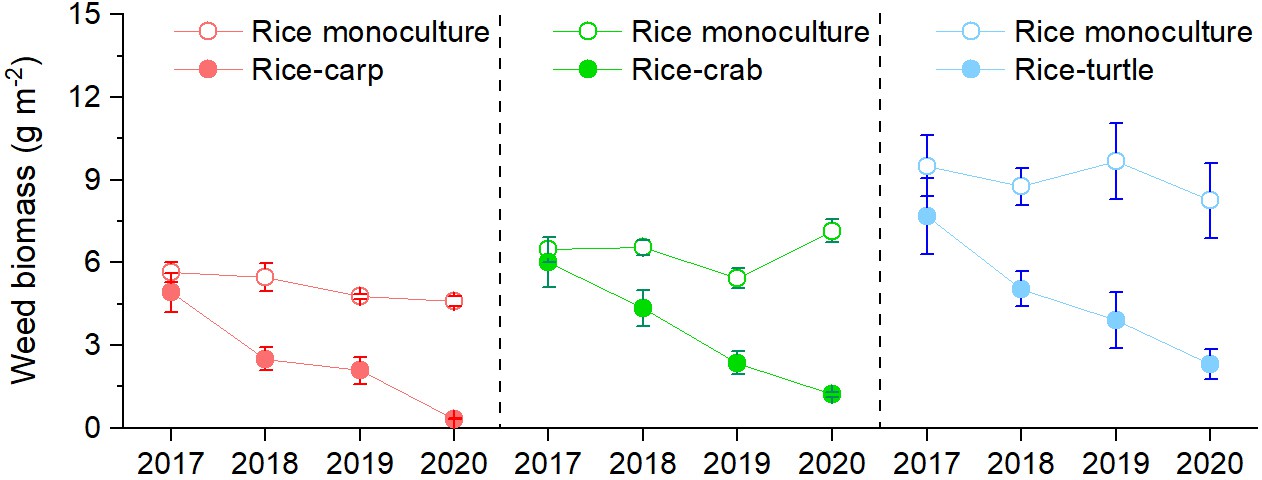
Weed biomass in the field experiments.
No herbicides were used in the experiment. Values are means ± SE (n = 6).
-
Figure 2—source data 1
Related to data in Figure 2.
- https://cdn.elifesciences.org/articles/73869/elife-73869-fig2-data1-v1.xlsx
Figure 3
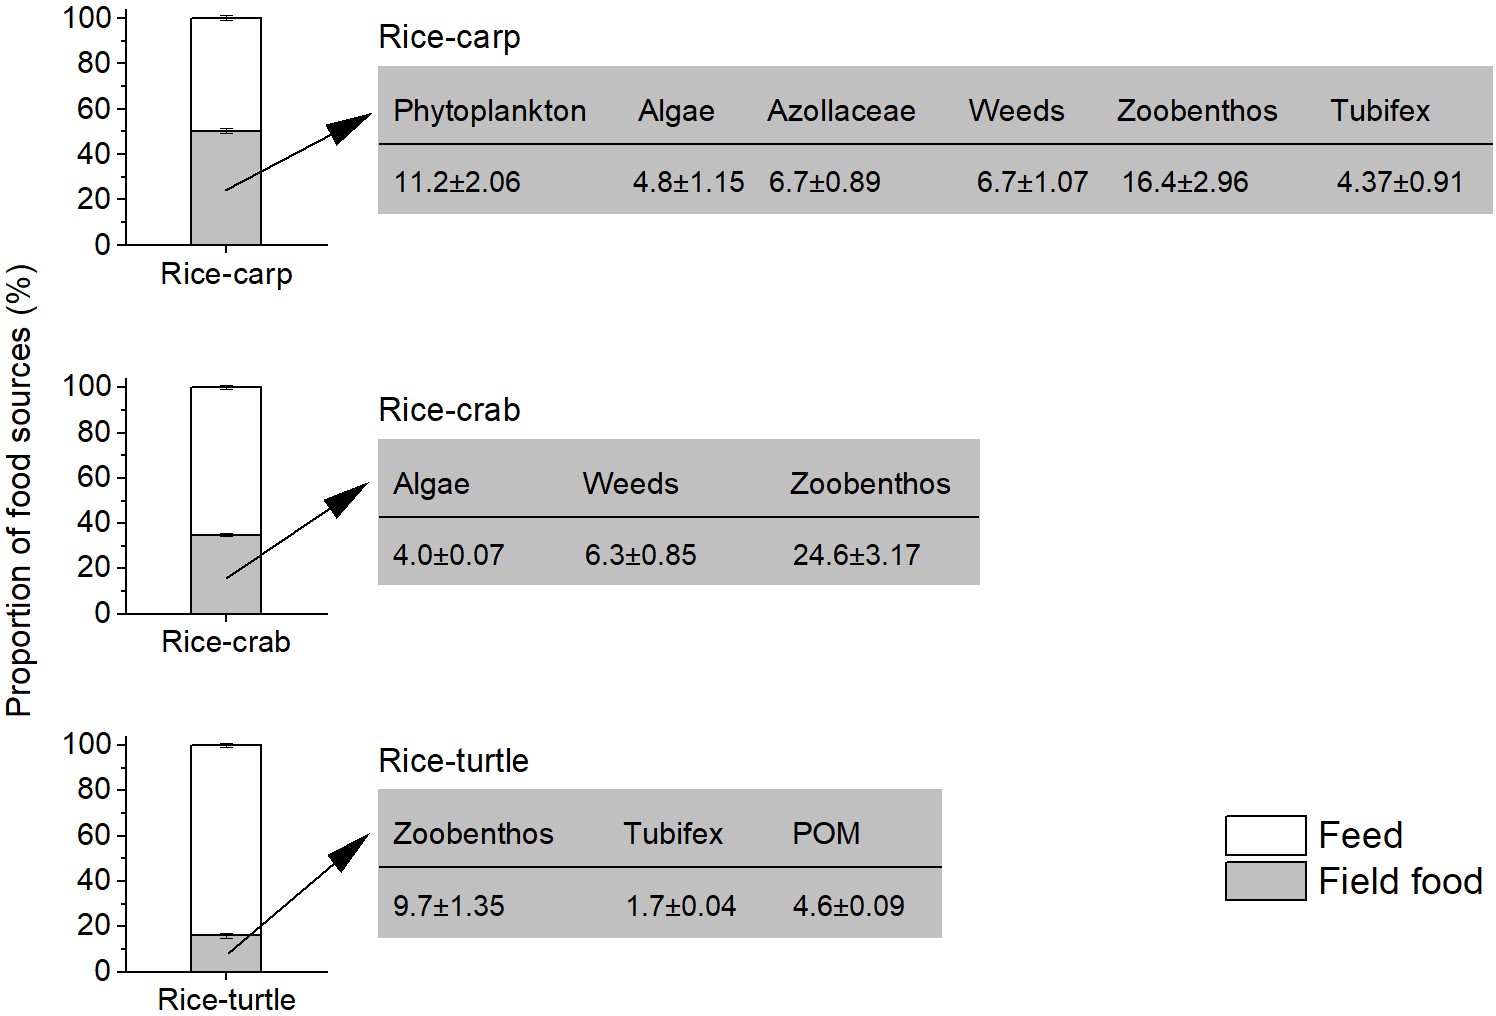
Diet components of aquatic animals as determined by dual stable isotopes (δ13C and δ15N), and the contribution of food sources to the aquatic animal diet in the field experiments.
In each of the three plots in the figure, the white zone represents the proportion of food that aquatic animals (i.e. carp, crabs, or turtles) obtained from feed, and the grey zone represents the percentage of food that aquatic animals obtained from the rice field. The values in the rectangles to the right indicate the rice field food components as percentages of the total food obtained by the aquatic animals. POM: particulate organic matter.
-
Figure 3—source data 1
Related to data in Figure 3.
- https://cdn.elifesciences.org/articles/73869/elife-73869-fig3-data1-v1.xlsx
Figure 4
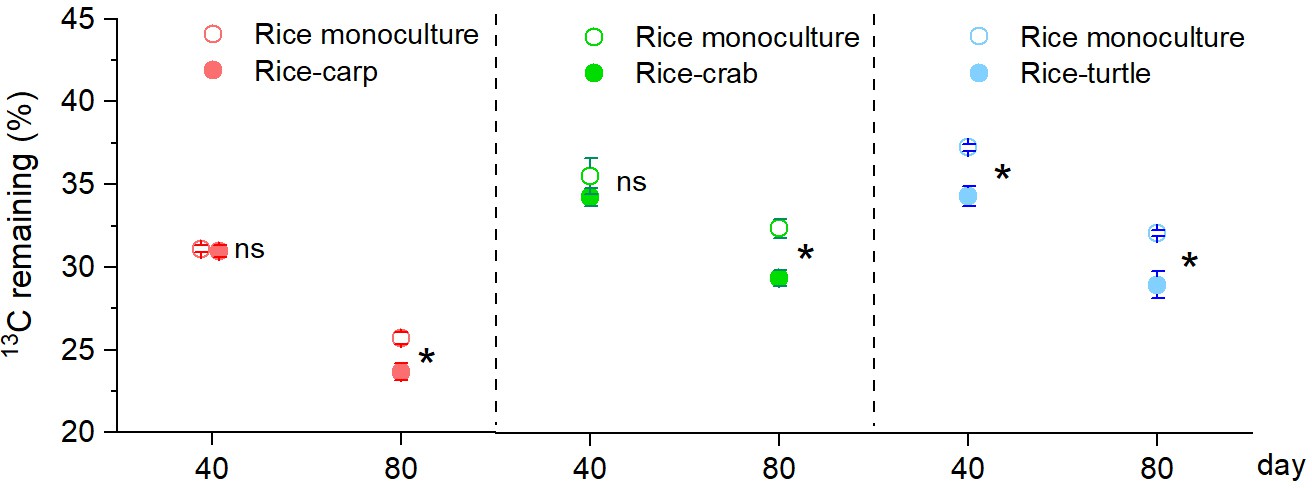
Organic matter decomposition in the field experiments at 40 and 80 days after the beginning (DAB) of the experiment.
A higher percentage of 13C remaining indicates slower decomposition. Values are means ± SE (n = 6). An asterisk indicates a significant difference between RM (rice monoculture) and RA (rice-aquatic animal coculture) at p < 0.05; ns indicates that the difference was not statistically significant.
-
Figure 4—source data 1
Related to data in Figure 4.
- https://cdn.elifesciences.org/articles/73869/elife-73869-fig4-data1-v1.xlsx
Figure 5
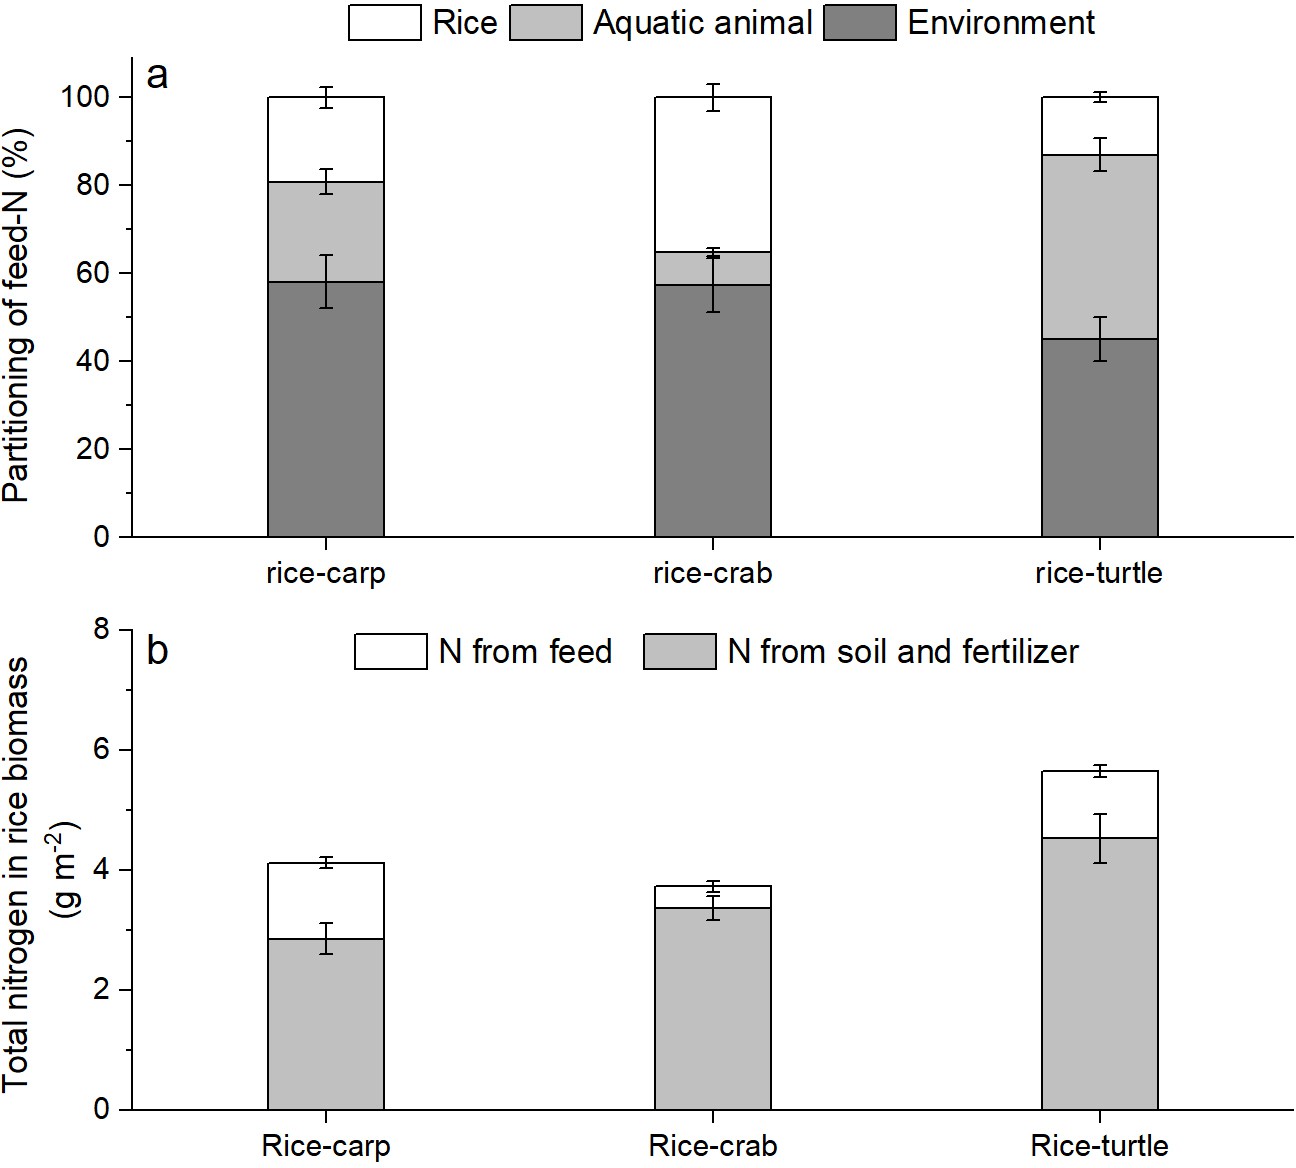
The fate of feed-N as determined by 15 N labeling in the mesocosm experiments.
(a) Percentages of feed-N in rice plants, aquatic animals, and the environment (e.g., soil and water). (b) Total N in rice biomass at the end of the experiments. Values are means ± SE (n = 6).
-
Figure 5—source data 1
Related to data in Figure 5a and b.
- https://cdn.elifesciences.org/articles/73869/elife-73869-fig5-data1-v1.xlsx
Figure 6
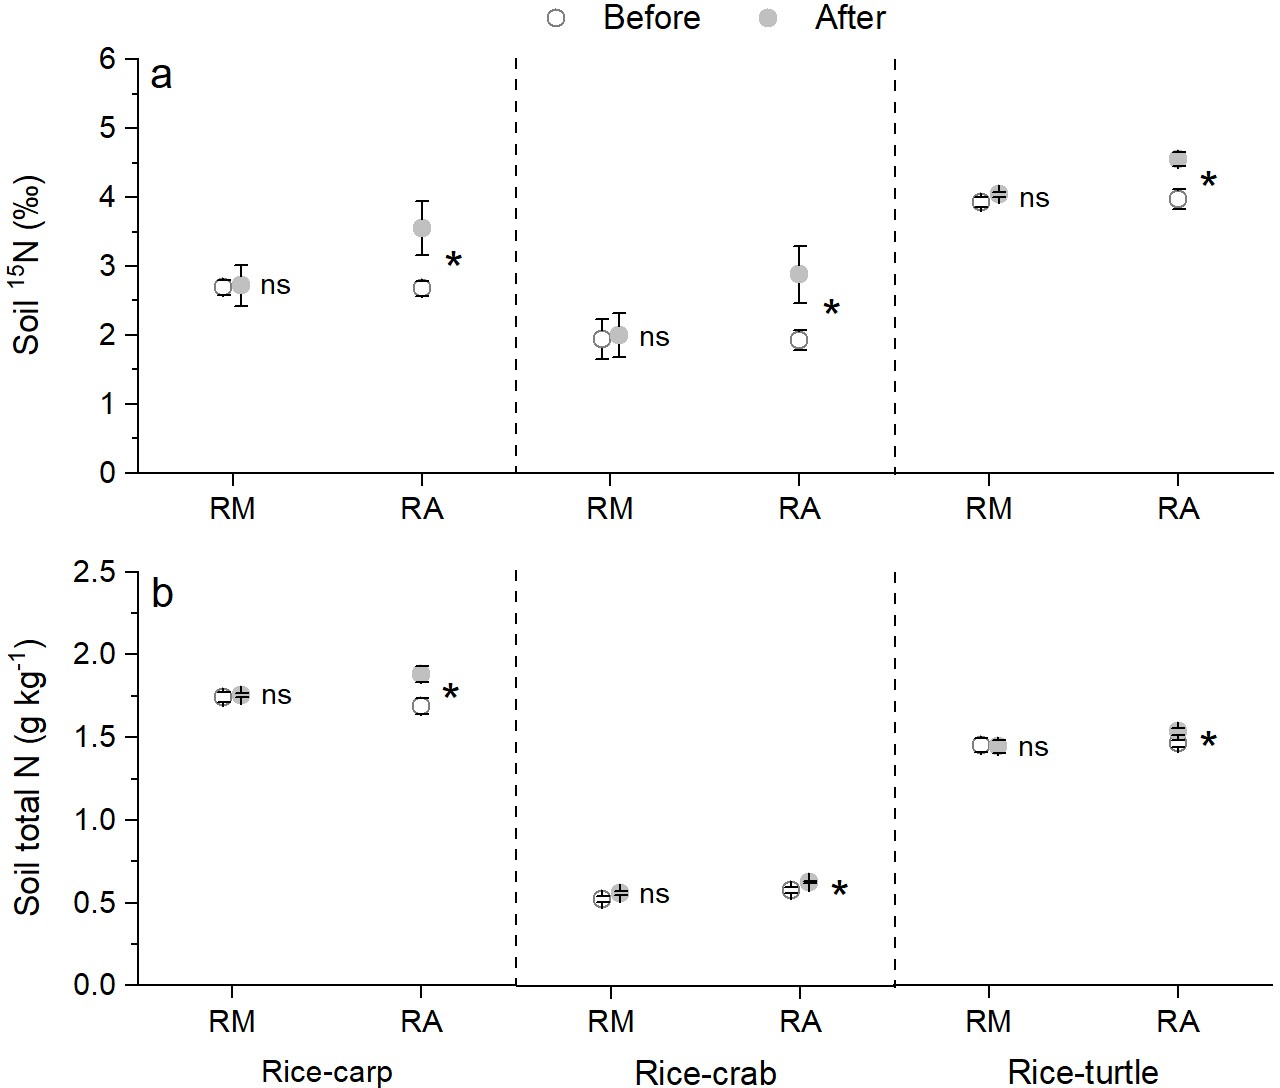
Soil δ15N content and total soil N content at the beginning vs the end of the mesocosm experiments.
(a) δ15N value in soil at the beginning and end of the mesocosm experiments. (b) Total N in soil at the beginning and end of the mesocosm experiments. Values are means ± SE (n = 6). An asterisk indicates a significant difference between the before and after values for each treatment in each rice-aquatic system at p < 0.05; ns indicates that the difference was not statistically significant.
-
Figure 6—source data 1
Related to data in Figure 6a and b.
- https://cdn.elifesciences.org/articles/73869/elife-73869-fig6-data1-v1.xlsx
Figure 7
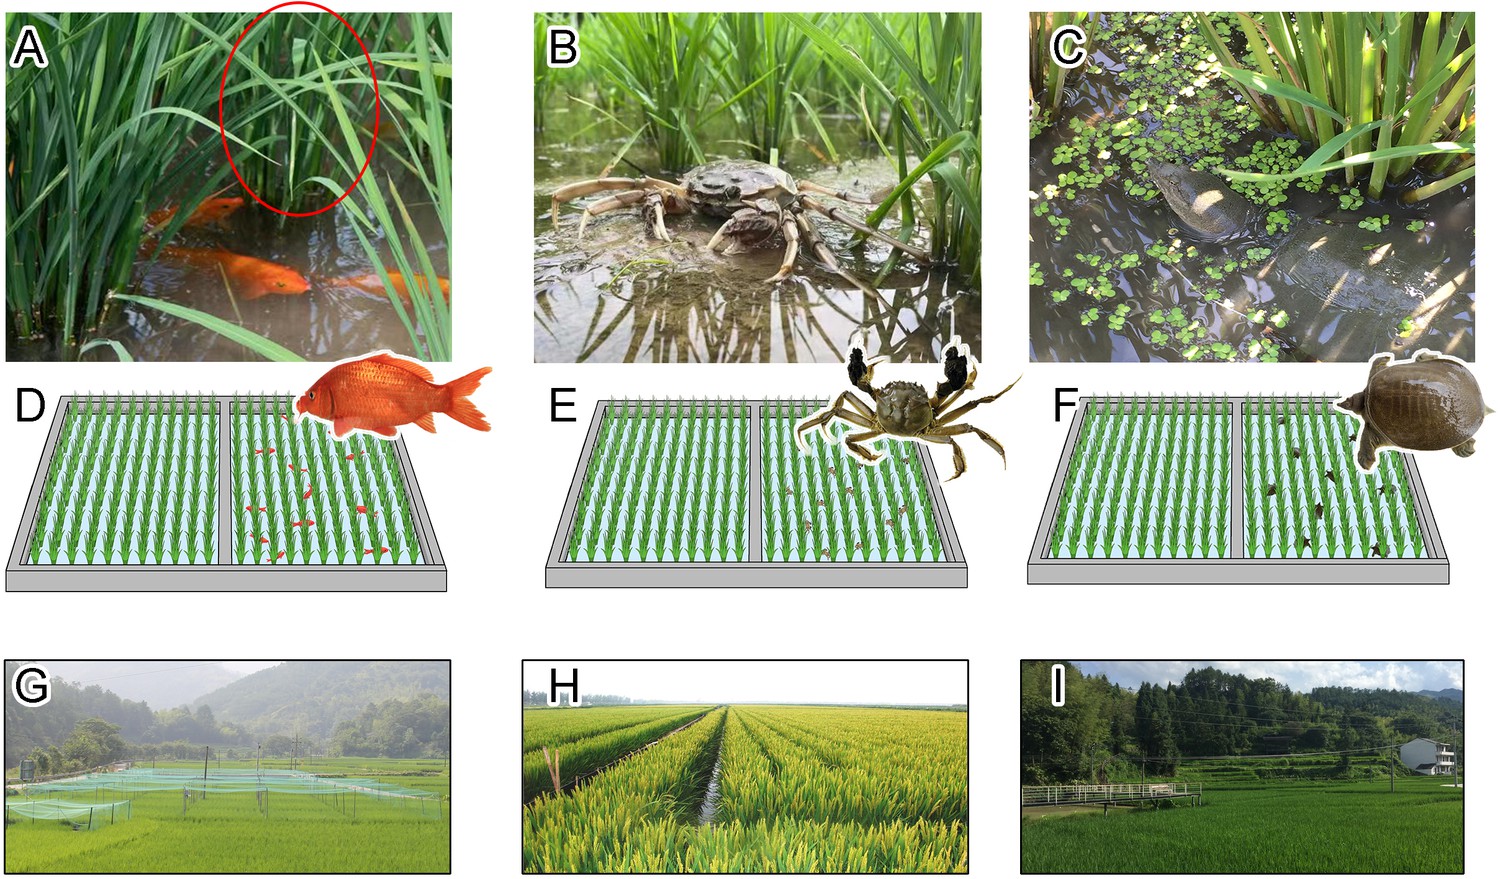
Illustration of the field experiments.
The rice plants and carp (A), crab (B), and turtle (C) were photographed in the corresponding experimental plots (D, E, and F), which were arranged in completely randomized blocks in three rice-planting areas in Qingtian County (G), Panshan County (H), and Deqing County (I), respectively. The red circle in A indicates a rice hill. Photos of A, B and C were taken by Lufeng Zhao, Zhiming Li and Genlian Wang, respectively.
Appendix 1—figure 1
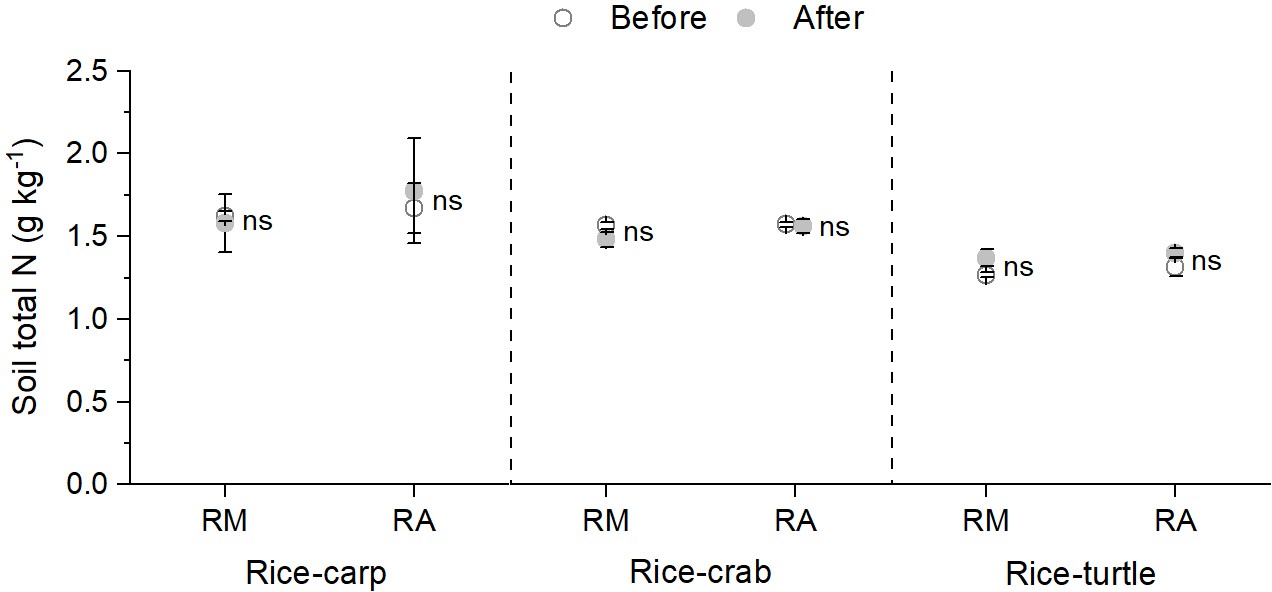
Total soil N content in rice monoculture (RM) and coculture treatments (RA) before and after the field experiments.
RM: rice monoculture; RA: rice coculture with an aquatic animal. Values are means ± SE (n = 6), ns indicates no significant difference between RM and RA (p > 0.05).
-
Appendix 1—figure 1—source data 1
Related to data in Appendix 1—figure 1.
- https://cdn.elifesciences.org/articles/73869/elife-73869-app1-fig1-data1-v1.xlsx
Appendix 1—figure 2
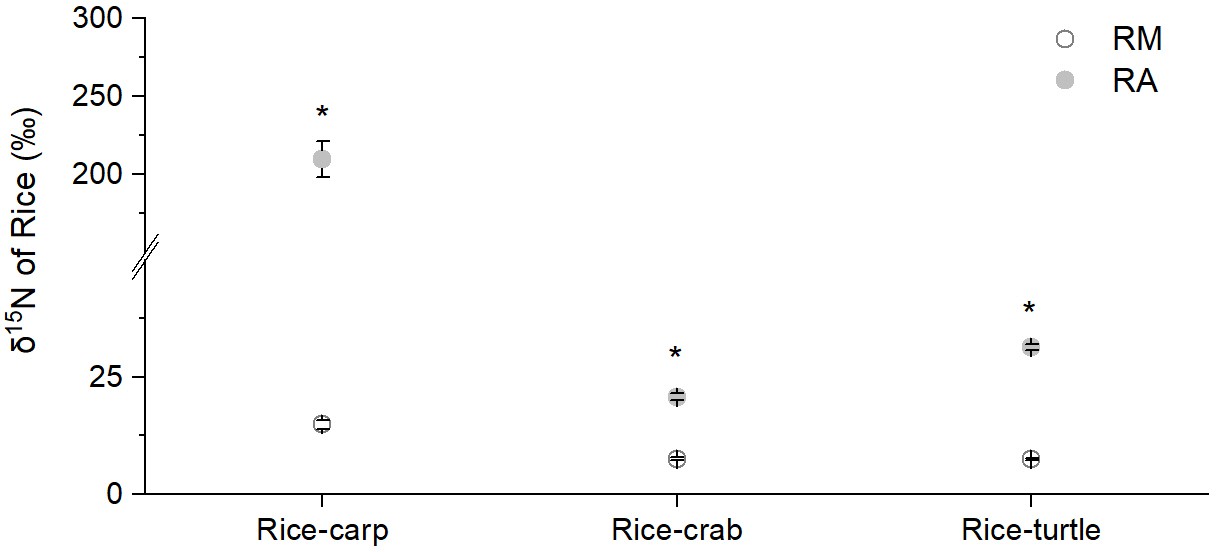
δ15N of rice shoots in rice monoculture (RM) and coculture treatments (RA) in the mesocosm experiments.
RM: rice monoculture; RA: rice coculture with an aquatic animal. Values are means ± SE (n = 6), * indicates a significant difference between RM and RA (p < 0.05).
-
Appendix 1—figure 2—source data 1
Related to data in Appendix 1—figure 2.
- https://cdn.elifesciences.org/articles/73869/elife-73869-app1-fig2-data1-v1.xlsx
Appendix 1—figure 3

Total soil P content in rice monoculture (RM) and coculture treatments (RA) before and after the field experiments.
RM: rice monoculture; RA: rice coculture with an aquatic animal. The P contents in soil were analyzed with a San++ Continuous Flow Analyzer (Skalar, Netherlands) after the air-dried soil samples were and digested by the K2SO4-CuSO4-Se method (Lu, 1999). For RM or RA plots, total P in the soil at the beginning and end of the experiment were compared by using paired t-tests (SPSS V.20.0, RRID: SCR_002865). Values are means ± SE (n = 6), ns indicates no significant difference between RM and RA (p > 0.05).
-
Appendix 1—figure 3—source data 1
Related to data in Appendix 1—figure 3.
- https://cdn.elifesciences.org/articles/73869/elife-73869-app1-fig3-data1-v1.xlsx
Tables
Appendix 2—table 1
Input of N and P into rice-animal coculture systems via feed and fertilizer application.
| System | Treatment | Nitrogen input (kg ha–1) | Phosphorus input (kg ha–1) | ||||||
|---|---|---|---|---|---|---|---|---|---|
| Feed | Fertilizer* | Feed | Fertilizer | ||||||
| Base fertilizer | Top-dress fertilizer | Total | Base fertilizer | Top-dress fertilizer | Total | ||||
| Rice-carp | RM | --- | 82.50 | 29.40 | 111.90 | --- | 36.02 | 5.31 | 41.33 |
| RA | 78.41 | 82.50 | --- | 82.50 | 19.63 | 36.02 | --- | 36.02 | |
| Rice-crab | RM | --- | 112.5 | 44.94 | 157.44 | --- | 49.12 | 11.79 | 60.91 |
| RA | 80.46 | 112.5 | --- | 112.50 | 20.62 | 49.12 | --- | 49.12 | |
| Rice-turtle | RM | --- | 82.5 | 44.94 | 127.44 | --- | 36.02 | 11.79 | 47.81 |
| RA | 105.46 | 82.5 | --- | 82.50 | 36.61 | 36.02 | --- | 36.02 | |
-
*
The total amount of feed-N and - P input were determined by multiplying the amount of feed by the percentage of N and P in feed that were analyzed with a San++ Continuous Flow Analyzer (Skalar, Netherlands) (Lu, 1999).
Appendix 2—table 2
The total P removed with the harvested products under rice monoculture and coculture in the field experiment.
Values are means ± SE (n = 6)
| System | Treatment | Rice grain*(kg ha–1) | Rice straw*(kg ha–1) | Aquatic animal*(kg ha–1) | Total(kg ha–1) | |
|---|---|---|---|---|---|---|
| Rice-carp | RM | 18.53 ± 0.92 | 5.49 ± 0.25 | --- | 24.02 ± 1.15 | |
| RA | 21.68 ± 0.50 | 6.44 ± 0.32 | 7.45 ± 0.95 | 35.57 ± 0.96 | ||
| Rice-crab | RM | 26.38 ± 1.53 | 8.60 ± 0.67 | --- | 34.98 ± 1.87 | |
| RA | 34.74 ± 2.19 | 13.67 ± 1.04 | 1.07 ± 0.15 | 49.48 ± 2.79 | ||
| Rice-turtle | RM | 19.57 ± 0.72 | 12.64 ± 0.44 | --- | 32.21 ± 0.42 | |
| RA | 24.19 ± 1.17 | 17.19 ± 0.69 | 20.66 ± 1.47 | 62.04 ± 2.60 | ||
-
*
The total amount of P contained in the grain and straw of rice plants, and in the aquatic animals were determined by multiplying the biomass of rice (grain and straw) and aquatic animals by the percentage of P in rice and aquatic animals that were analyzed with a San++ Continuous Flow Analyzer (Skalar, Netherlands) (Lu, 1999).
Appendix 2—table 3
Properties of original feed and 15N-labeled feed for the three field experiments.
The original feed (in which most N was supplied by soybean powder) was supplemented with 15N-labeled soybean powder to obtain 15N-labeled feed.
| Experiment | Original feed | 15N-labeled soybean powder | 15N-labeled feed | % of labeled soybean powder in the 15N-labeled feed | |||
|---|---|---|---|---|---|---|---|
| N% | δ15N | N% | δ15N | N% | δ15N | ||
| Rice-carp | 5.58 | 1.73 | 6.61 | 1,539 | 5.25 | 649 | 33 |
| Rice-turtle | 8.21 | 8.41 | 6.98 | 445 | 7.54 | 128 | 30 |
| Rice-crab | 5.94 | 1.19 | 6.98 | 445 | 7.27 | 145 | 33 |
Appendix 5—table 1
Initial δ13C contents in materials used to test the decomposition rate in the three field experiments.
| Experiment | C (%) | δ13C | 13C (mg) |
|---|---|---|---|
| rice-carp | 0.41 | –16.21 | 2.18 |
| rice-crab | 0.44 | –16.24 | 2.39 |
| rice-turtle | 0.43 | –15.62 | 2.33 |
Additional files
-
Transparent reporting form
- https://cdn.elifesciences.org/articles/73869/elife-73869-transrepform1-v1.docx
-
Appendix 1—figure 1—source data 1
Related to data in Appendix 1—figure 1.
- https://cdn.elifesciences.org/articles/73869/elife-73869-app1-fig1-data1-v1.xlsx
-
Appendix 1—figure 2—source data 1
Related to data in Appendix 1—figure 2.
- https://cdn.elifesciences.org/articles/73869/elife-73869-app1-fig2-data1-v1.xlsx
-
Appendix 1—figure 3—source data 1
Related to data in Appendix 1—figure 3.
- https://cdn.elifesciences.org/articles/73869/elife-73869-app1-fig3-data1-v1.xlsx
Download links
A two-part list of links to download the article, or parts of the article, in various formats.
Downloads (link to download the article as PDF)
Open citations (links to open the citations from this article in various online reference manager services)
Cite this article (links to download the citations from this article in formats compatible with various reference manager tools)
Using aquatic animals as partners to increase yield and maintain soil nitrogen in the paddy ecosystems
eLife 11:e73869.
https://doi.org/10.7554/eLife.73869


