Regional opportunities for tundra conservation in the next 1000 years
- Alfred Wegener Institute Helmholtz Centre for Polar and Marine Research, Germany
- Institute of Environmental Sciences 6 and Geography, University of Potsdam, Germany
- Institute of 7 Biochemistry and Biology, University of Potsdam, Germany
Figures
Figure 1
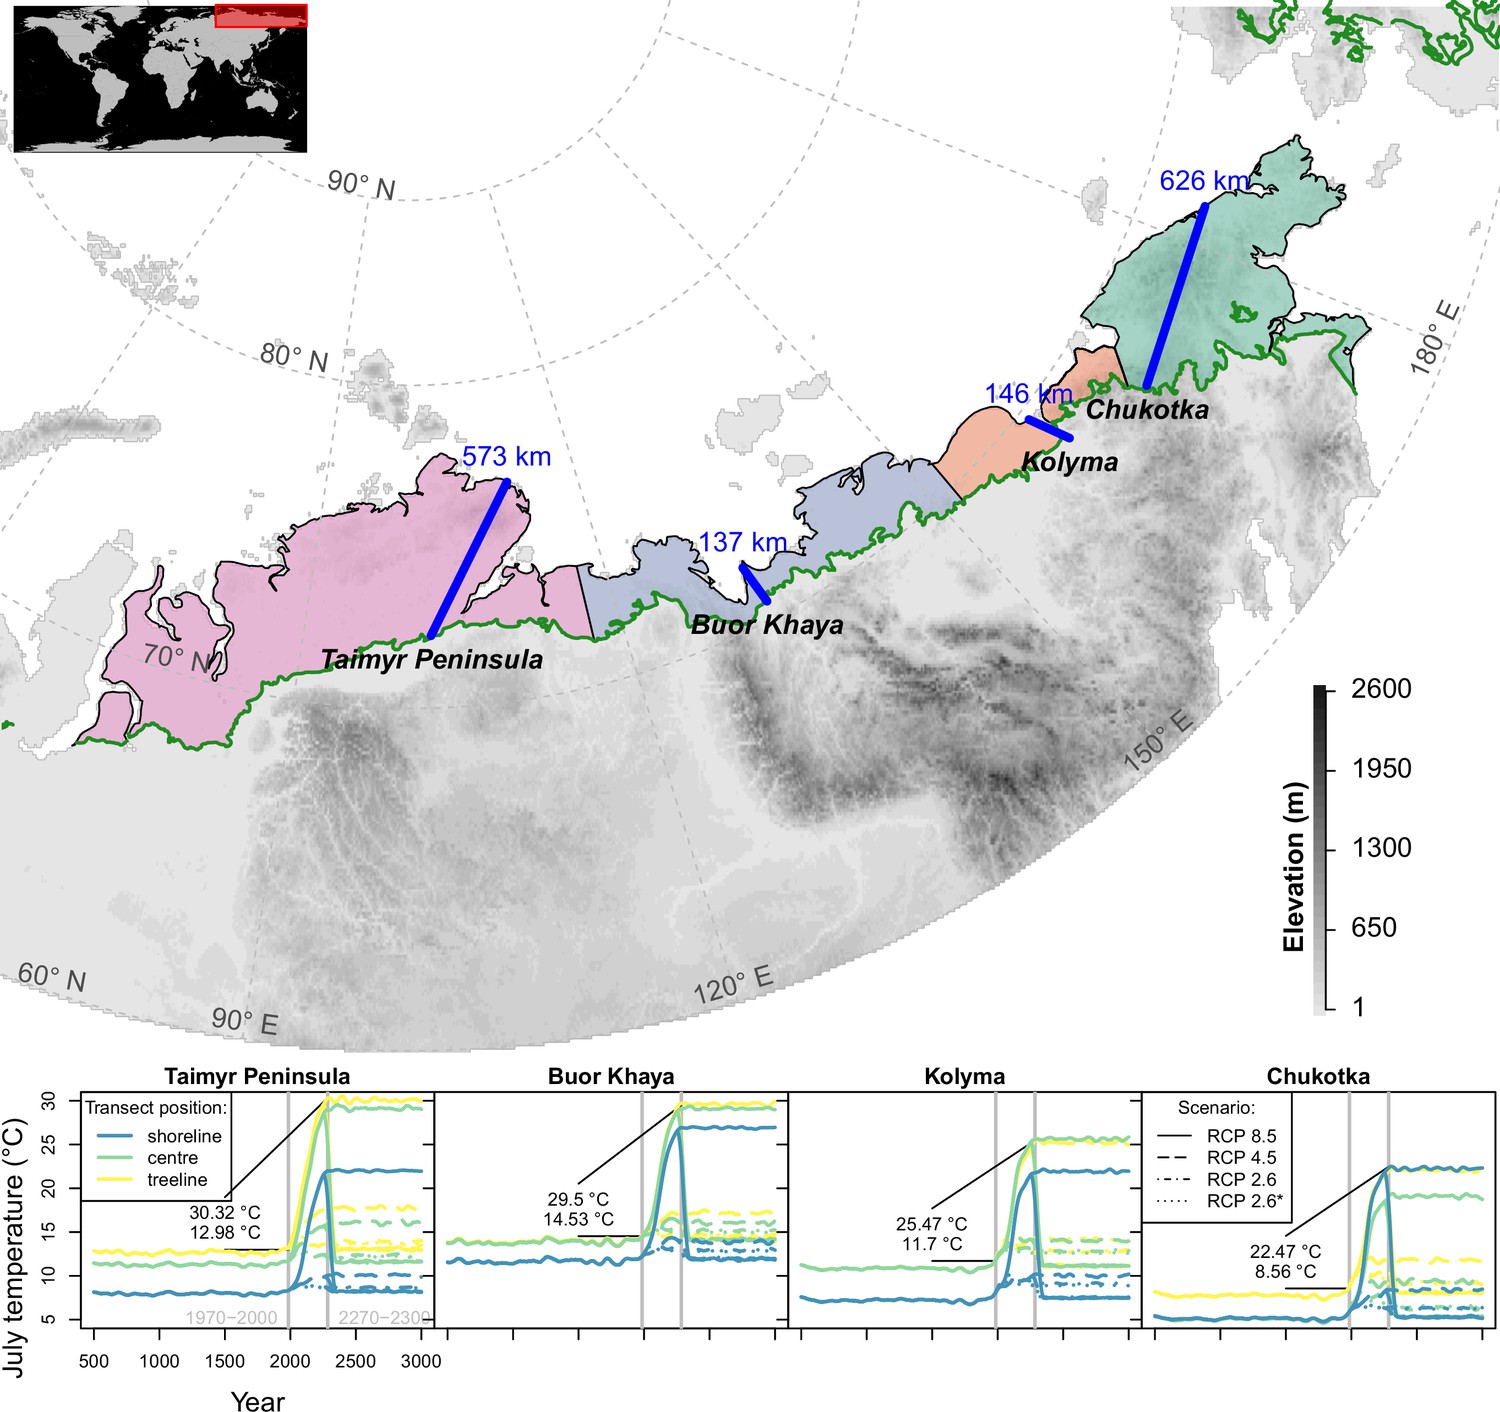
Transects (blue lines) were placed starting in the treeline at field sites and extending to the shoreline of the Arctic Ocean (map); only tundra areas above the treeline (Walker et al., 2005) are considered.
The land area was grouped into four regions equidistantly separated between the transects (lower plot) and plots show climate forcing for 501–3000 CE based on relative concentration pathway (RCP) scenarios in these regions at the extremes and middle part of the transects; numbers give mean values for modern and future strongest warming under RCP 8.5. Map projection: Albers Equal Area.
Figure 2
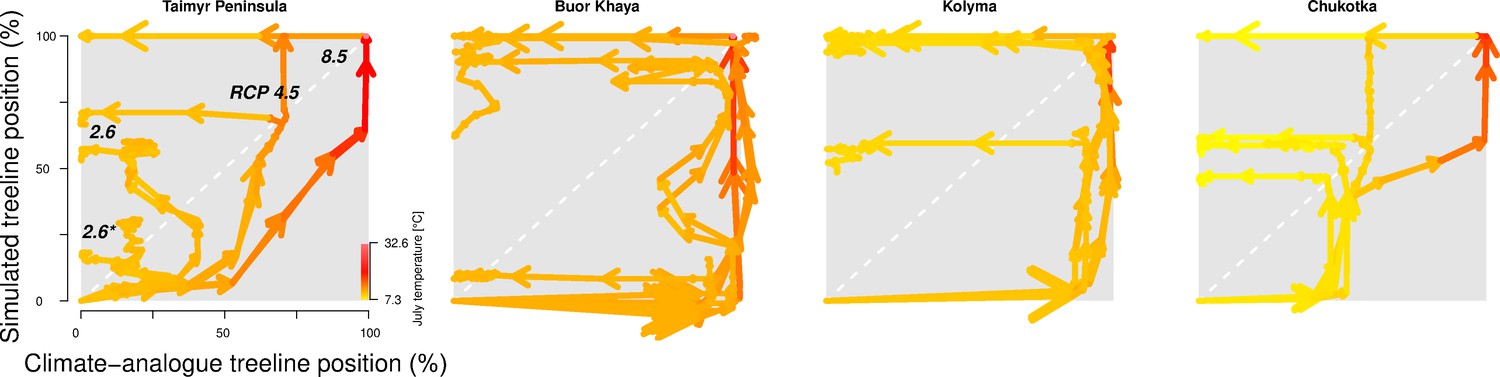
The trajectory of the simulated treeline position relative to its current position and the maximum at the shoreline versus its climate-analogue position for the four regions shows a migration lag of the treeline during the first centuries (each line segment represents 25 years and the length of the arrow head corresponds to the step length) until the simulated treeline is limited by climate.
Forests expand their area further and infilling proceeds when climate conditions cool and even overshoot in the long run with cooling back to 20th-century temperatures. The diagonal is where climate and the treeline are in equilibrium; below the diagonal, tree migration lags climate; above the diagonal is ‘overshooting’ and reaching locations actual climate would allow. For each relative concentration pathway (RCP) scenario, two are presented, one for the scenario as-is and the second for the cooling; scenario RCP 2.6* warms only at half the rate of RCP 2.6. See also Appendix 3—figure 1 for the year when the trajectory passes the equilibrium.
Figure 3 with 1 supplement

Forest position and tundra area at year 3000 CE for different climate mitigation scenarios and under potential cooling back to 20th-century temperatures after peak temperatures have been reached.
The area of tundra changes over time and can only partly recover when temperatures cool and forests recede (plots next of the maps show years 2000–3000 CE). Only tundra areas above the treeline (Walker et al., 2005) are considered. Map projection: Albers Equal Area.
Figure 3—video 1
The development of the forest position and tundra area can be seen in a video supplement presenting the state in 10-year steps.
Figure 4
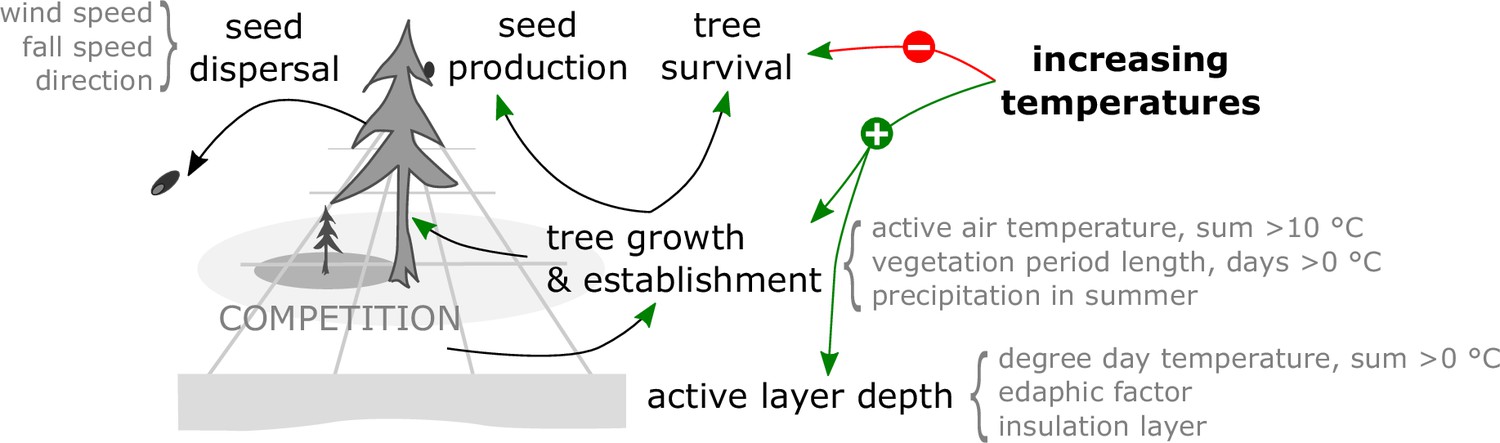
The model LAVESI invokes in each yearly time step processes to individually handle seeds and represent the full life cycle of simulated trees, leading to forest stand dynamics.
The climate environment drives establishment, growth, and mortality.
Appendix 1—figure 1
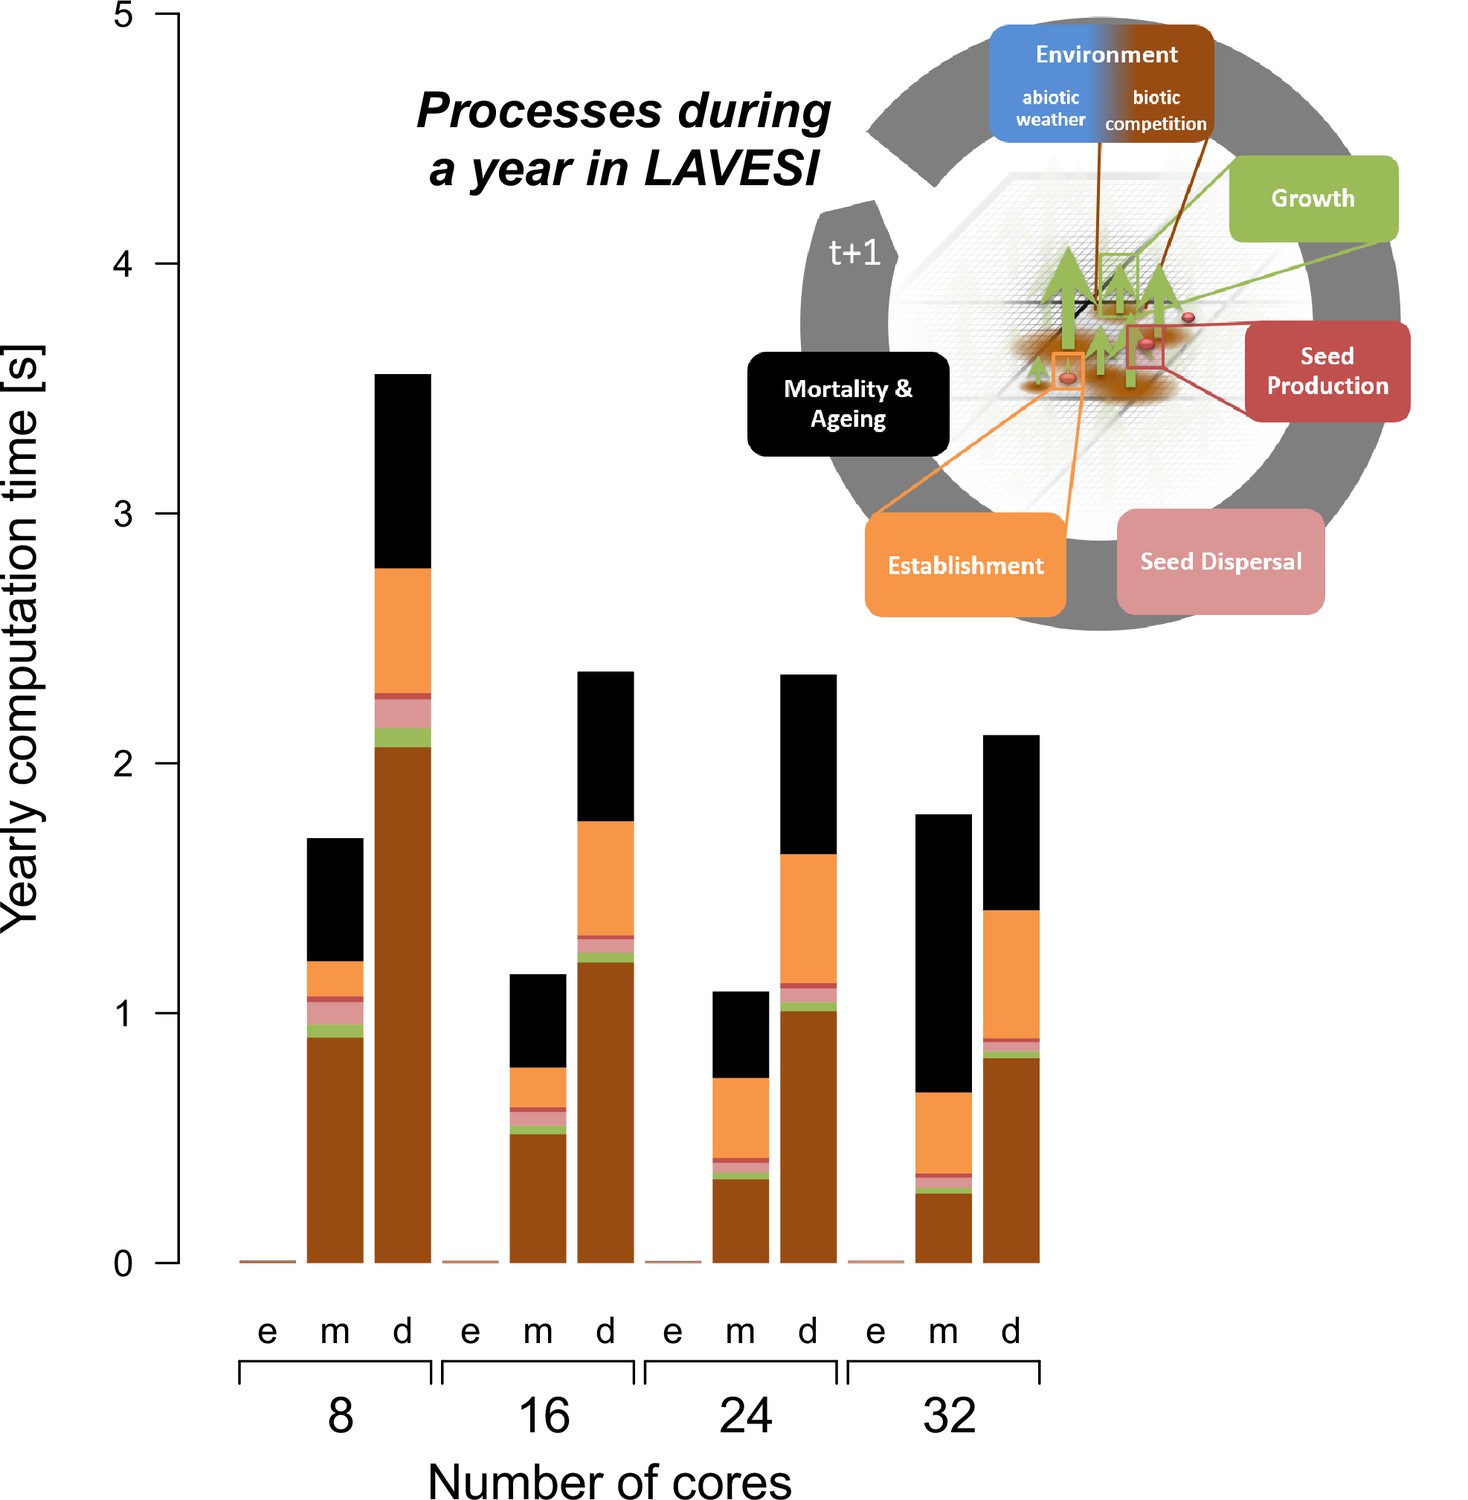
The computation speed increases with the number of available threads and reaches a plateau caused by overheads.
The processes of LAVESI scale differently and the process Environment is computationally the heaviest and thus relatively faster with more cores while processes such as Mortality show no clear benefit of more threads. Data were aggregated for 100 years at three different population dynamics stages: e, empty; m, mature old growth; d, densification.
Appendix 2—figure 1
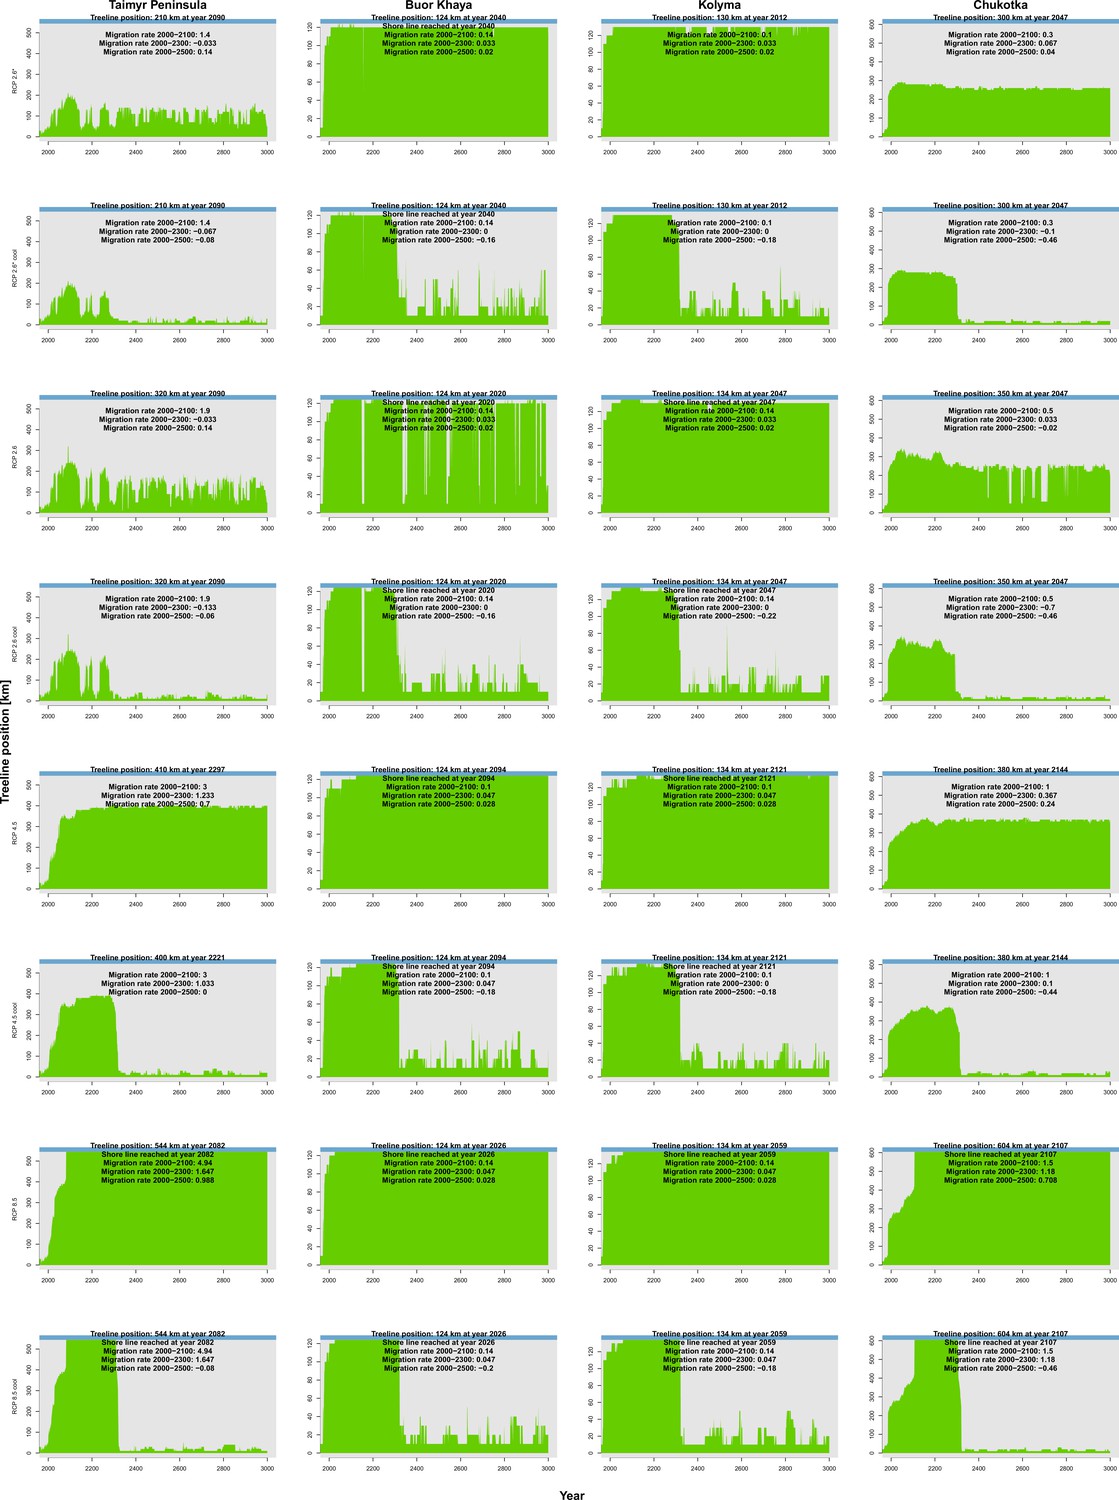
Climate-analogue treeline position along the four transects (columns) based on extrapolated July temperatures from the relative concentration pathway (RCP) scenarios (rows).
A general rapid expansion of the treeline (continuous cover from south , green) can be seen. In each panel, the maximum treeline position and the corresponding year are provided next to migration rates in three periods in . Blue colour at the top represents the shoreline.
Appendix 2—figure 2
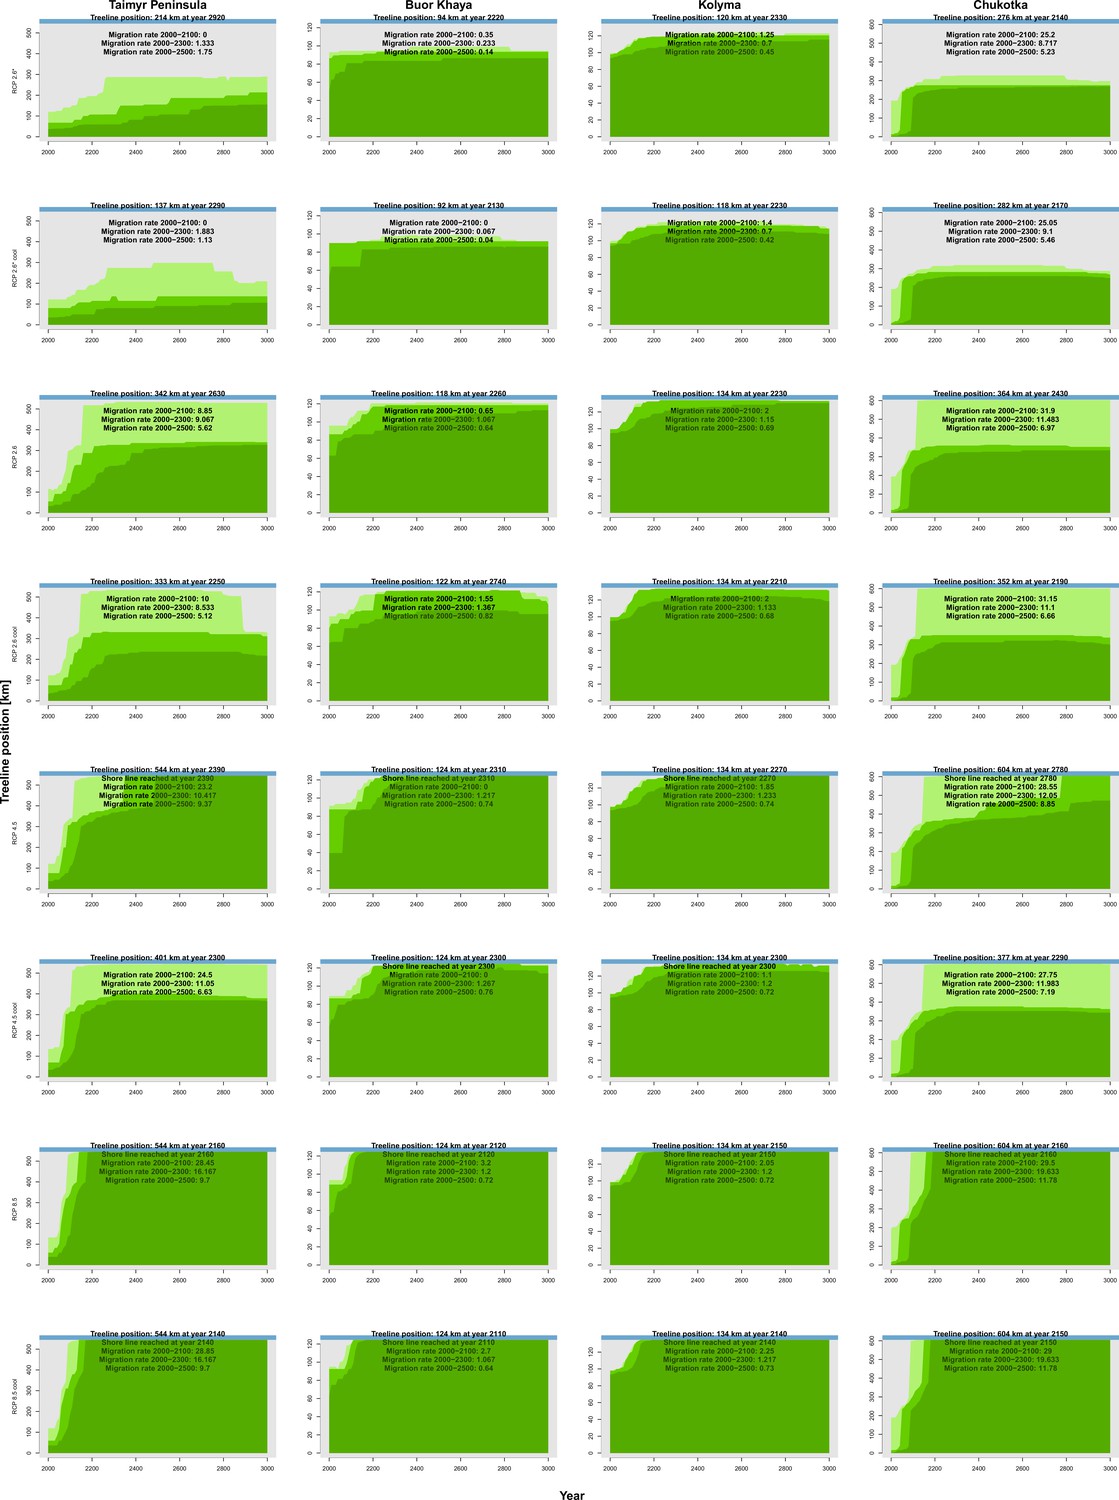
Simulated forest expansion dynamics along the four transects (columns) forced with climate data based on relative concentration pathway (RCP) scenarios (rows).
A general quick expansion of single-tree stands (northernmost position of forest islands ahead of the treeline with , light green) and the treeline (northernmost position of a continuous forest cover with , green) followed by the forestline (northernmost position of a forest cover , dark green) is seen. Blue colour at the top represents the shoreline.
Appendix 3—figure 1
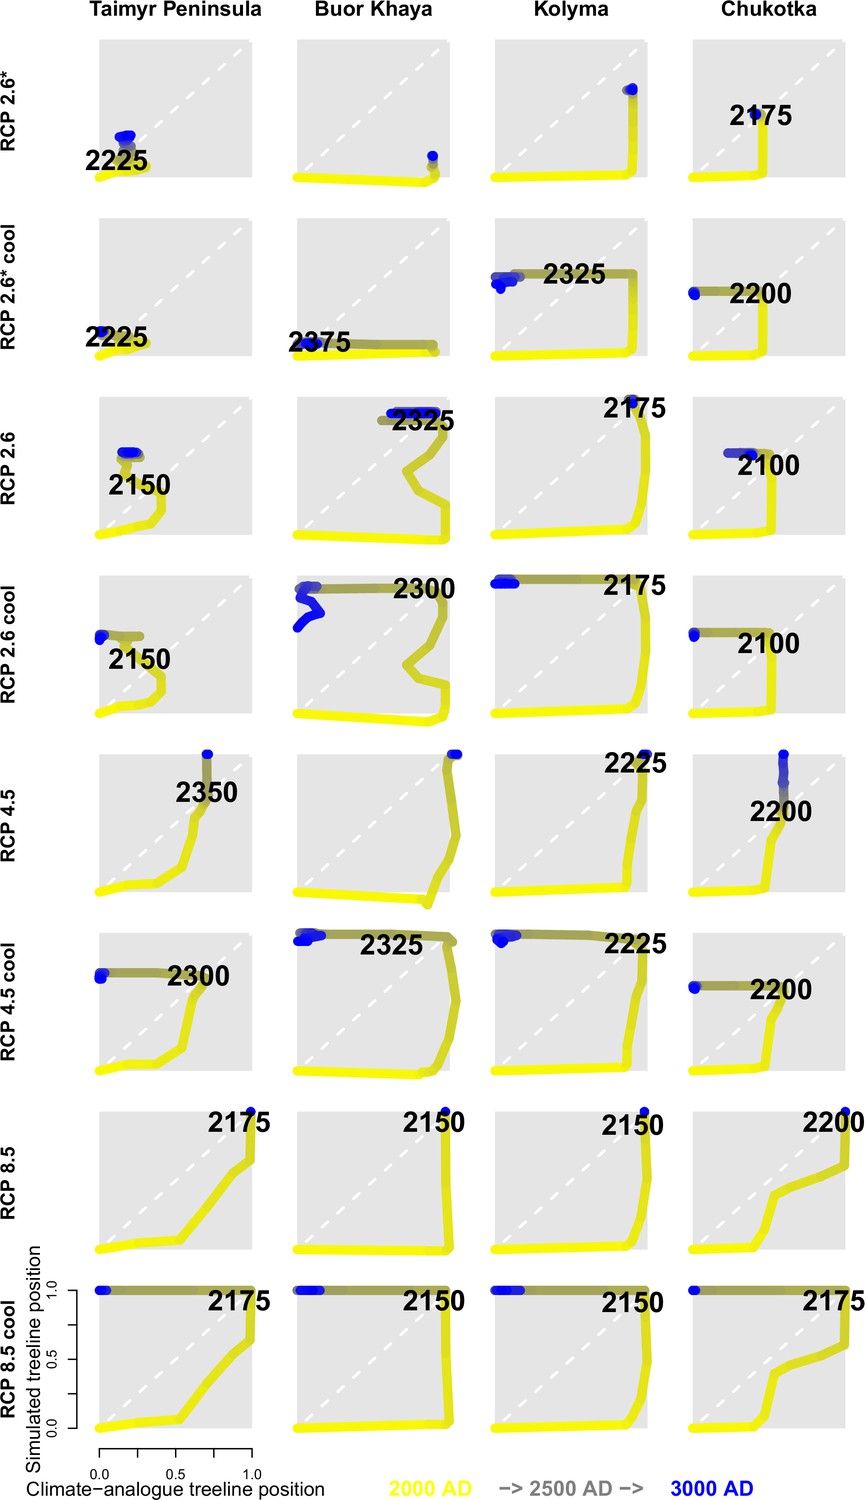
Trajectories for all four regions.
Numbers are the first year when the simulated treeline position is equal to or farther north than the modern climate-analogue position. Colour of line segments ranges from yellow for year 2000 to blue in 300 CE.
Appendix 4—figure 1
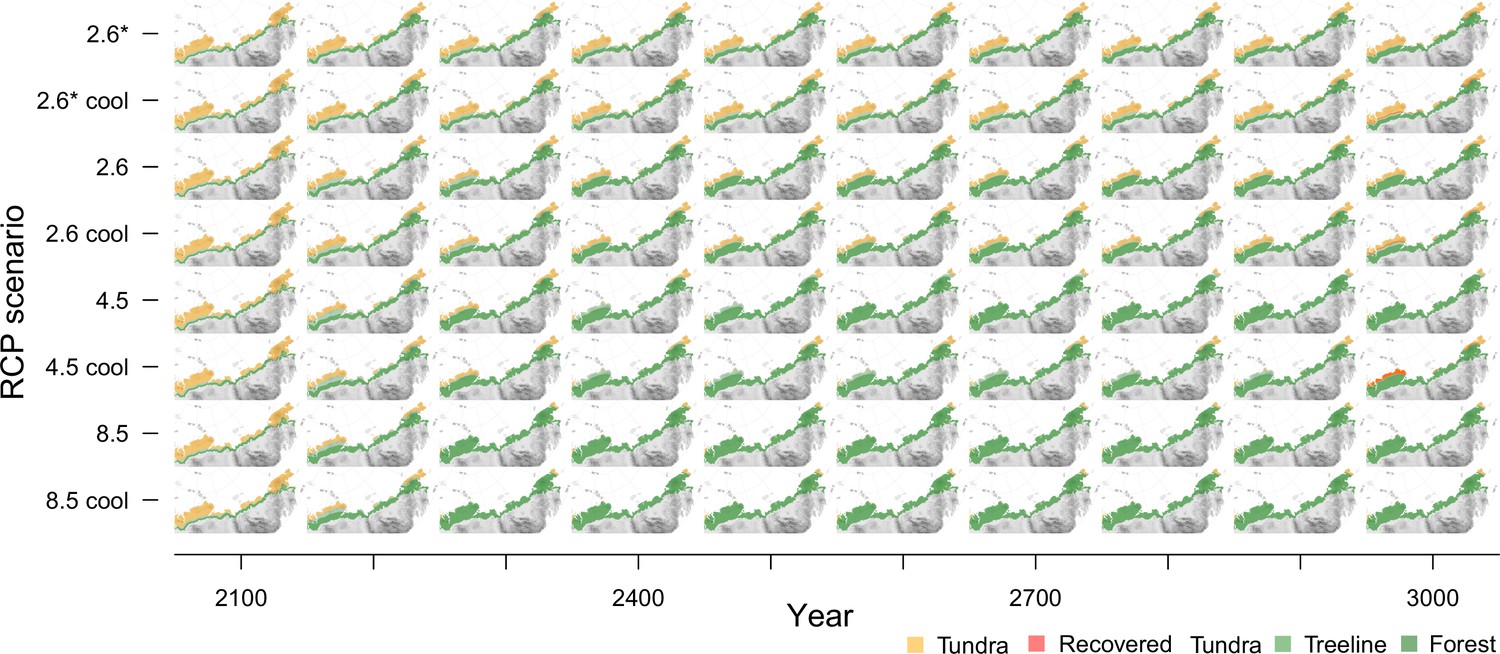
Forest expansion for 100-year time steps and all scenarios.
Modern tundra areas will become covered by at least open larch tundra forests under different climate scenarios and nearly reach the shoreline in warmest conditions.
Tables
Appendix 2—table 1
Summary of simulated vs. climate envelope-based treeline advance.
Climate envelope solely based on July temperatures (following MacDonald et al., 2007). Values in bold reach the shoreline, but note that because of technical reasons the step sizes of the climate are in 10-km steps. Values are the result of three simulation repeats, and the standard deviation is stated next to the mean value.
| Transect | Scenario | Maximum potential expansion based on climate and year | Simulated maximum expansion and year | Treeline migration rate 2000– | Treeline migration rate 2000– |
|---|---|---|---|---|---|
| Taimyr | RCP 2.6* | 210 km 2090 | 192.2 ± 18.5 km 2733 ± 162 | 0.8 ± 0.7 | 1.5 ± 0.1 |
| RCP 2.6*c | 210 km 2090 | 135.3 ± 1.4 km 2357 ± 58 | 3.4 ± 2.9 | 1.9 ± 0 | |
| RCP 2.6 | 320 km 2090 | 344.8 ± 2.9 km 2730 ± 87 | 11.5 ± 2.3 | 9 ± 0 | |
| RCP 2.6c | 320 km 2090 | 331.3 ± 1.4 km 2283 ± 29 | 8.6 ± 1.2 | 8.6 ± 0.1 | |
| RCP 4.5 | 410 km 2297 | 544.5 ± 0 km 2383 ± 6 | 23.4 ± 0.2 | 10.6 ± 0.1 | |
| RCP 4.5c | 400 km 2221 | 405.3 ± 3.8 km 2567 ± 231 | 24.7 ± 0.2 | 11.2 ± 0.1 | |
| RCP 8.5 | 560 km 2082 | 544.5 ± 0 km 2160 ± 0 | 29.1 ± 0.5 | 16.1 ± 0 | |
| RCP 8.5c | 560 km 2082 | 544.5 ± 0 km 2140 ± 0 | 28.4 ± 0.4 | 16.2 ± 0 | |
| Buor Khaya | RCP 2.6* | 130 km 2040 | 94.5 ± 0.9 km 2307 ± 75 | 0.1 ± 0.2 | 0.2 ± 0 |
| RCP 2.6*c | 130 km 2040 | 91 ± 0.9 km 2497 ± 318 | 0 ± 0 | 0 ± 0 | |
| RCP 2.6 | 130 km 2020 | 120.2 ± 1.4 km 2247 ± 12 | 1 ± 0.3 | 1.1 ± 0 | |
| RCP 2.6c | 130 km 2020 | 122.3 ± 0.3 km 2633 ± 92 | 0.9 ± 0.6 | 1.2 ± 0.2 | |
| RCP 4.5 | 140 km 2133 | 124.5 ± 0 km 2303±6 | 0.6 ± 0.5 | 1.3 ± 0.1 | |
| RCP 4.5c | 140 km 2133 | 124.5 ± 0 km 2287 ± 12 | 0.2 ± 0.1 | 1.2 ± 0.1 | |
| RCP 8.5 | 140 km 2038 | 124.5 ± 0 km 2120 ± 0 | 3.2 ± 0 | 1.2 ± 0 | |
| RCP 8.5c | 140 km 2038 | 124.5 ± 0 km 2123 ± 12 | 3 ± 0.3 | 1.1 ± 0 | |
| Kolyma | RCP 2.6* | 130 km 2012 | 120.8 ± 0.3 km 2330 ± 0 | 1.2 ± 0.1 | 0.7 ± 0 |
| RCP 2.6*c | 130 km 2012 | 119 ± 0.9 km 2217 ± 12 | 1.1 ± 0.2 | 0.7 ± 0 | |
| RCP 2.6 | 150 km 2094 | 134.3 ± 0.3 km 2230 ± 0 | 2.1 ± 0.1 | 1.2 ± 0 | |
| RCP 2.6c | 150 km 2094 | 113.5 ± 17.3 km 2103 ± 92 | 1.3 ± 0.6 | 1 ± 0.1 | |
| RCP 4.5 | 150 km 2284 | 134.5 ± 0 km 2257 ± 12 | 2 ± 0.1 | 1.2 ± 0 | |
| RCP 4.5c | 140 km 2121 | 134.5 ± 0 km 2307 ± 6 | 1.6 ± 0.5 | 1.2 ± 0 | |
| RCP 8.5 | 150 km 2072 | 134.5 ± 0 km 2143 ± 6 | 2.2 ± 0.2 | 1.2 ± 0 | |
| RCP 8.5c | 150 km 2072 | 134.5 ± 0 km 2140 ± 0 | 2.2 ± 0.1 | 1.2 ± 0 | |
| Chukotka | RCP 2.6* | 300 km 2047 | 285.2 ± 8.4 km 2173 ± 29 | 25.1 ± 0.1 | 8.8 ± 0.1 |
| RCP 2.6*c | 300 km 2047 | 285.7 ± 3.2 km 2203 ± 29 | 25.3 ± 0.2 | 9.2 ± 0.1 | |
| RCP 2.6 | 350 km 2047 | 363.5 ± 0 km 2423 ± 6 | 30.8 ± 1 | 11.3 ± 0.2 | |
| RCP 2.6c | 350 km 2047 | 358.8 ± 6.4 km 2290 ± 87 | 30.9 ± 0.2 | 11.3 ± 0.2 | |
| RCP 4.5 | 380 km 2144 | 604.5 ± 0 km 2747 ± 29 | 27.2 ± 1.2 | 12 ± 0 | |
| RCP 4.5c | 380 km 2144 | 377 ± 0 km 2297 ± 6 | 28 ± 0.2 | 11.9 ± 0.1 | |
| RCP 8.5 | 610 km 2107 | 604.5 ± 0 km 2160 ± 0 | 29.1 ± 0.3 | 19.6 ± 0 | |
| RCP 8.5c | 610 km 2107 | 604.5 ± 0 km 2150 ± 0 | 29.2 ± 0.1 | 19.7 ± 0 |
Additional files
Download links
A two-part list of links to download the article, or parts of the article, in various formats.
Downloads (link to download the article as PDF)
Open citations (links to open the citations from this article in various online reference manager services)
Cite this article (links to download the citations from this article in formats compatible with various reference manager tools)
Regional opportunities for tundra conservation in the next 1000 years
eLife 11:e75163.
https://doi.org/10.7554/eLife.75163


