Tropical land use alters functional diversity of soil food webs and leads to monopolization of the detrital energy channel
- JF Blumenbach Institute of Zoology and Anthropology, University of Göttingen, Germany
- Department of Soil Sciences and Land Resources, Institut Pertanian Bogor, Indonesia
- Centre of Biodiversity and Sustainable Land Use, Germany
- Russian Academy of Sciences, A.N. Severtsov Institute of Ecology and Evolution, Russian Federation
Figures
Figure 1 with 1 supplement

Mean litter-calibrated Δ13C and Δ15N values of soil animal taxa in rainforest (a), jungle rubber (b), rubber, (c) and oil palm plantations (d).
Error bars represent standard errors across sampling plots (n = 1–8 per land-use system). Size of the points is scaled to the total share of the taxonomic group in the community metabolism in the corresponding land-use system (metabolism was log10-transformed to show trends in rarer groups).
-
Figure 1—source data 1
Metabolism data of each group in each plot.
- https://cdn.elifesciences.org/articles/75428/elife-75428-fig1-data1-v3.xlsx
-
Figure 1—source data 2
Stable isotope data of groups in each plot.
- https://cdn.elifesciences.org/articles/75428/elife-75428-fig1-data2-v3.xlsx
Figure 1—figure supplement 1

Metabolism proportion of animal groups in different land-use systems.
Figure 2 with 2 supplements
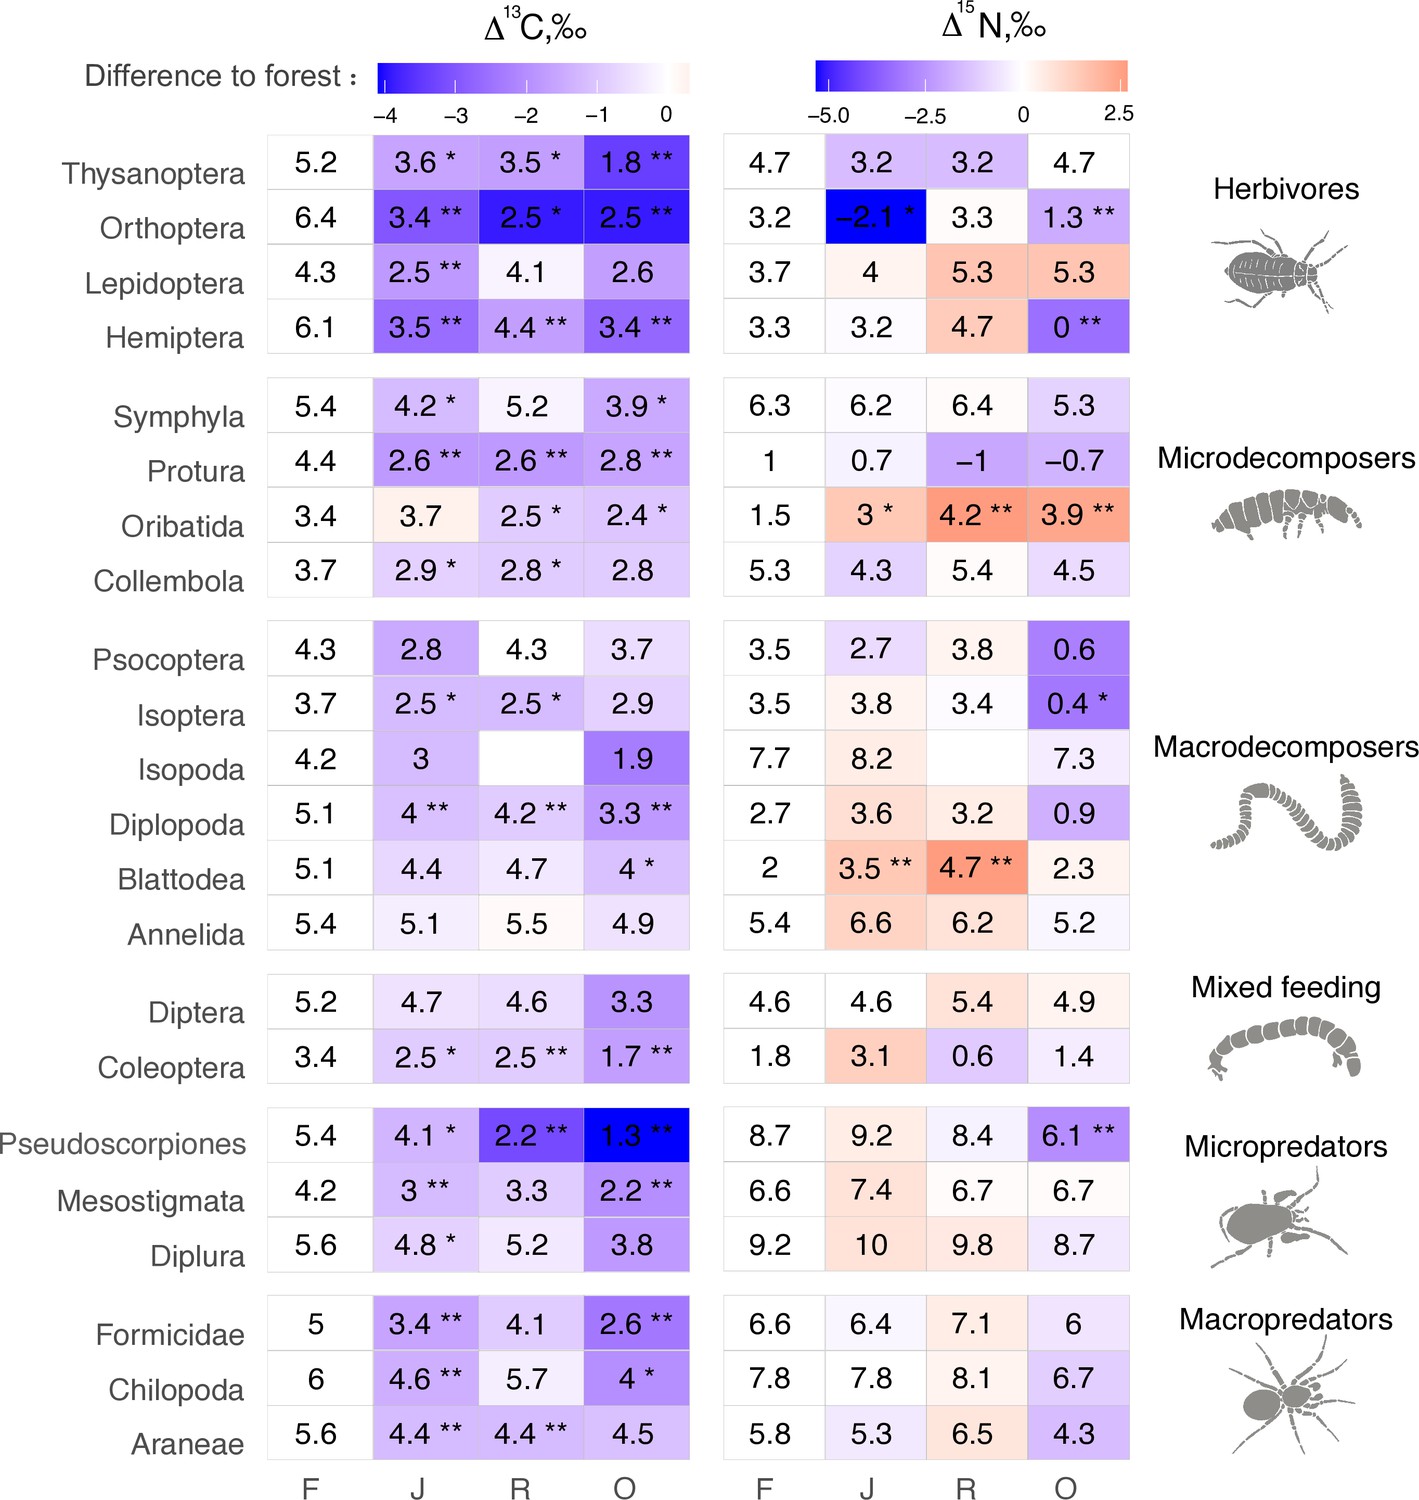
Average Δ13C and Δ15N values of taxonomic groups in rainforest (F), jungle rubber (J), rubber, (R) and oil palm plantations (O).
Numbers show means, asterisks indicate significant differences between the mean value in the corresponding land-use system and in rainforest (Student’s t-test *p < 0.05, **p < 0.01). Color represents the direction (red – increase, blue – decrease) and magnitude (darker color indicate stronger change) of the difference between rainforest and other land-use systems.
-
Figure 2—source data 1
Metabolism data of each group in each plot.
- https://cdn.elifesciences.org/articles/75428/elife-75428-fig2-data1-v3.xlsx
Figure 2—figure supplement 1
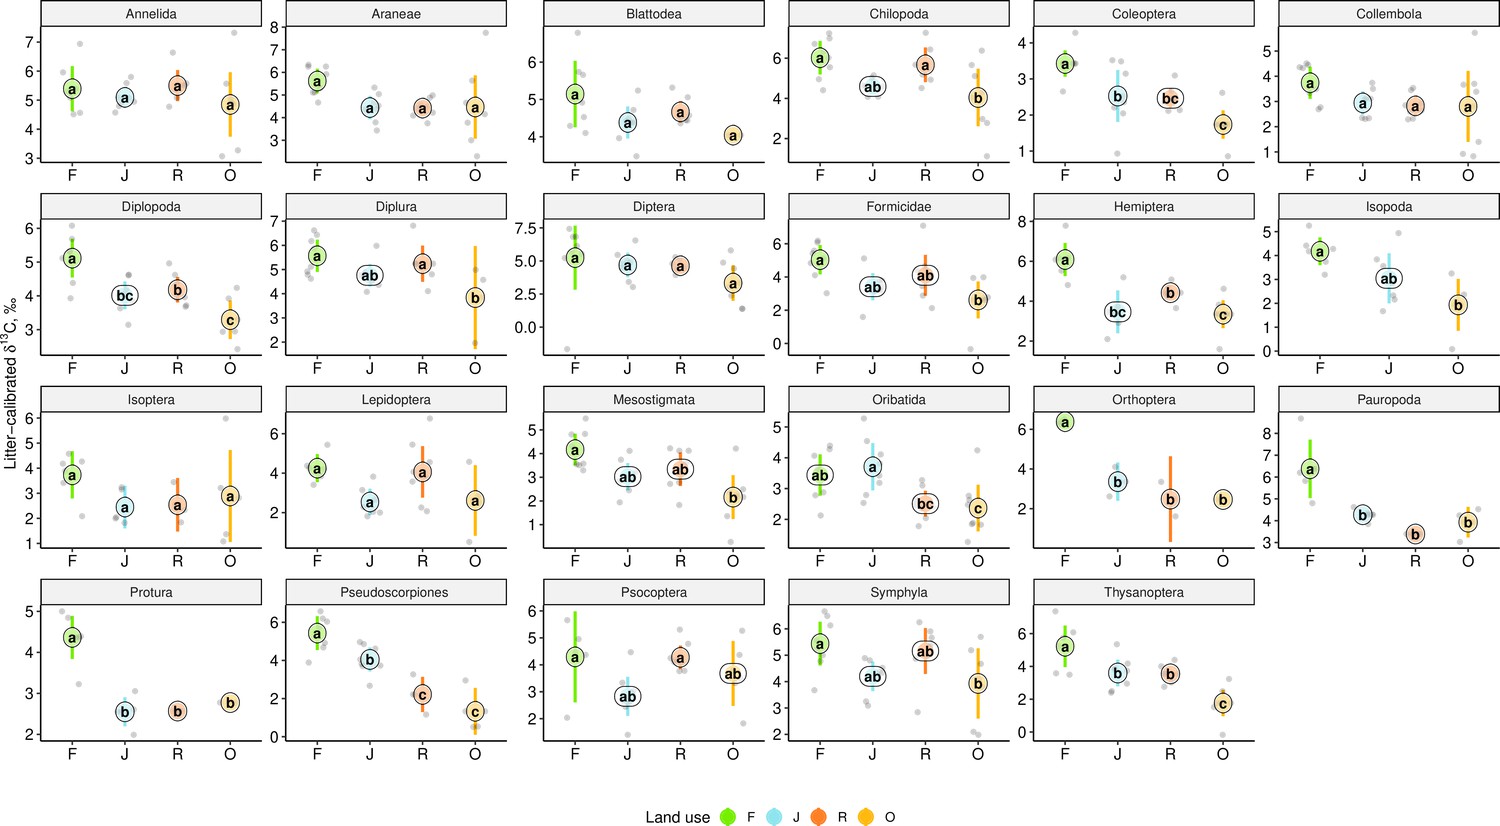
Δ13C of each taxa in in rainforest (F, green), jungle rubber (J, blue), rubber (R, red), and oil palm plantations (O, yellow).
Means sharing the same letter within each pane are not significantly different (Tukey’s HSD test following ANOVA, p > 0.05).
Figure 2—figure supplement 2

Δ15N of each taxa in in rainforest (F, green), jungle rubber (J, blue), rubber (R, red), and oil palm plantations (O, yellow).
Means sharing the same letter within each pane are not significantly different (Tukey’s HSD test following ANOVA, p > 0.05).
Figure 3
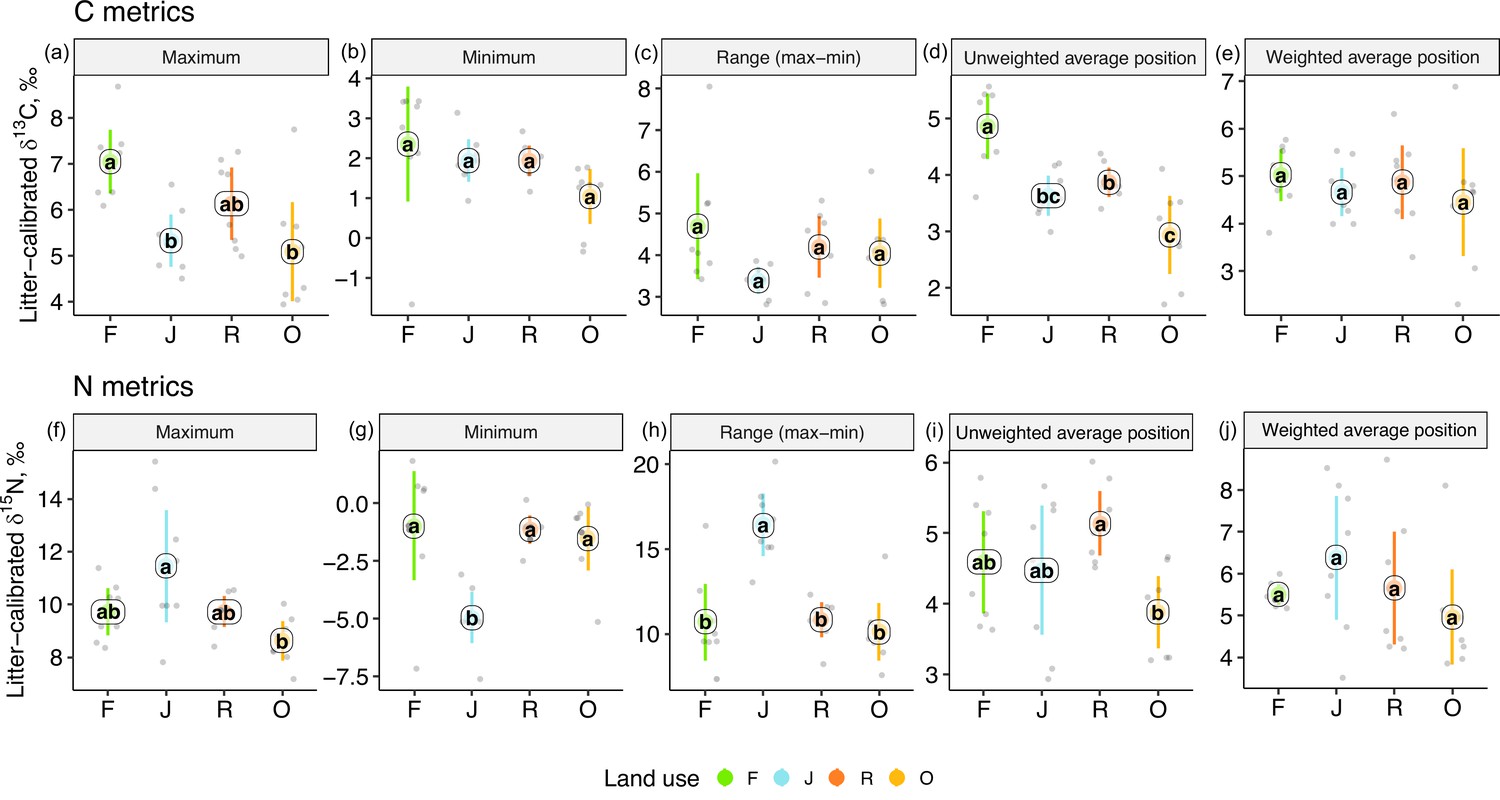
One-dimensional metrics for Δ13C (upper panel) and Δ15N values (lower panel) of communities in rainforest (F, green), jungle rubber (J, blue), rubber (R, red), and oil palm plantations (O, yellow).
Each point represents one community (n = 8 per land-use system). For the calculation of the weighted average values, species were weighted according to their contribution to the total community metabolism per plot. Means sharing the same letter within each pane are not significantly different (Tukey’s HSD test following ANOVA, p > 0.05).
-
Figure 3—source data 1
Community metrics of soil food webs in each plot.
- https://cdn.elifesciences.org/articles/75428/elife-75428-fig3-data1-v3.csv
-
Figure 3—source data 2
Energetic metrics of soil food webs in each plot.
- https://cdn.elifesciences.org/articles/75428/elife-75428-fig3-data2-v3.csv
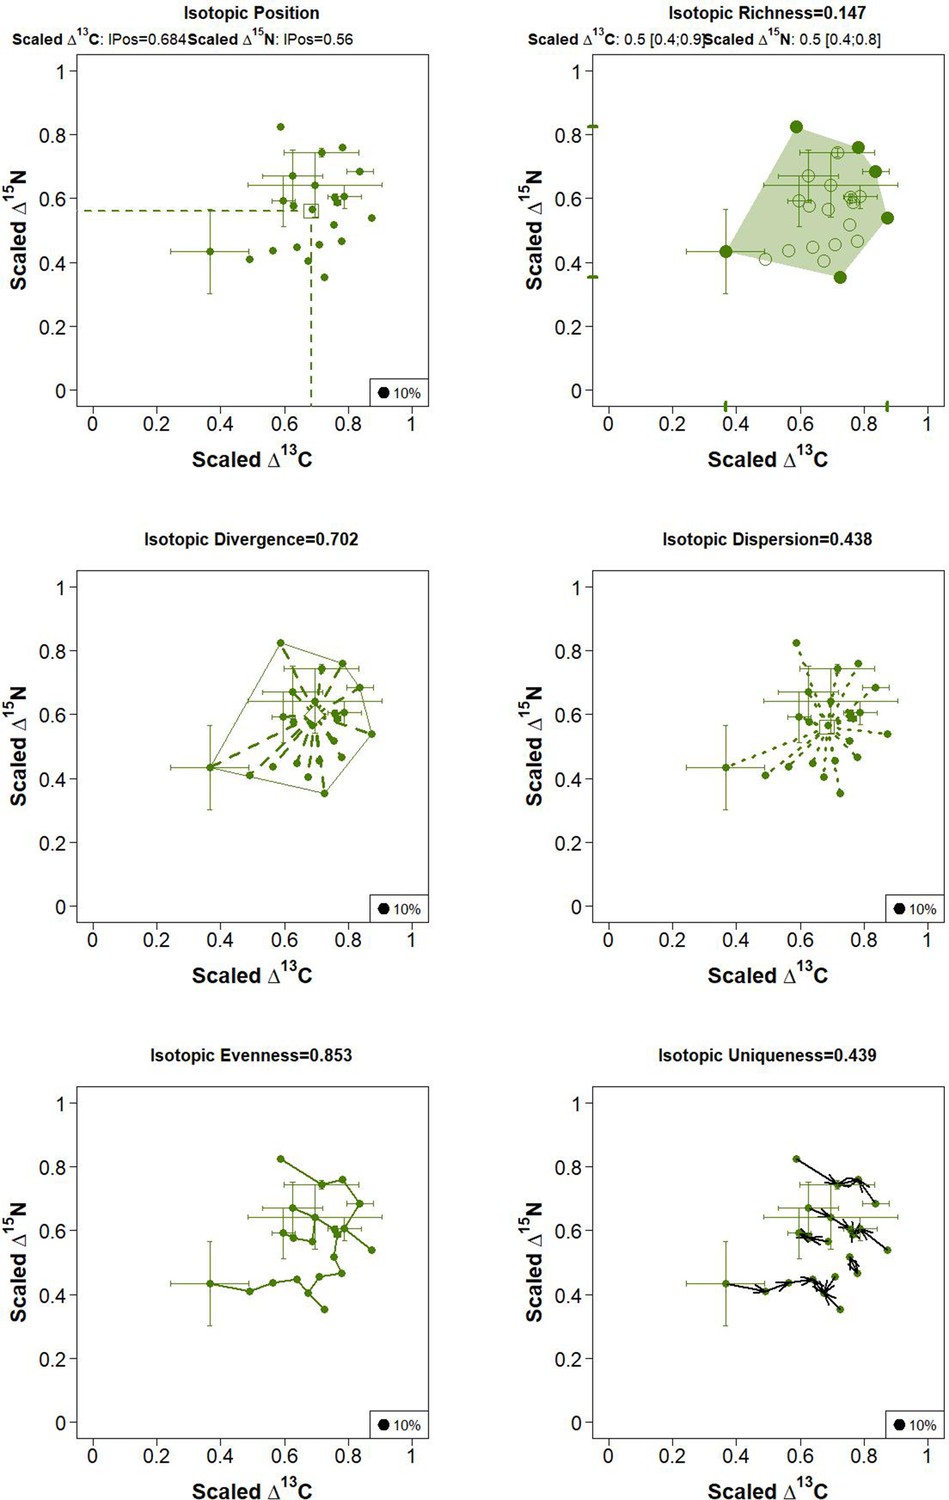
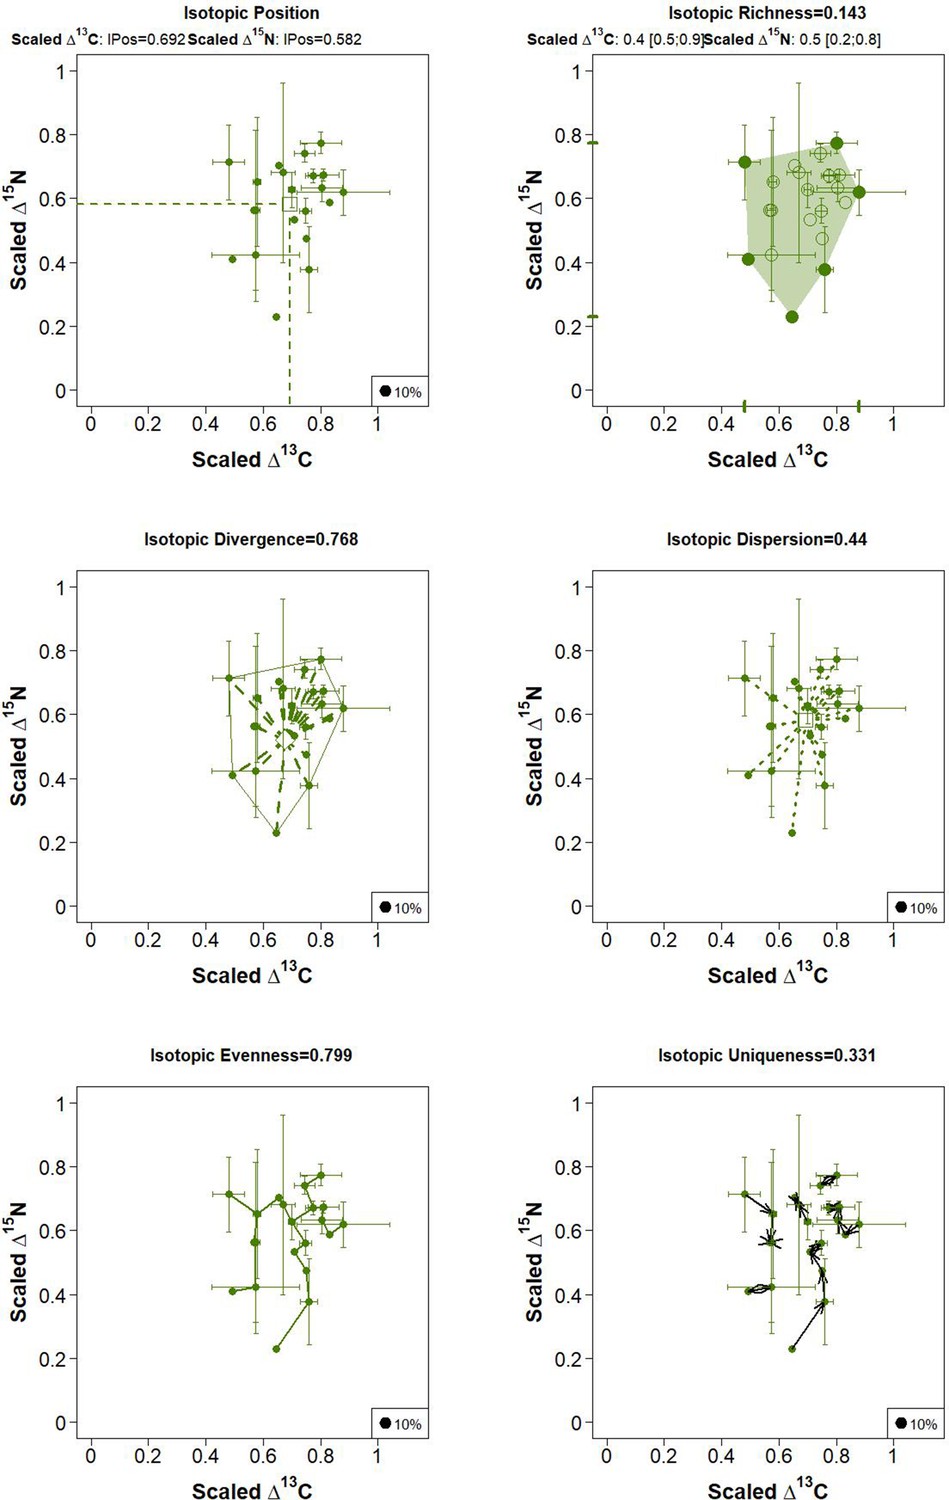
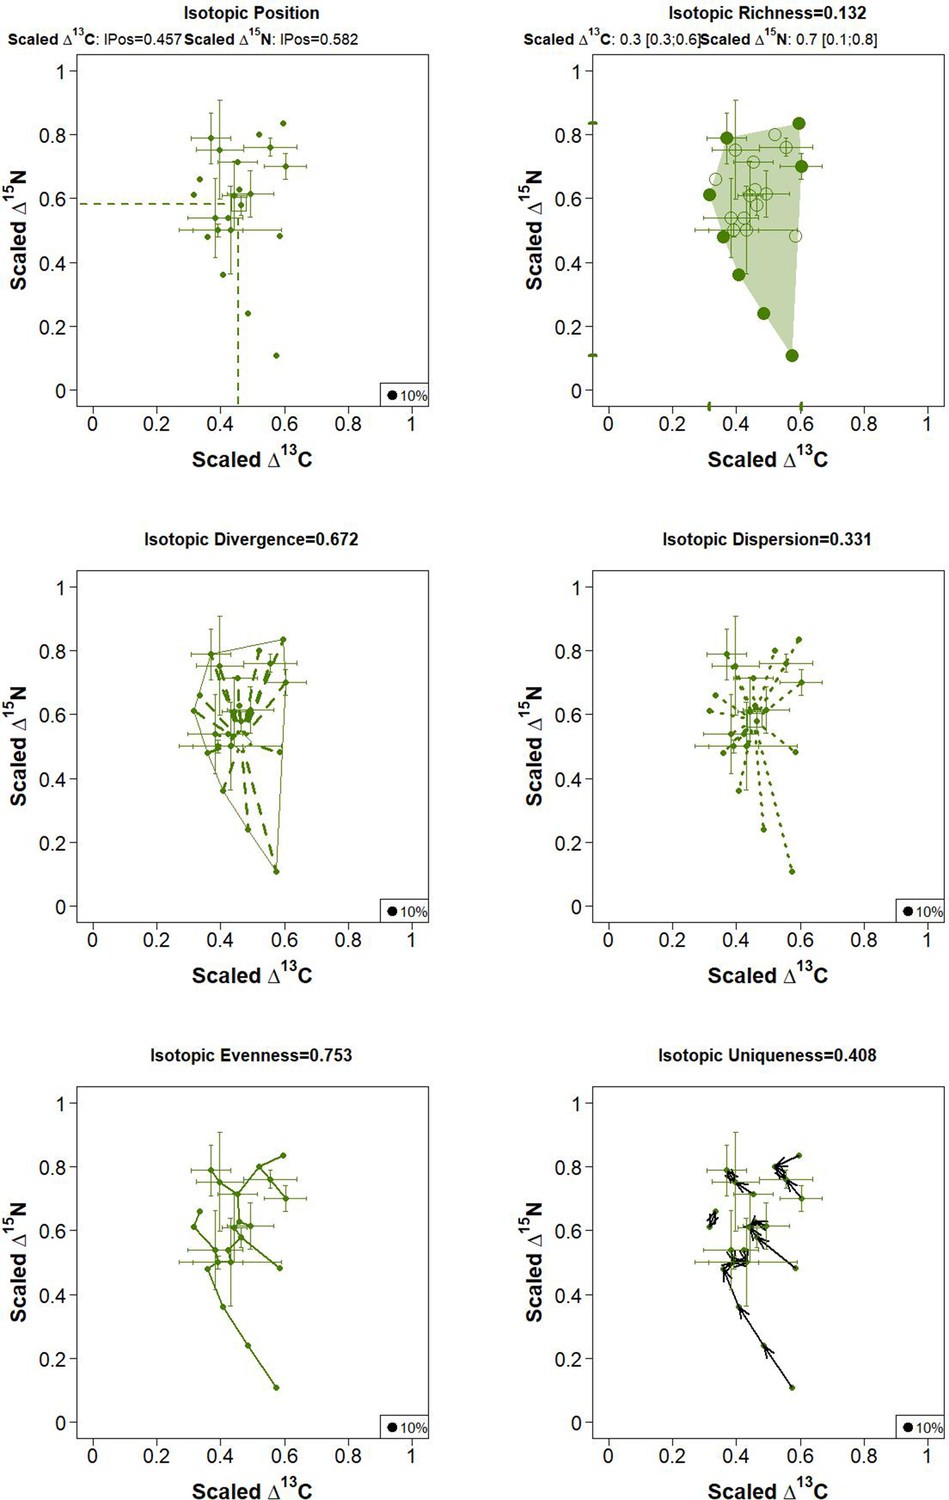
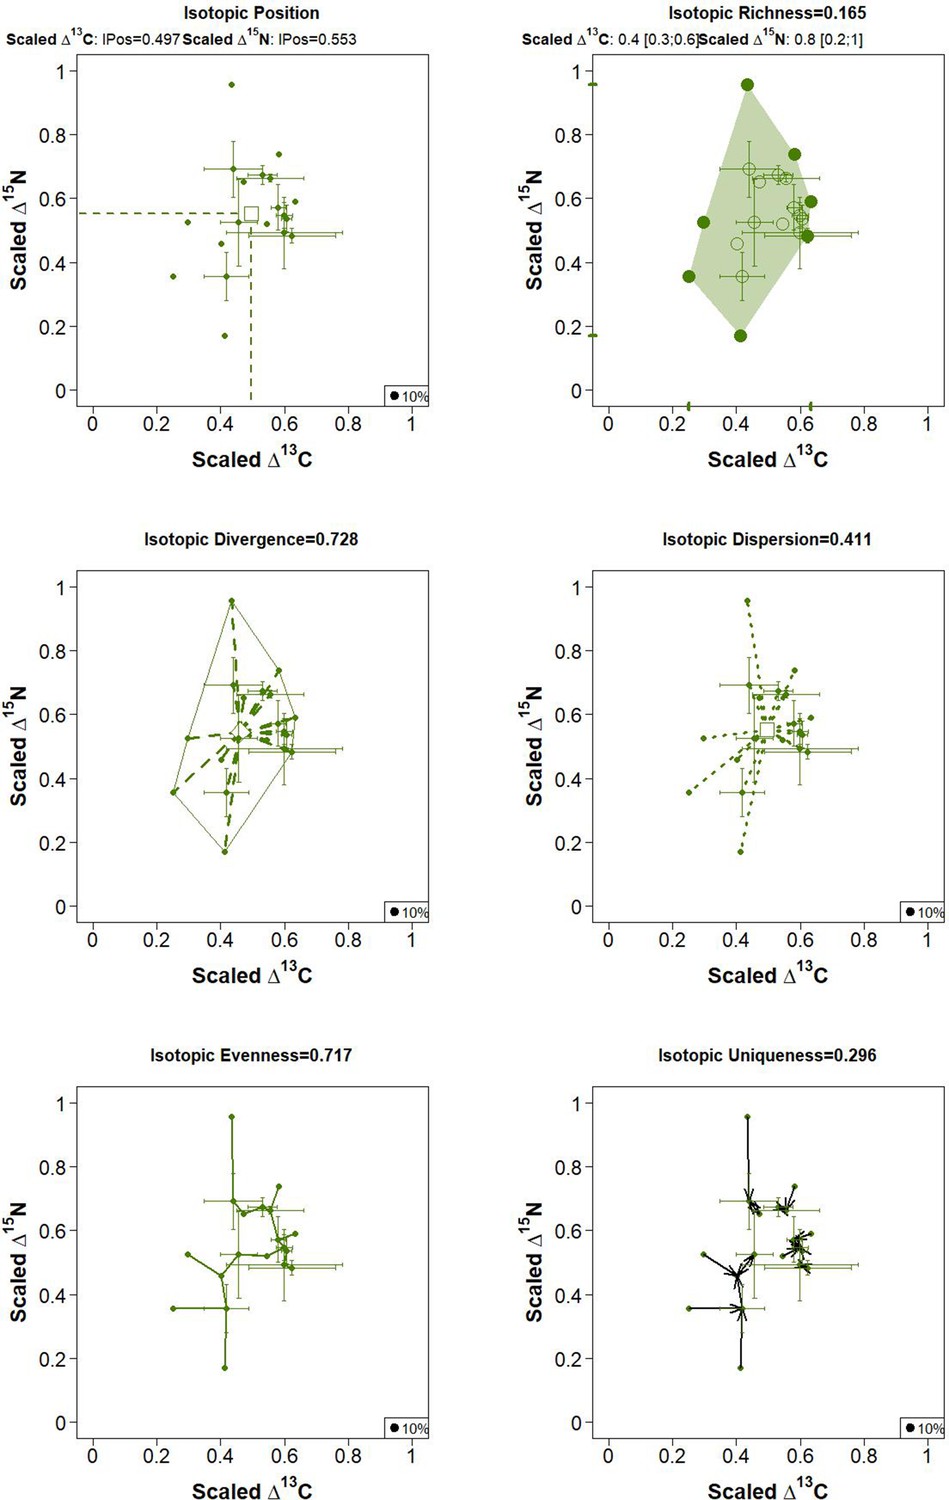
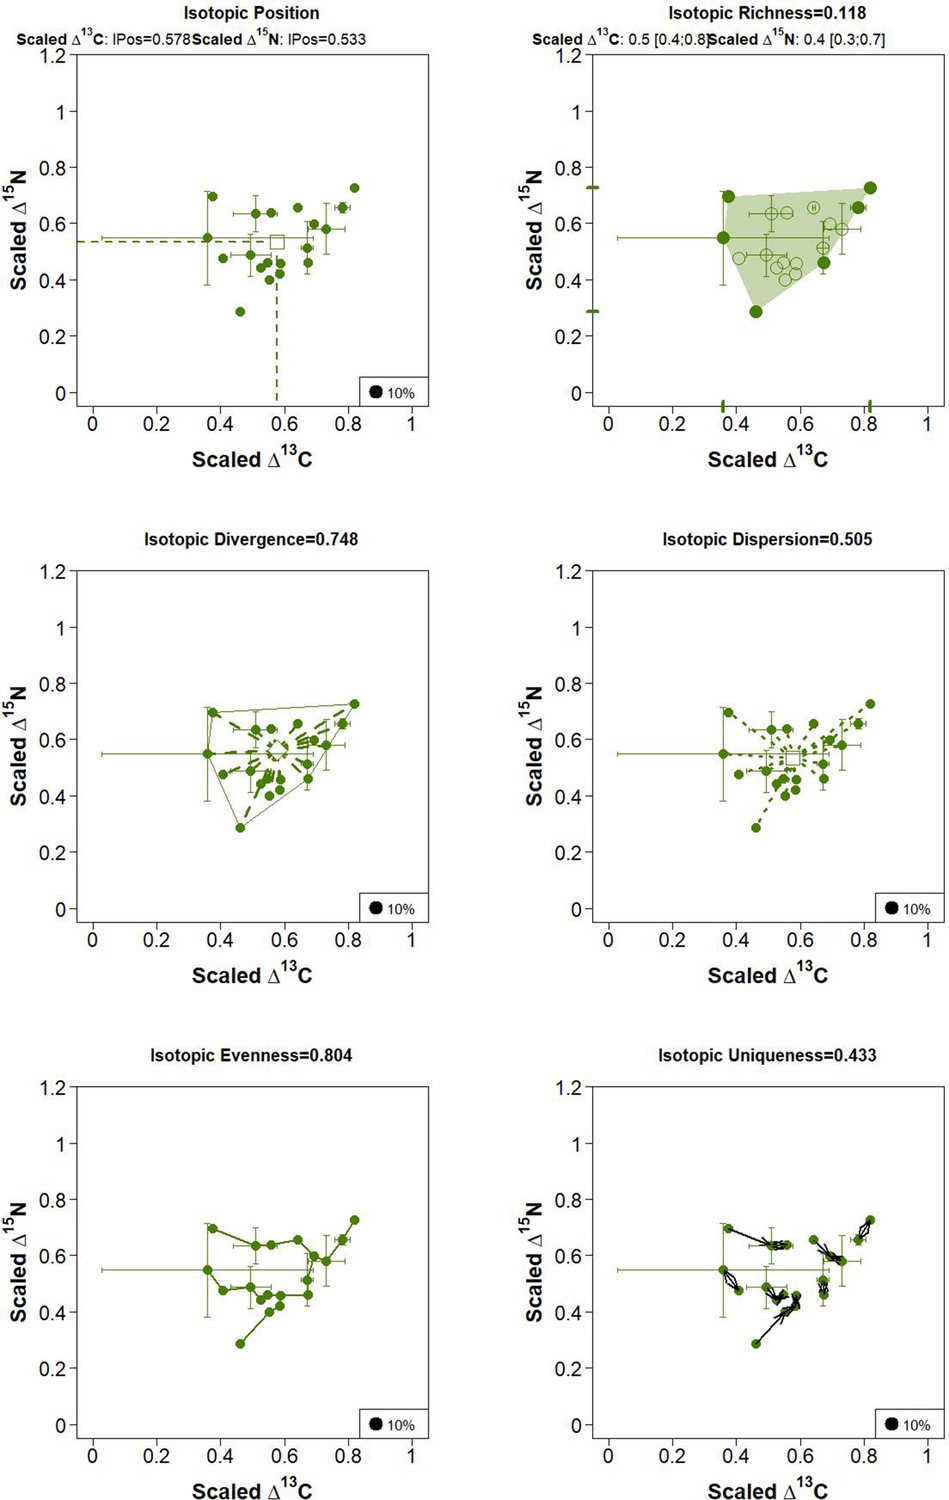
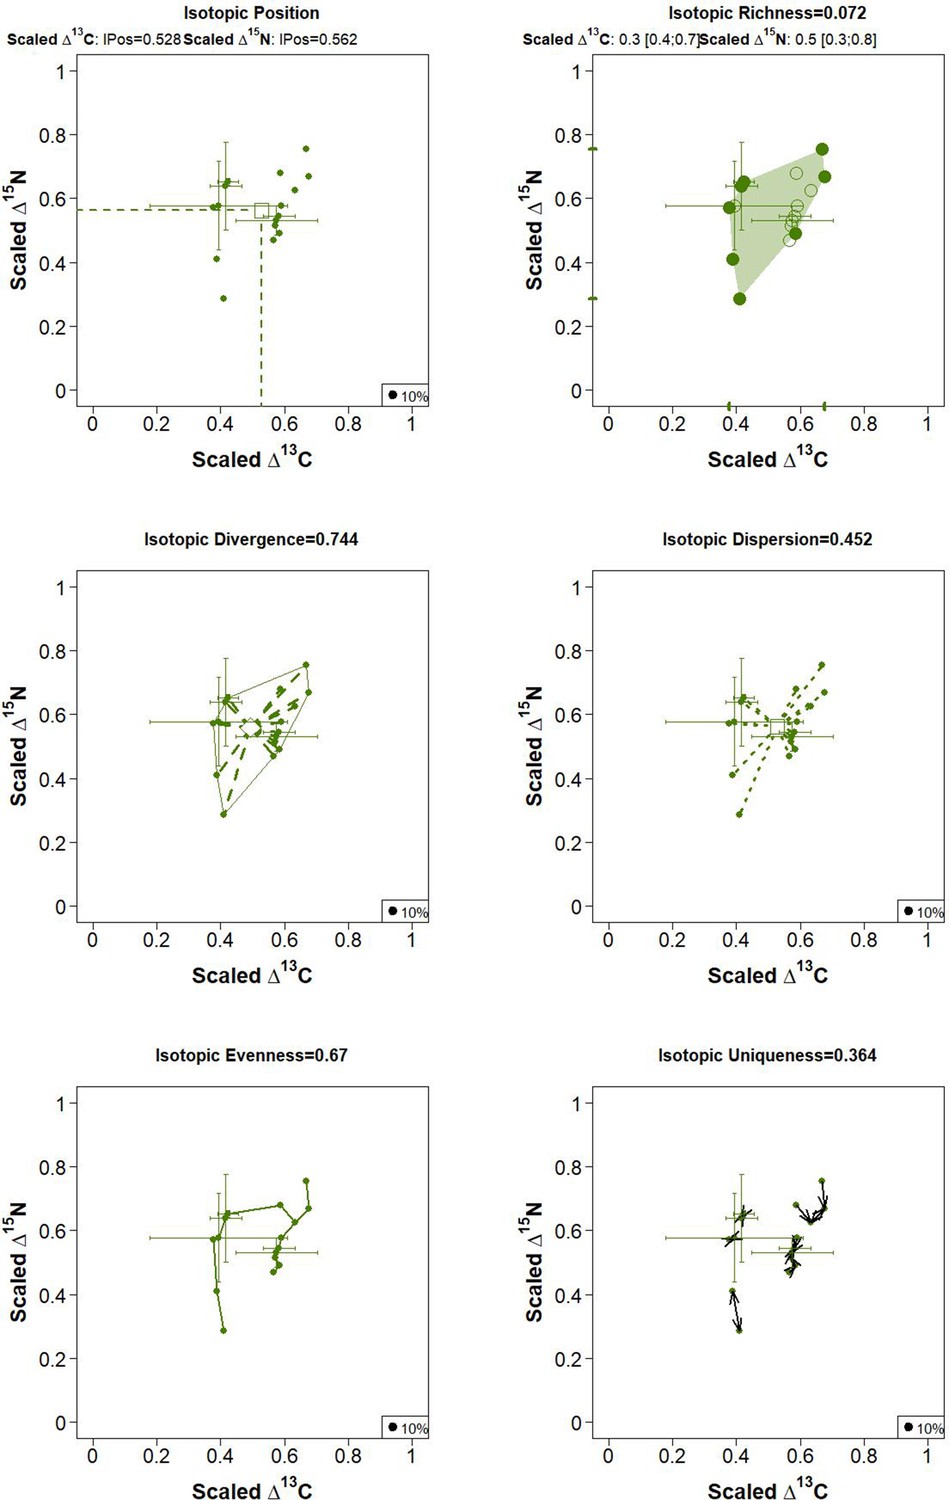
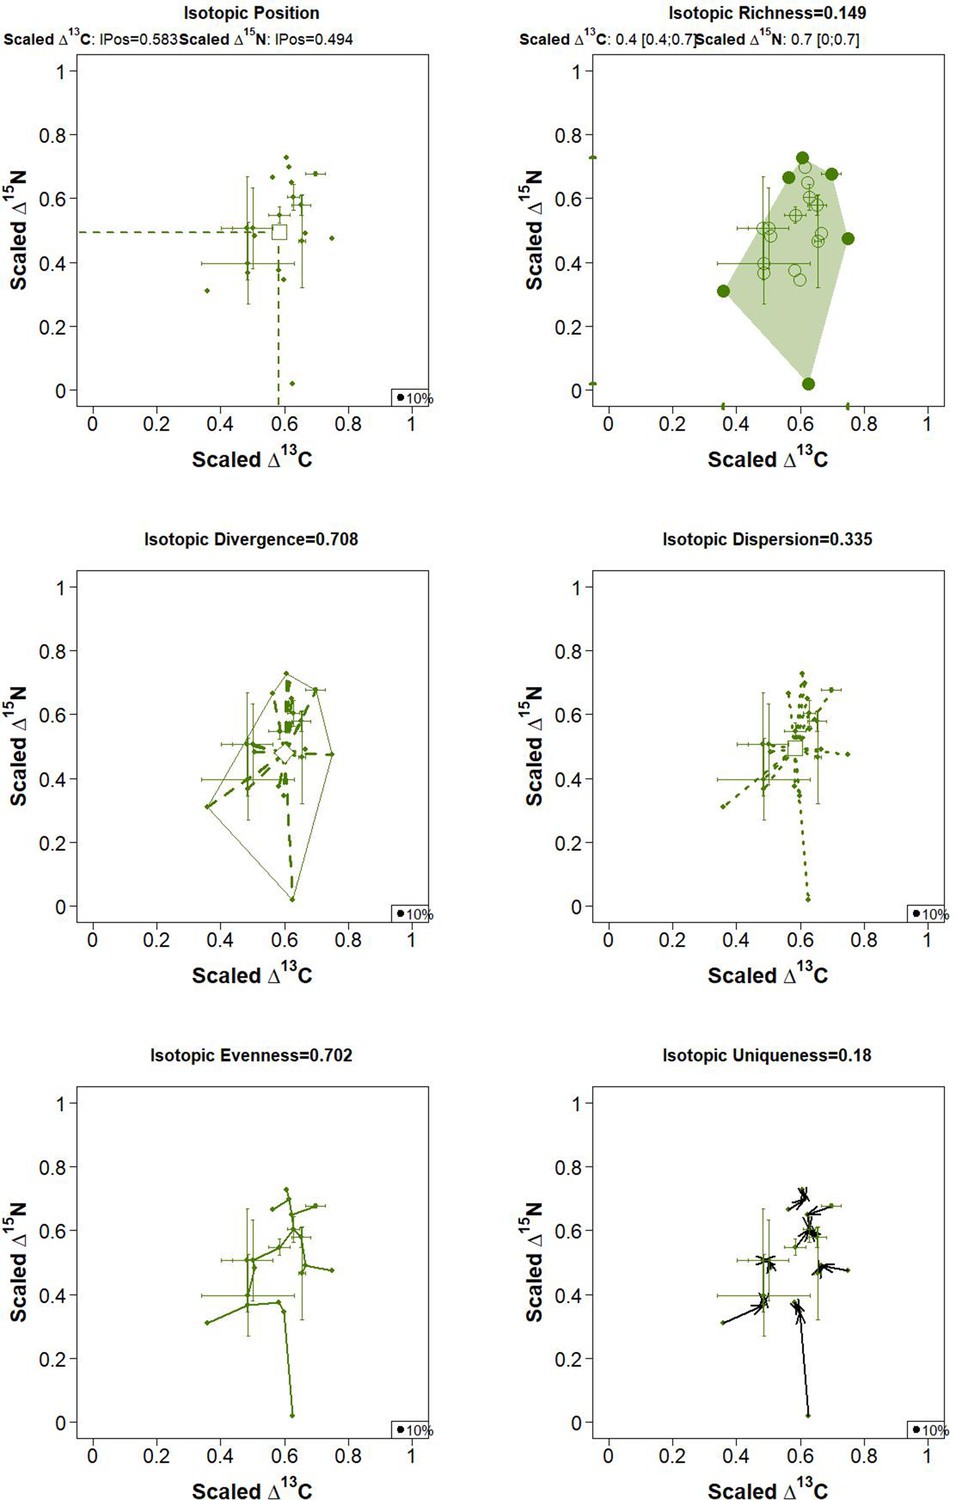
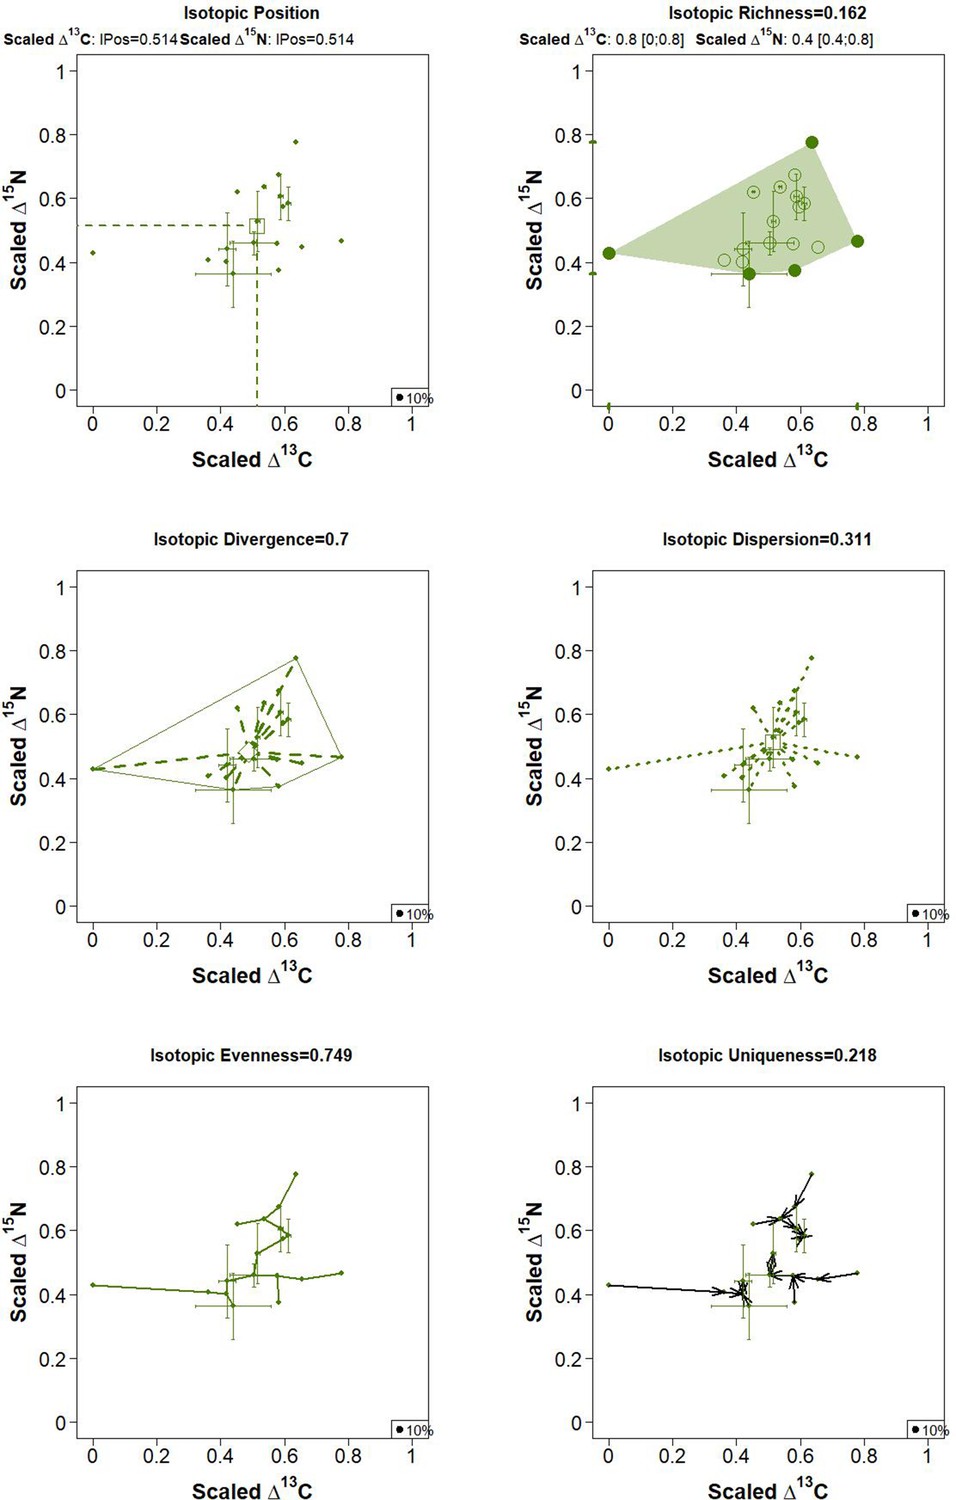
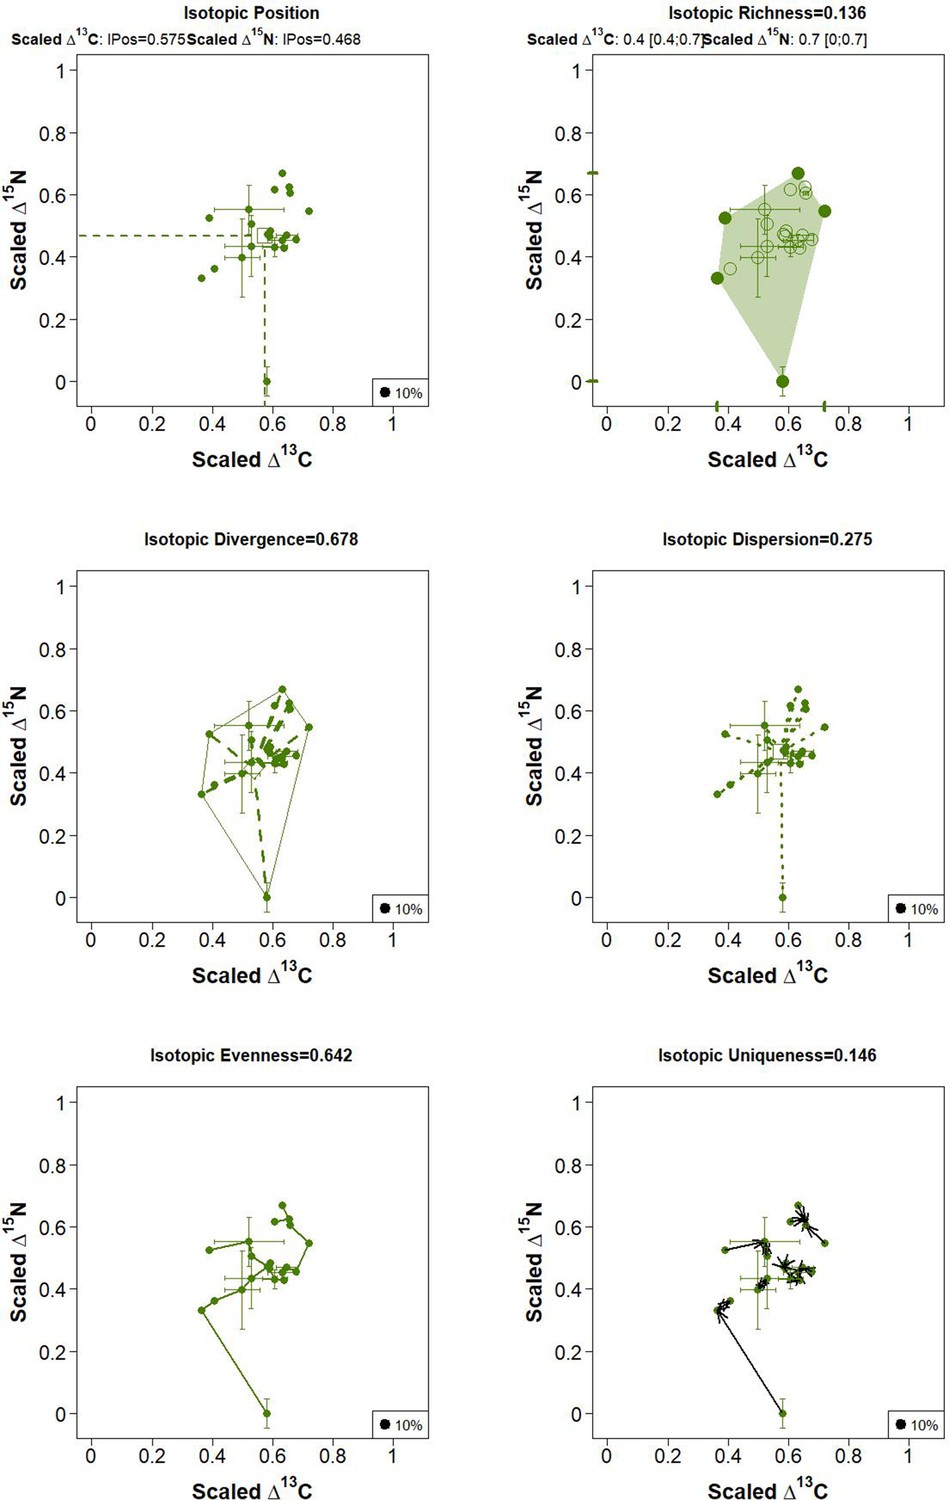
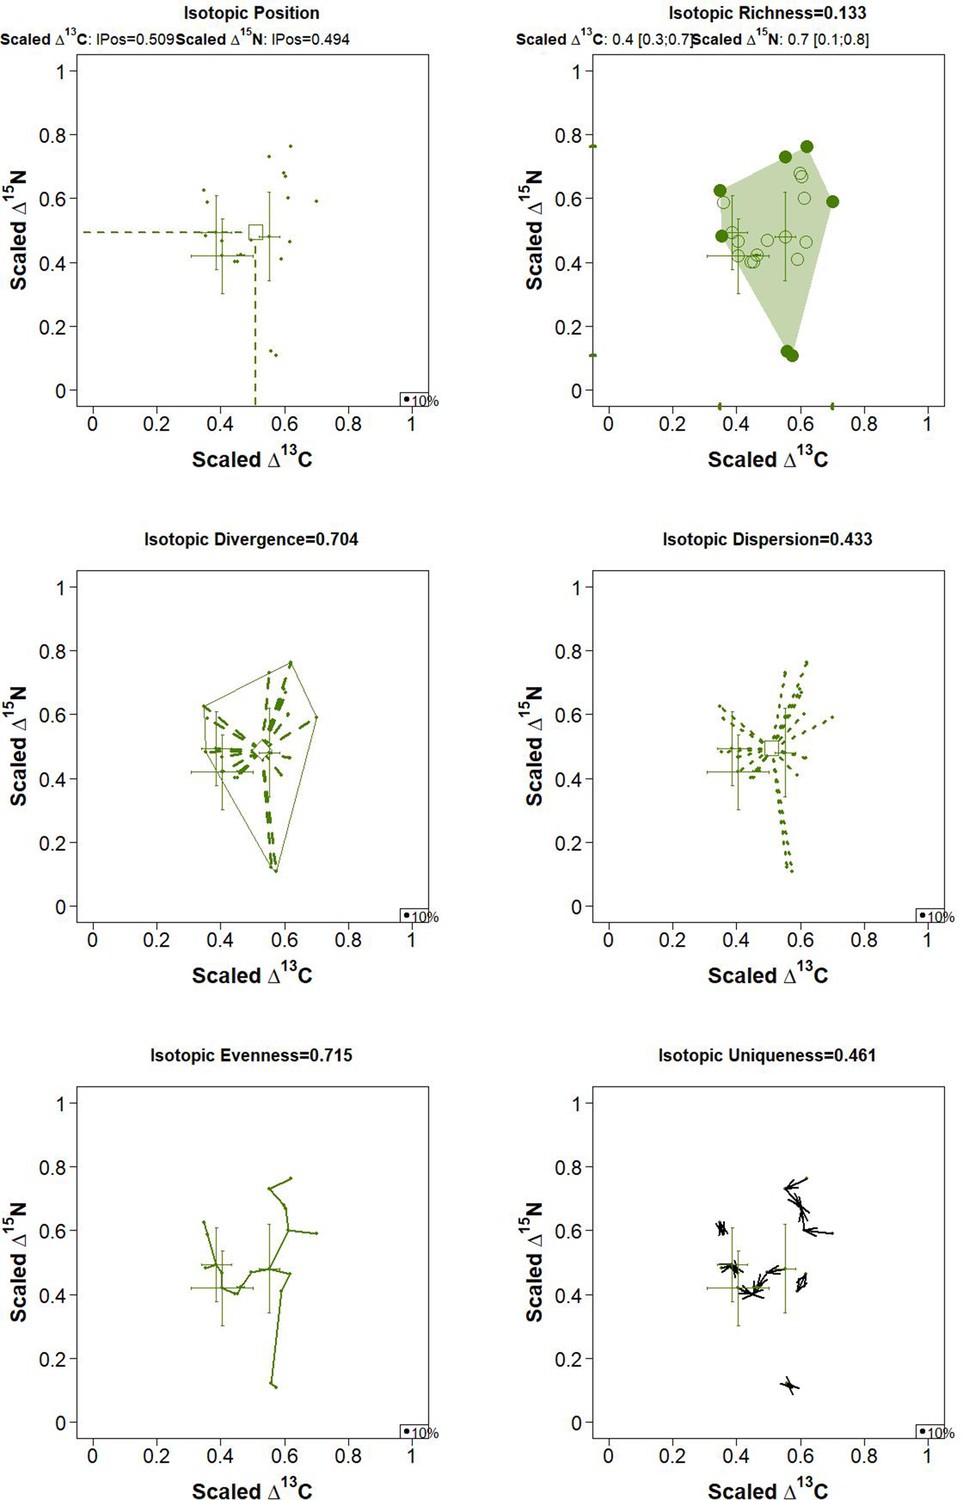
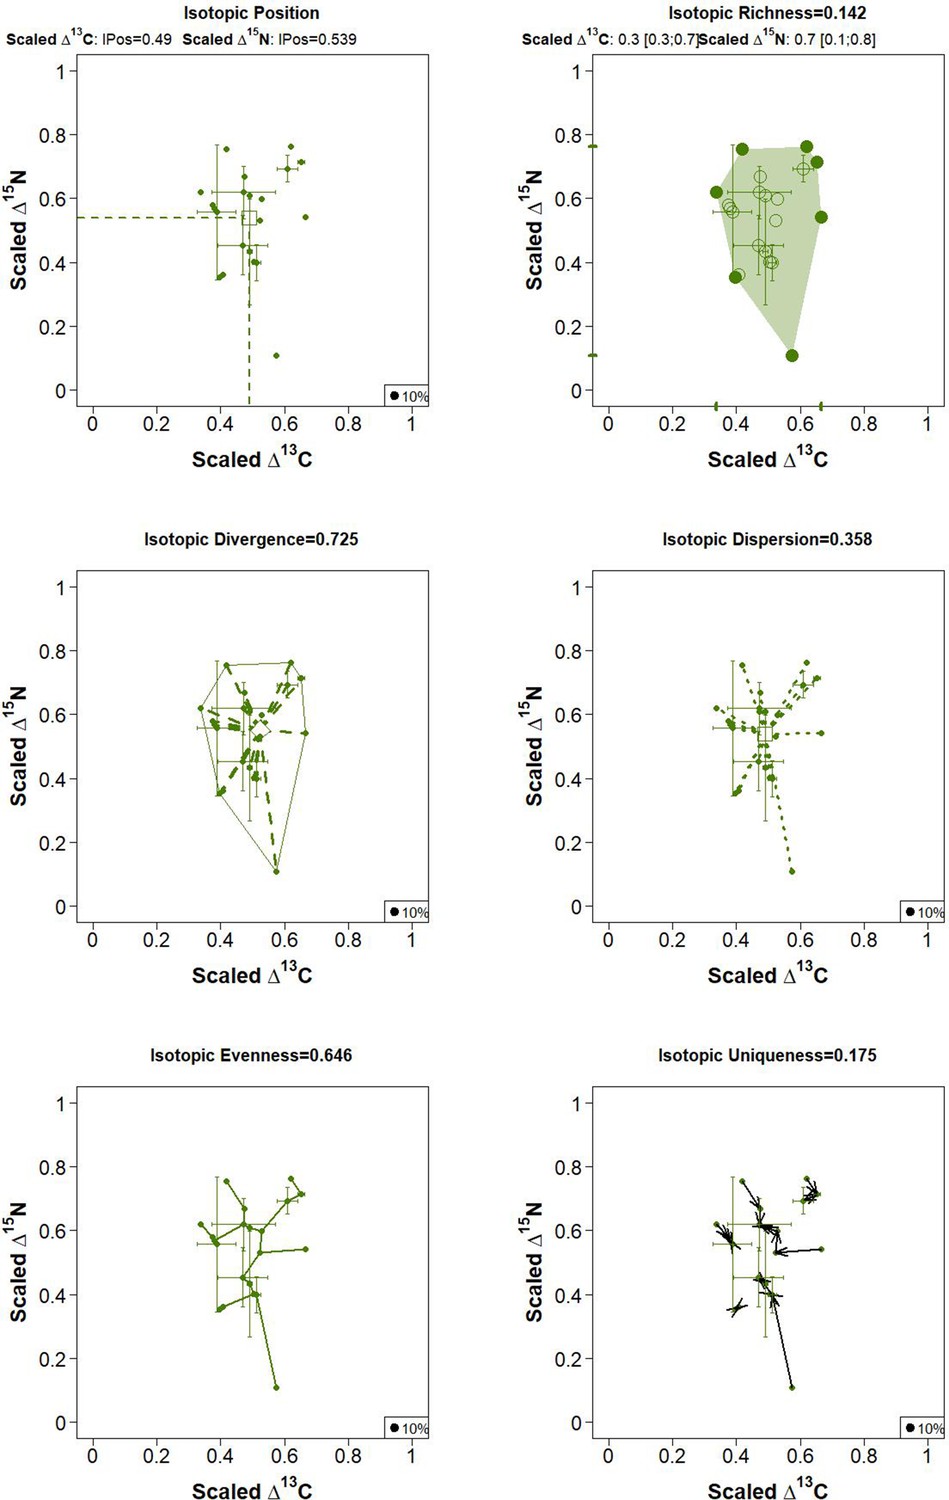
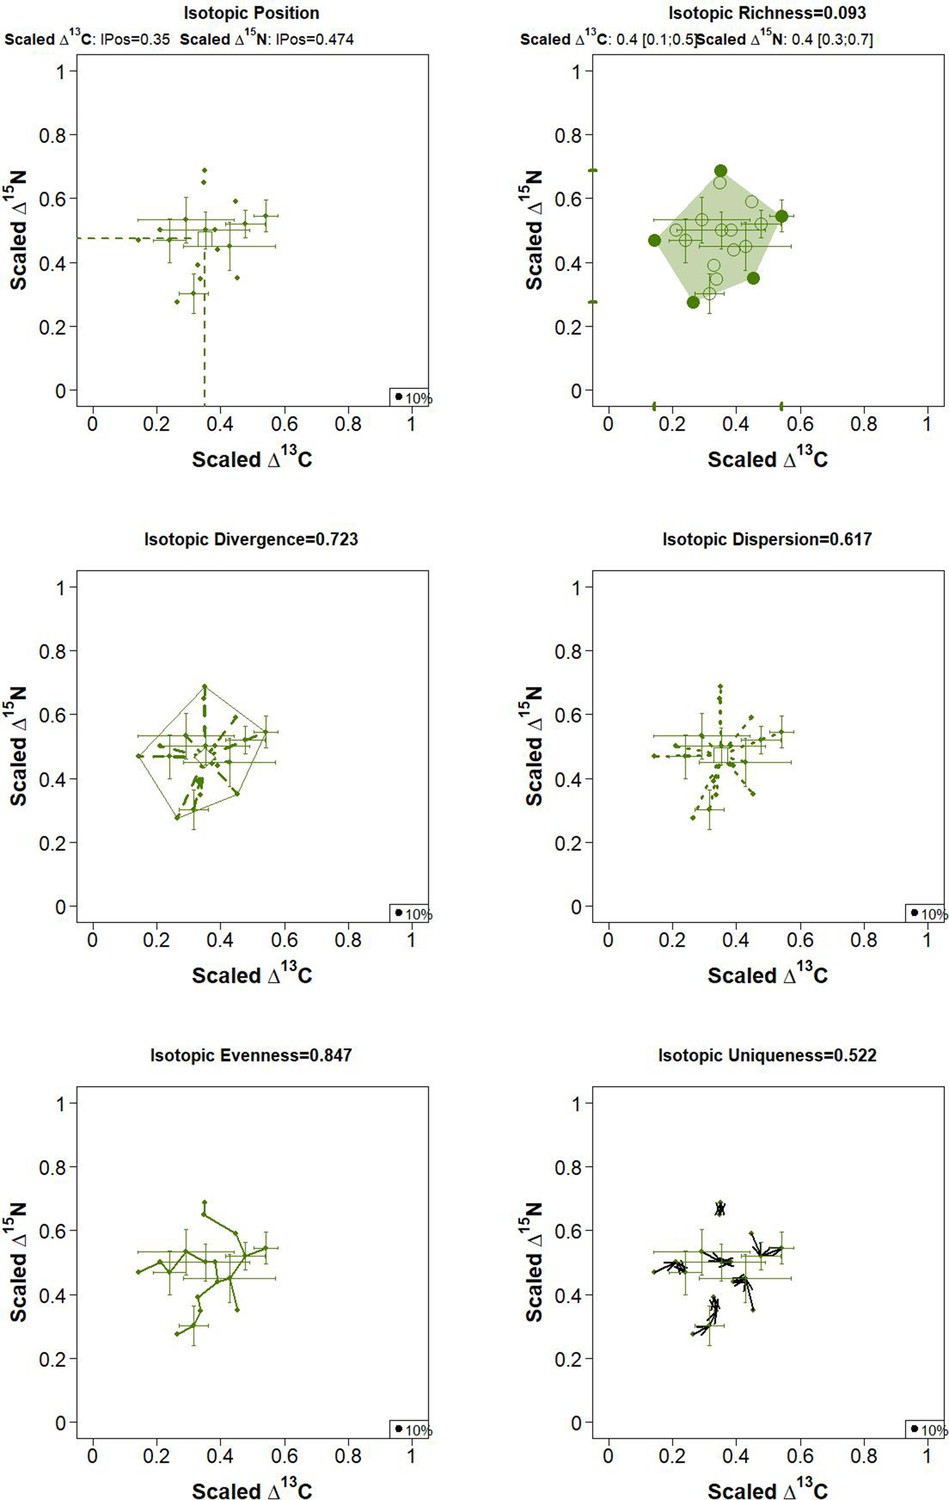
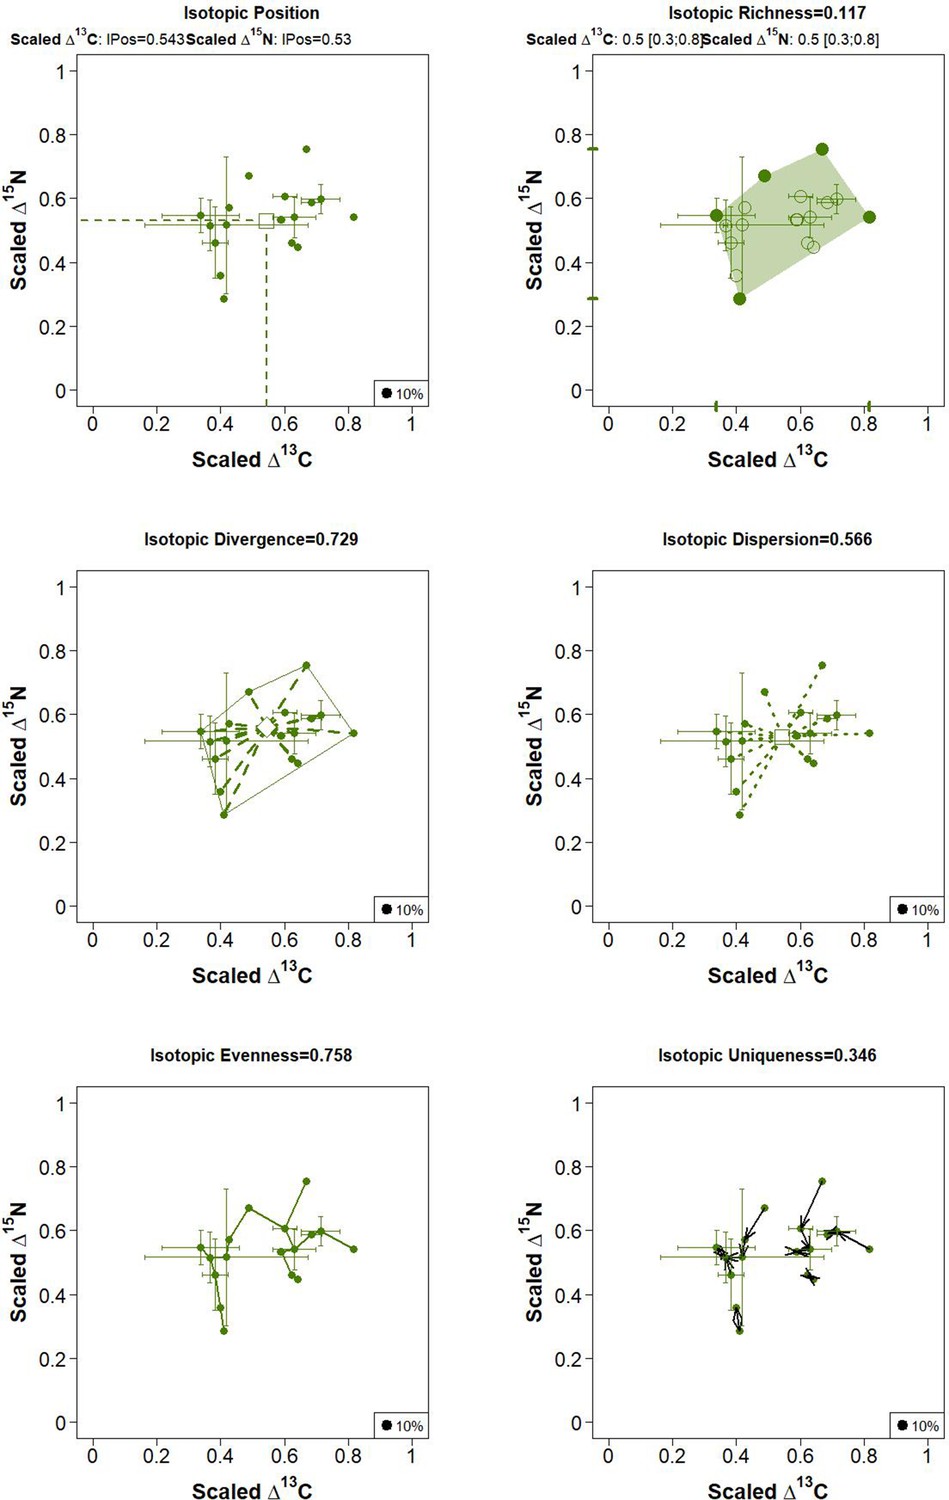
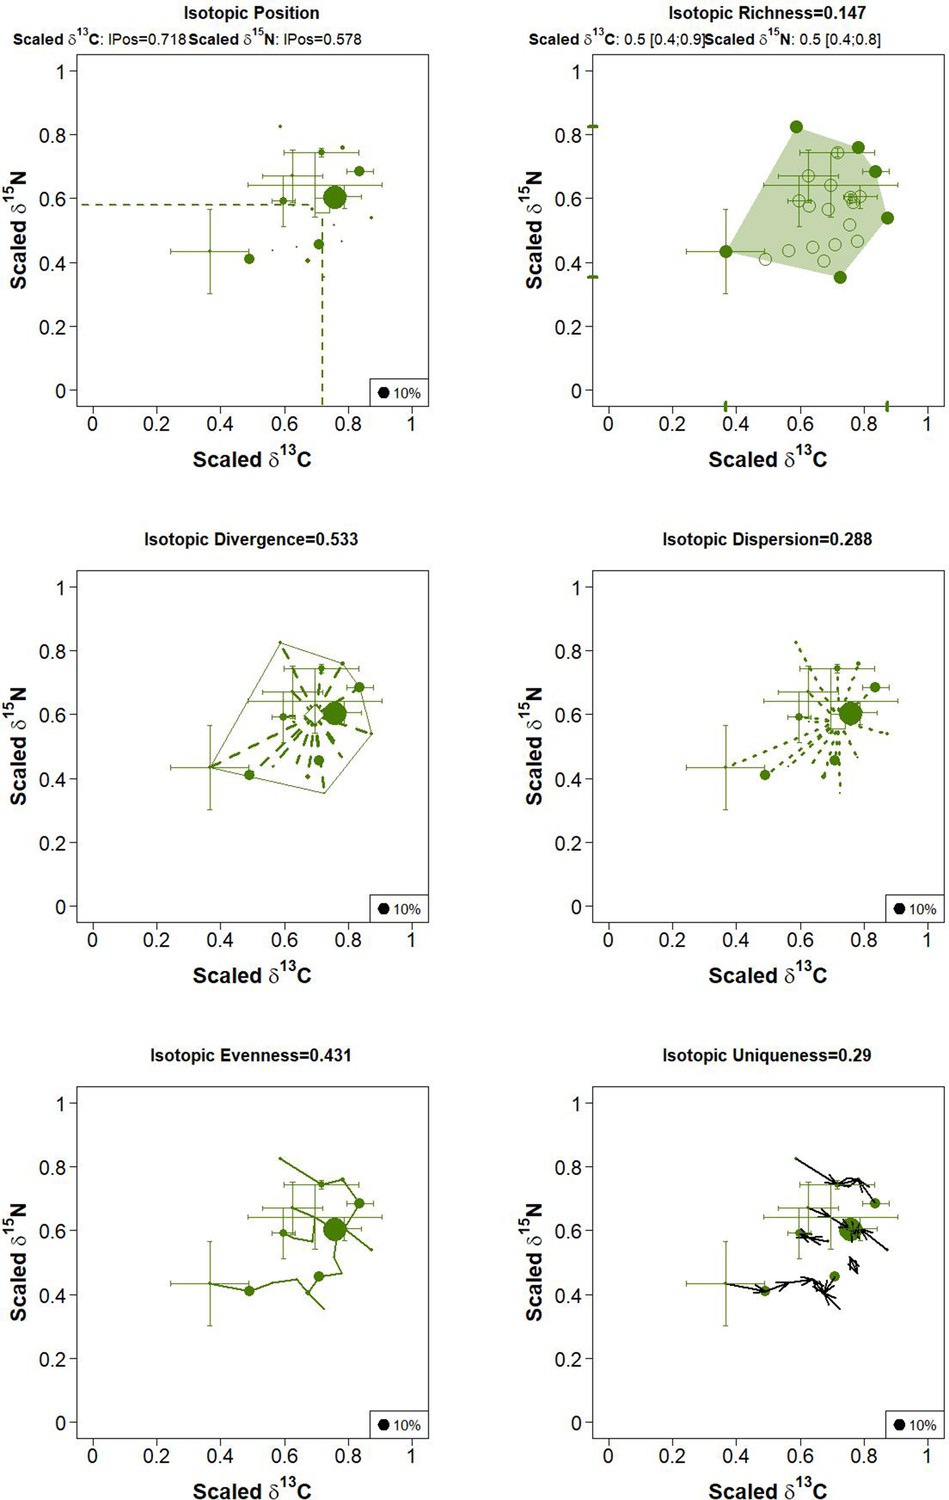
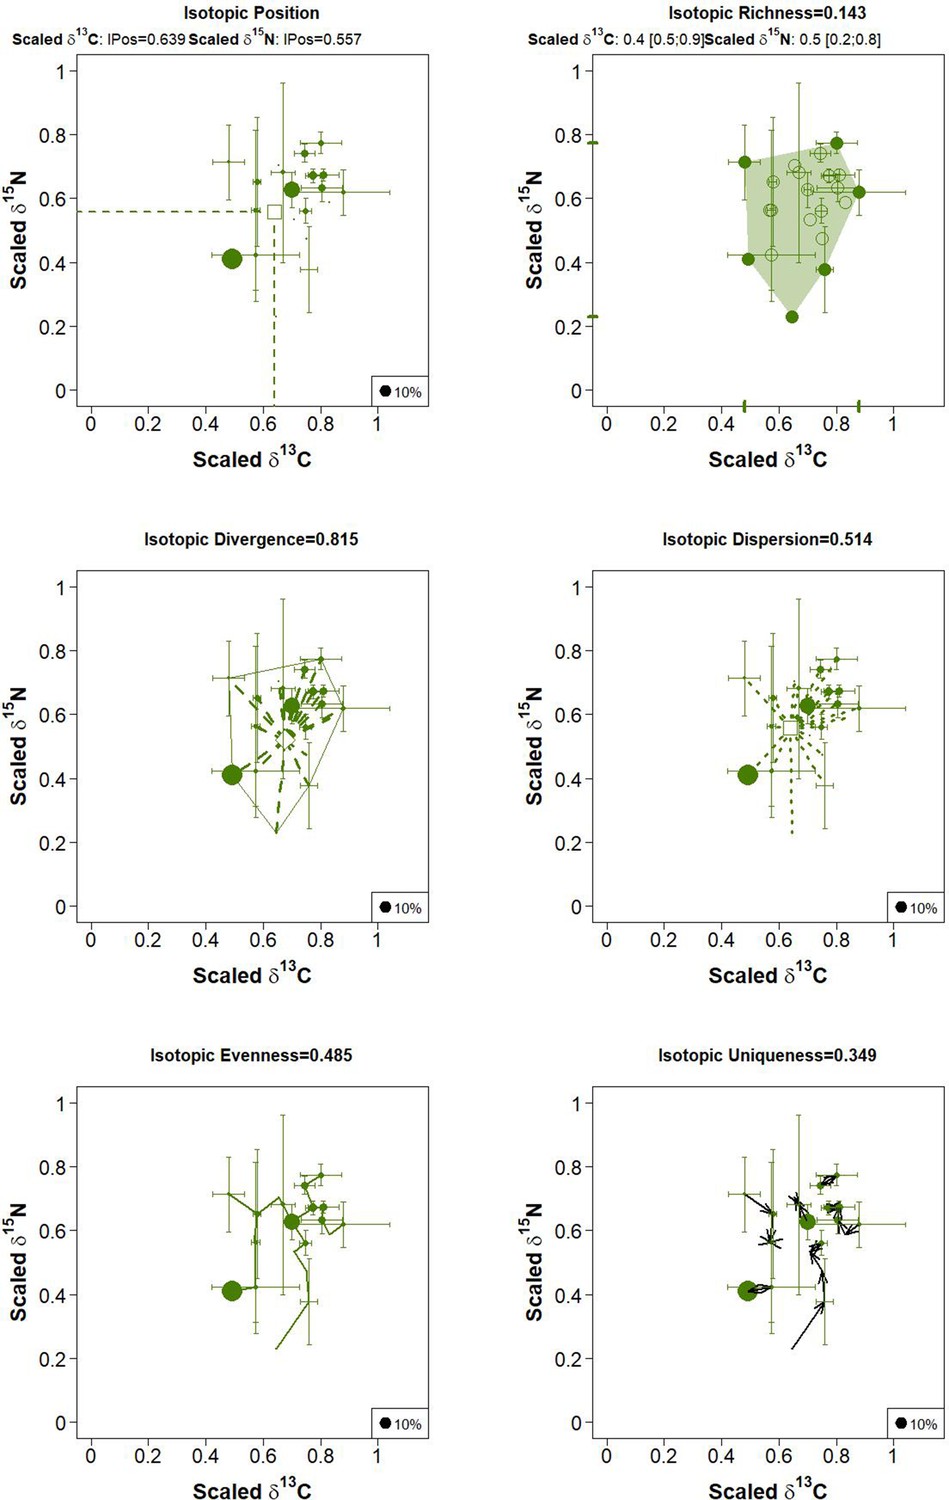
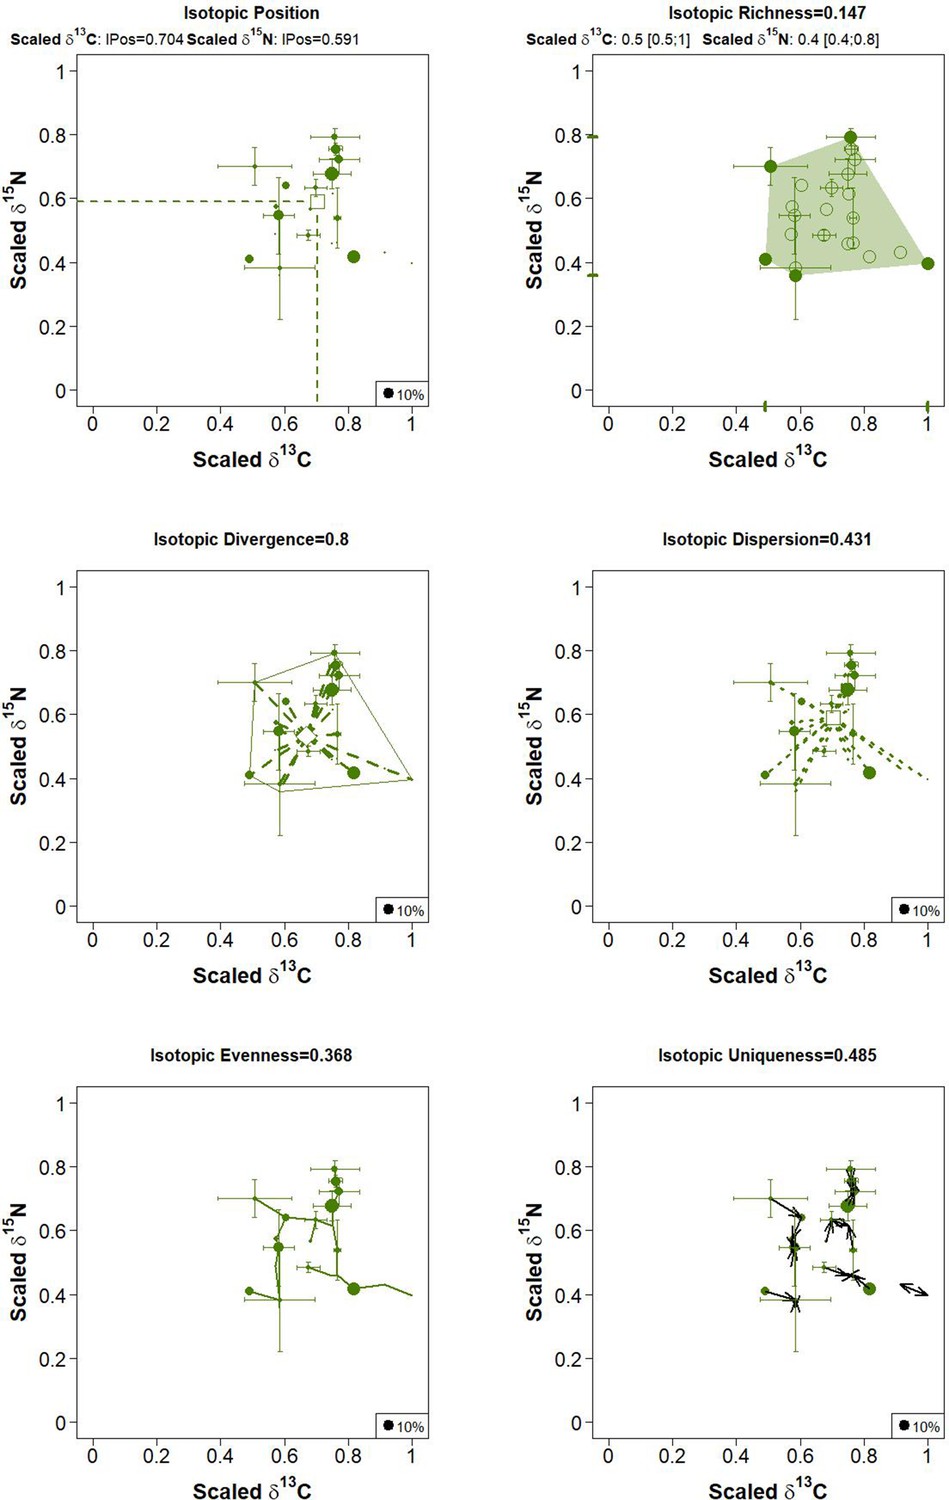
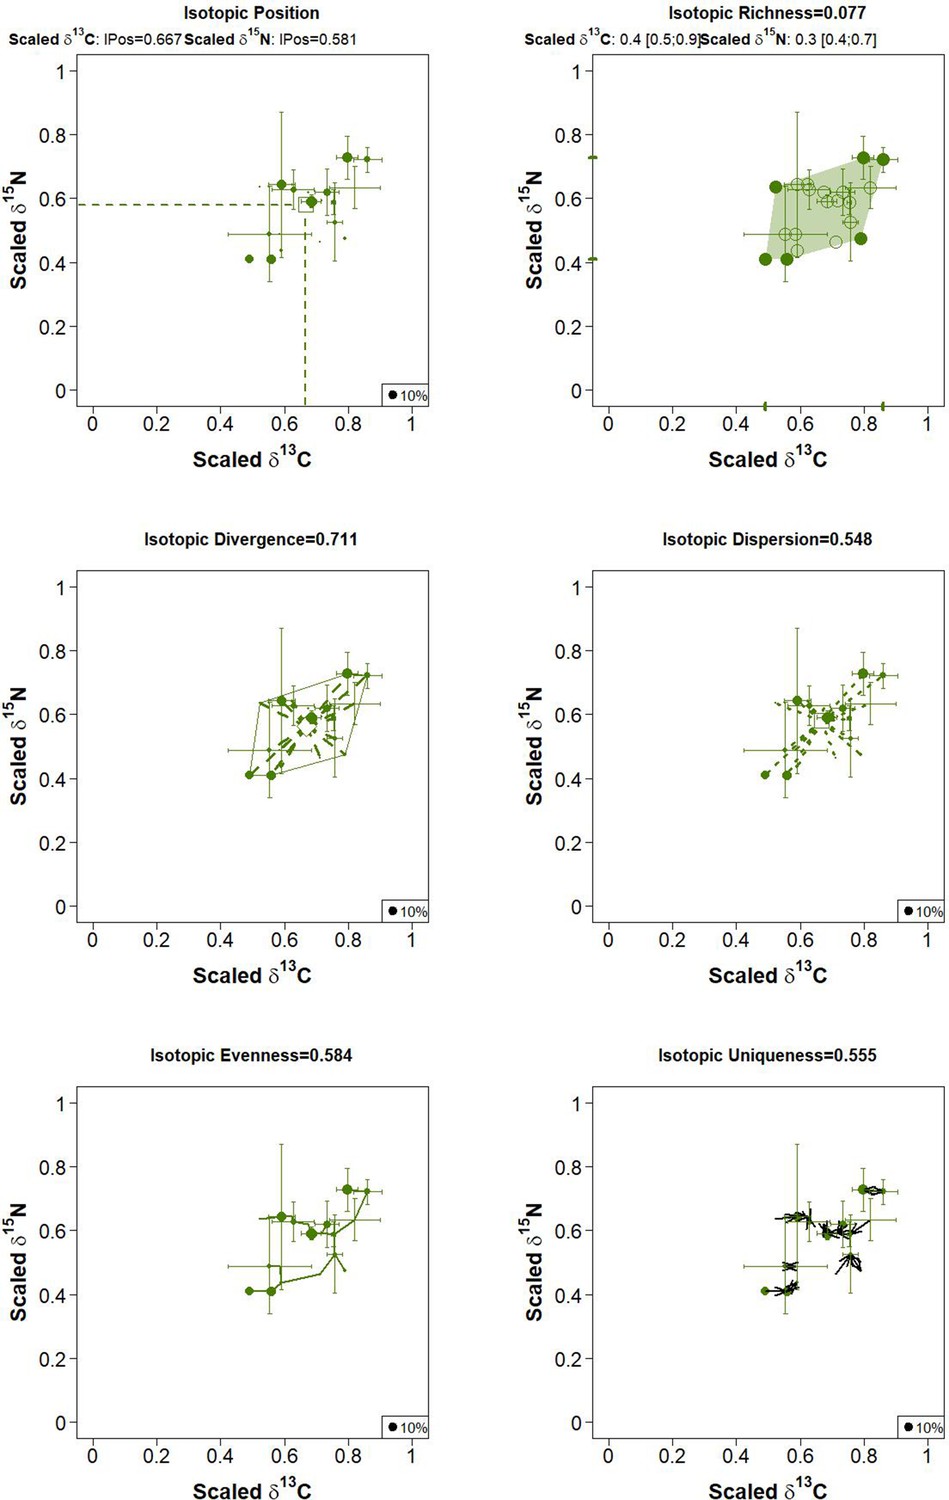
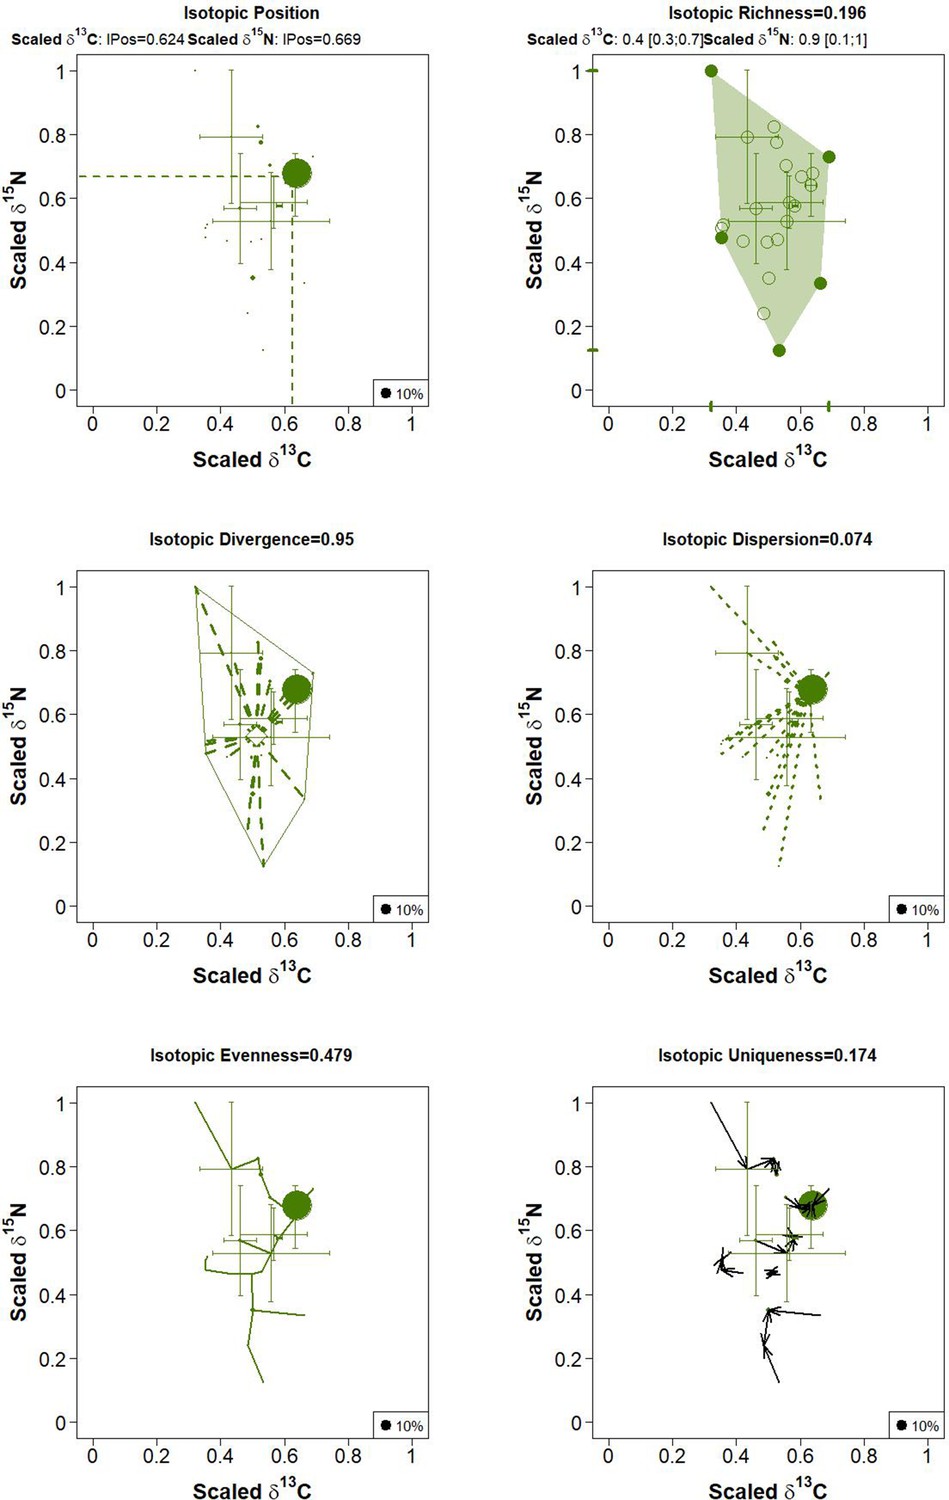
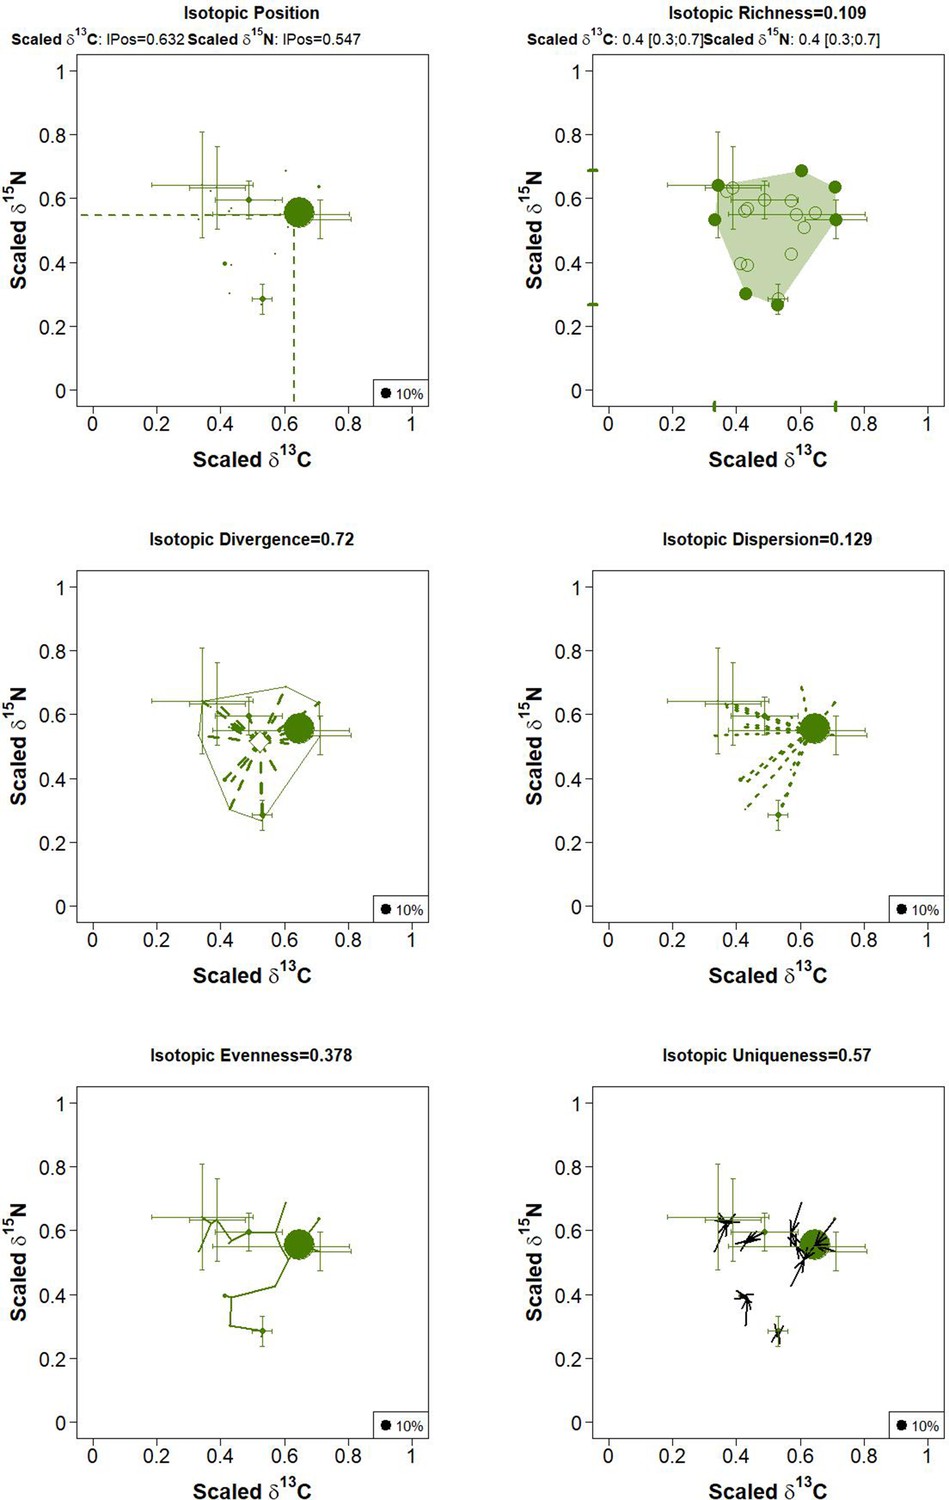
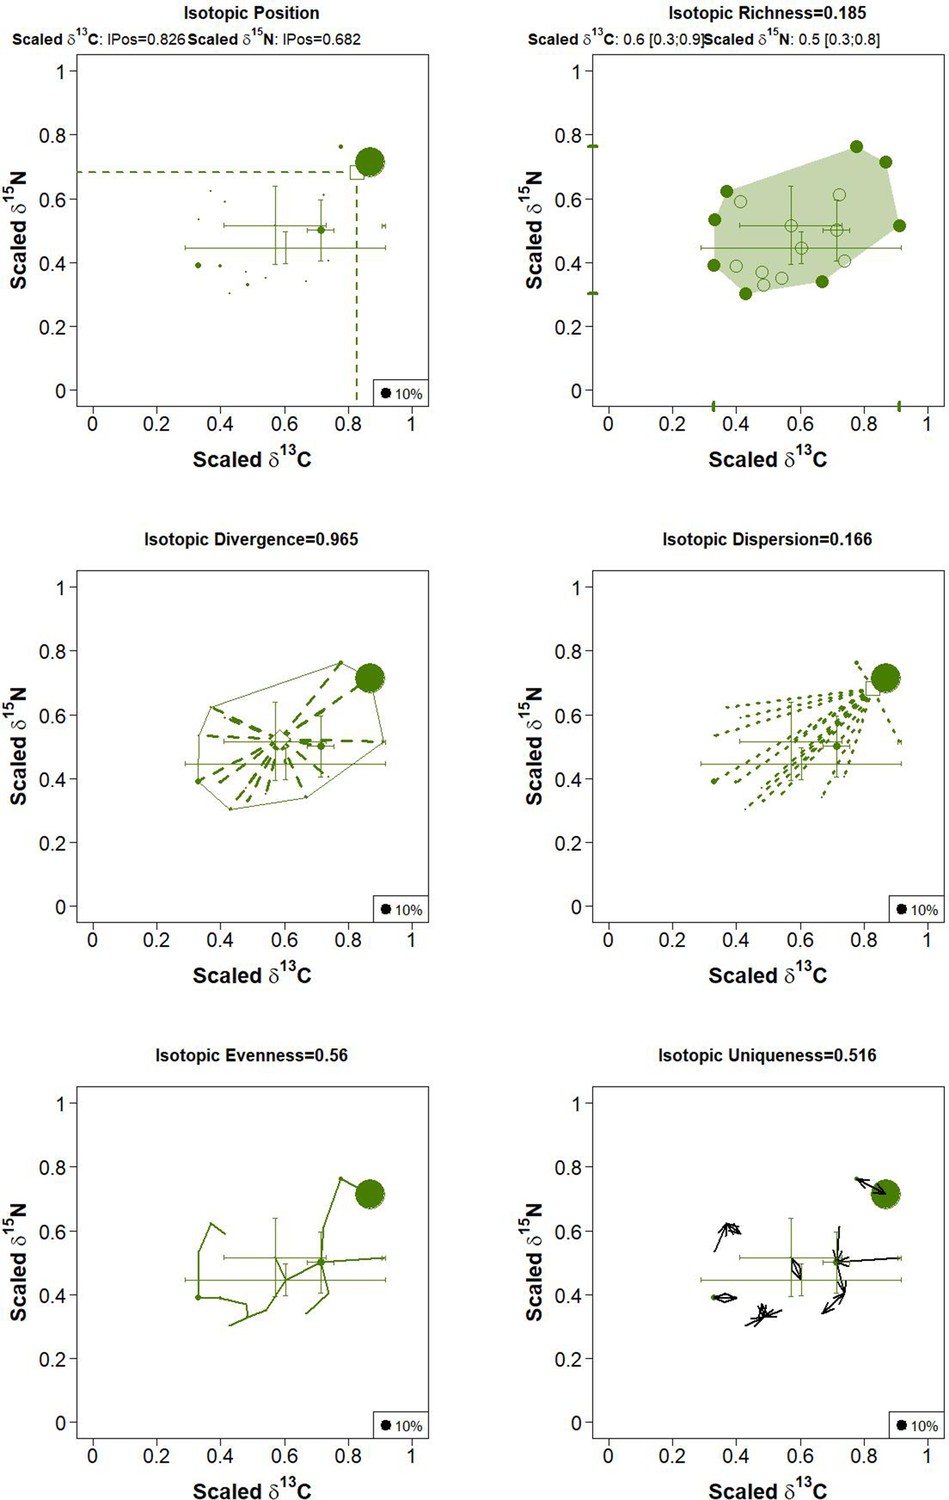
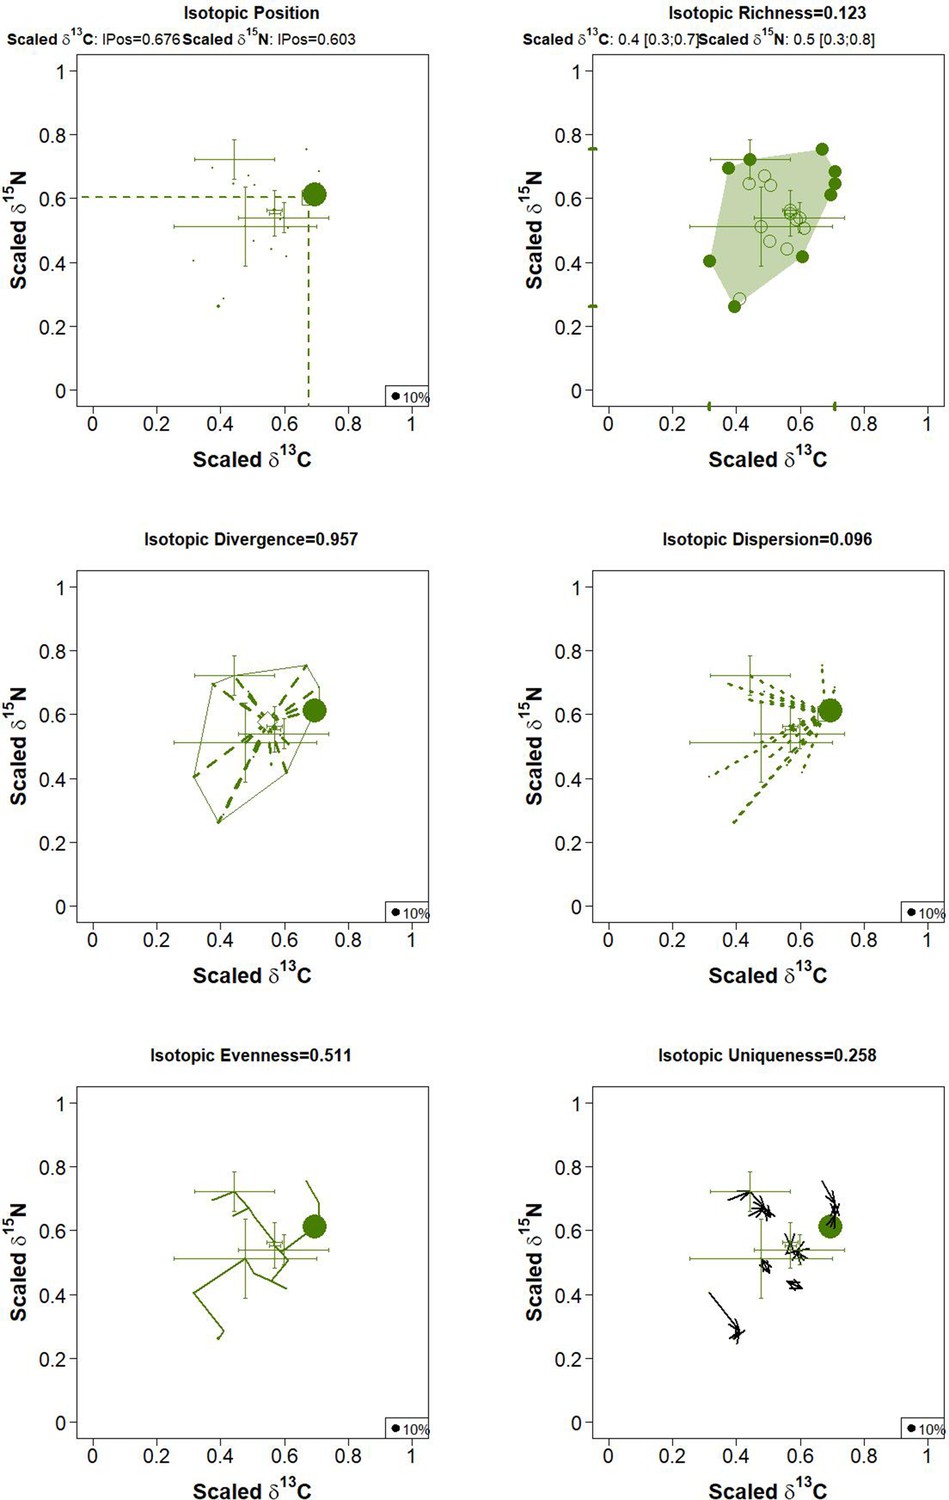
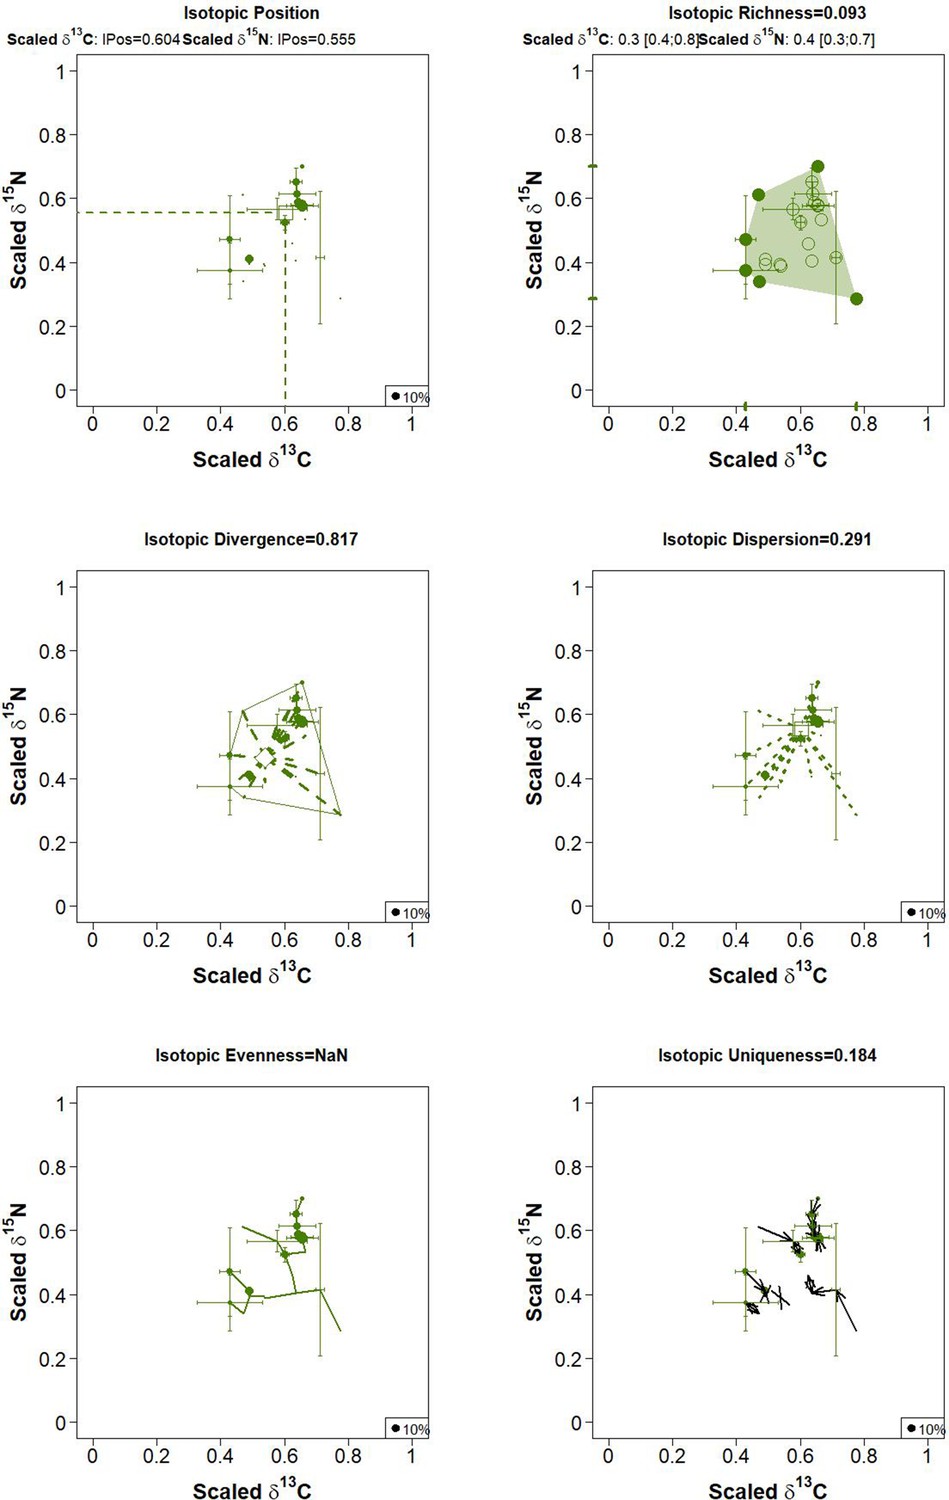
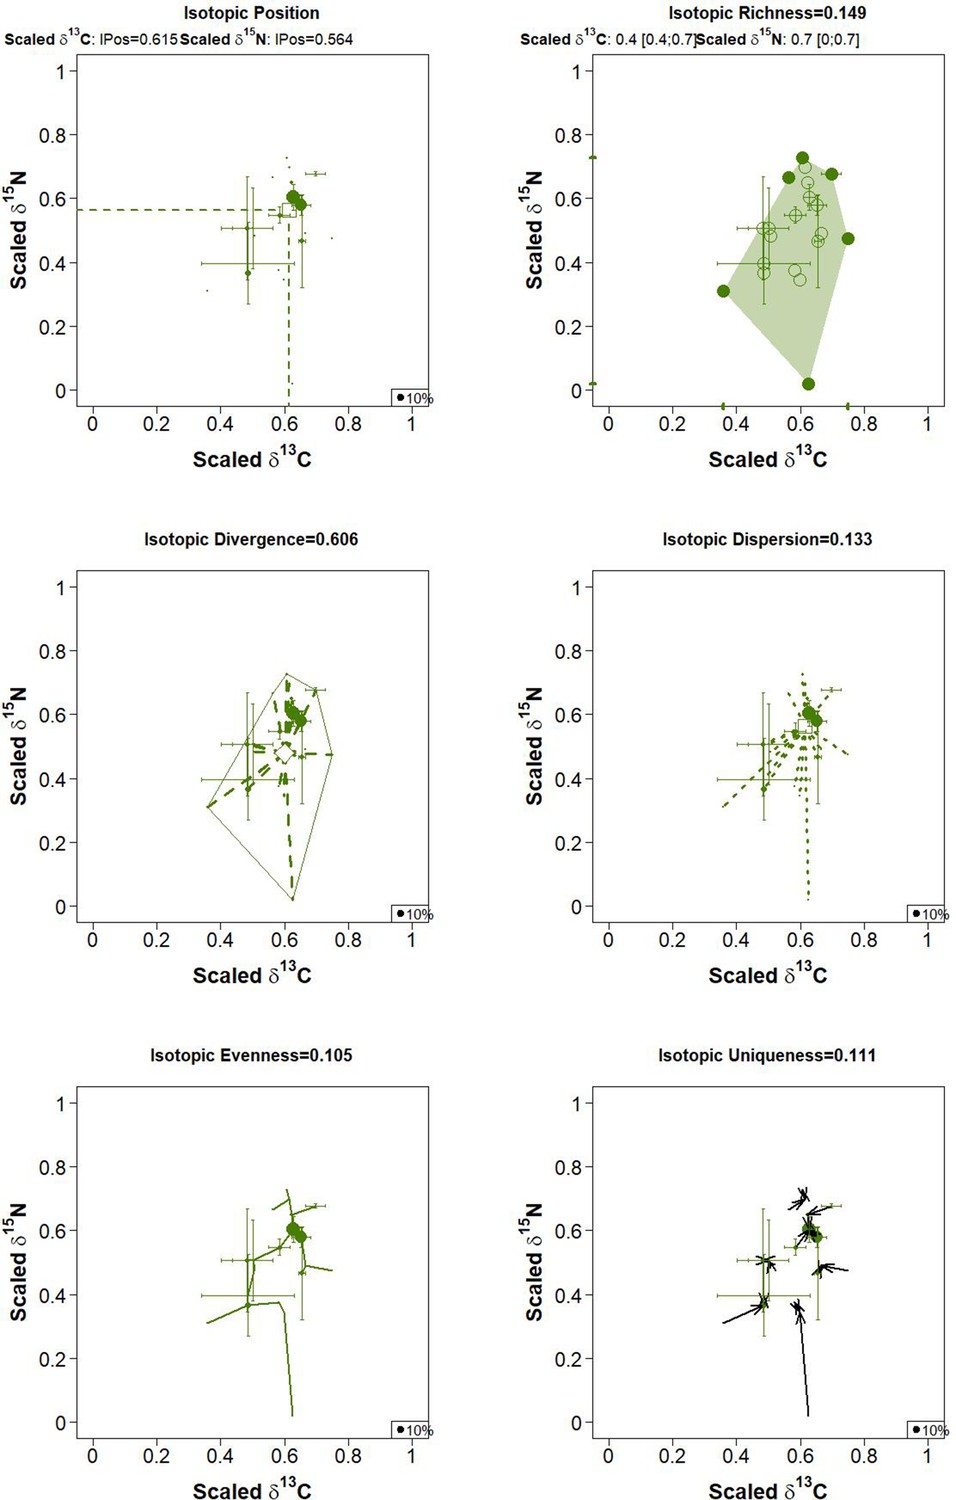
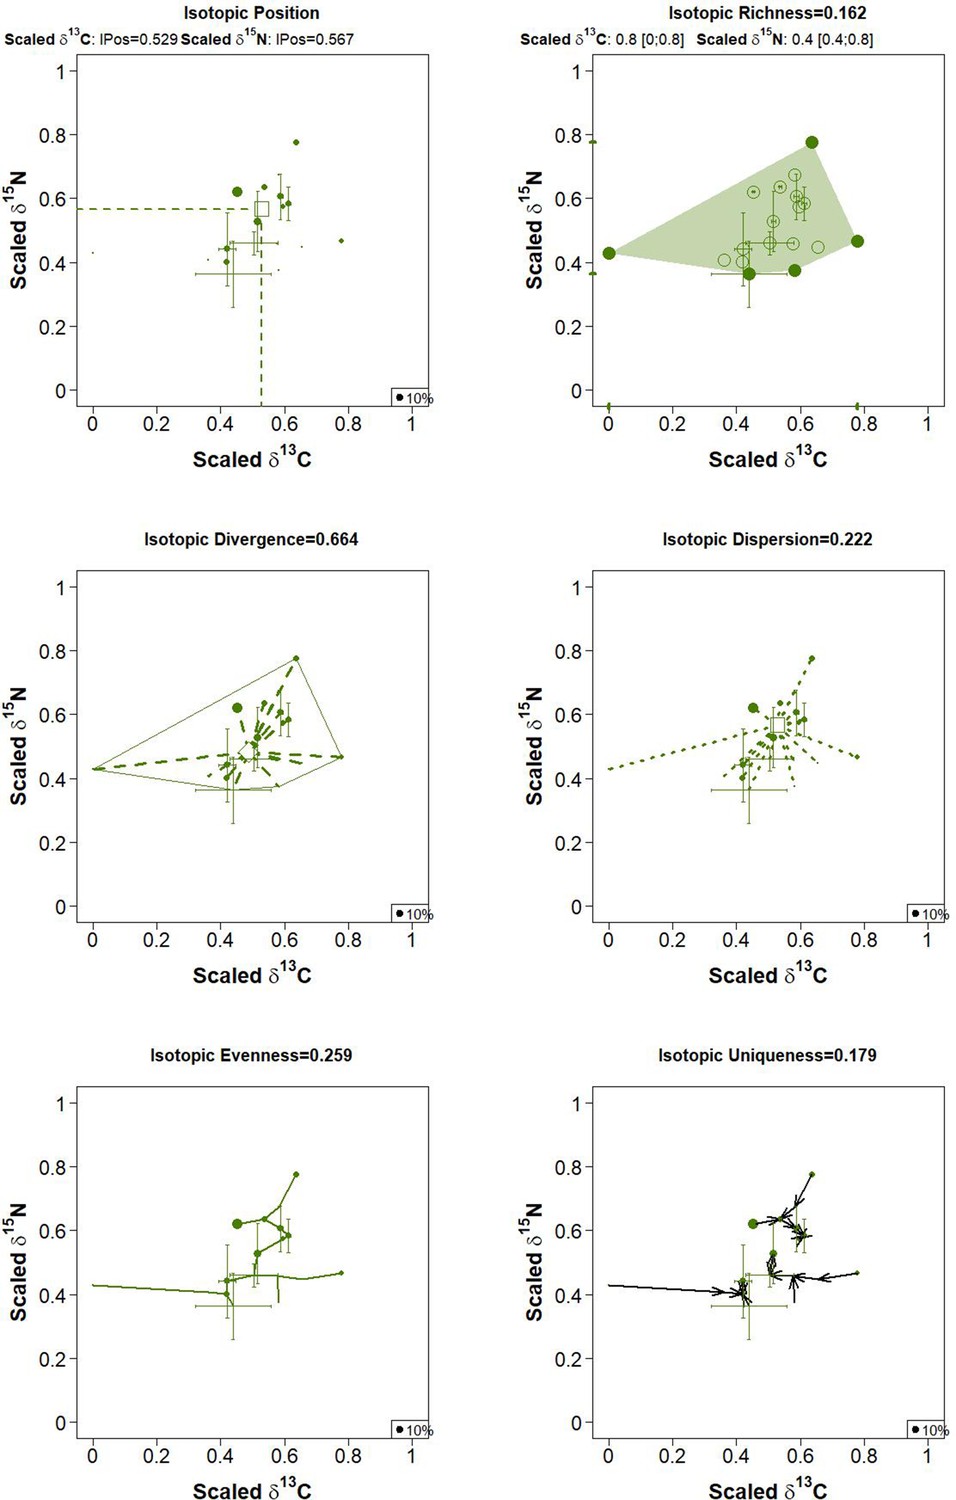
Figure 4 with 64 supplements
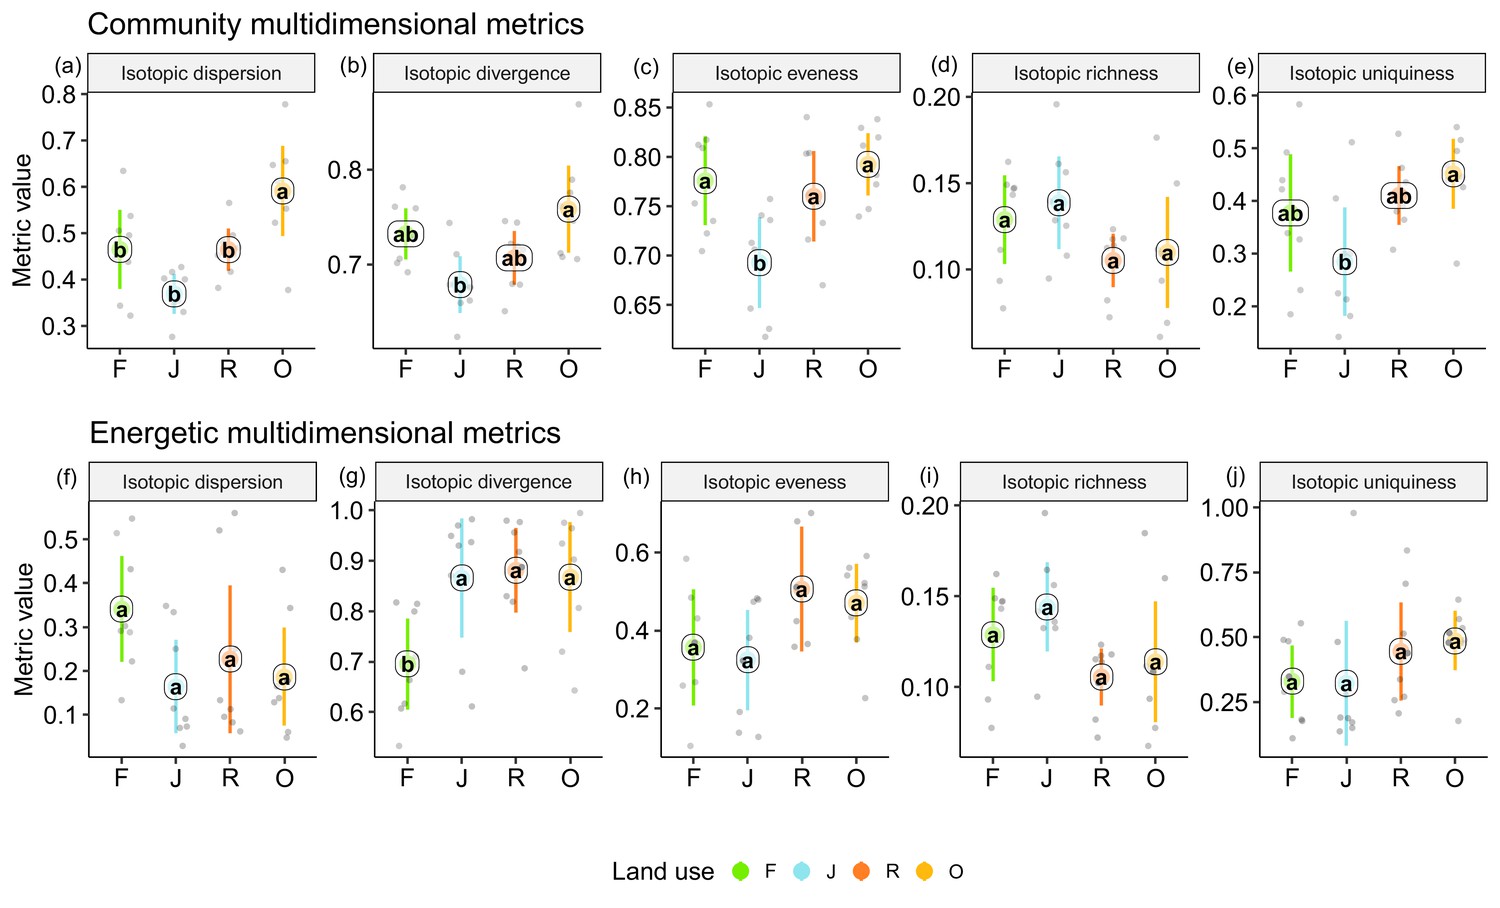
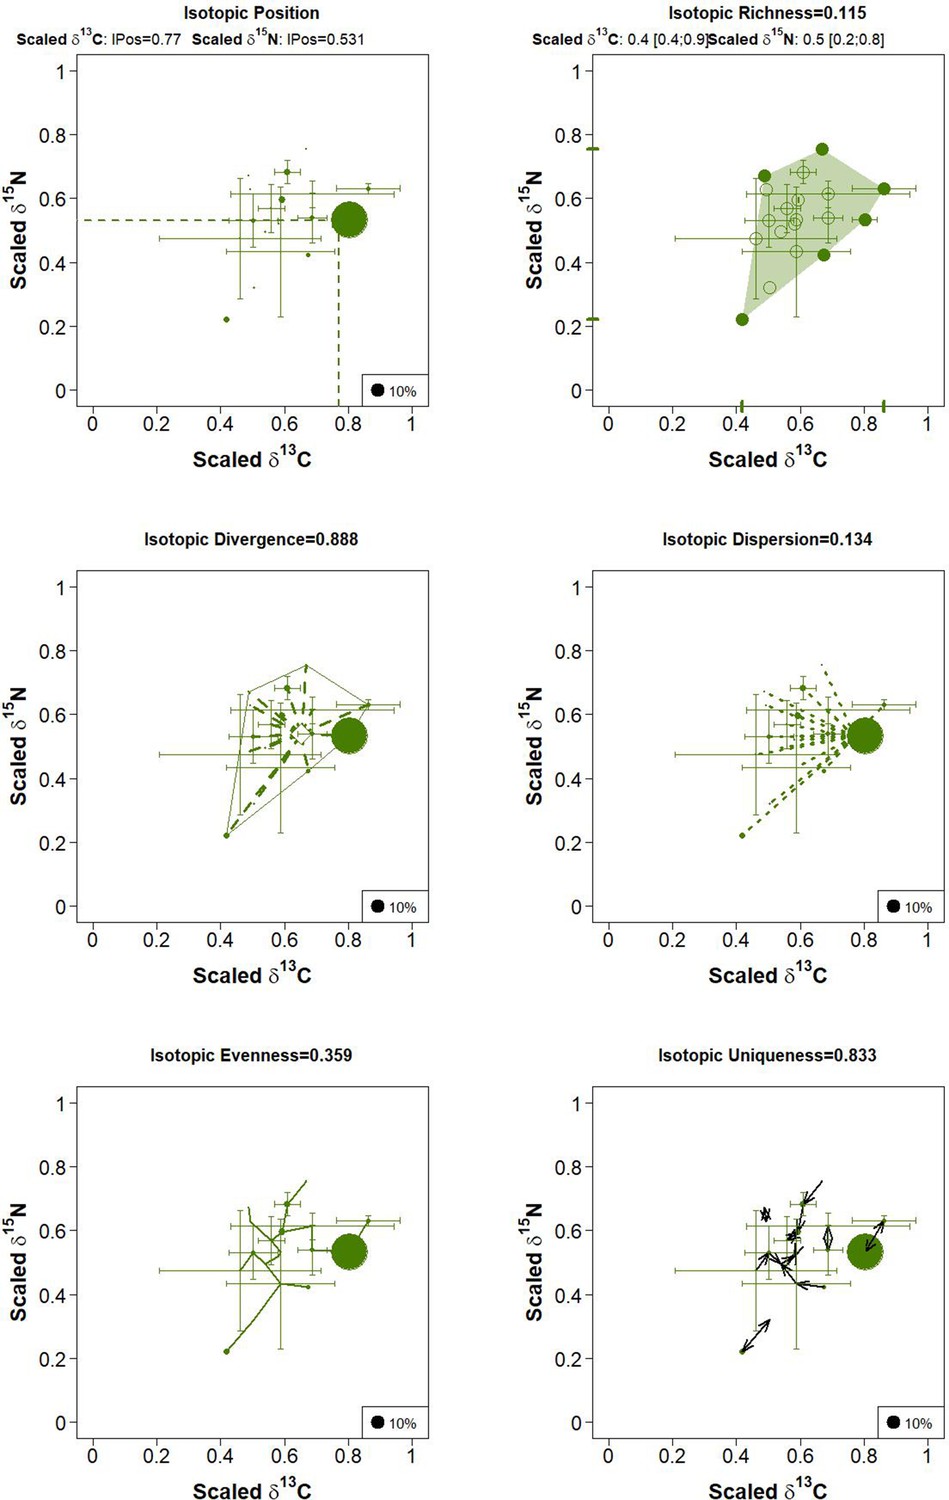
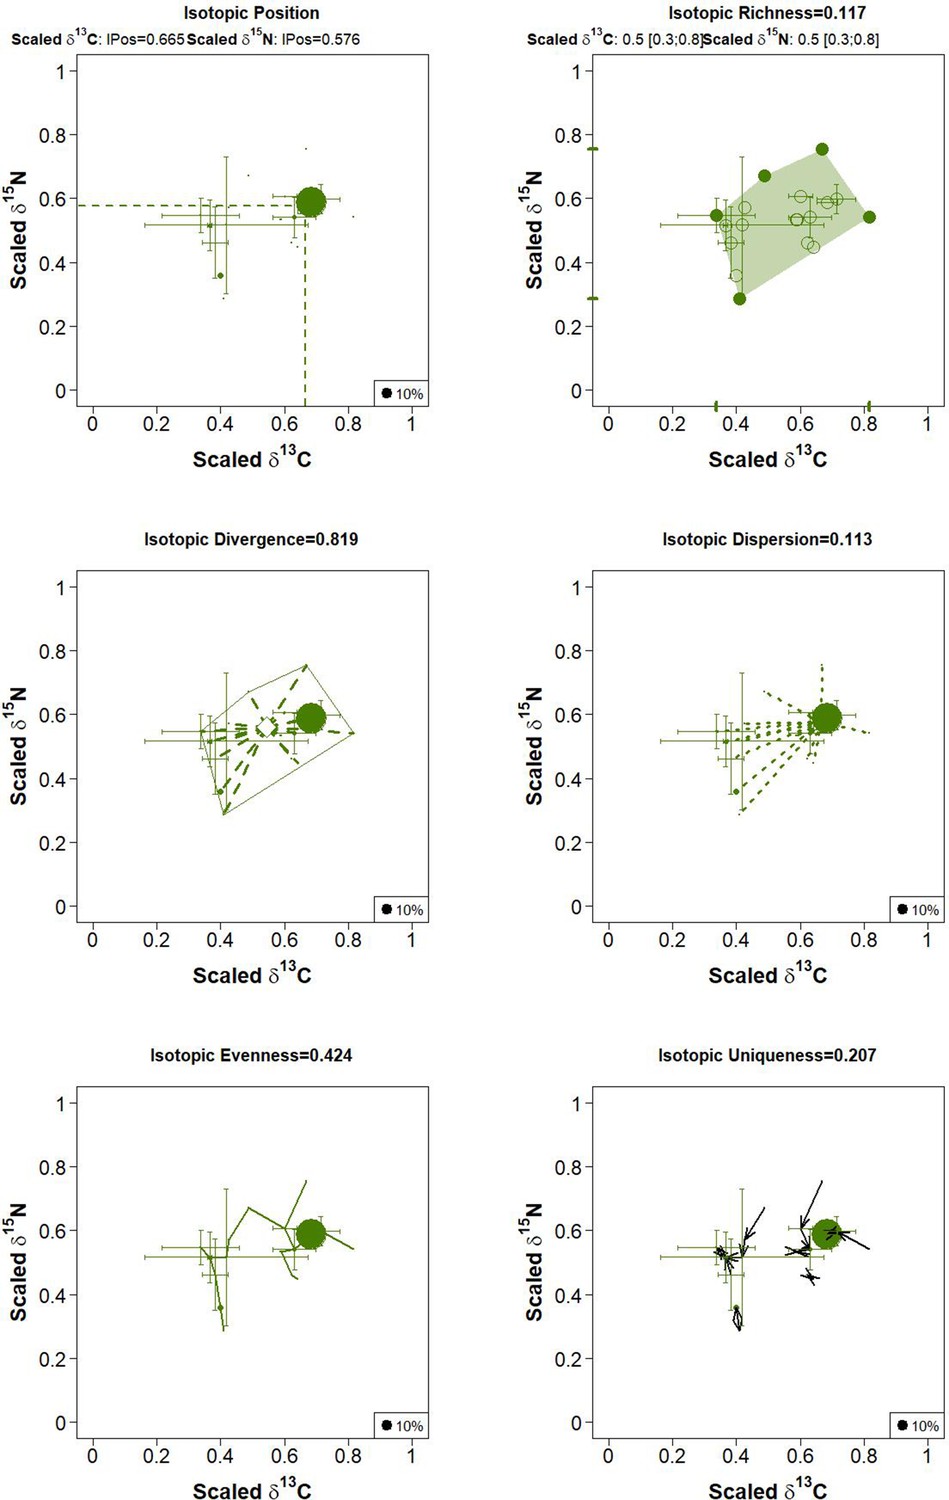
Multidimensional isotopic metrics of soil animal communities in rainforest (F, green), jungle rubber (J, blue), rubber (R, red), and oil palm plantations (O, yellow).
Community (upper panel) and energetic metrics (lower panel) are shown. Each point represents one community (n = 8 per land-use system). Means sharing the same letter within each pane are not significantly different (Tukey’s HSD test following ANOVA, p < 0.05).
-
Figure 4—source data 1
Community metrics of soil food webs in each plot.
- https://cdn.elifesciences.org/articles/75428/elife-75428-fig4-data1-v3.csv
-
Figure 4—source data 2
Energetic metrics of soil food webs in each plot.
- https://cdn.elifesciences.org/articles/75428/elife-75428-fig4-data2-v3.csv
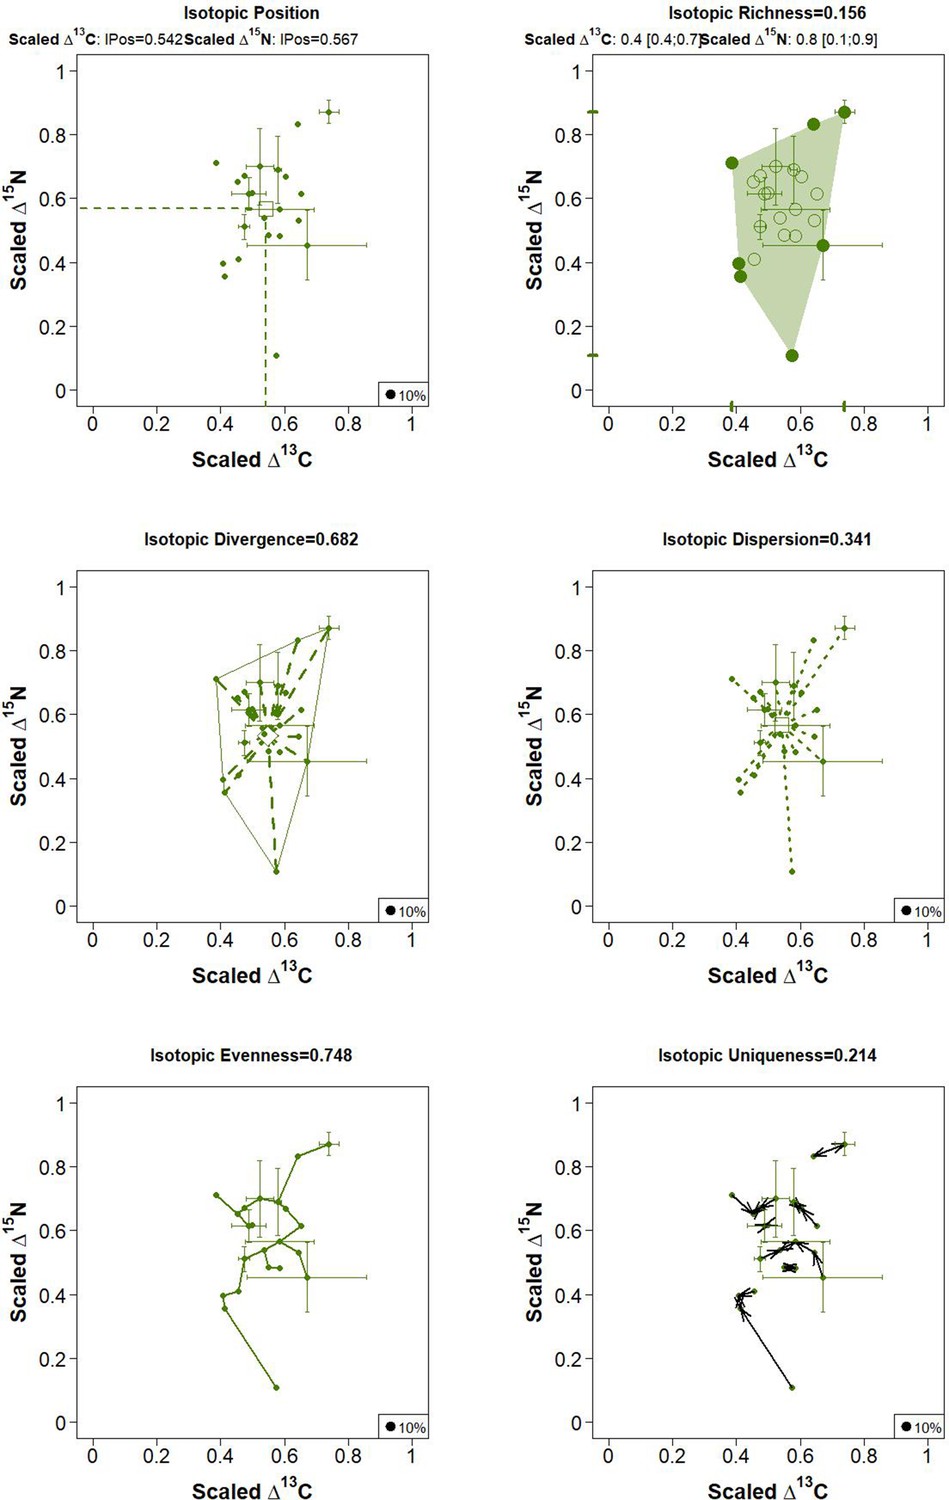
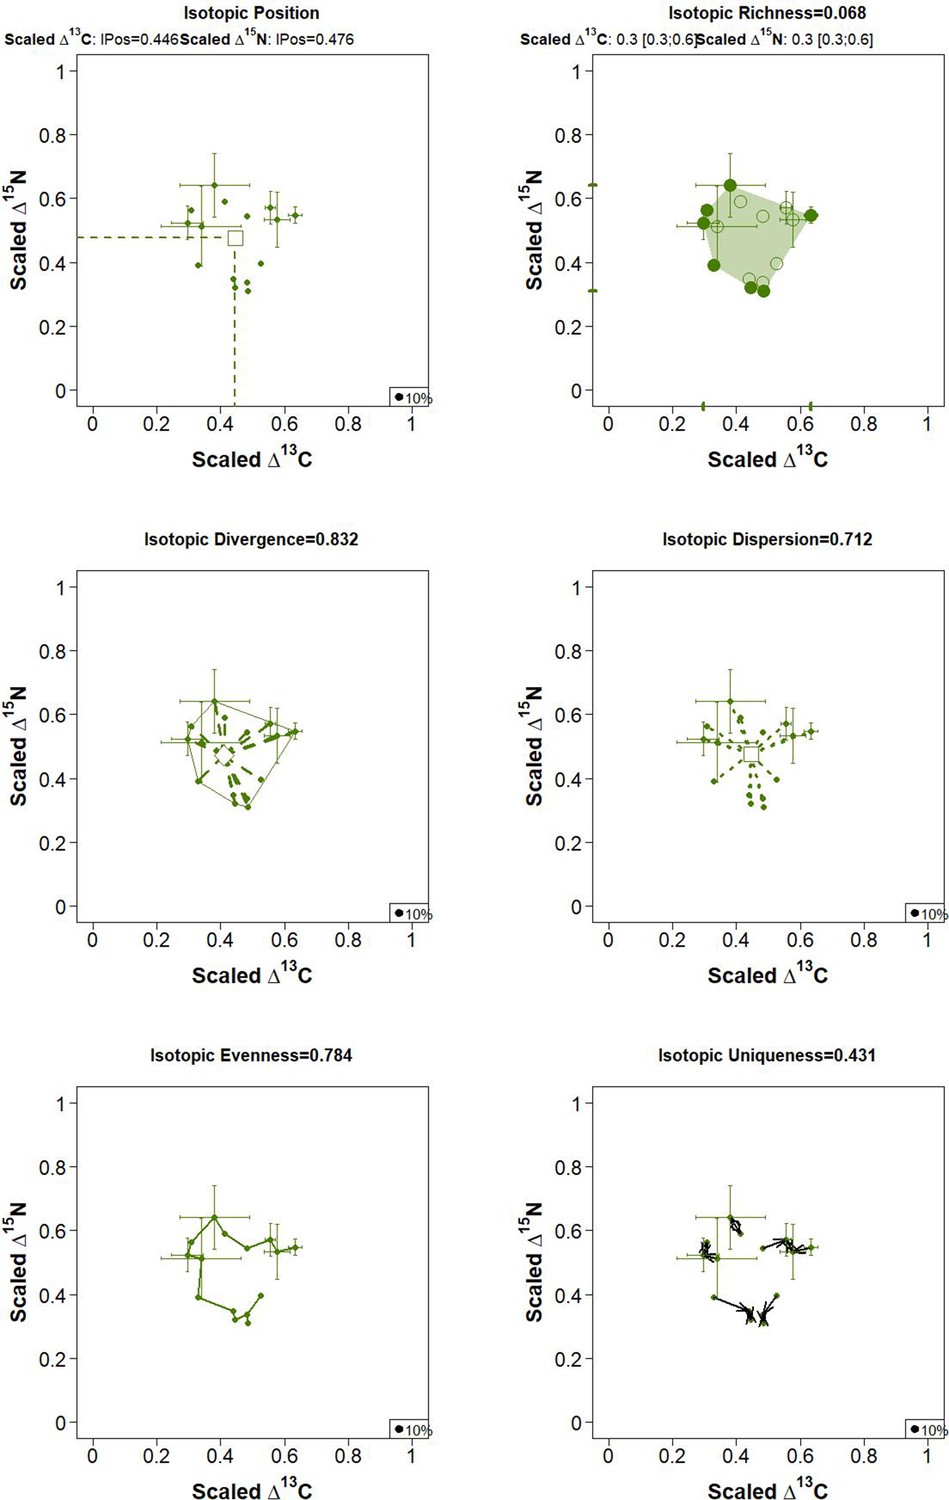
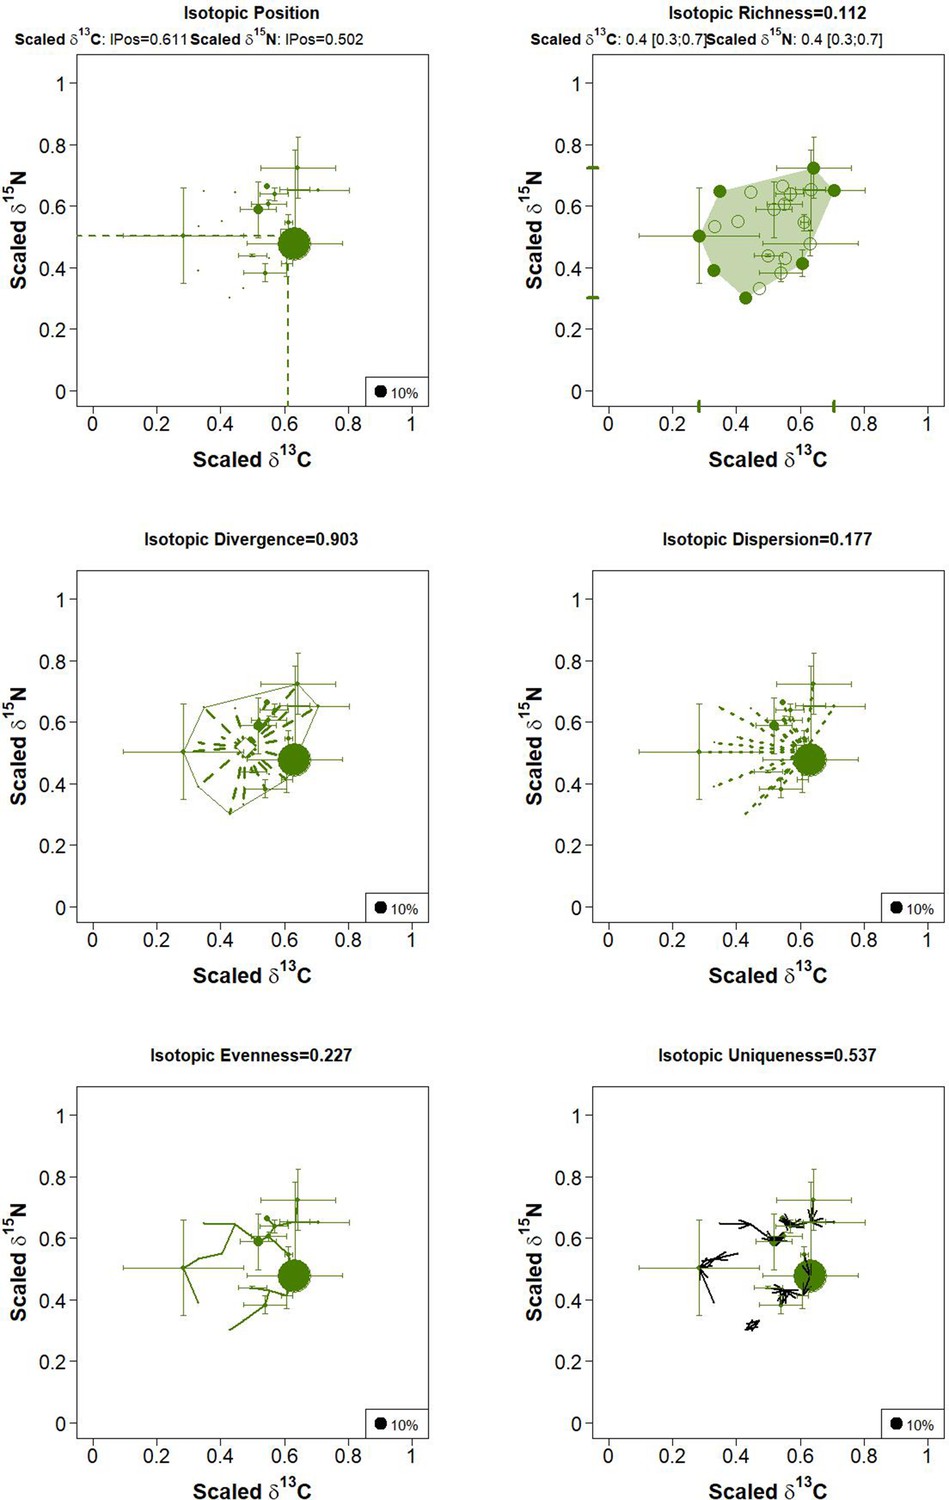
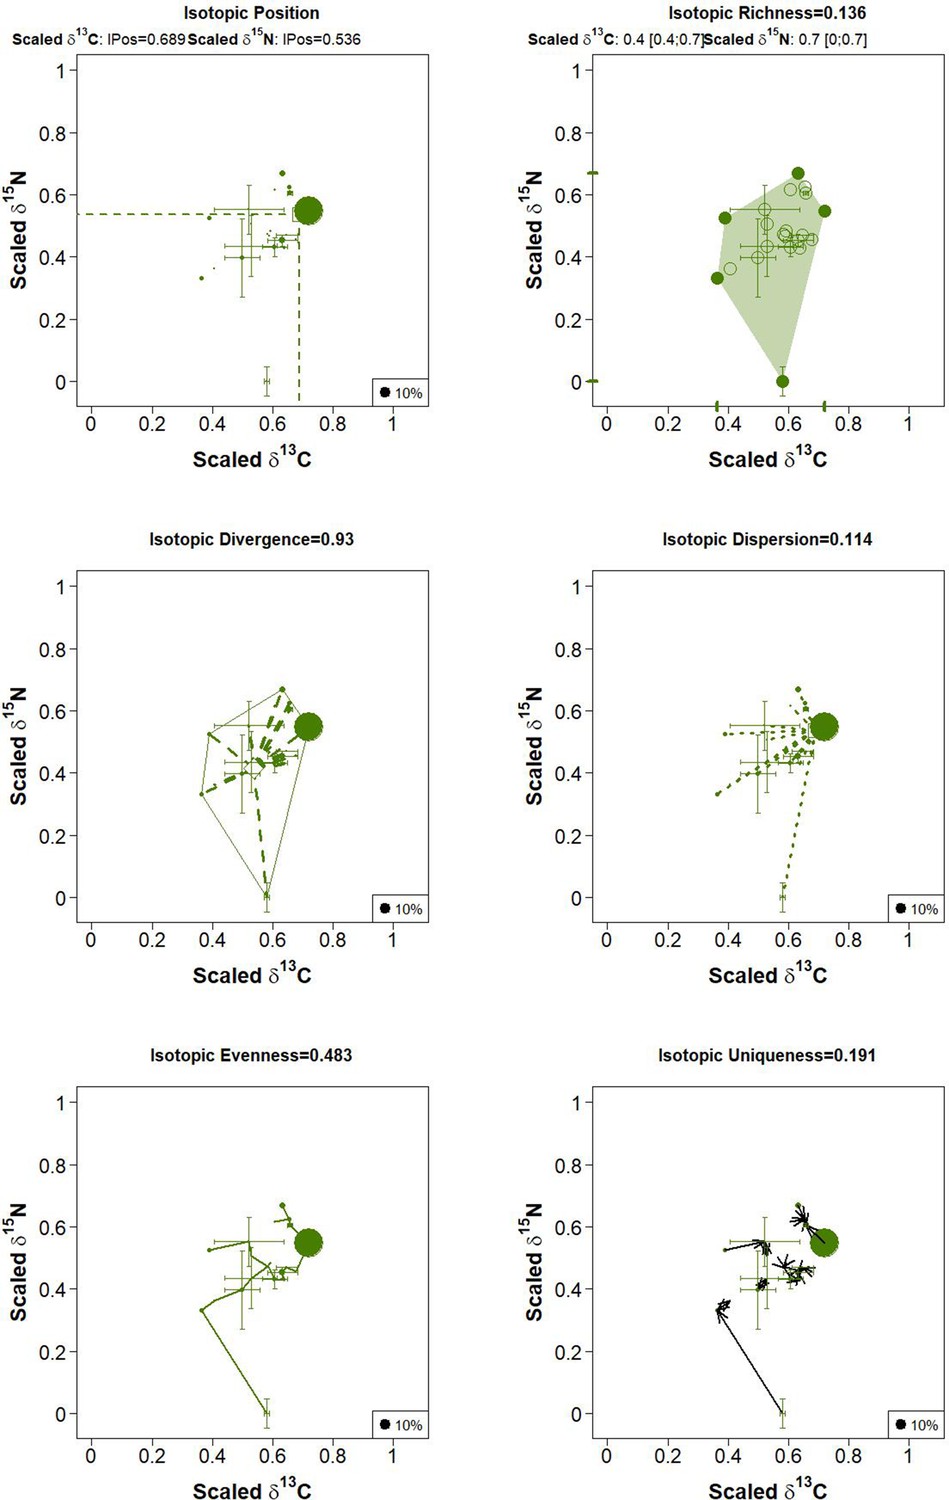
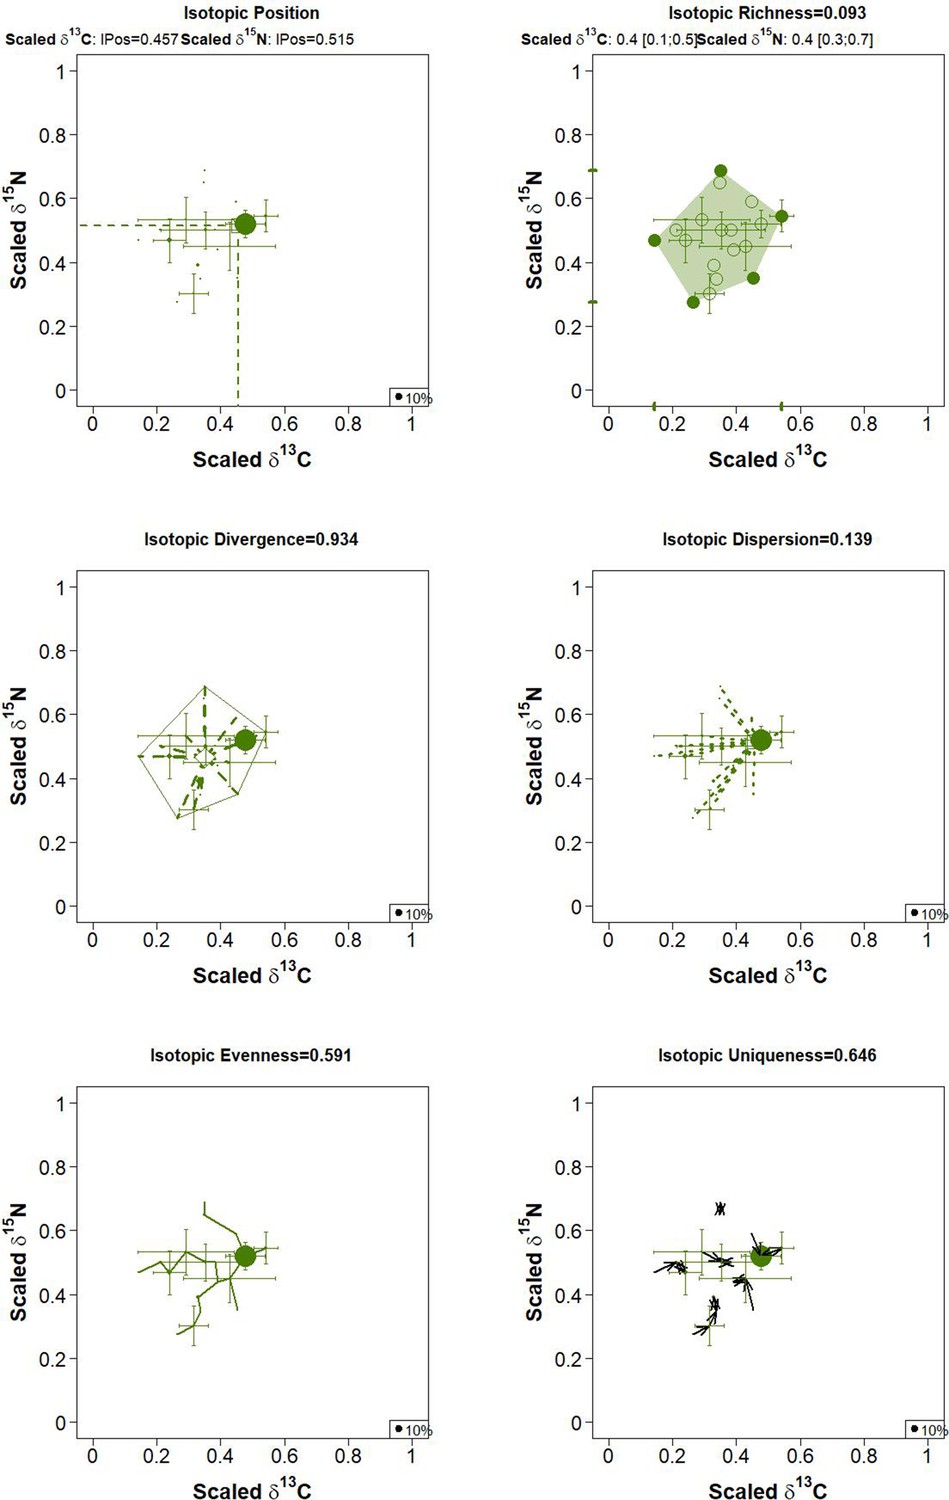
Figure 4—figure supplement 1
Multidimensional community metrics of soil food webs in forest (plot BF1).
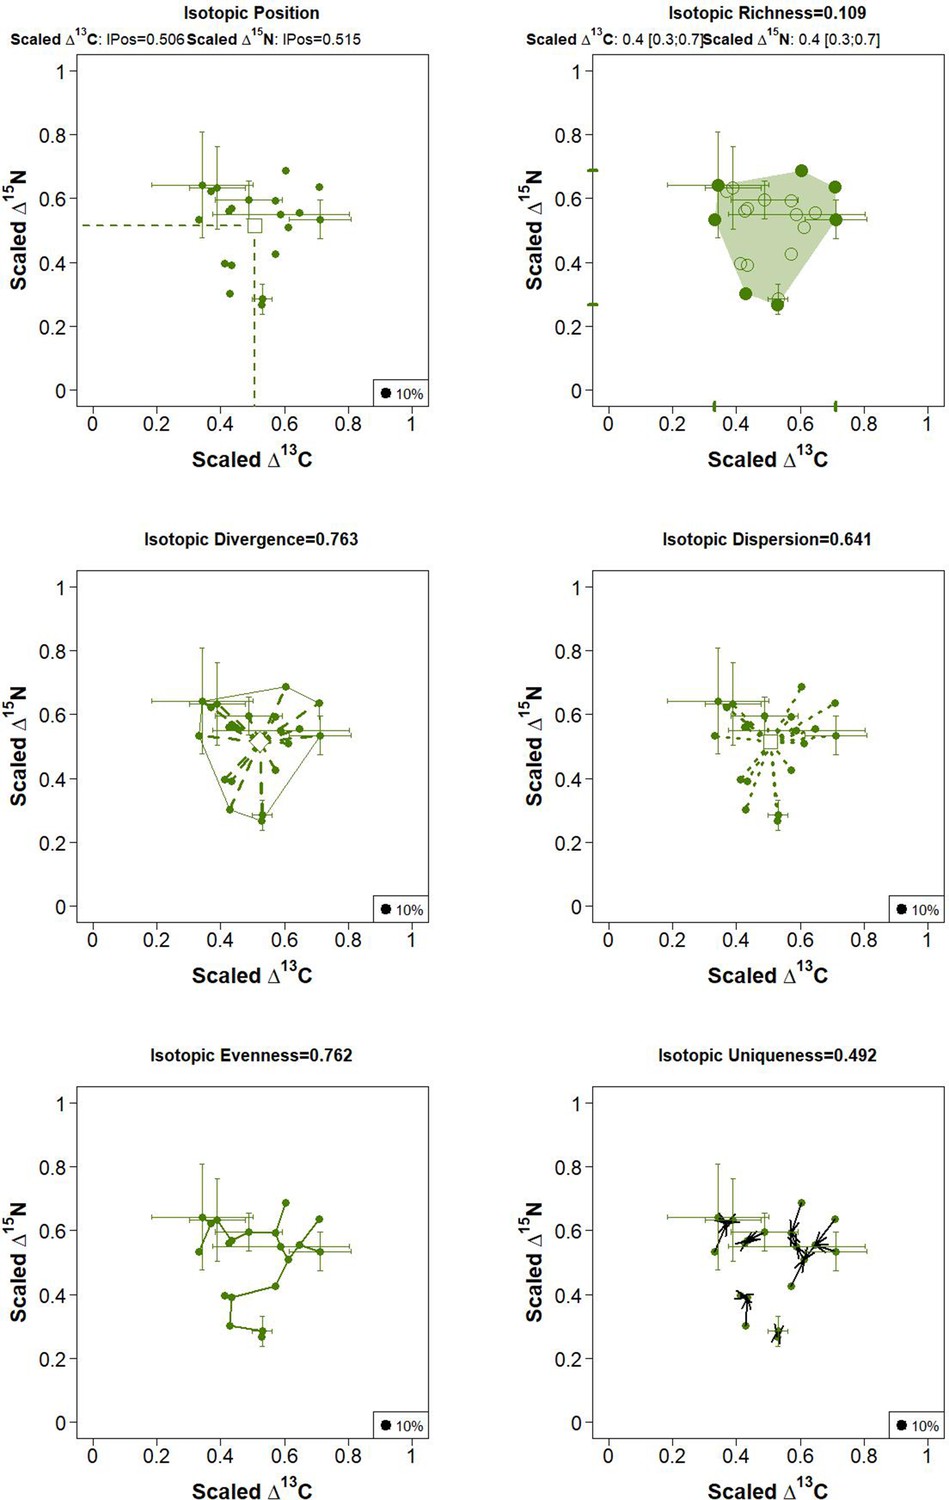
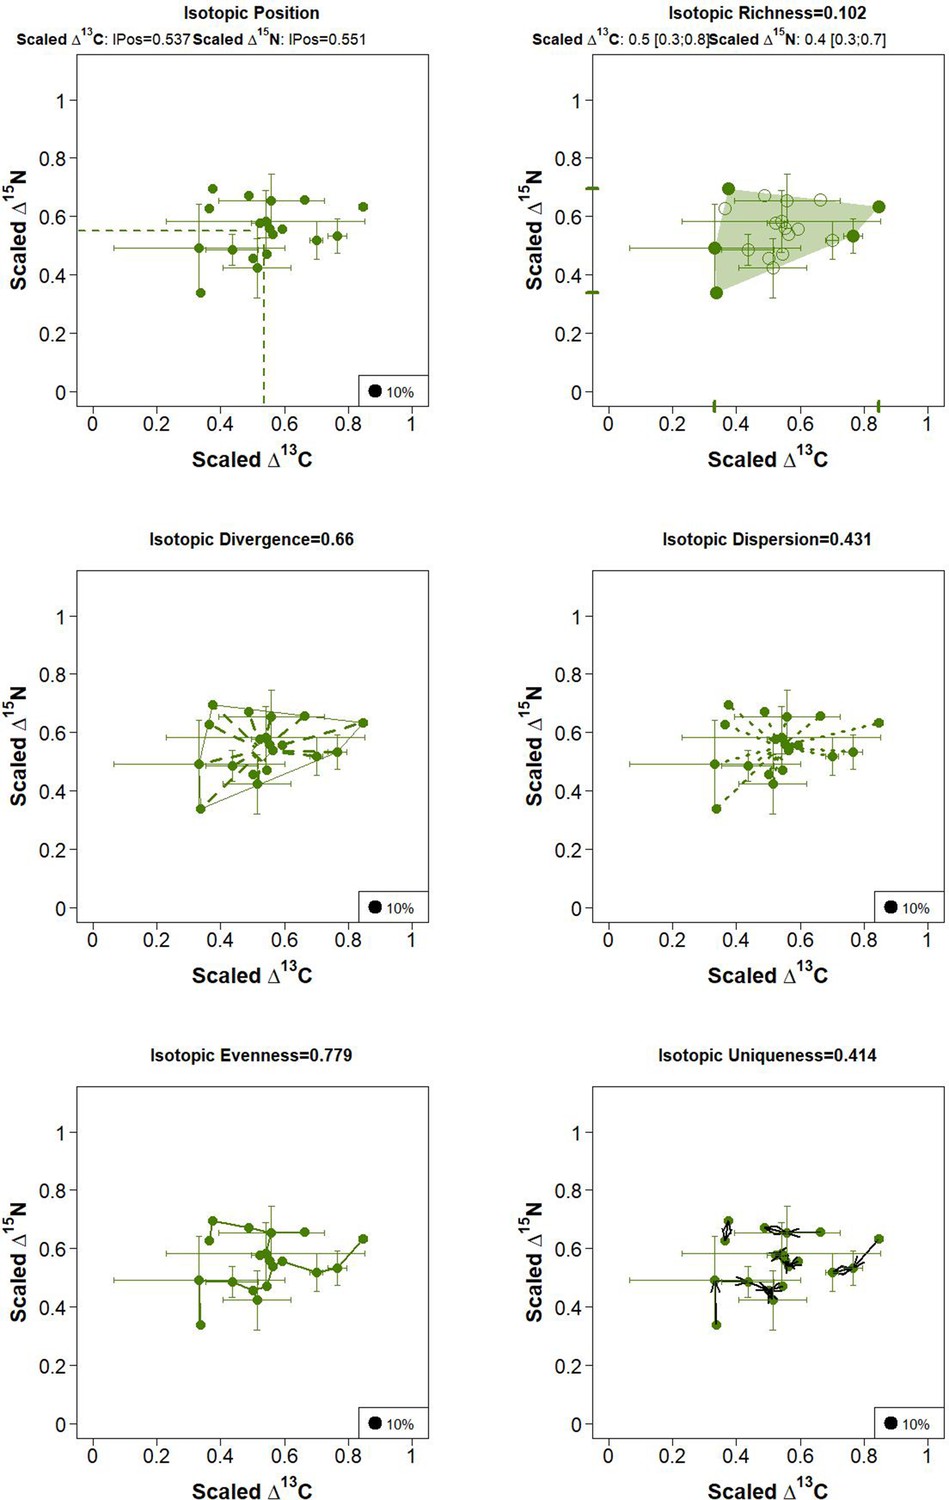
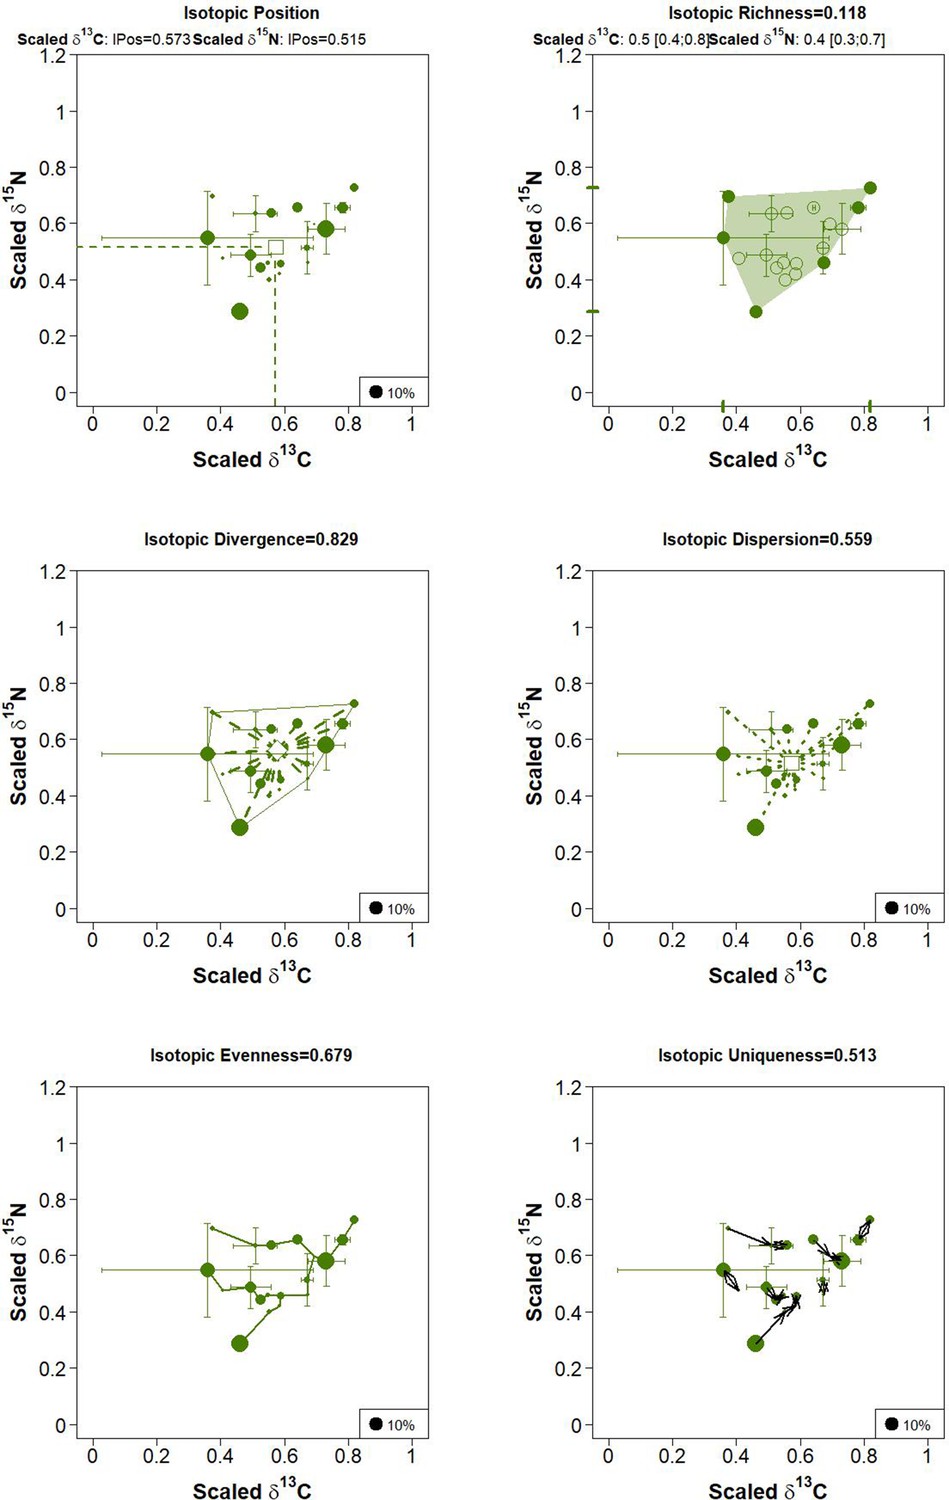
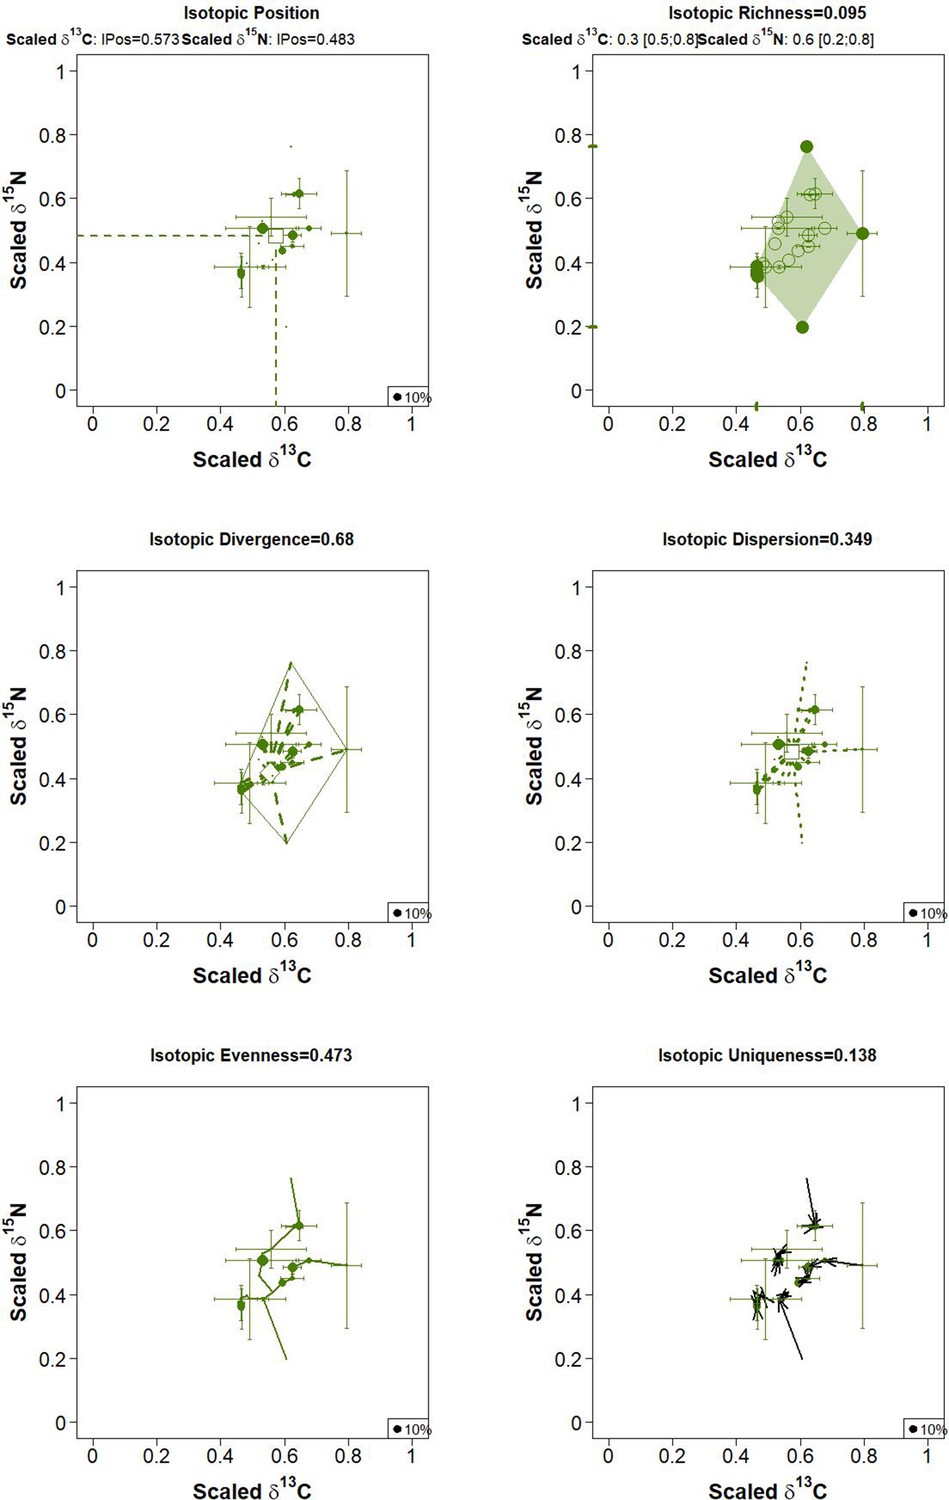
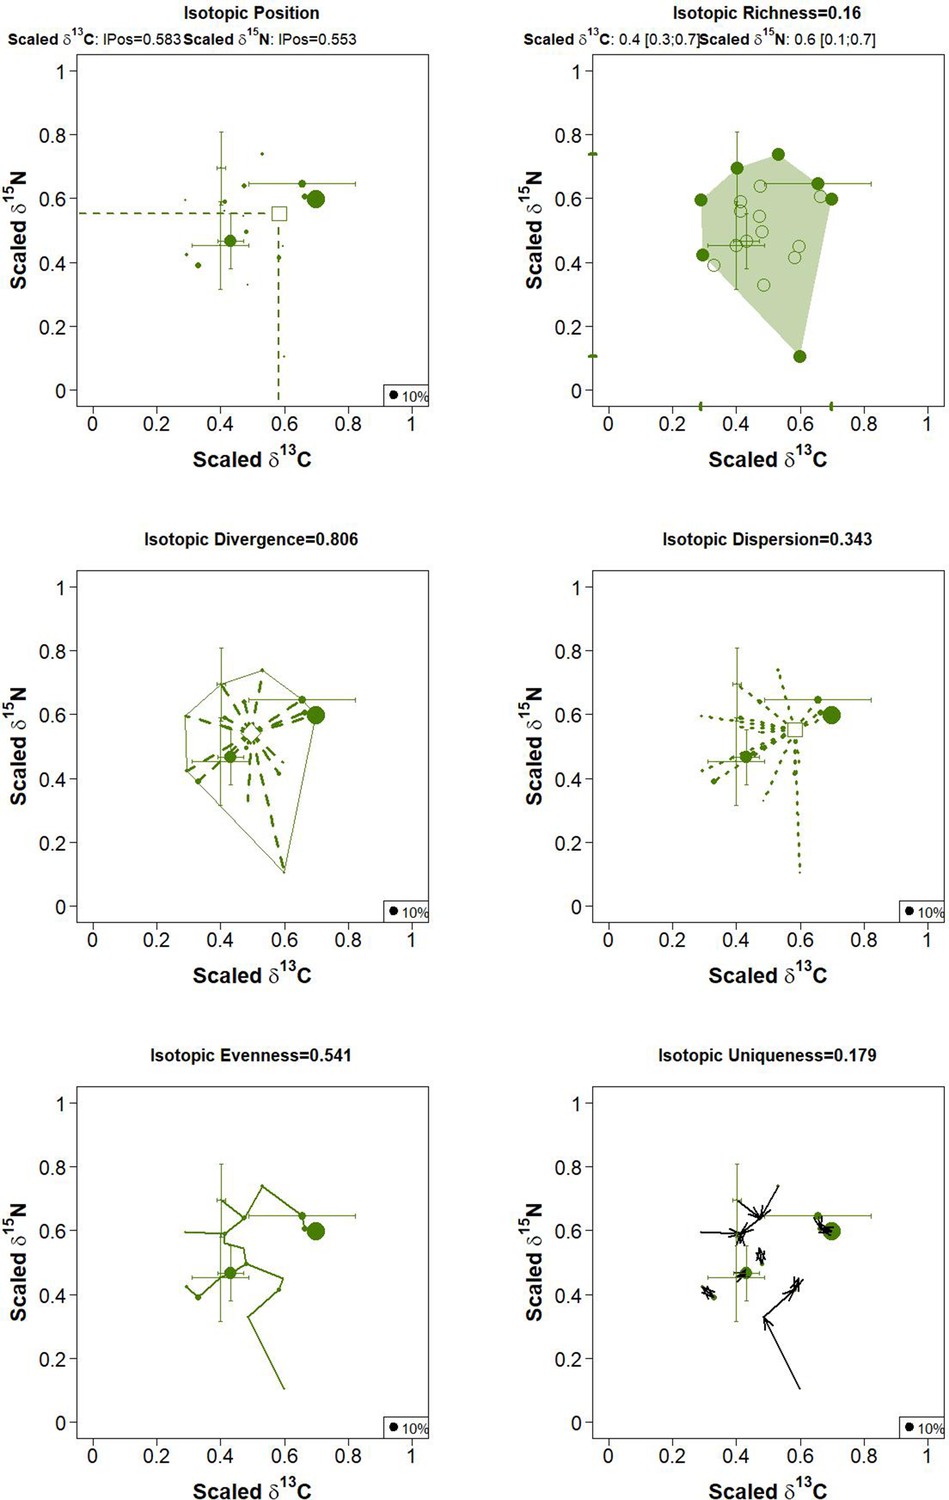
Figure 4—figure supplement 2
Multidimensional community metrics of soil food webs in forest (plot BF2).
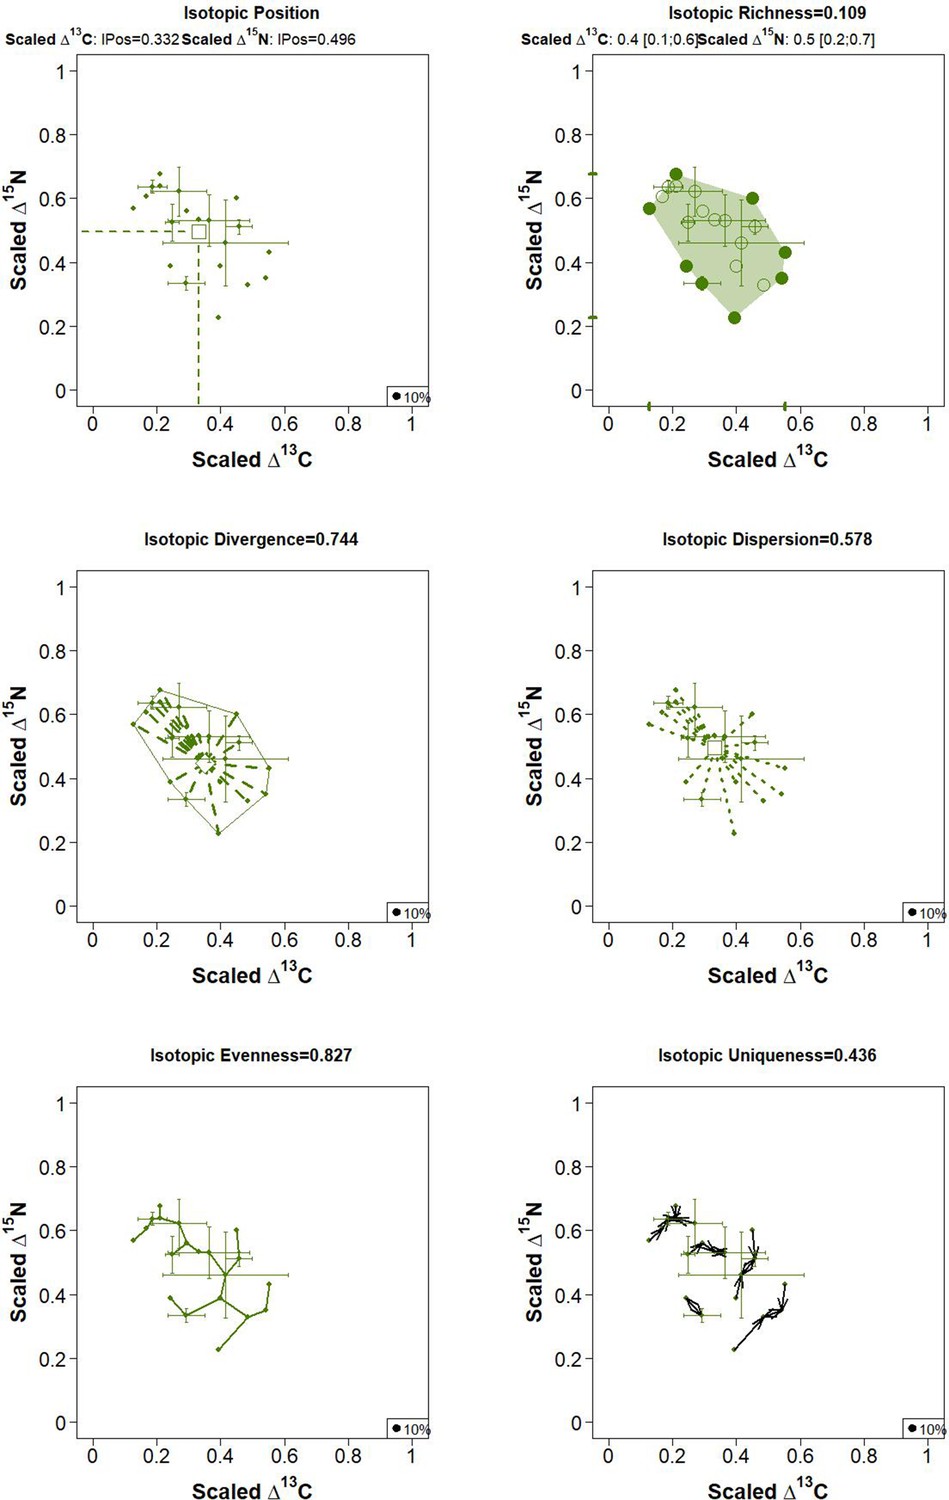
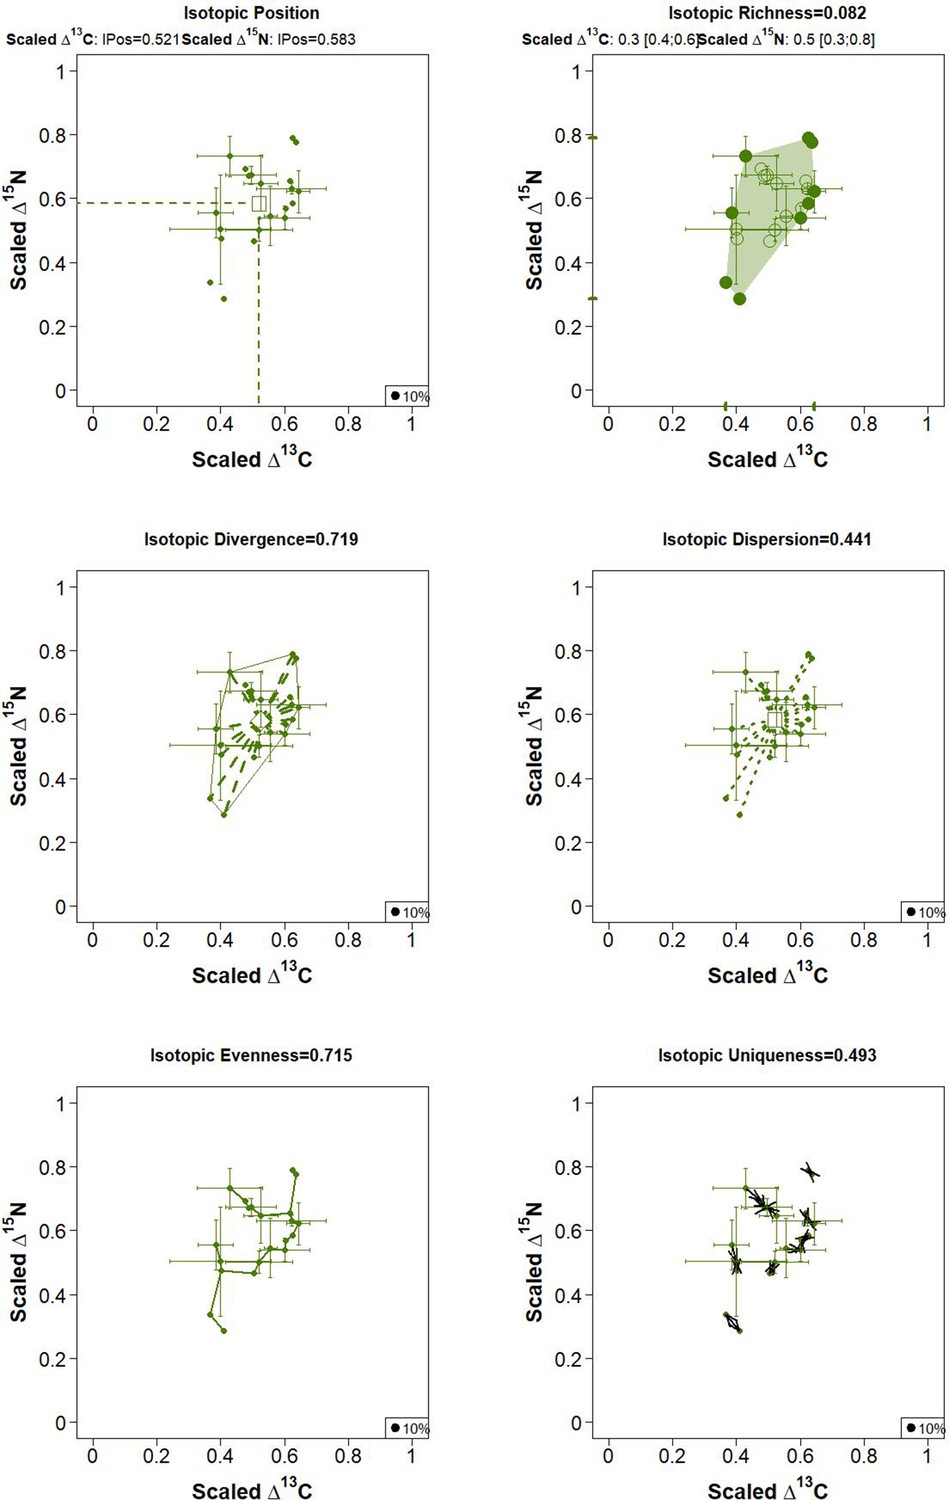
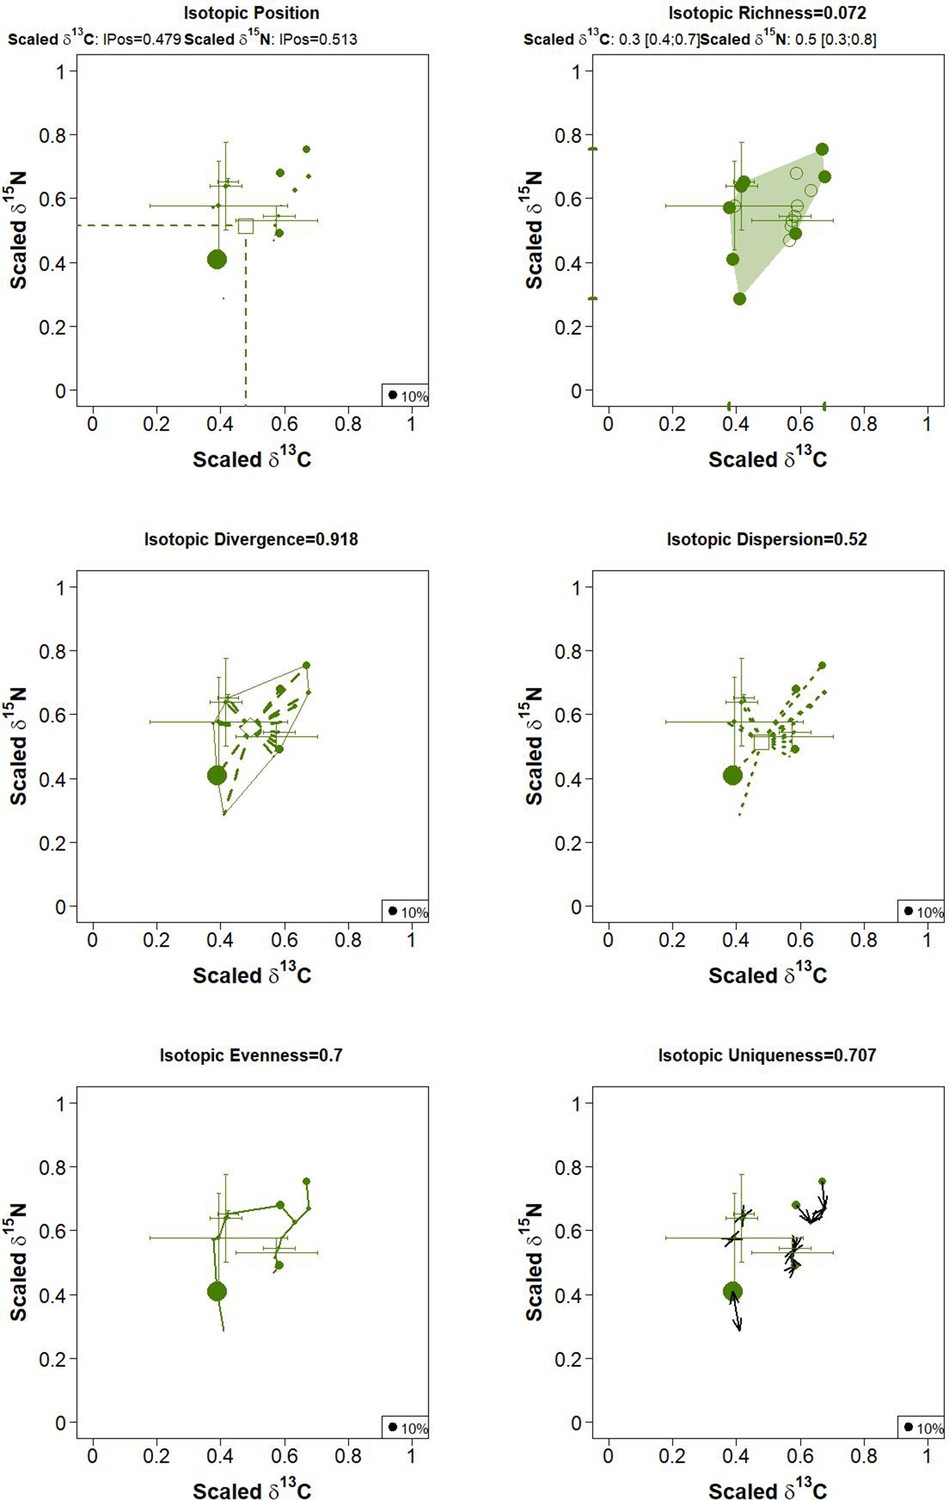
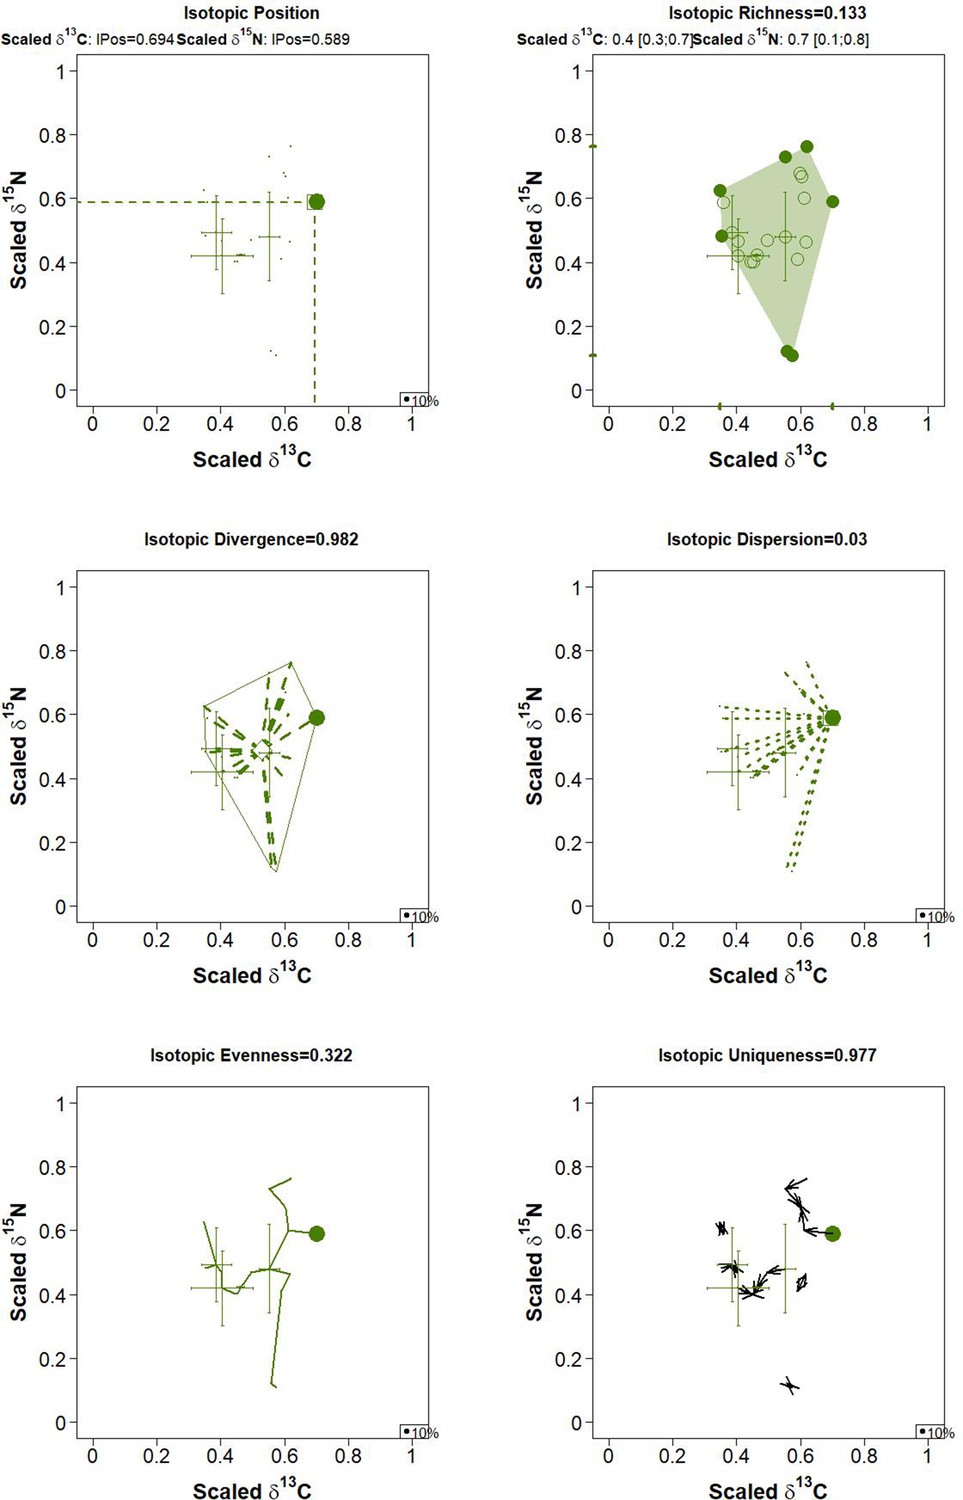
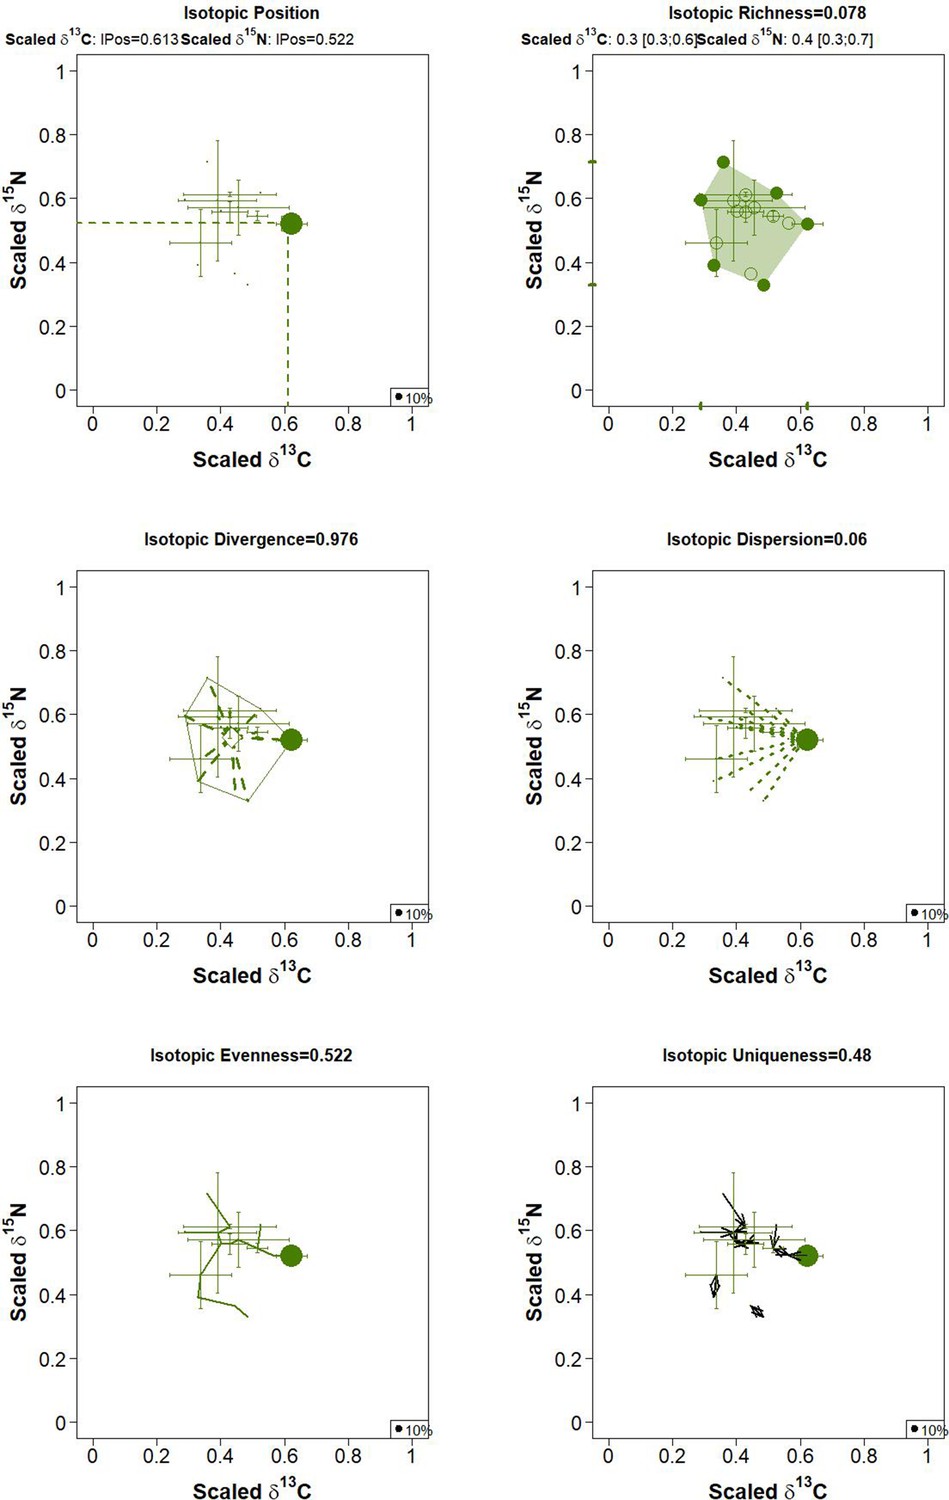
Figure 4—figure supplement 3

Multidimensional community metrics of soil food webs in forest (plot BF3).
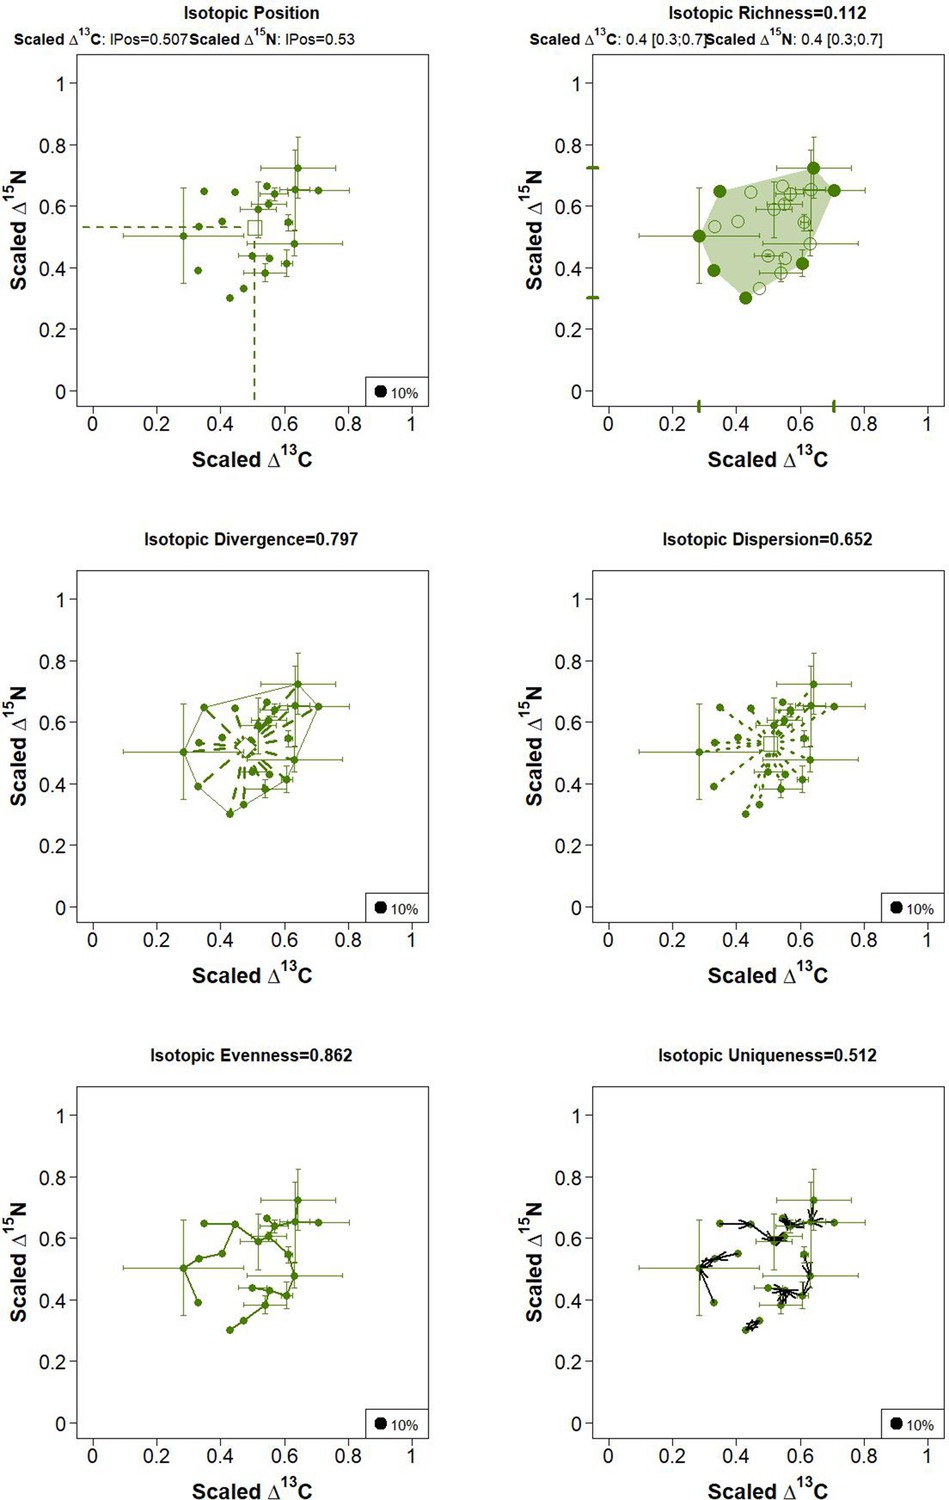
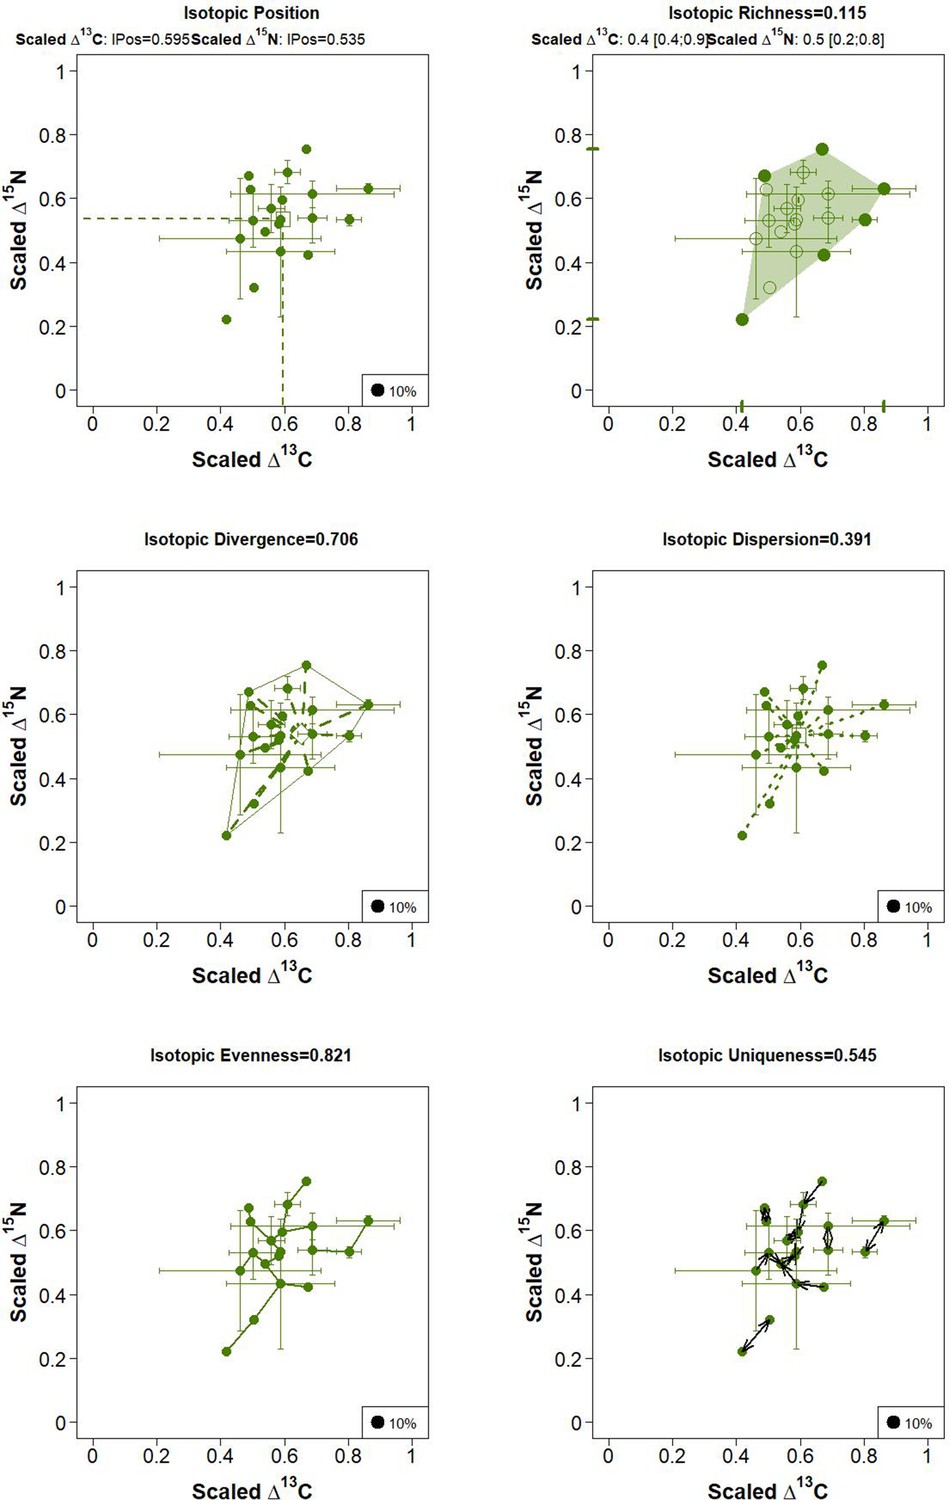
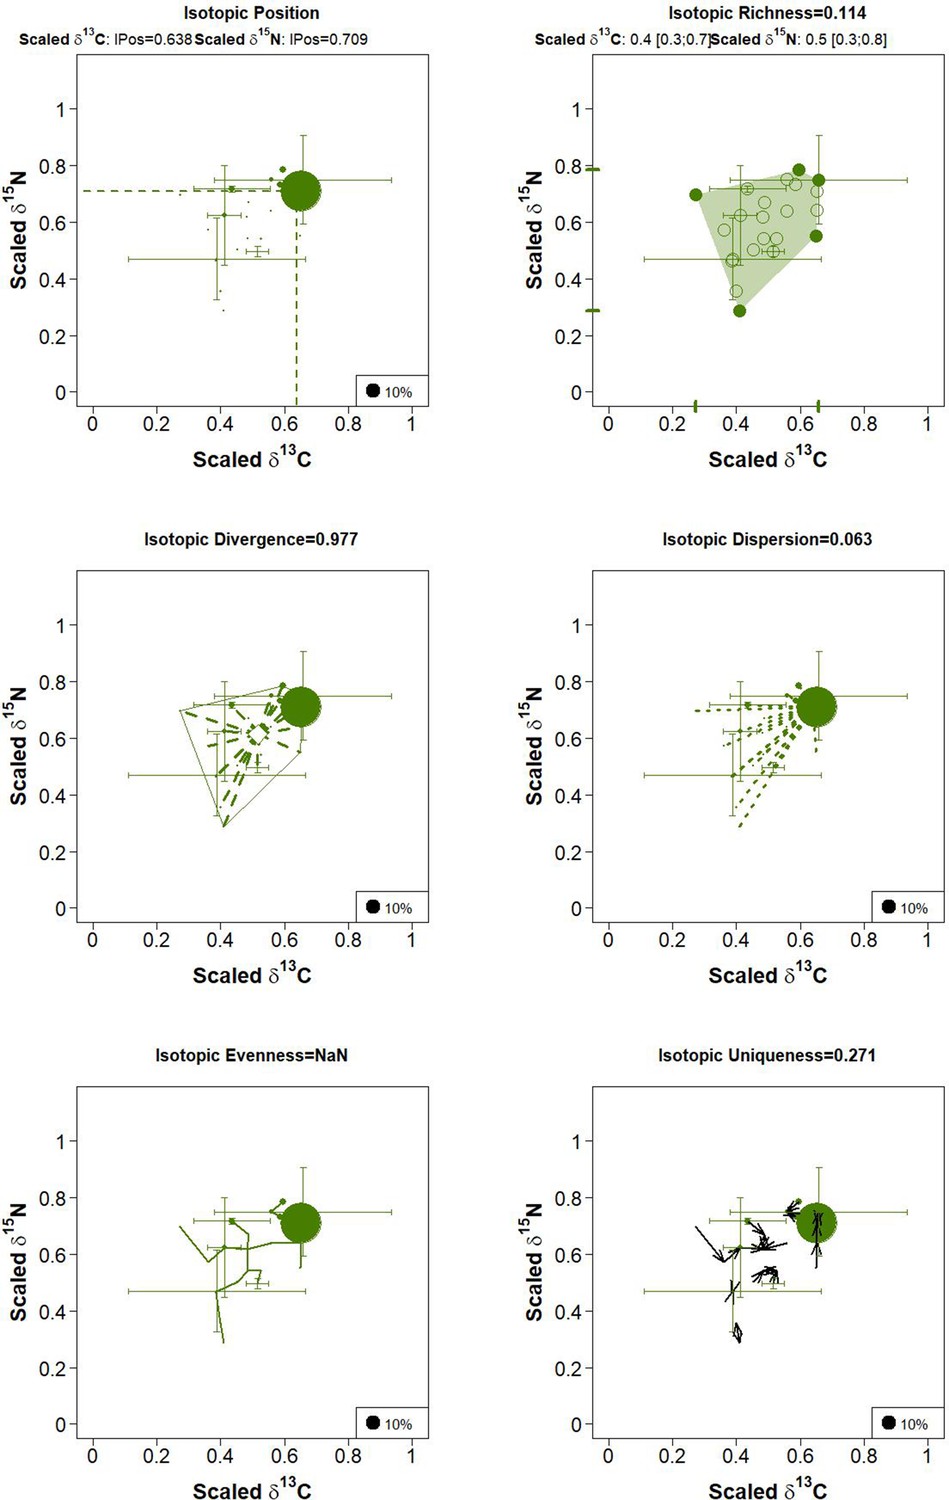
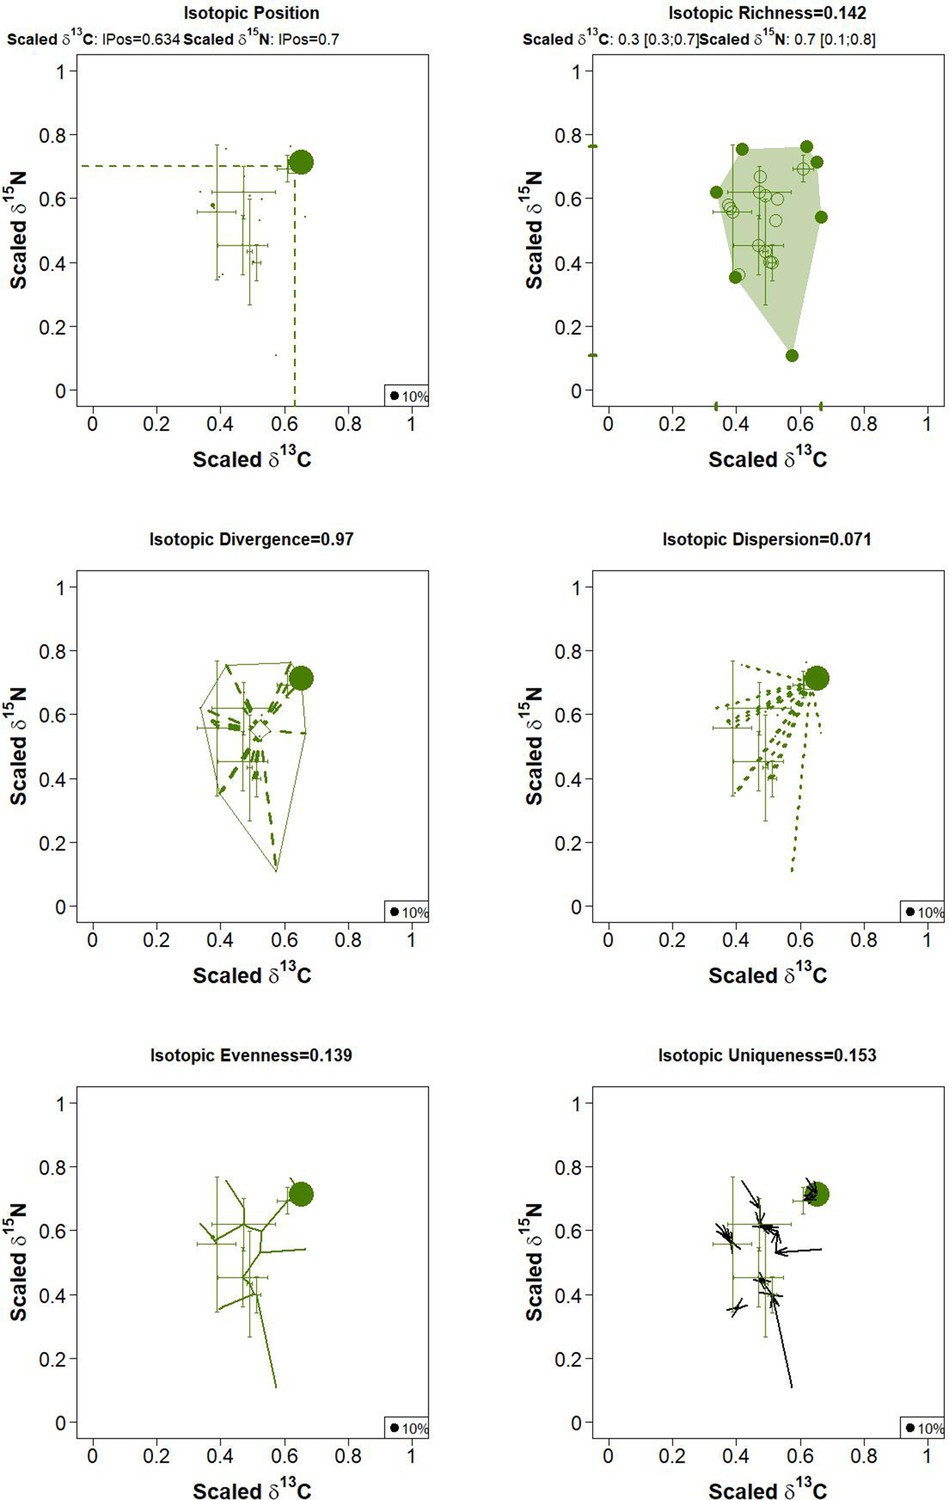
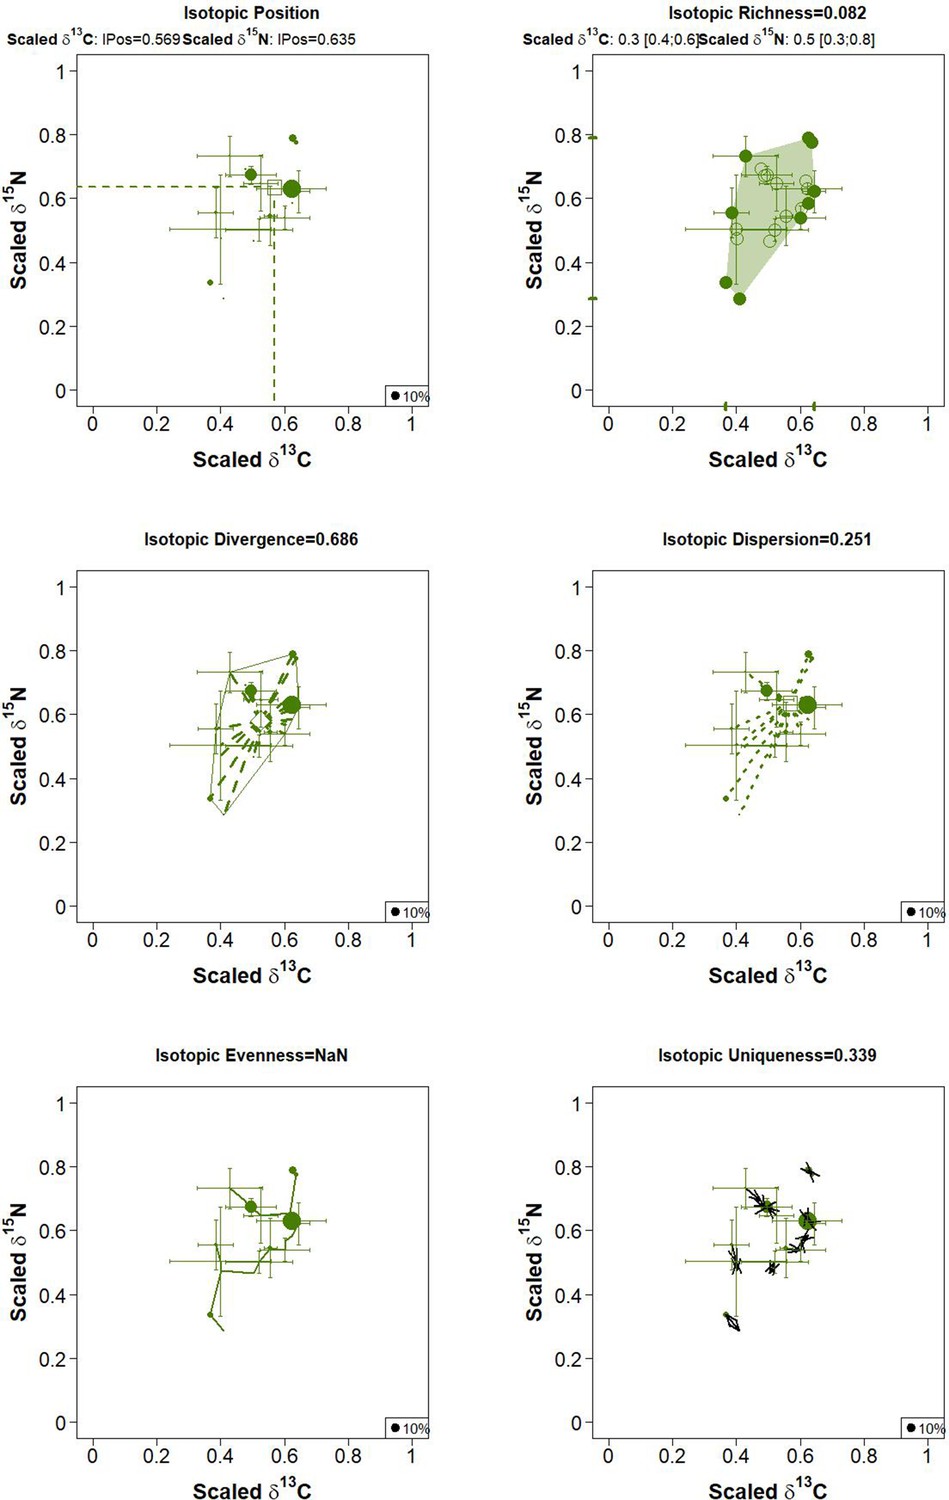
Figure 4—figure supplement 4

Multidimensional community metrics of soil food webs in forest (plot BF4).
Figure 4—figure supplement 5
Multidimensional community metrics of soil food webs in jungle rubber (plot BJ2).
Figure 4—figure supplement 6

Multidimensional community metrics of soil food webs in jungle rubber (plot BJ3).
Figure 4—figure supplement 7
Multidimensional community metrics of soil food webs in jungle rubber (plot BJ4).
Figure 4—figure supplement 8
Multidimensional community metrics of soil food webs in jungle rubber (plot BJ5).
Figure 4—figure supplement 9
Multidimensional community metrics of soil food webs in oil palm plantation (plot BO2).
Figure 4—figure supplement 10
Multidimensional community metrics of soil food webs in oil palm plantation (plot BO3).
Figure 4—figure supplement 11

Multidimensional community metrics of soil food webs in oil palm plantation (plot BO4).
Figure 4—figure supplement 12
Multidimensional community metrics of soil food webs in oil palm plantation (plot BO5).
Figure 4—figure supplement 13
Multidimensional community metrics of soil food webs in rubber plantation (plot BR1).
Figure 4—figure supplement 14
Multidimensional community metrics of soil food webs in rubber plantation (plot BR2).
Figure 4—figure supplement 15

Multidimensional community metrics of soil food webs in rubber plantation (plot BR3).
Figure 4—figure supplement 16

Multidimensional community metrics of soil food webs in rubber plantation (plot BR4).
Figure 4—figure supplement 17

Multidimensional community metrics of soil food webs in forest (plot HF1).
Figure 4—figure supplement 18

Multidimensional community metrics of soil food webs in forest (plot HF2).
Figure 4—figure supplement 19
Multidimensional community metrics of soil food webs in forest (plot HF3).
Figure 4—figure supplement 20
Multidimensional community metrics of soil food webs in forest (plot HF4).
Figure 4—figure supplement 21
Multidimensional community metrics of soil food webs in jungle rubber (plot HJ1).
Figure 4—figure supplement 22

Multidimensional community metrics of soil food webs in jungle rubber (plot HJ2).
Figure 4—figure supplement 23
Multidimensional community metrics of soil food webs in jungle rubber (plot HJ3).
Figure 4—figure supplement 24
Multidimensional community metrics of soil food webs in jungle rubber (plot HJ4).
Figure 4—figure supplement 25
Multidimensional community metrics of soil food webs in oil palm plantation (plot HO1).
Figure 4—figure supplement 26

Multidimensional community metrics of soil food webs in oil palm plantation (plot HO2).
Figure 4—figure supplement 27
Multidimensional community metrics of soil food webs in oil palm plantation (plot HO3).
Figure 4—figure supplement 28

Multidimensional community metrics of soil food webs in oil palm plantation (plot HO4).
Figure 4—figure supplement 29
Multidimensional community metrics of soil food webs in rubber plantation (plot HR1).
Figure 4—figure supplement 30
Multidimensional community metrics of soil food webs in rubber plantation (plot HR2).
Figure 4—figure supplement 31
Multidimensional community metrics of soil food webs in rubber plantation (plot HR3).
Figure 4—figure supplement 32
Multidimensional community metrics of soil food webs in rubber plantation (plot HR4).
Figure 4—figure supplement 33
Multidimensional energetic metrics of soil food webs in forest (plot BF1).
Figure 4—figure supplement 34
Multidimensional energetic metrics of soil food webs in forest (plot BF2).
Figure 4—figure supplement 35
Multidimensional energetic metrics of soil food webs in forest (plot BF3).
Figure 4—figure supplement 36
Multidimensional energetic metrics of soil food webs in forest (plot BF4).
Figure 4—figure supplement 37

Multidimensional energetic metrics of soil food webs in jungle rubber (plot BJ2).
Figure 4—figure supplement 38
Multidimensional energetic metrics of soil food webs in jungle rubber (plot BJ3).
Figure 4—figure supplement 39

Multidimensional energetic metrics of soil food webs in jungle rubber (plot BJ4).
Figure 4—figure supplement 40

Multidimensional energetic metrics of soil food webs in jungle rubber (plot BJ5).
Figure 4—figure supplement 41
Multidimensional energetic metrics of soil food webs in oil palm plantation (plot BO2).
Figure 4—figure supplement 42

Multidimensional energetic metrics of soil food webs in oil palm plantation (plot BO3).
Figure 4—figure supplement 43
Multidimensional energetic metrics of soil food webs in oil palm plantation (plot BO4).
Figure 4—figure supplement 44
Multidimensional energetic metrics of soil food webs in oil palm plantation (plot BO5).
Figure 4—figure supplement 45
Multidimensional energetic metrics of soil food webs in rubber plantation (plot BR1).
Figure 4—figure supplement 46
Multidimensional energetic metrics of soil food webs in rubber plantation (plot BR2).
Figure 4—figure supplement 47
Multidimensional energetic metrics of soil food webs in rubber plantation (plot BR3).
Figure 4—figure supplement 48
Multidimensional energetic metrics of soil food webs in rubber plantation (plot BR4).
Figure 4—figure supplement 49
Multidimensional energetic metrics of soil food webs in forest (plot HF1).
Figure 4—figure supplement 50

Multidimensional energetic metrics of soil food webs in forest (plot HF2).
Figure 4—figure supplement 51
Multidimensional energetic metrics of soil food webs in forest (plot HF3).
Figure 4—figure supplement 52
Multidimensional energetic metrics of soil food webs in forest (plot HF4).
Figure 4—figure supplement 53
Multidimensional energetic metrics of soil food webs in jungle rubber (plot HJ1).
Figure 4—figure supplement 54
Multidimensional energetic metrics of soil food webs in jungle rubber (plot HJ2).
Figure 4—figure supplement 55
Multidimensional energetic metrics of soil food webs in jungle rubber (plot HJ3).
Figure 4—figure supplement 56
Multidimensional energetic metrics of soil food webs in jungle rubber (plot HJ4).
Figure 4—figure supplement 57
Multidimensional energetic metrics of soil food webs in oil palm plantation (plot HO1).
Figure 4—figure supplement 58
Multidimensional energetic metrics of soil food webs in oil palm plantation (plot HO2).
Figure 4—figure supplement 59

Multidimensional energetic metrics of soil food webs in oil palm plantation (plot HO3).
Figure 4—figure supplement 60
Multidimensional energetic metrics of soil food webs in oil palm plantation (plot HO4).
Figure 4—figure supplement 61

Multidimensional energetic metrics of soil food webs in rubber plantation (plot HR1).
Figure 4—figure supplement 62
Multidimensional energetic metrics of soil food webs in rubber plantation (plot HR2).
Figure 4—figure supplement 63
Multidimensional energetic metrics of soil food webs in rubber plantation (plot HR3).
Figure 4—figure supplement 64
Multidimensional energetic metrics of soil food webs in rubber plantation (plot HR4).
Figure 5

Environmental drivers of community and energetic soil food-web metrics.
Community and energetic food-web metrics were related to environmental factors using multivariate analysis of variance (MANOVA); the thickness of connection lines shows statistical significance, dashed line for p > 0.05. Pairwise Spearman’s correlations among environmental factors are shown with a tile chart (blue – negative, red – positive). The vegetation parameters included tree species richness (TreeRich), tree density (TreeDen), understory species richness (UnderRich), understory density (UnderDen), and average understory height (UnderHeight). Parameters of litter and soil include soil pH, litter amount, soil carbon concentration (Csoil), carbon-to-nitrogen ratio of litter (CtoNlitter), soil microbial biomass C (Soil Cmic), and soil humidity (Water soil) (Krashevska et al., 2015; Rembold et al., 2017a).
-
Figure 5—source data 1
Data of environmental factors.
- https://cdn.elifesciences.org/articles/75428/elife-75428-fig5-data1-v3.csv
Figure 6
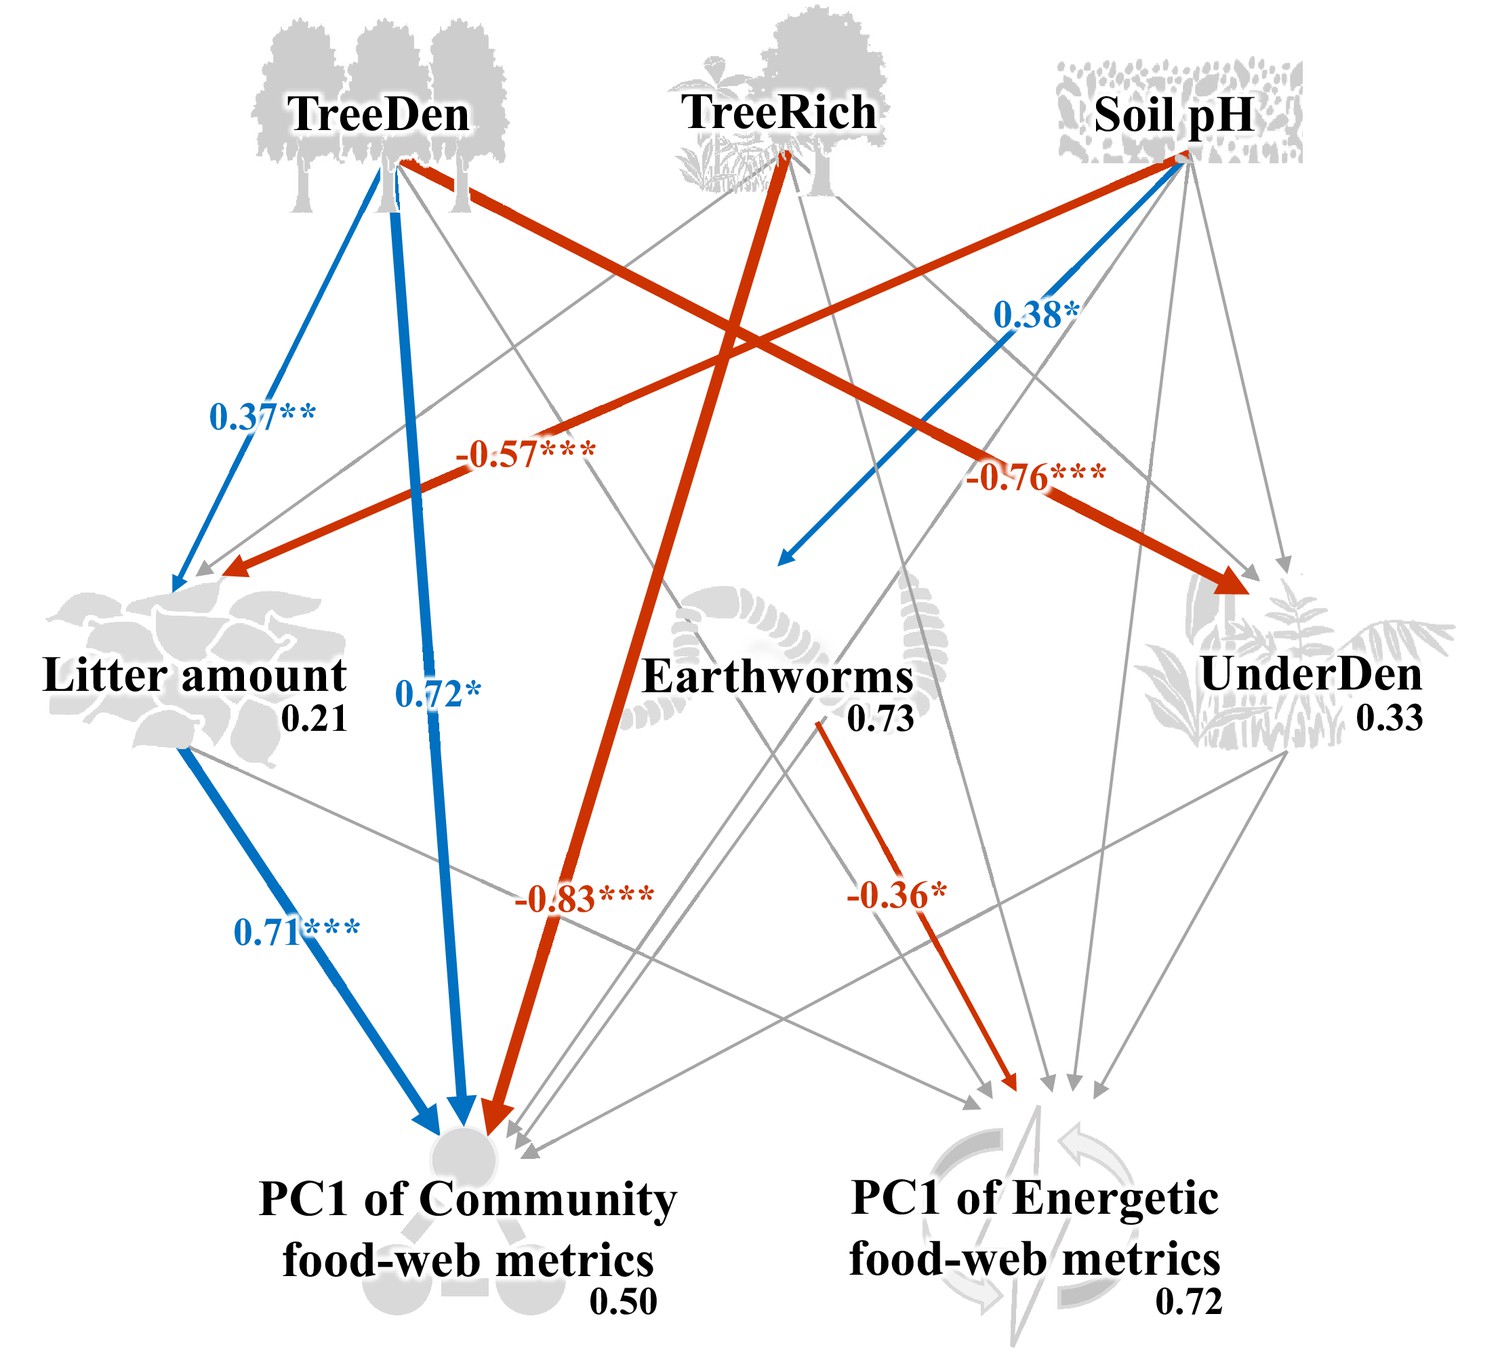
Structural equation model on the effects of environmental change on food-web metrics.
Numbers adjacent to arrows are standardized path coefficients that show effect sizes and directions (blue – positive, red – negative) of the relationship, arrow width is proportional to the strength of path coefficients. Gray arrows represent paths that were not significant; *p < 0.05, **p < 0.01, and ***p < 0.001. Numbers above every response variable in the model denotes the proportion of variance explained. For abbreviations, see Figure 5.
-
Figure 6—source data 1
Data for building structural equation model (SEM).
- https://cdn.elifesciences.org/articles/75428/elife-75428-fig6-data1-v3.xlsx
Additional files
-
Supplementary file 1
Metabolism proportion of different animal groups in different land-use systems.
- https://cdn.elifesciences.org/articles/75428/elife-75428-supp1-v3.xlsx
-
Transparent reporting form
- https://cdn.elifesciences.org/articles/75428/elife-75428-transrepform1-v3.docx
Download links
A two-part list of links to download the article, or parts of the article, in various formats.
Downloads (link to download the article as PDF)
Open citations (links to open the citations from this article in various online reference manager services)
Cite this article (links to download the citations from this article in formats compatible with various reference manager tools)
Tropical land use alters functional diversity of soil food webs and leads to monopolization of the detrital energy channel
eLife 11:e75428.
https://doi.org/10.7554/eLife.75428


