Role of immigrant males and muzzle contacts in the uptake of a novel food by wild vervet monkeys
- Department of Ecology and Evolution, University of Lausanne, Switzerland
- Inkawu Vervet Project, Mawana Game Reserve, South Africa
- University of Poitiers, France
- Laboratory of Cognitive & Adaptive Neurosciences, CNRS - UMR 7364, University of Strasbourg, France
Figures
Figure 1
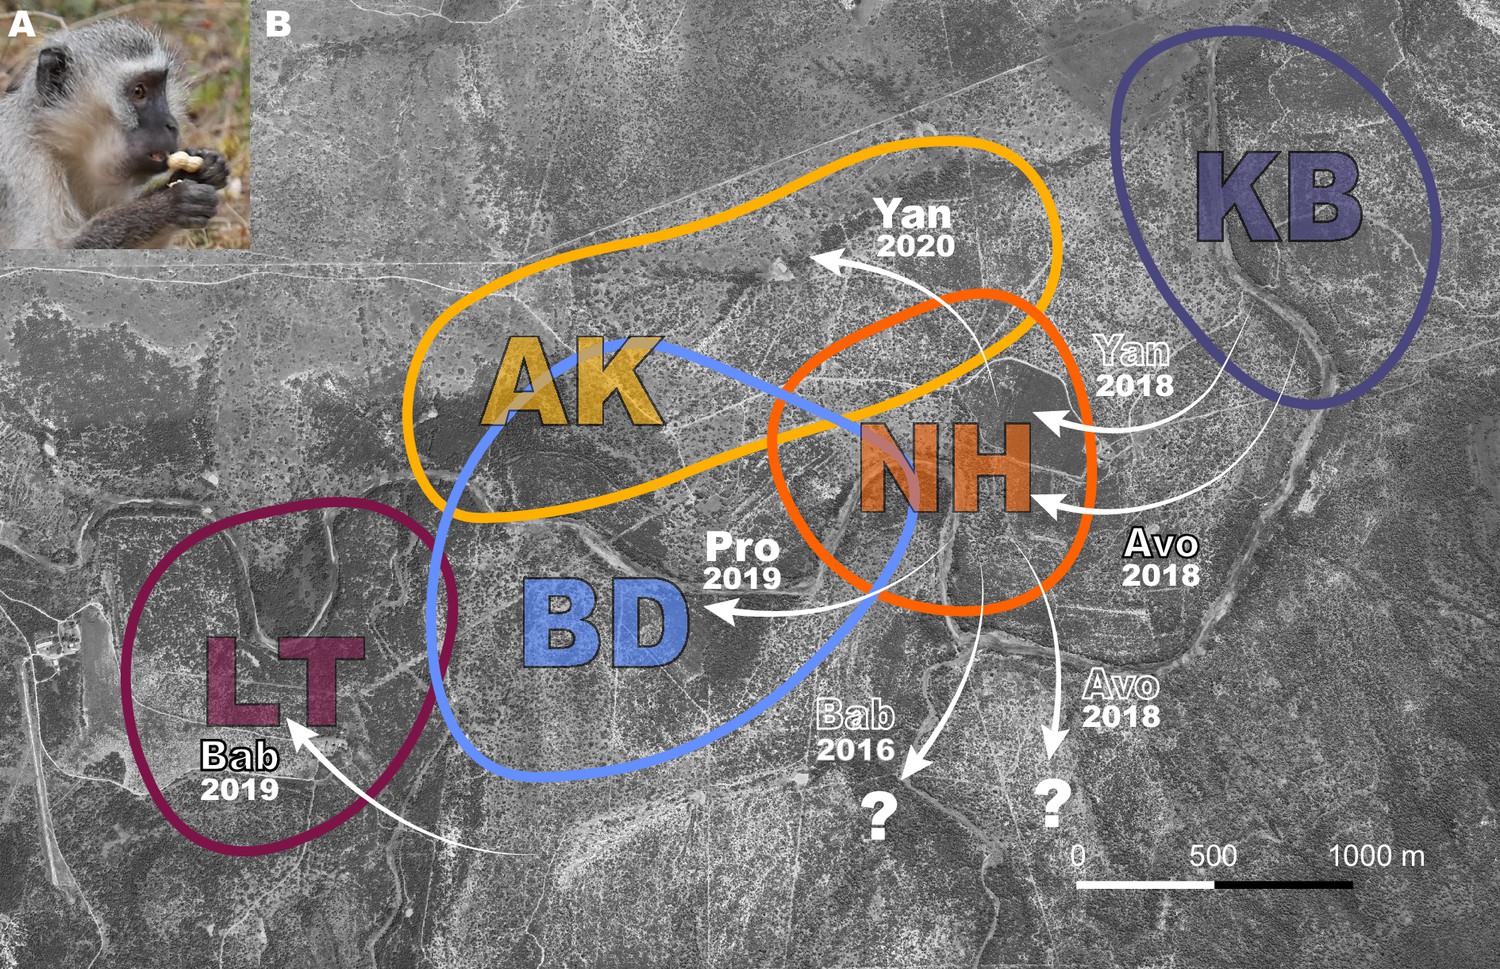
Dispersal events between study groups where monkeys were exposed to peanuts.
(A) A vervet monkey holding an unshelled peanut, about to open it. (B) Aerial view of the study area with colored shapes showing a rough estimate of group home ranges for study groups AK, BD, KB, LT, and NH. White arrows with annotations represent relevant dispersals. Names of males and year of dispersal are shown. Black outlined text indicates the immigrant innovators who were naïve to peanuts, solid white text shows the immigrants that imported innovations, and white outlined text shows: parallel dispersal with innovator (Yan 2018); that the innovator was habituated in a study group prior to participation in this experiment (Bab 2016); or that the innovator left the study group (Avo 2018). Question mark shows that males dispersed to an unstudied group.
Figure 2
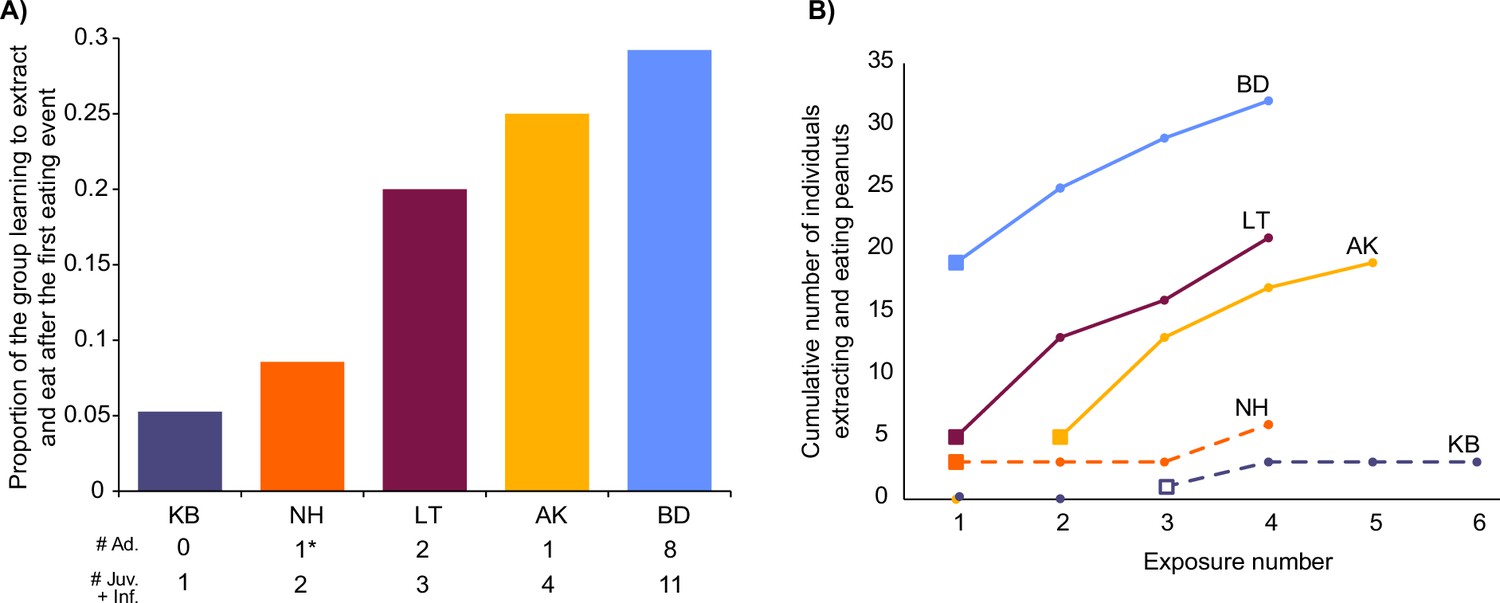
Uptake of extracting and eating peanuts in each group.
(A) Shows the proportion of each group that started eating when the first eating event took place. Total numbers of individuals, split by age, are shown below the x-axis. In NH the asterisk highlights the one adult which was the innovator male that left after their first exposure, and was only followed by juveniles learning to extract and eat. (B) Shows the progression in each group over four exposures from the first eating event. Solid squares represent when immigrant males were the first to eat, and the open square shows when the infant was first to eat. Solid lines show when there were adults present who had started to eat, whereas dashed lines show when there were only juveniles and infants present that had already started to eat. Males who were knowledgeable and imported innovations from other groups (Pro in BD and Yan in AK) are excluded from totals in both panels (visualized in Microsoft Excel).
Figure 3

Muzzle contact rate across exposures.
(A) Variation in muzzle contact rate according to the number of monkeys eating and exposure number. Shading shows 95% CI. (B) Model predictions based on the significant interaction between exposure number and number of monkeys eating. When greater numbers of monkeys are eating (blue) the effect of exposure number is less extreme than when fewer monkeys are eating (red).
Tables
Table 1
Cumulative numbers of monkeys eating at each exposure in each group, with a total of 81 (of a possible 164) monkeys eating across the whole experiment.
| Exposure number | ||||||||
|---|---|---|---|---|---|---|---|---|
| Group | Group size | 1 | 2 | 3 | 4 | 5 | 6 | Total |
| AK | ~20 | 0* | 5** | 13** | 17** | 19** | - | 19 |
| BD | 65 | 19 | 25 | 29 | 32 | - | - | 32 |
| KB | 19 | 0 | 0 | 1 | 3 | 3 | 3 | 3 |
| LT | 25 | 5 | 13 | 16 | 21 | - | - | 21 |
| NH | 35 | 3 | 3 | 3 | 6 | - | - | 6 |
| Grand total = | 81 | |||||||
-
NB. *AK in 2019; **AK in 2020.
Table 2
Number of individuals in each group that showed each type of response to the peanuts before the innovator or knowledgeable immigrant started eating.
| Group | Approach box and leave | Contact exploration and rejection |
|---|---|---|
| AK19 | 12 | 5 |
| AK20 | 3 | 1 |
| BD | 0 | 0 |
| KB | 15 | 4 |
| LT | 16 | 7 |
| NH | 2 | 1 |
Table 3
Models outputs for binomial and Poisson generalized linear mixed models.
| Model no. | Outcome | Predictors* | Coefficient | Odds ratio | SE | z- value | p-value † |
|---|---|---|---|---|---|---|---|
| 1 | Eat at first exposure with eating event: yes/no (binomial) N=161 | Age: Infant – Adult ‡ Juvenile – Adult ‡ Juvenile – Infant ‡ Sex (M) Standardized rank | –0.27 1.43 1.69 0.57 –1.52 | - 4.17 5.43 - - | 0.65 0.52 0.67 0.42 0.81 | –0.41 2.74 2.51 1.36 –1.89 | 0.912 0.017 0.032 0.175 0.058 |
| 2 | Eat over four exposures from first eating event: yes/no (binomial) N=161 | Age: Infant – Adult ‡ Juvenile – Adult ‡ Juvenile – Infant ‡ Sex (M) Standardized rank | –0.23 1.68 1.91 0.18 –2.69 | - 5.39 6.77 - 0.07 | 0.55 0.55 0.63 0.41 0.81 | –0.42 3.09 3.01 0.45 –3.34 | 0.908 0.006 0.007 0.656 <0.001 |
| 3 | Freq. muzzle contact per individual per exposure (Zero-Inflated Poisson) N=256 | Exposure no. No. eating (std.) Exposure no. X no. eating | –0.75 –0.56 0.40 | - - - | 0.10 0.21 0.10 | –7.20 –2.70 3.92 | <0.001 0.007 <0.001 |
| 4 | Frequency of muzzle contacts initiated (Poisson) N=253 | Prior knowledge (K) | –0.46 | 0.63 | 0.09 | –5.035 | <0.001 |
| Sex (M) | –0.03 | - | 0.29 | –0.11 | 0.911 | ||
| Standardized rank | –2.54 | 0.08 | 0.57 | –4.42 | <0.001 | ||
| Age: Infant – Adult ‡ Juvenile – Adult ‡ Juvenile – Infant ‡ | 0.39 1.79 1.40 | - 6.00 4.07 | 0.43 0.36 0.45 | 0.90 5.02 3.09 | 0.635 <0.001 0.006 | ||
| 5 | Frequency targeted by muzzle contacts (Poisson) N=253 | Prior knowledge (K) | 1.14 | 3.13 | 0.10 | 11.67 | <0.001 |
| Sex (M) | 0.88 | - | 0.45 | 1.96 | 0.050 | ||
| Standardized rank | –1.56 | - | 0.85 | –1.84 | 0.065 | ||
| Age: Infant – Adult ‡ Juvenile – Adult ‡ Juvenile – Infant ‡ | –3.44 –0.52 2.92 | 0.03 - 18.6 | 1.03 0.51 0.93 | –3.98 –0.94 3.13 | <0.001 0.603 0.005 |
-
*
Reference categories are Adult, Female, and Naïve for categorical predictors: age, sex, and knowledge, respectively; abbr.: N=naïve; K=knowledgeable; M=male.
-
†
Bold italics show significant p-values at 0.05 level.
-
‡
Indicates post-hoc multiple comparisons (with Tukey correction).
Table 4
Variance and standard deviation of random effects and marginal and conditional R squared of the five generalized linear mixed models presented in the paper.
| Random effects | Variance | Standard deviation | R2 marginal | R2 conditional | Sample sizes | |
|---|---|---|---|---|---|---|
| Model 1 Eat at 1st expo w/eating event | Group | 0.42 | 0.65 | 0.14 | 0.24 | 161 |
| Model 2 Eat all expos | Group | 3.21 | 1.79 | 0.12 | 0.55 | 161 |
| Model 3 MC rate per ind, per expo | Individual | <0.001 | 0.91 | 0.55 | 0.91 | 256 |
| Group | <0.001 | <0.001 | ||||
| Model 4 Freq. MC initiated per ind | Individual | 1.71 | 1.31 | 0.12 | 0.95 | 253 |
| Group | 3.42 | 1.85 | ||||
| Model 5 Freq. MC received per ind | Individual | 3.73 | 1.93 | 0.28 | 0.98 | 253 |
| Group | 1.58 | 1.26 |
Table 5
Model structures.
| Distribution | Outcome | Fixed effects | Random effects | |
|---|---|---|---|---|
| Model 1 Eat at 1st expo w/eating event | Binomial | Eat: Yes / No | Age (adult/juv./infant) Sex (F/M) Rank* | Group |
| Model 2 Eat all expos | Binomial | Eat: Yes / No | Age (adult/juv./infant) Sex (F/M) Rank* | Group |
| Model 3 MC rate per ind, per expo | Zero-inflated Poisson | Freq. initiated | Exposure number (1-4) No. monkeys eating (z-score) Duration of exposure (mins.; offset) | Group Individual |
| Model 4 Freq. MC initiated per ind | Poisson | Freq. initiated | Prior success (1/0) Age (adult/juv./infant) Sex (F/M) Rank* Total exposure duration per ind. (mins.; offset) | Group Individual |
| Model 5 Freq. MC received per ind | Poisson | Freq. received | Prior success (1/0) Age (adult/juv./infant) Sex (F/M) Rank* Total exposure duration per ind. (mins.; offset) | Group Individual |
-
*
Dominance rank calculated with I&SI method, and standardized between 0 (high rank) –1 (low rank) – see Methods for more details.
Additional files
-
Transparent reporting form
- https://cdn.elifesciences.org/articles/76486/elife-76486-transrepform1-v1.pdf
-
Supplementary file 1
Supplementary tables 1a and b.
- https://cdn.elifesciences.org/articles/76486/elife-76486-supp1-v1.docx
Download links
A two-part list of links to download the article, or parts of the article, in various formats.
Downloads (link to download the article as PDF)
Open citations (links to open the citations from this article in various online reference manager services)
Cite this article (links to download the citations from this article in formats compatible with various reference manager tools)
Role of immigrant males and muzzle contacts in the uptake of a novel food by wild vervet monkeys
eLife 13:e76486.
https://doi.org/10.7554/eLife.76486


