Meta-Research: How parenthood contributes to gender gaps in academia
- Information School, University of Wisconsin-Madison, United States
- College of Education, The University of Iowa, United States
Figures
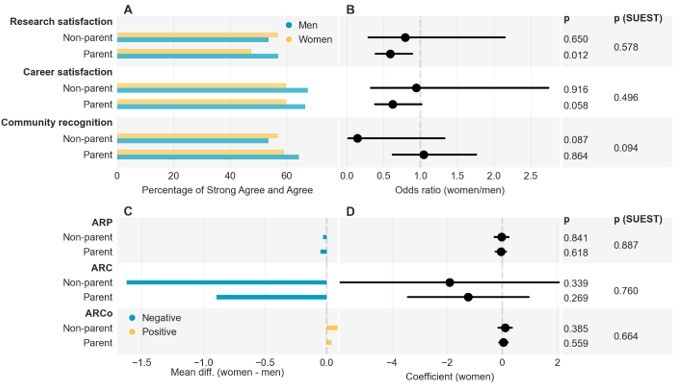
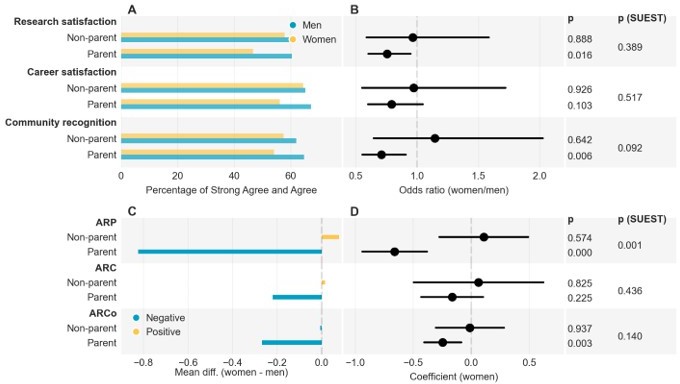
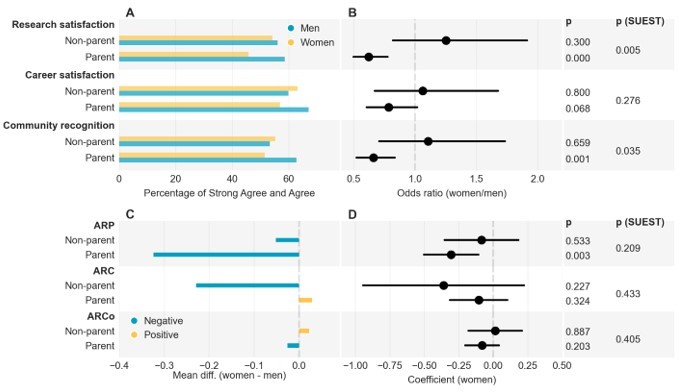
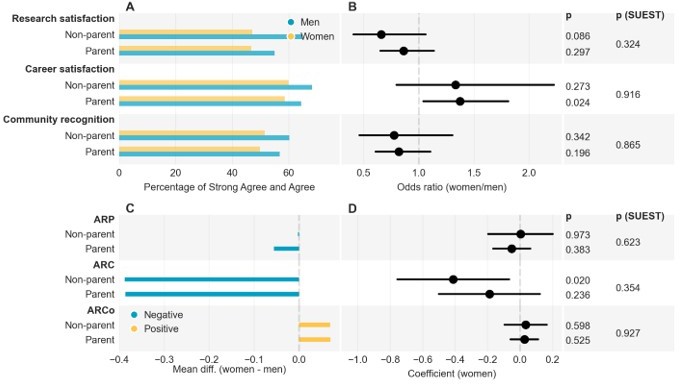
Figure 1

Subjective and objective career achievements by gender and parenthood status.
(A). Percentage of satisfaction over research, career, and recognition by scholarly communities; (B). Women/men odds ratio for subjective career achievements; Control variables include discipline, career stage, partner job type, and race. Standard errors were clustered at the institution level. p (SUEST) values compare the odds ratio values between the parent and non-parent group; (C). Women-men difference in annual relative publication (ARP), average relative citation (ARC), and annual relative coauthor (ARCo). Positive values indicate female dominance and negative male dominance; (D). Coefficients for gender (women) based on linear regression analysis on ARP, ARC, and ARCo.
Figure 2
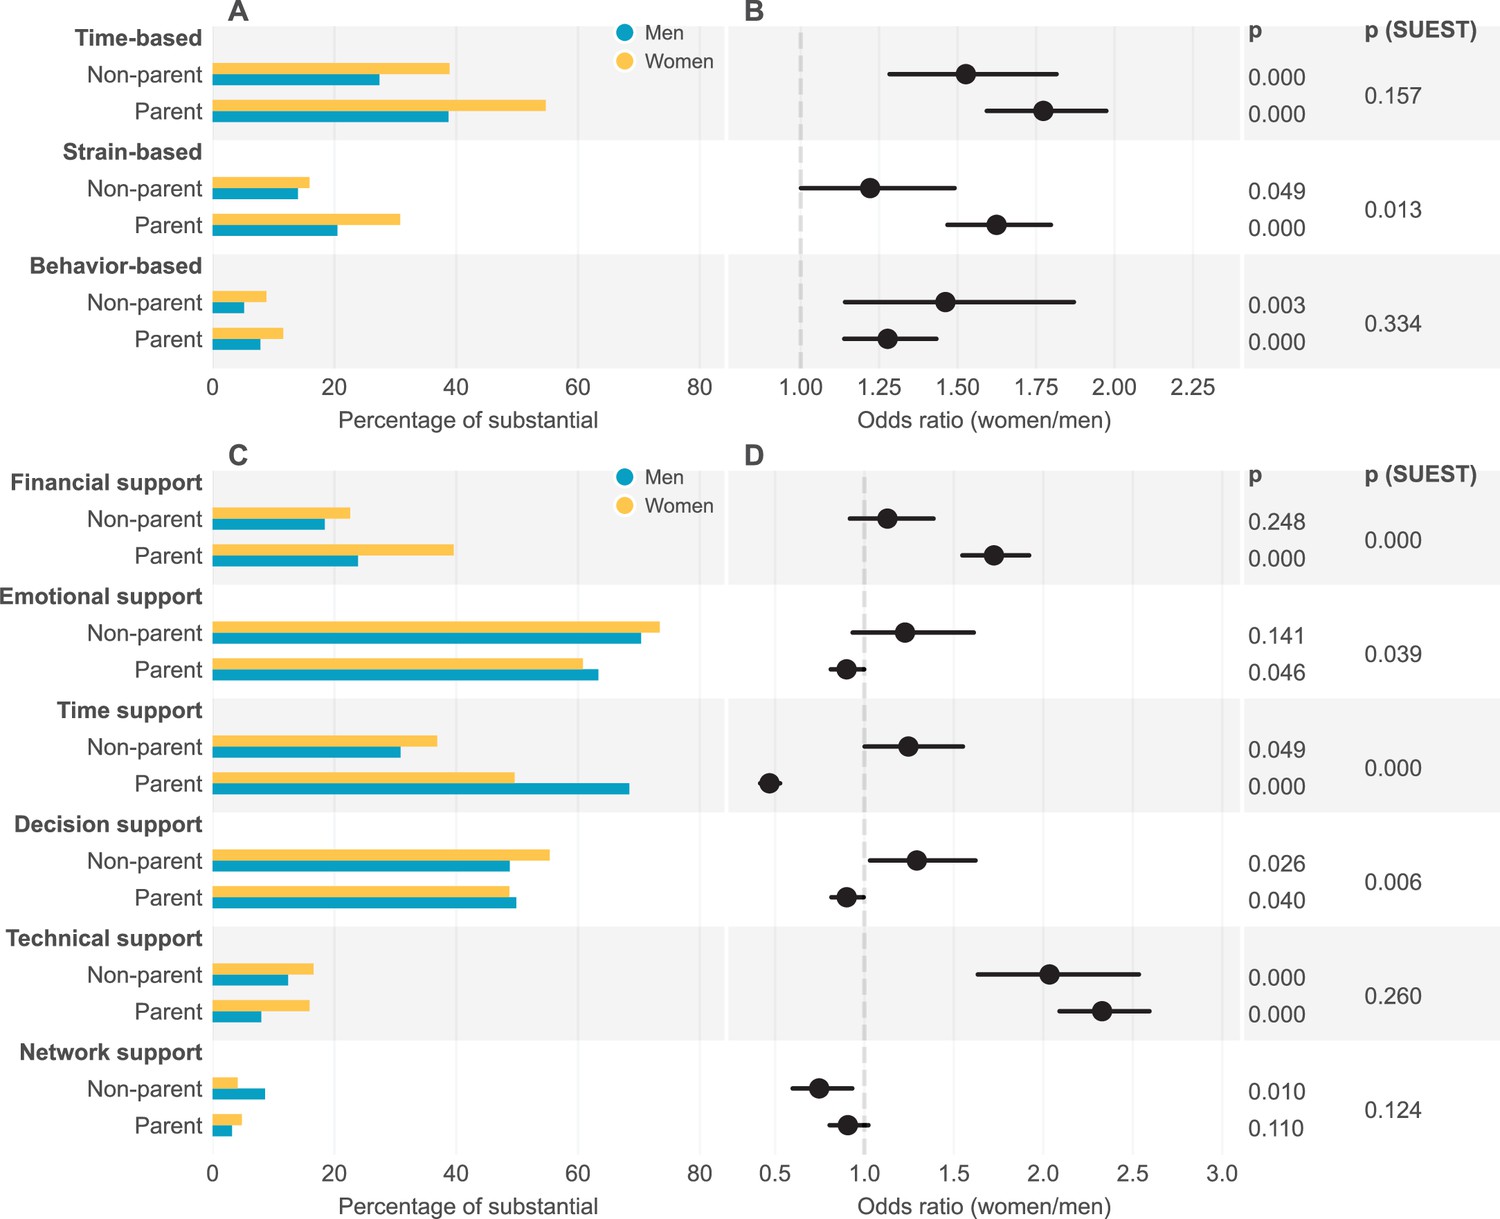
Forms of work-family conflict experienced, and partner support received by gender and parenthood status.
(A) Percentage of women and men experiencing “substantial” conflict; (B) Odds ratio (women/men) for experiencing work-family conflict; (C) Percentage of women and men receiving “substantial” partner support; (D) Odds ratio (women/men) for receiving partner support. The (women/men) odds ratio values were based on logistic regression. Control variables include discipline, career stage, partner job type, and race. Standard errors were clustered at the institution level. SUEST was used to compare the odds ratio values between parent and non-parent group.
Figure 3
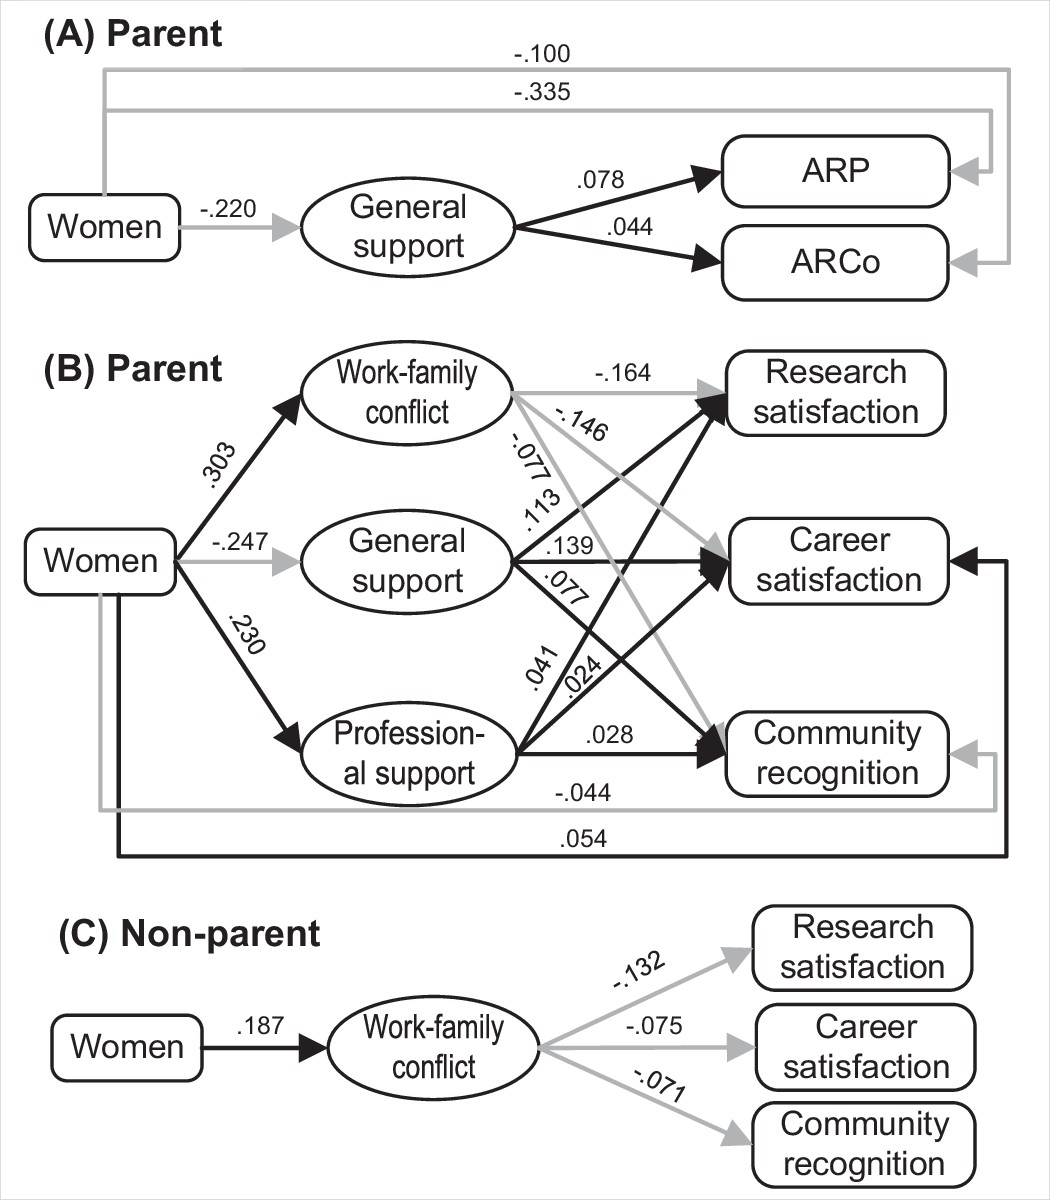
Mediation effect analysis models of partner support and work-family conflict between gender and subjective and objective career achievement measures.
Only paths with statistically significant effects (p<0.05) are shown. Black and gray lines denote positive and negative mediating coefficients, respectively. (A) sets the objective career achievement as the outcomes and tests with the parent group (n=4,173). (B) sets the subjective career achievement measures as the outcomes and tests with the parent group (n=4,557). (C) sets the subjective career achievement measures as the outcomes and tests with the non-parent group (n=1,152).
Author response image 1
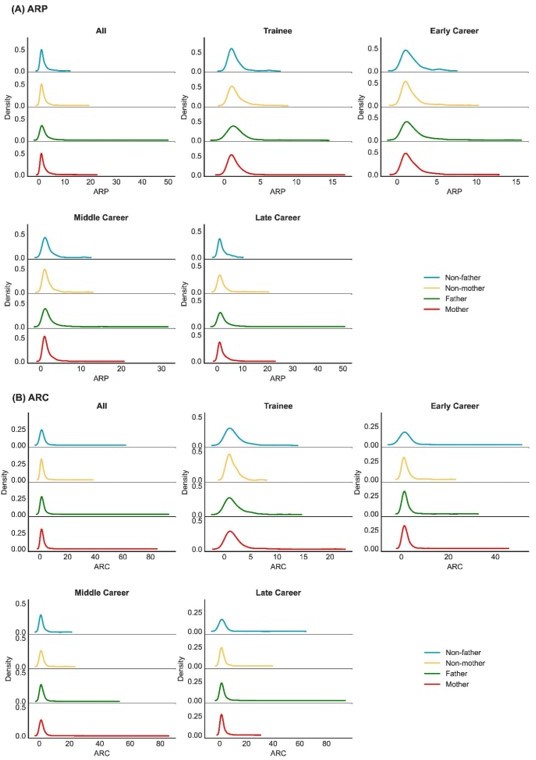
Kernel density distributions of annual relative publications (ARP) and average relative citations (ARC) across parenting groups and genders, by career stages.
Author response image 2
Arts and humanities.
Author response image 3
Medical sciences.
Author response image 4
Natural sciences and engineering.
Author response image 5
Social sciences.
Tables
Table 1
Child impact on career for parents.
Odds ratio (women/men) values were based on ordinal logistic regression. Standard errors were clustered at the institution level. Control variables include discipline, race, and type of partner job.
| All | Trainee | Early career | Middle career | Late career | ||||||
|---|---|---|---|---|---|---|---|---|---|---|
| Women | Men | Women | Men | Women | Men | Women | Men | Women | Men | |
| Negative (%) | 71.3 | 48.6 | 79.3 | 60.2 | 79.1 | 66.4 | 75.5 | 59.1 | 60.9 | 37.3 |
| Neutral (%) | 14.7 | 26.2 | 9.6 | 21.2 | 9.7 | 16.5 | 13.1 | 19.1 | 20 | 33 |
| Positive (%) | 14.1 | 25.2 | 11.1 | 18.6 | 11.2 | 17.1 | 11.4 | 21.9 | 19.2 | 29.7 |
| N | 3,105 | 2,530 | 208 | 118 | 618 | 333 | 1,172 | 745 | 1,107 | 1,334 |
| OR, 95% CI, p-value | 0.46 [0.41,0.51], P=0.000 | 0.34 [0.20,0.61], P=0.000 | 0.52 [0.39,0.70], P=0.000 | 0.47 [0.40,0.56], P=0.000 | 0.43 [0.37,0.51], P=0.000 | |||||
Author response table 1
The bootstrap results for subjective and objective career achievements – coefficients and 95% bias-corrected confidence interval (CI).
| Subjective career achievement | Coef. | 95% bias-corrected CI | Objective career achievement | Coef. | 95% bias-corrected CI | ||
| Lower | Upper | Lower | Upper | ||||
| Non-parent | |||||||
| Research satisfaction | -0.062 | -0.317 | 0.185 | ARP | 0.016 | -0.148 | 0.174 |
| Career satisfaction | 0.052 | -0.227 | 0.334 | ARC | -0.321 | -0.765 | 0.032 |
| Community recognition | -0.05 | -0.333 | 0.226 | ARCo | 0.025 | -0.109 | 0.141 |
| Parent | |||||||
| Research satisfaction | -0.332 | -0.457 | -0.208 | ARP | -0.349 | -0.486 | -0.216 |
| Career satisfaction | -0.116 | -0.25 | 0.035 | ARC | -0.196 | -0.386 | -0.01 |
| Community recognition | -0.308 | -0.454 | -0.162 | ARCo | -0.102 | -0.174 | -0.031 |
| Coefficient difference (non-parent – parent) | |||||||
| Research satisfaction | 0.271 | -0.016 | 0.549 | ARP | 0.365 | 0.152 | 0.572 |
| Career satisfaction | 0.168 | -0.149 | 0.476 | ARC | -0.126 | -0.599 | 0.273 |
| Community recognition | 0.259 | -0.063 | 0.558 | ARCo | 0.126 | -0.02 | 0.263 |
Additional files
-
MDAR checklist
- https://cdn.elifesciences.org/articles/78909/elife-78909-mdarchecklist1-v3.pdf
-
Supplementary file 1
Tables S1-S5; Survey procedures; Operationalization of key variables; Objective career achievement measures; Statistical analysis.
- https://cdn.elifesciences.org/articles/78909/elife-78909-supp1-v3.docx
-
Supplementary file 2
Tables S6-S15.
- https://cdn.elifesciences.org/articles/78909/elife-78909-supp2-v3.docx
-
Supplementary file 3
Survey questions used by the study.
- https://cdn.elifesciences.org/articles/78909/elife-78909-supp3-v3.docx
Download links
A two-part list of links to download the article, or parts of the article, in various formats.
Downloads (link to download the article as PDF)
Open citations (links to open the citations from this article in various online reference manager services)
Cite this article (links to download the citations from this article in formats compatible with various reference manager tools)
Meta-Research: How parenthood contributes to gender gaps in academia
eLife 11:e78909.
https://doi.org/10.7554/eLife.78909


