Bundling and segregation affect pheromone deposition, but not choice, in an ant
- Animal Comparative Economics laboratory, Department of Zoology, University of Regensburg, Germany
- Department of Biology, University of Florence, Italy
Figures
Figure 1

Simplified schematic of prospect theory from Kahneman and Tversky, 1979, with a graphical illustration of bundling and segregation.
On the x-axis, actual value of a gain or a loss (here exemplified with money). Perceived utility does not scale linearly with value, but logarithmically. Receiving a gain of €100 (segregated) twice will produce a level of ‘happiness’ of ‘2s’, more than the level ‘b’ perceived when receiving €200 all together (bundled). The same is true for ‘losing’ the same amounts, where two losses of €100 are felt stronger than a single one of €200.
Figure 2
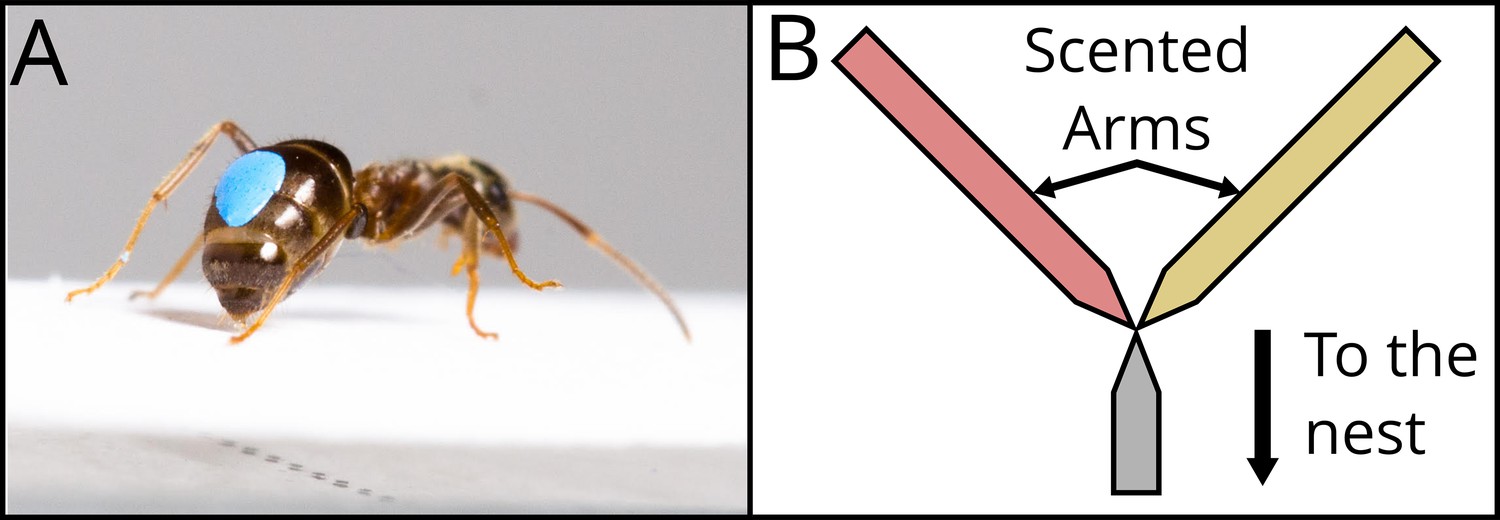
Description of the two dependent variables recorded.
In (A), a marked Lasius niger ant pauses and presses its abdomen to the runway, leaving pheromone mark. See Video 1. The number of pheromone depositions was counted. Photo : Julia Giehr. (B) shows a schematic representation of the Y-maze used for the binary choice test. Coming from the nest, the ant walks on an unscented runway, constituting the Y-maze stem, until it reaches the bifurcation. The two Y-maze arms were scented with two different odours, corresponding to the ones present during the previous visits and associated with the two experienced treatments. The bifurcation tapers in the middle to ensure that the ant senses both odours before making a choice.
Figure 3
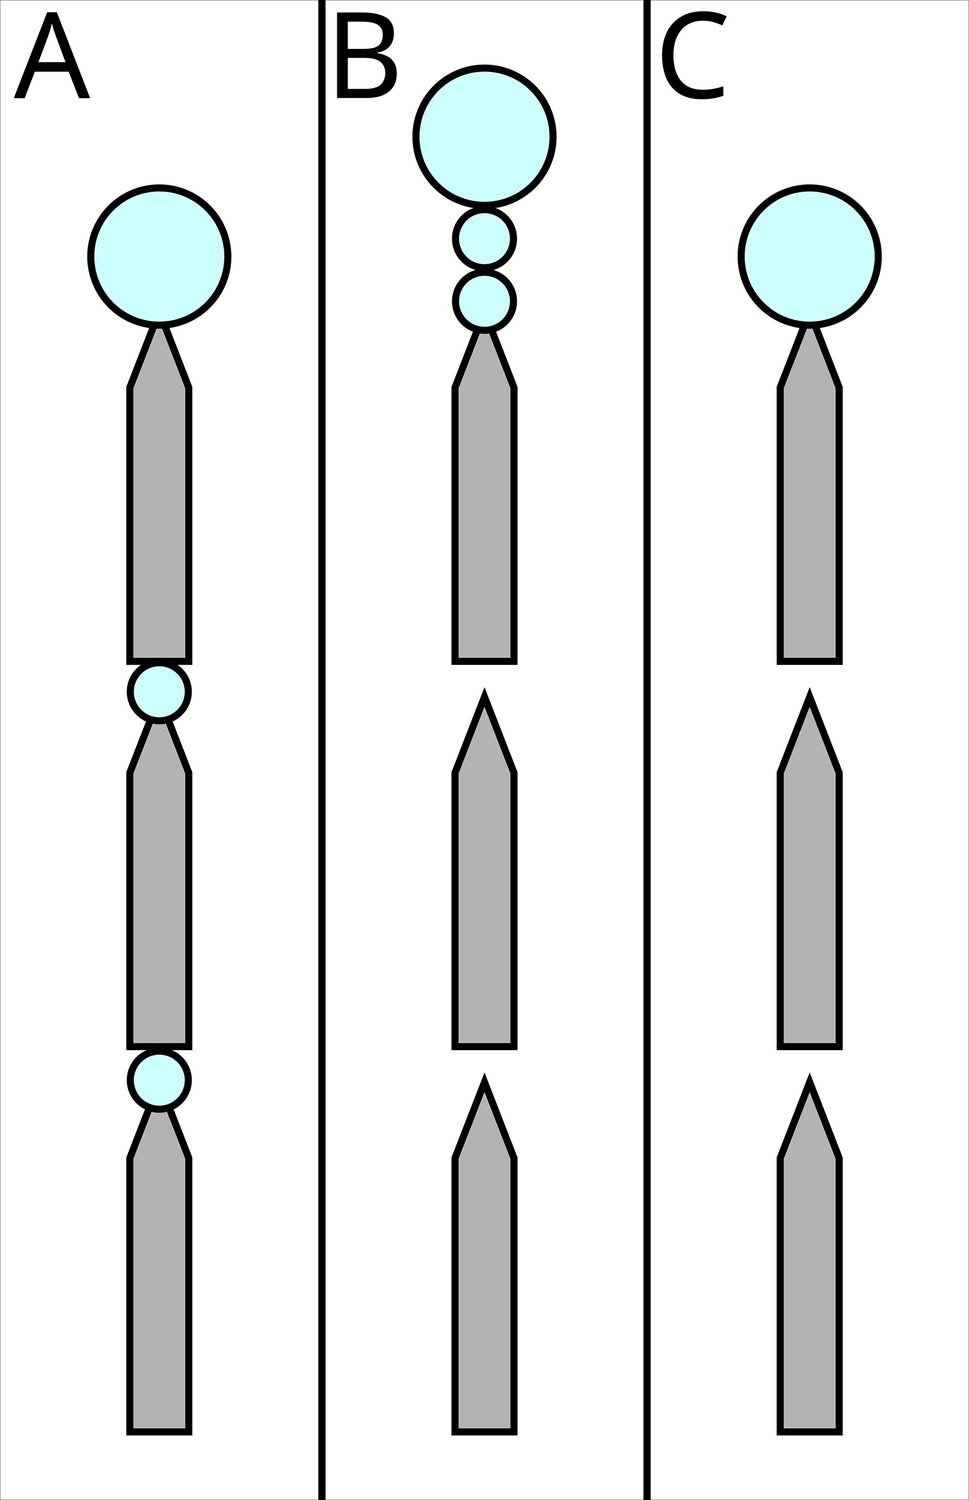
The three possible experimental treatments.
Grey shapes represent the runway segments, each 25 cm long, 1 cm wide, tapering to 2 mm to ensure that ants encounter the sucrose drops. Big blue circles represent ad libitum 1.5 M sucrose solution, small circles represent 0.2 µl drops which the ants can drink, but will not satiate them. In (A) ‘segregated all’, both the costs (travel over the runways) and the rewards (drops of 1.5 M sucrose, blue circles) are segregated. In (B) ‘segregated rewards’, only the rewards are segregated. In (C) ‘bundled’ both the costs and the rewards are bundled.
Figure 4
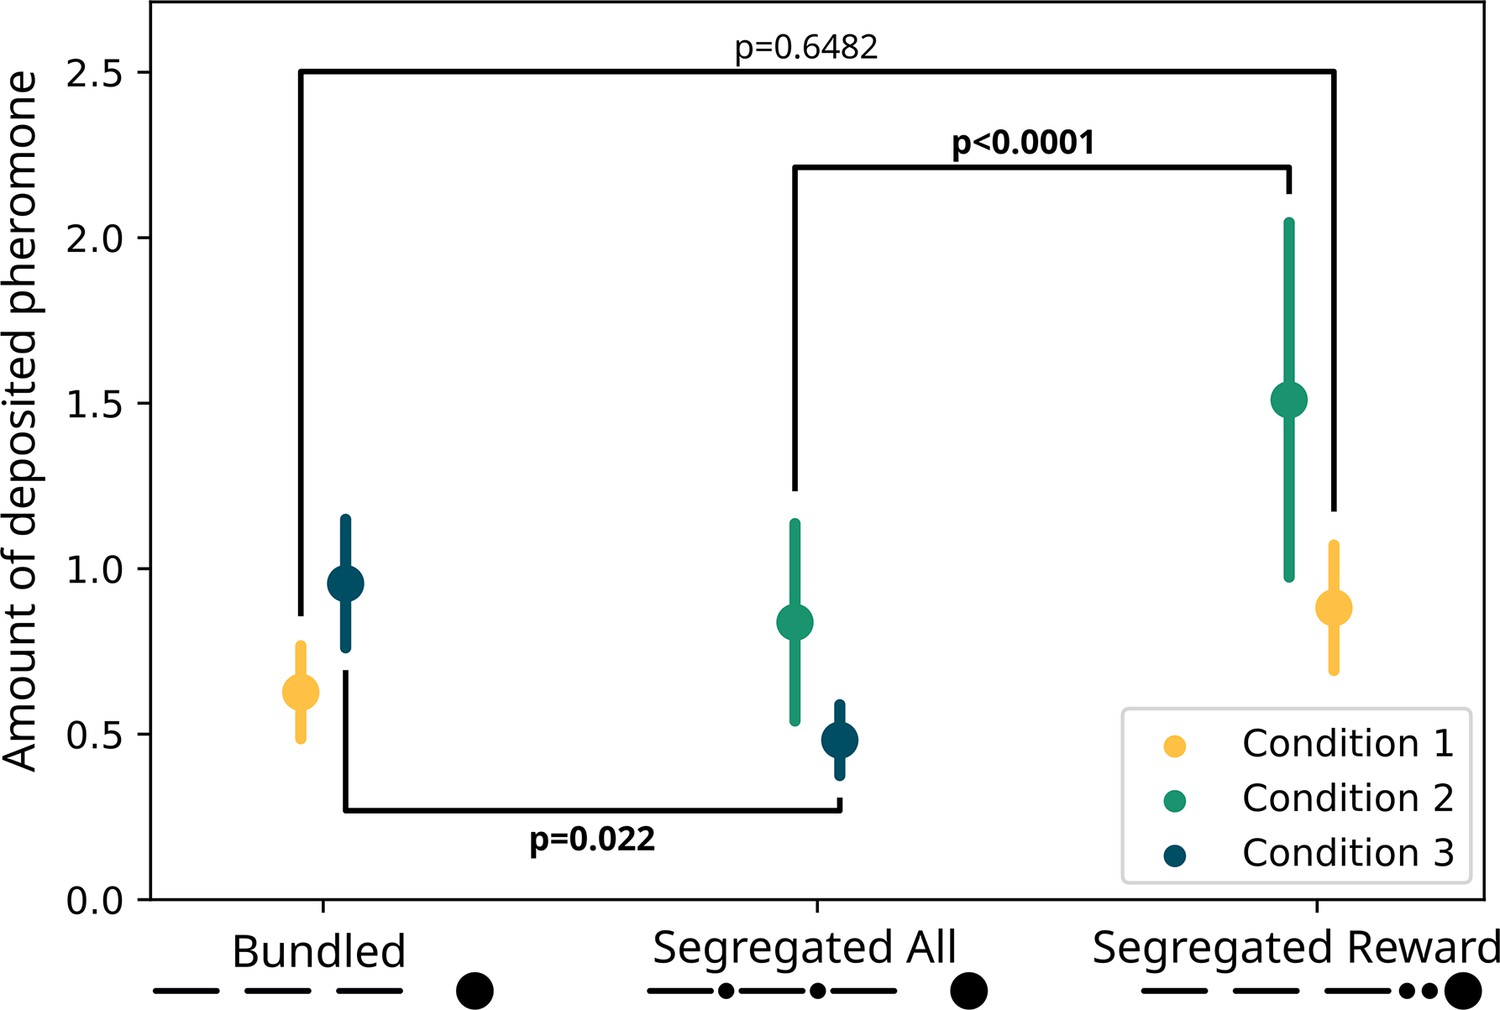
Modelled pheromone deposition for each treatment, across the three condition.
Y-axis: amount of deposited pheromone per runway section. Error bars represent standard error. In yellow, pheromone deposited in the ‘bundled’ vs. ‘segregated reward’ condition (n=40). The two treatments are not significantly different from each other (glmm post-hoc p=0.6482). In green, pheromone deposited in the ‘segregated all’ vs. ‘segregated reward’ condition (n=40). The two treatments are significantly different from each other (glmm post-hoc p<0.0001). In blue, pheromone deposited in the ‘segregated all’ vs. ‘bundled’ condition (n=40). The two treatments are significantly different from each other (glmm post-hoc p=0.022). All p-values are corrected for multiple testing.
Figure 5
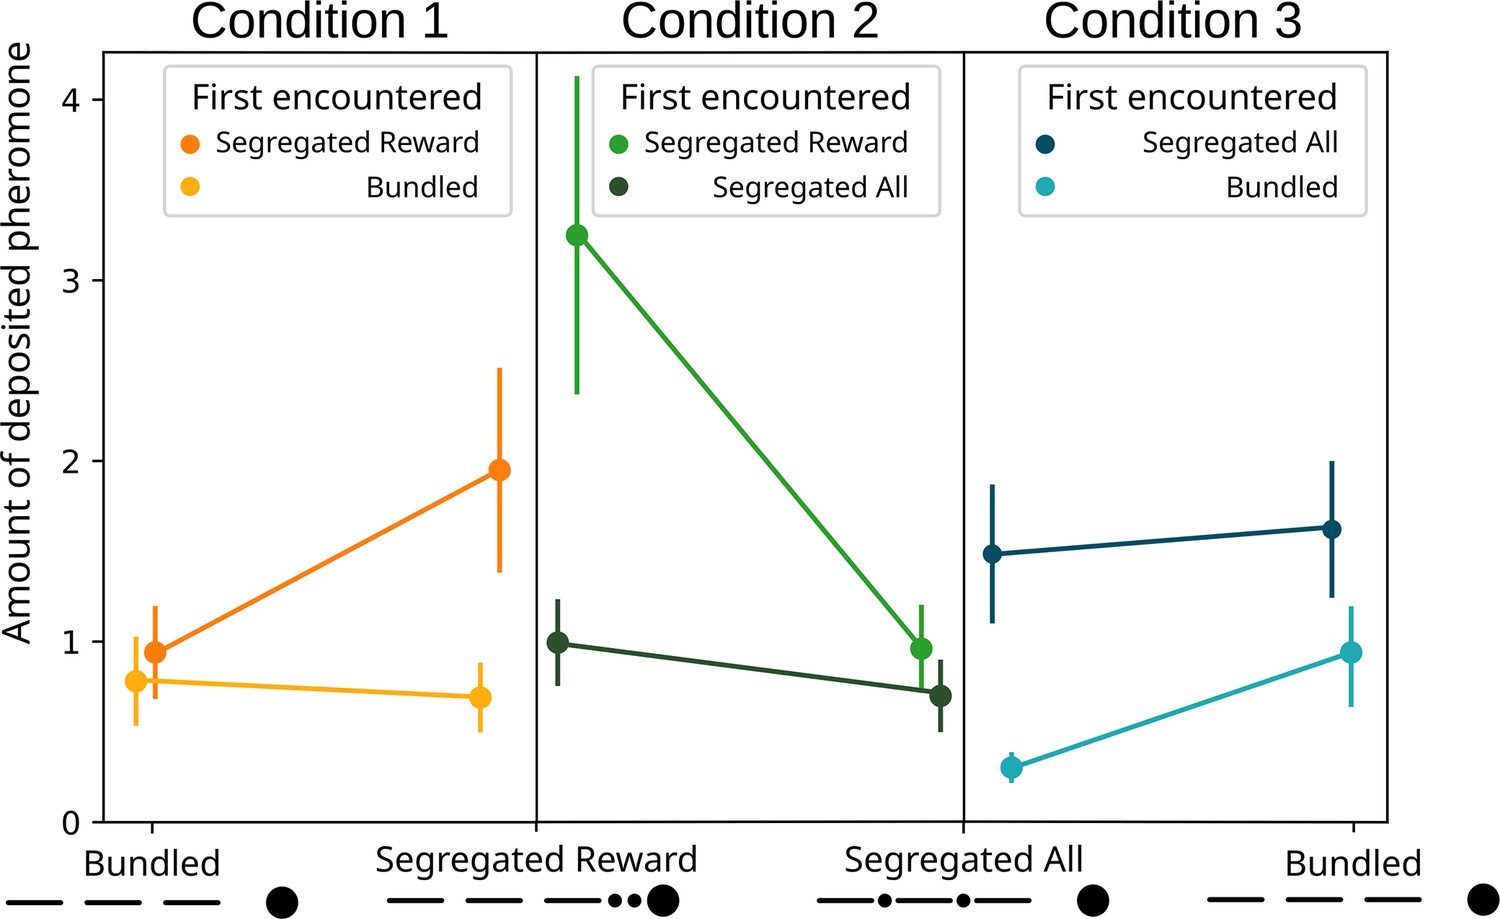
Modelled pheromone deposition for each treatment, across the three condition, including the influence of the first experienced option.
Y-axis: amount of deposited pheromone per runway section. Error bars represent standard error. n=40 for each condition. When ‘segregated reward’ is encountered first, in condition 2, the overall pheromone deposited is higher in respect to the ‘segregated all’ option (glmm post-hoc p=0.0022). In condition 3, when the ‘bundled’ option is encountered first, the overall pheromone deposited is lower in respect to the ‘segregated all’ option (glmm post-hoc p=0.0001).
Figure 6
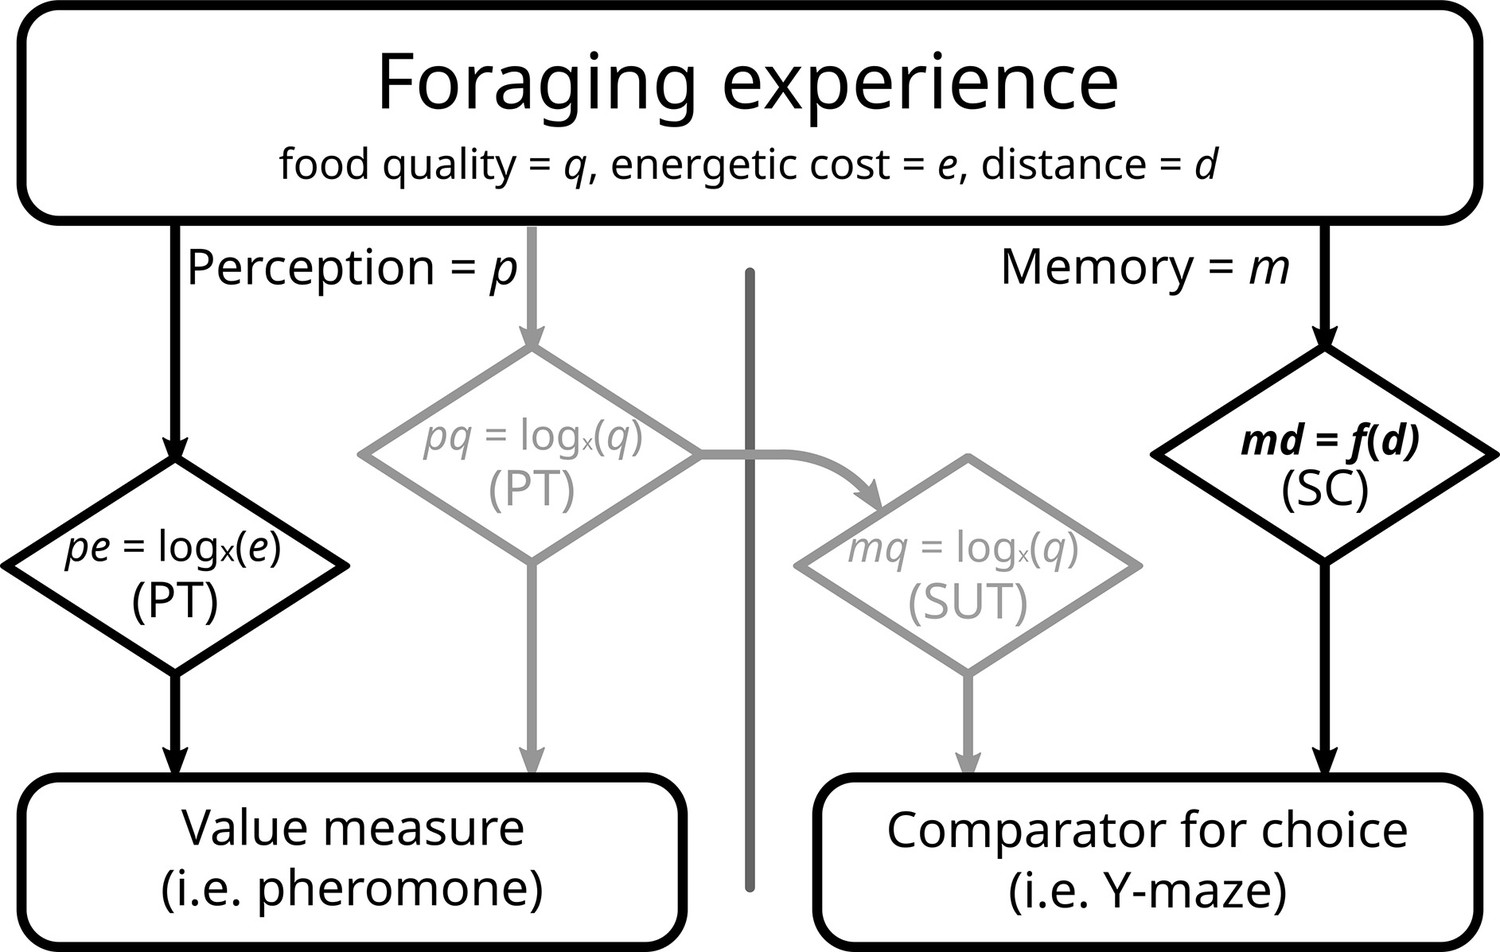
Proposed model of perception and memory in light of economic theories.
Perception can be the same as the formed memory, but not necessarily. During a foraging bout, the ant perceives (p) gains (food quality, q) and losses (energy spent to reach, e), according to prospect theory (PT). Food quality seems to be registered into memory (m) in to the same scale, congruently with scalar utility theory (SUT). Distance travelled (d) represents a special case, as it requires precise memory in the context of ant navigation. As such, it may possess a dedicated, direct, and linear memorization circuit (md), like the step counter (SC). In our experiment, we failed to imprint a segregation effect into rewards greyed out boxes; see Results and Discussion, and as such all our options were equal in this realm. With costs perceived logarithmically, but memorized linearly, we would expect the results observed in this experiment.
Videos
Video 1
Pheromone deposition example.
Additional files
-
Supplementary file 1
Full analysis script.
Entire statistical analysis code produced with R and Python, including data handling, figure code, and analysis results.
- https://cdn.elifesciences.org/articles/79314/elife-79314-supp1-v1.pdf
-
MDAR checklist
- https://cdn.elifesciences.org/articles/79314/elife-79314-mdarchecklist1-v1.pdf
-
Source data 1
Raw data of the experiments.
Raw data for the pilot and the three experiments. Metadata describing the columns of each csv file is included as a markdown.
- https://cdn.elifesciences.org/articles/79314/elife-79314-data1-v1.zip
Download links
A two-part list of links to download the article, or parts of the article, in various formats.
Downloads (link to download the article as PDF)
Open citations (links to open the citations from this article in various online reference manager services)
Cite this article (links to download the citations from this article in formats compatible with various reference manager tools)
Bundling and segregation affect pheromone deposition, but not choice, in an ant
eLife 11:e79314.
https://doi.org/10.7554/eLife.79314


