Echolocating bats prefer a high risk-high gain foraging strategy to increase prey profitability
- Zoophysiology, Department of Bioscience, Aarhus University, Denmark
- Acoustic and Functional Ecology, Max Planck Institute for Biological Intelligence, Germany
- Department of Animal Diversity and Resources, Institute of Biodiversity and Ecosystem Research, Bulgarian Academy of Sciences, Bulgaria
- Department of Zoology, Tel Aviv University, Israel
Figures
Figure 1 with 4 supplements
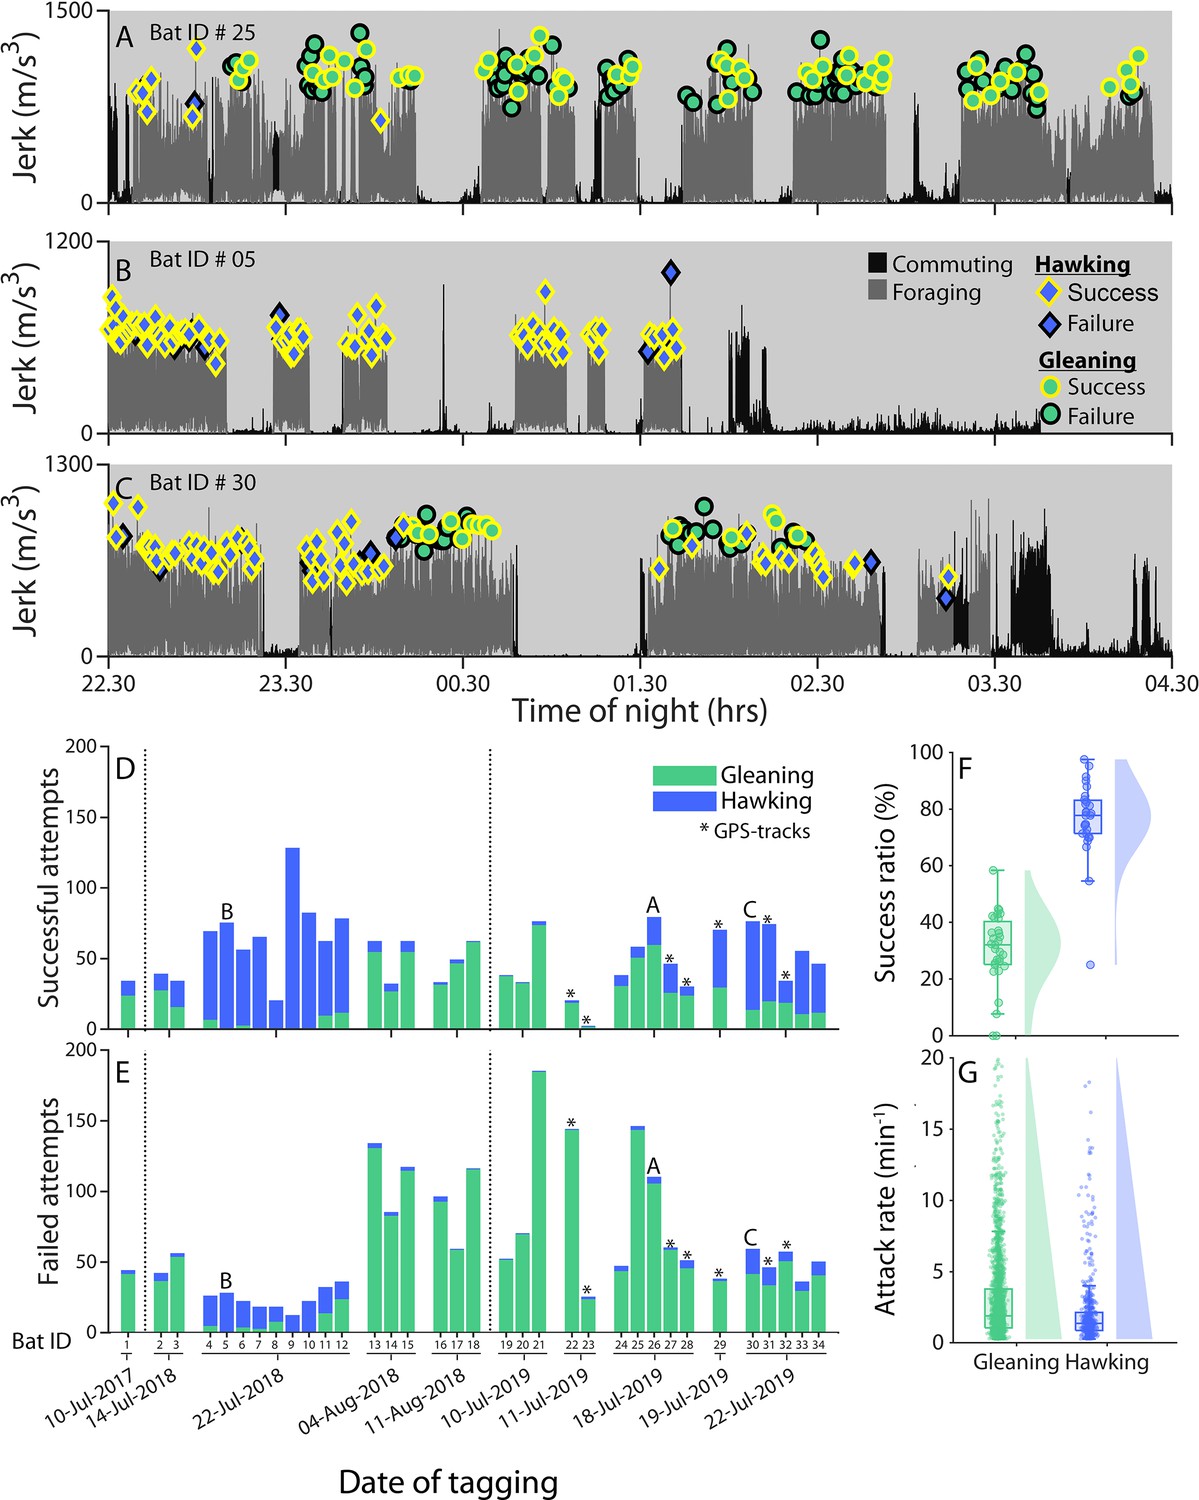
Greater mouse-eared bats tagged on different nights show wide variation in foraging strategy and success.
(A-C) The jerk (differential of on-animal recorded acceleration) reveals the overall movement of the bat by showing periods of no movement (rest) and strong movement (flight) for three different bats (summed values for Bat ID 25, 5, and 30 as depicted in panel D) and two different travel modes (commuting (dark gray) vs foraging (light gray)). We marked all prey attacks as either hawking (blue diamonds) or gleaning (green circles) by visual and auditory inspection of the sound and movement data. Prey captures were classified by audible mastication sounds as successful (yellow edge) or failures (black edge). The bats exemplified here either primarily gleaned (A), primarily hawked (B), or used both strategies in alternating bouts (C). ( D–E) Successful (D) and unsuccessful (E) prey attacks of all bats (N=34) grouped according to the night of tagging for aerial hawking (blue) and gleaning (green). Stars mark the bats equipped with GPS tags; A, B, and C mark the bats depicted in panels A-C. (F–G) The success ratio (F) reveals the percentage of all attacks that were successful per bat per night (dots), while attack rates (G) reveal the number of foraging attacks per minute for each bat per night (dots) with more than one prey attack per foraging strategy for aerial hawking (blue) and gleaning (green) along with kernel densities and boxplots.
Figure 1—figure supplement 1

Verification of ground capture attacks in the wild.
Synchronized audio and accelerometer signals during ground capture attacks are shown in the wild (left) and in a laboratory setup (right). The audio signals (upper two panels) are characterized by low output levels before the capture event. In contrast, the output levels increase afterward. When the bat lands on the ground (at around time = 2 s in both figures), a loud and broadband acoustic ‘landing‘signal appears. At the same time, a stereotypical acceleration pattern marks the landing, taxi, and take-off (lower panel). The peaks in the heave and sway dimensions (yellow and red) mark the time at which the bat lands on the ground.
Figure 1—figure supplement 2
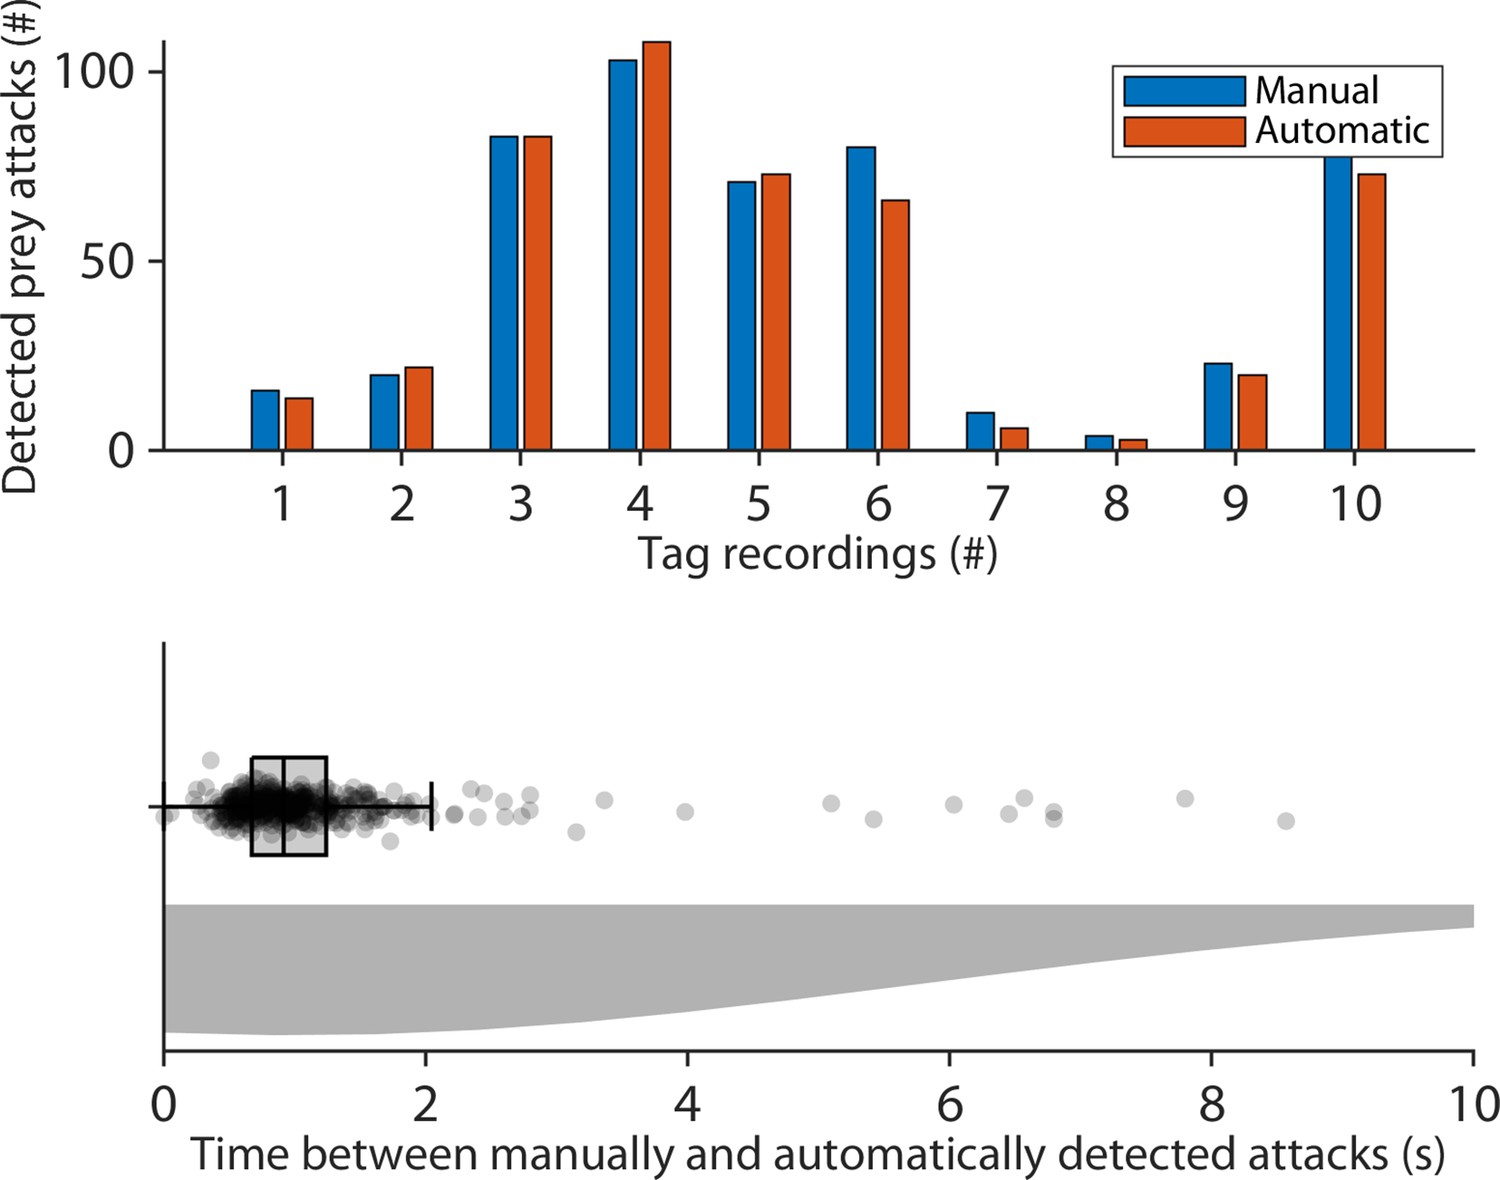
Differences between automatic and manual detection of aerial prey capture.
(Upper) Prey attacks were determined manually (blue) by visually inspecting the audio and movement data, and automatically (red) by a buzz detector. The buzz detector extracted times of prey attacks, if call intervals across six consecutive calls were below 10ms. Buzzes emitted prior to landing were excluded since they are landing buzzes and do not indicate prey attacks. The results show that the manual inspection of the data is similar to the automatic method. (Lower) The difference in seconds between the automatic and manual detections of prey attacks was small since the 95th quartile of the time differences was below 5.1 s.
Figure 1—figure supplement 3
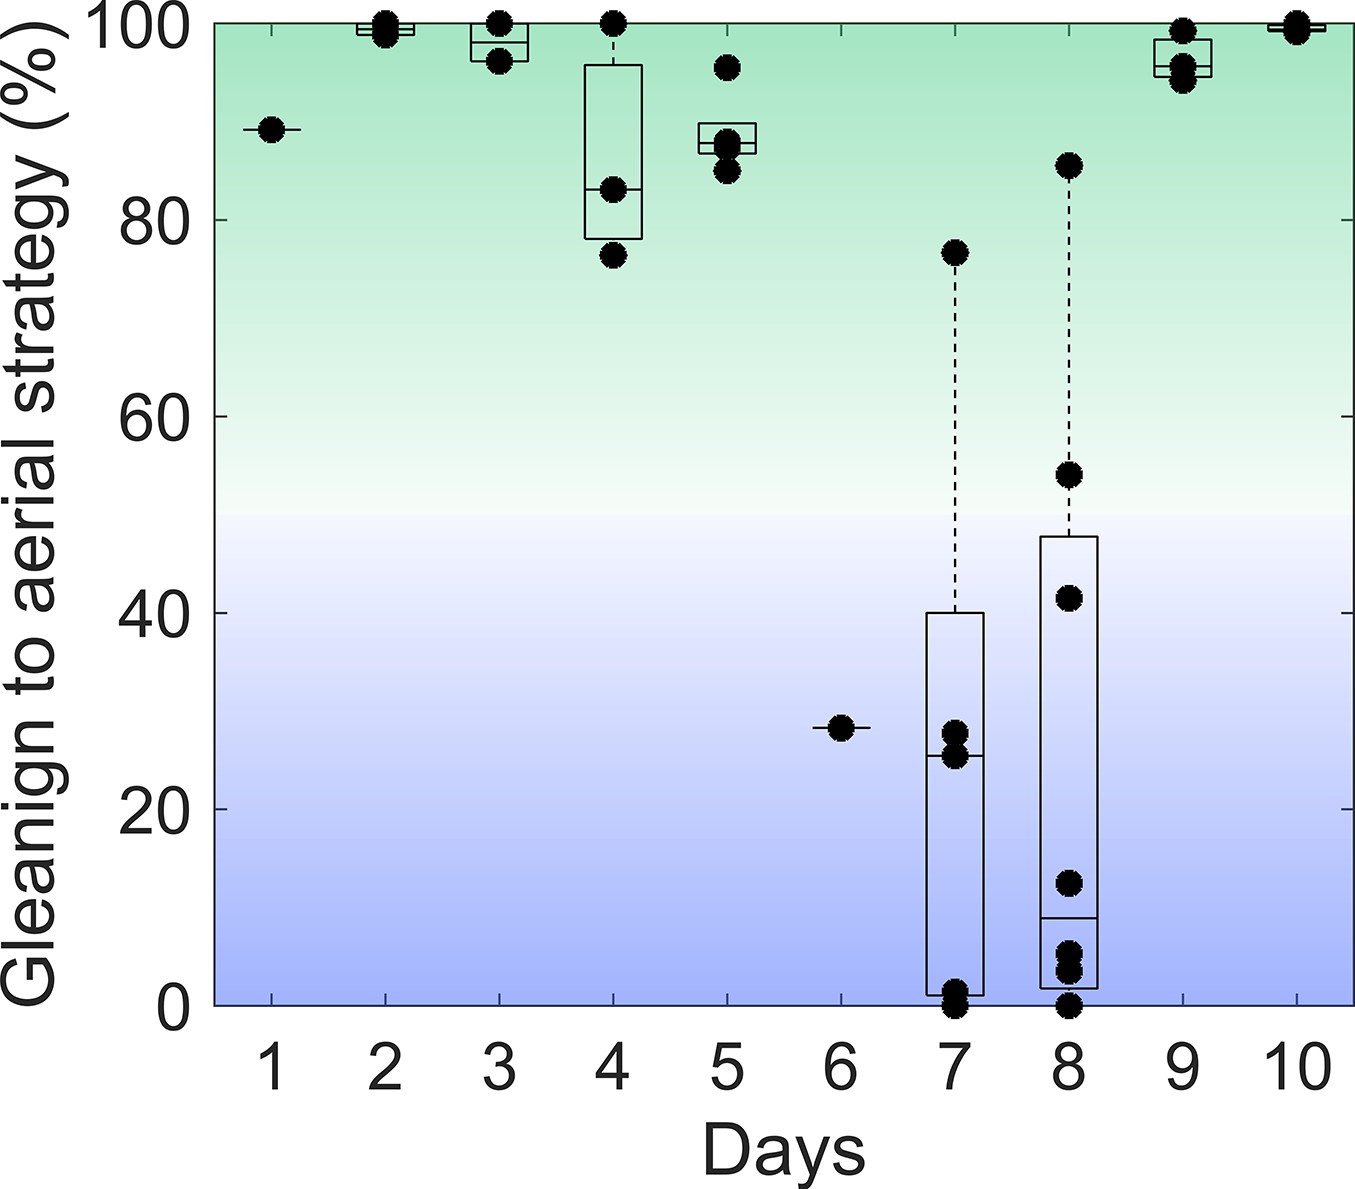
The night of tagging affected the dominant foraging strategy of each bat.
For each night of tagging, the ratio between the number of gleaning and aerial prey capture attacks was calculated. A ratio of one indicates that the bat only attacks gleaning prey (solid green); a ratio of zero indicates purely aerial prey attacks (solid blue).
Figure 1—figure supplement 4
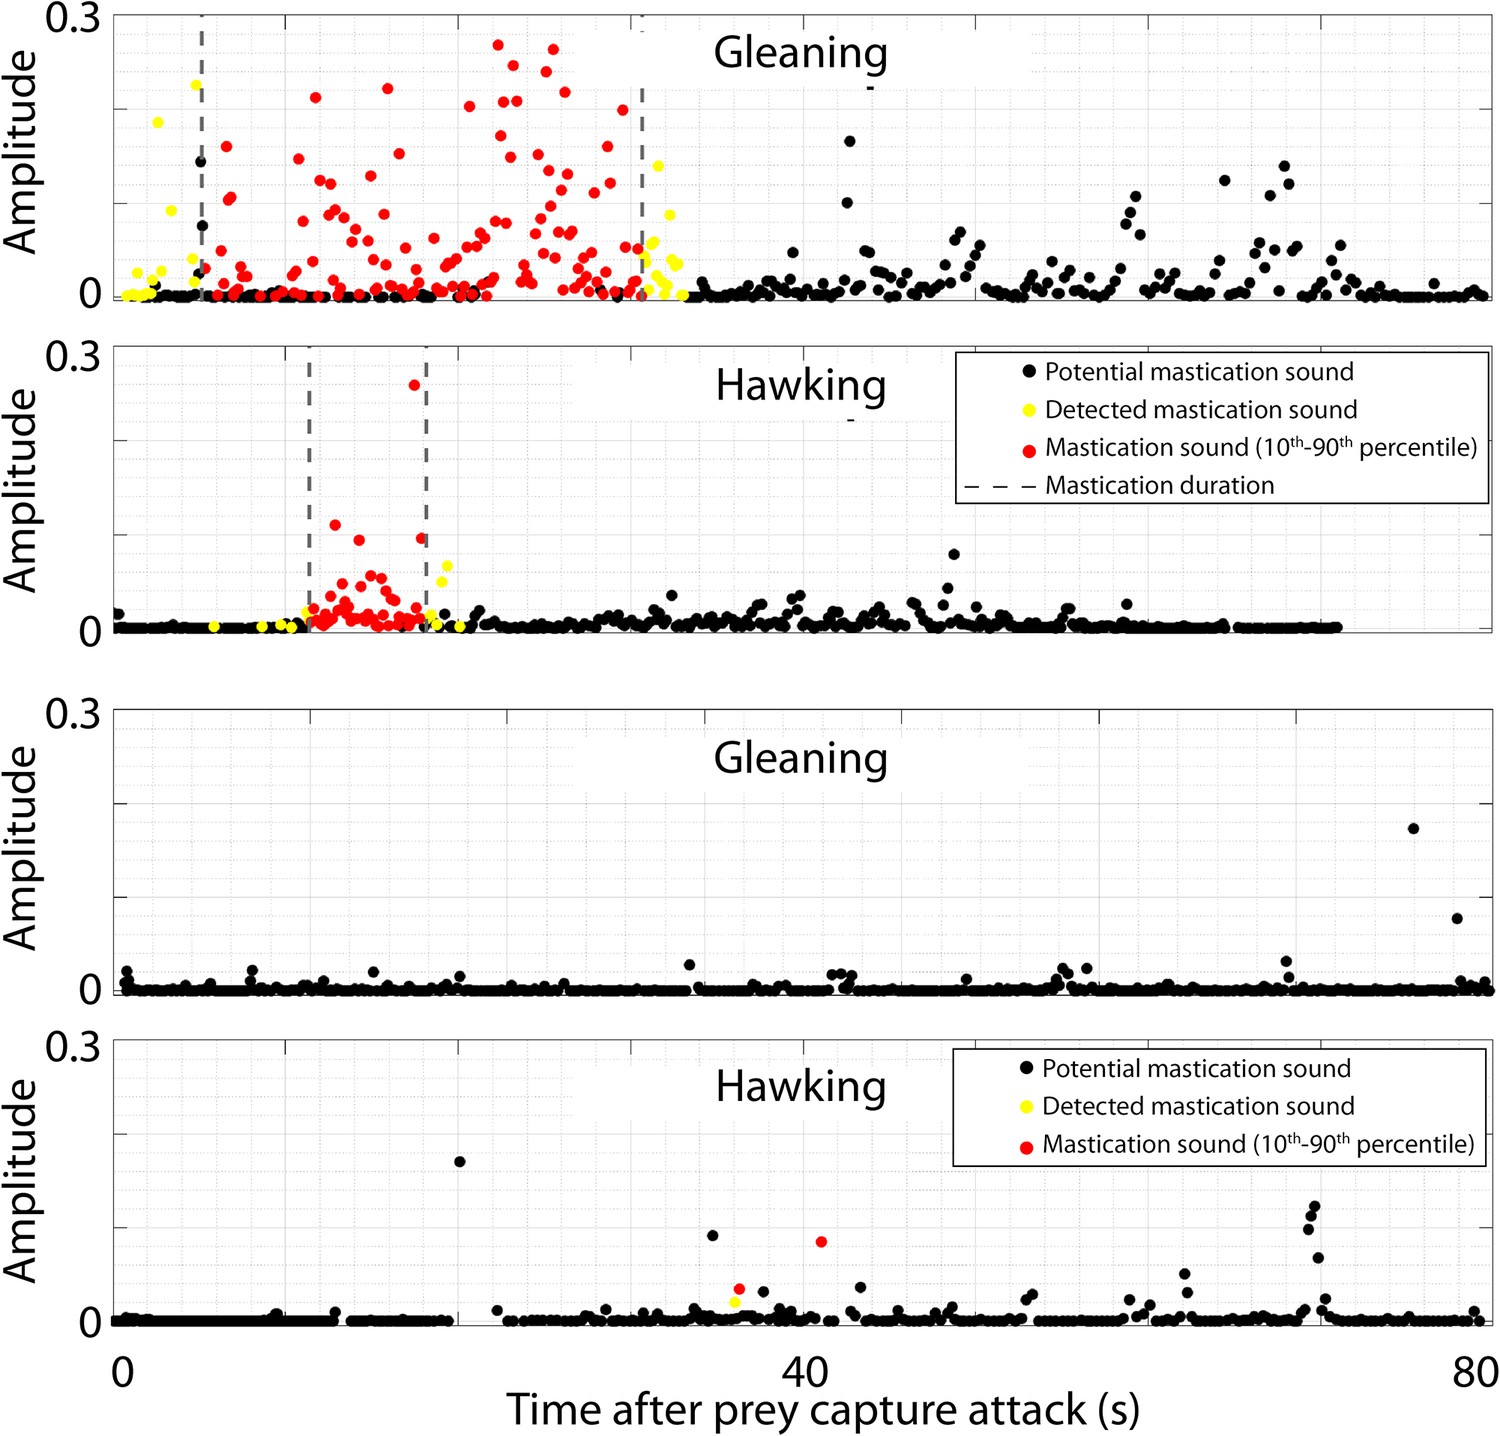
Verification of the automatic detector used to detect mastication sounds after prey capture attempts in the wild.
The intercall intervals between calls after a prey capture attack and until the next prey attack have been extracted, band-pass filtered (5–15 kHz), and convolved with a 40 ms Hanning window. The maximum of these filtered sounds is plotted in black. If the maximum value is above a threshold of 0.012 and the un-processed intercall interval had a peak frequency within 5–20 kHz, the intercall interval was identified as including a potential mastication (yellow). The 10th to 90th quantiles of the mastication sounds were extracted (gray dotted lines). Only detected chewing sounds within this interval were identified as mastication (red dots). The two upper panels illustrate a successful gleaning and hawking attack, while the bottom two panels visualize failed prey attacks.
Figure 2 with 2 supplements
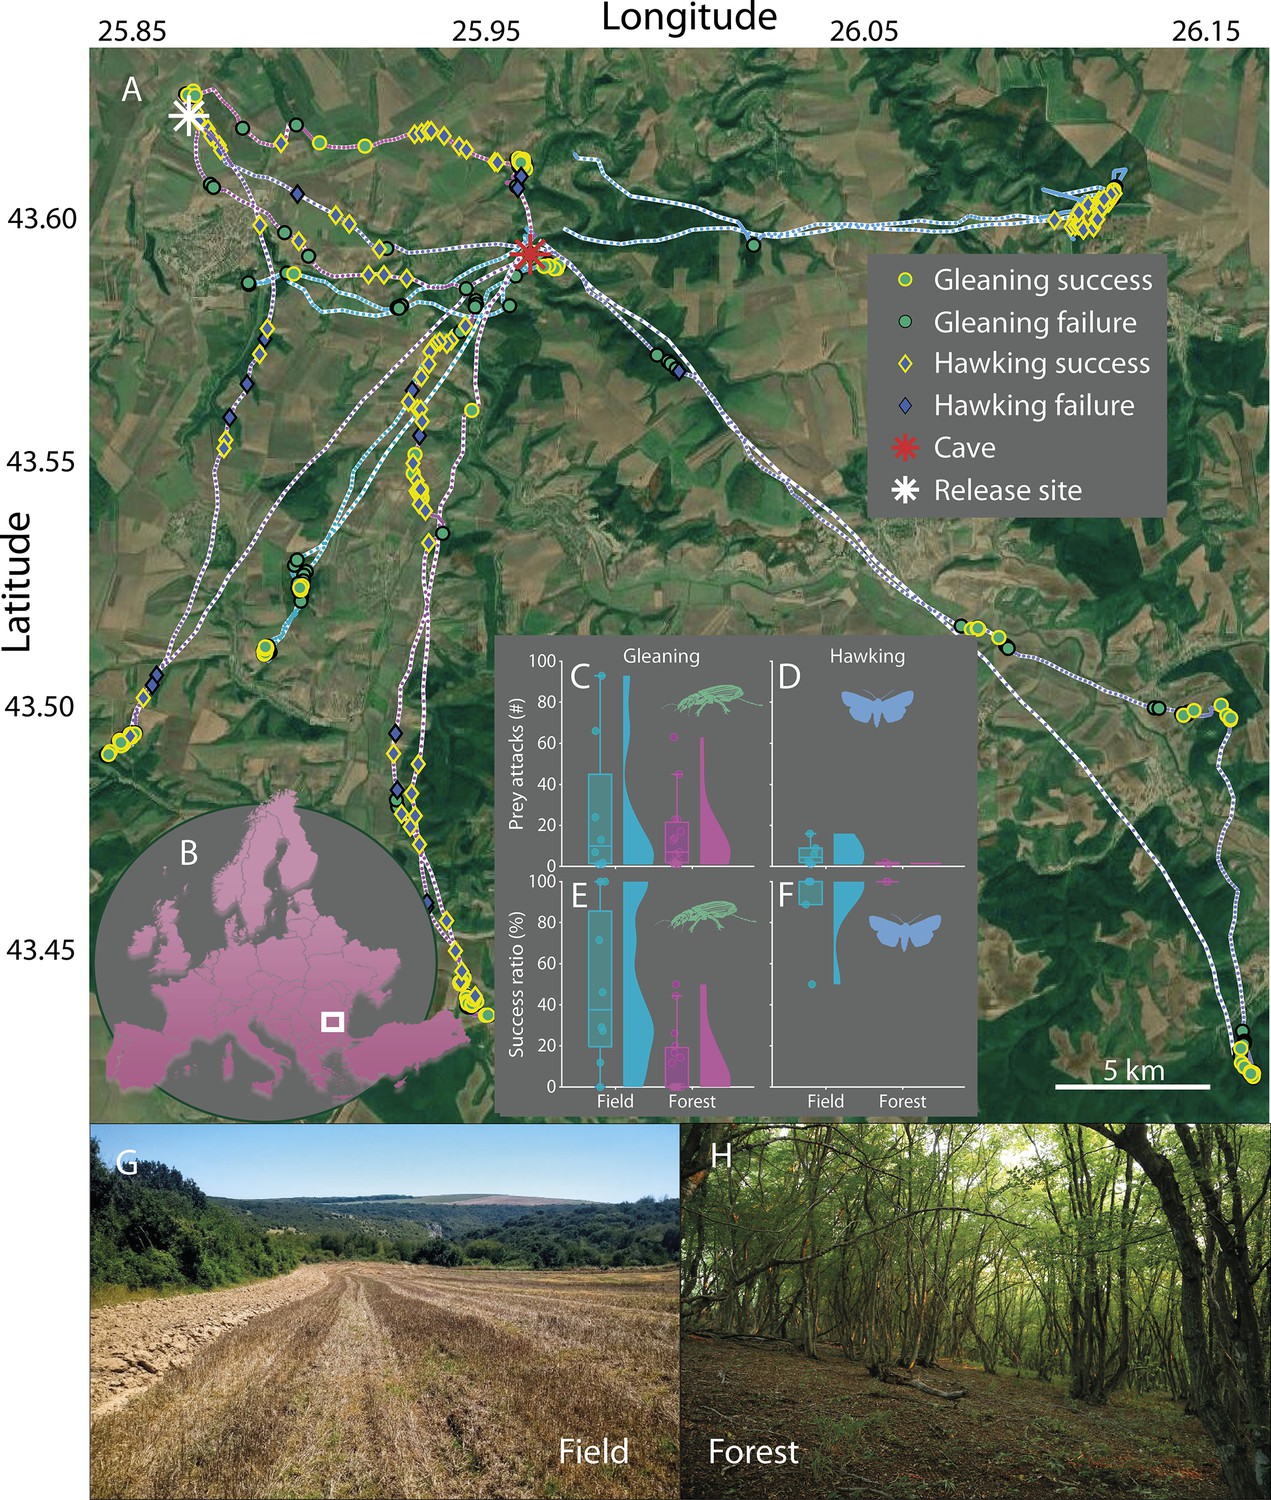
Habitat influences the foraging success of greater mouse-eared only when gleaning.
(A) Tracks of seven bats with GPS tags released either at the cave (red star) or at a location nearby (white star) and their foraging behavior: Gleaning (green circles) and hawking (blue diamonds) attacks along with their success (yellow edge) or failure (black edge). (B) The bats were tracked in North-Eastern Bulgaria (white square). C-F: Total prey attacks (CD) and success ratios per foraging bout (EF), for both habitats: open field (blue; G) and forest (magenta; H). Each data point corresponds to one foraging bout. G-H: The two main foraging habitats of greater mouse-eared bats: open fields (G) and the open spaces below the canopy in forests (H).
Figure 2—figure supplement 1
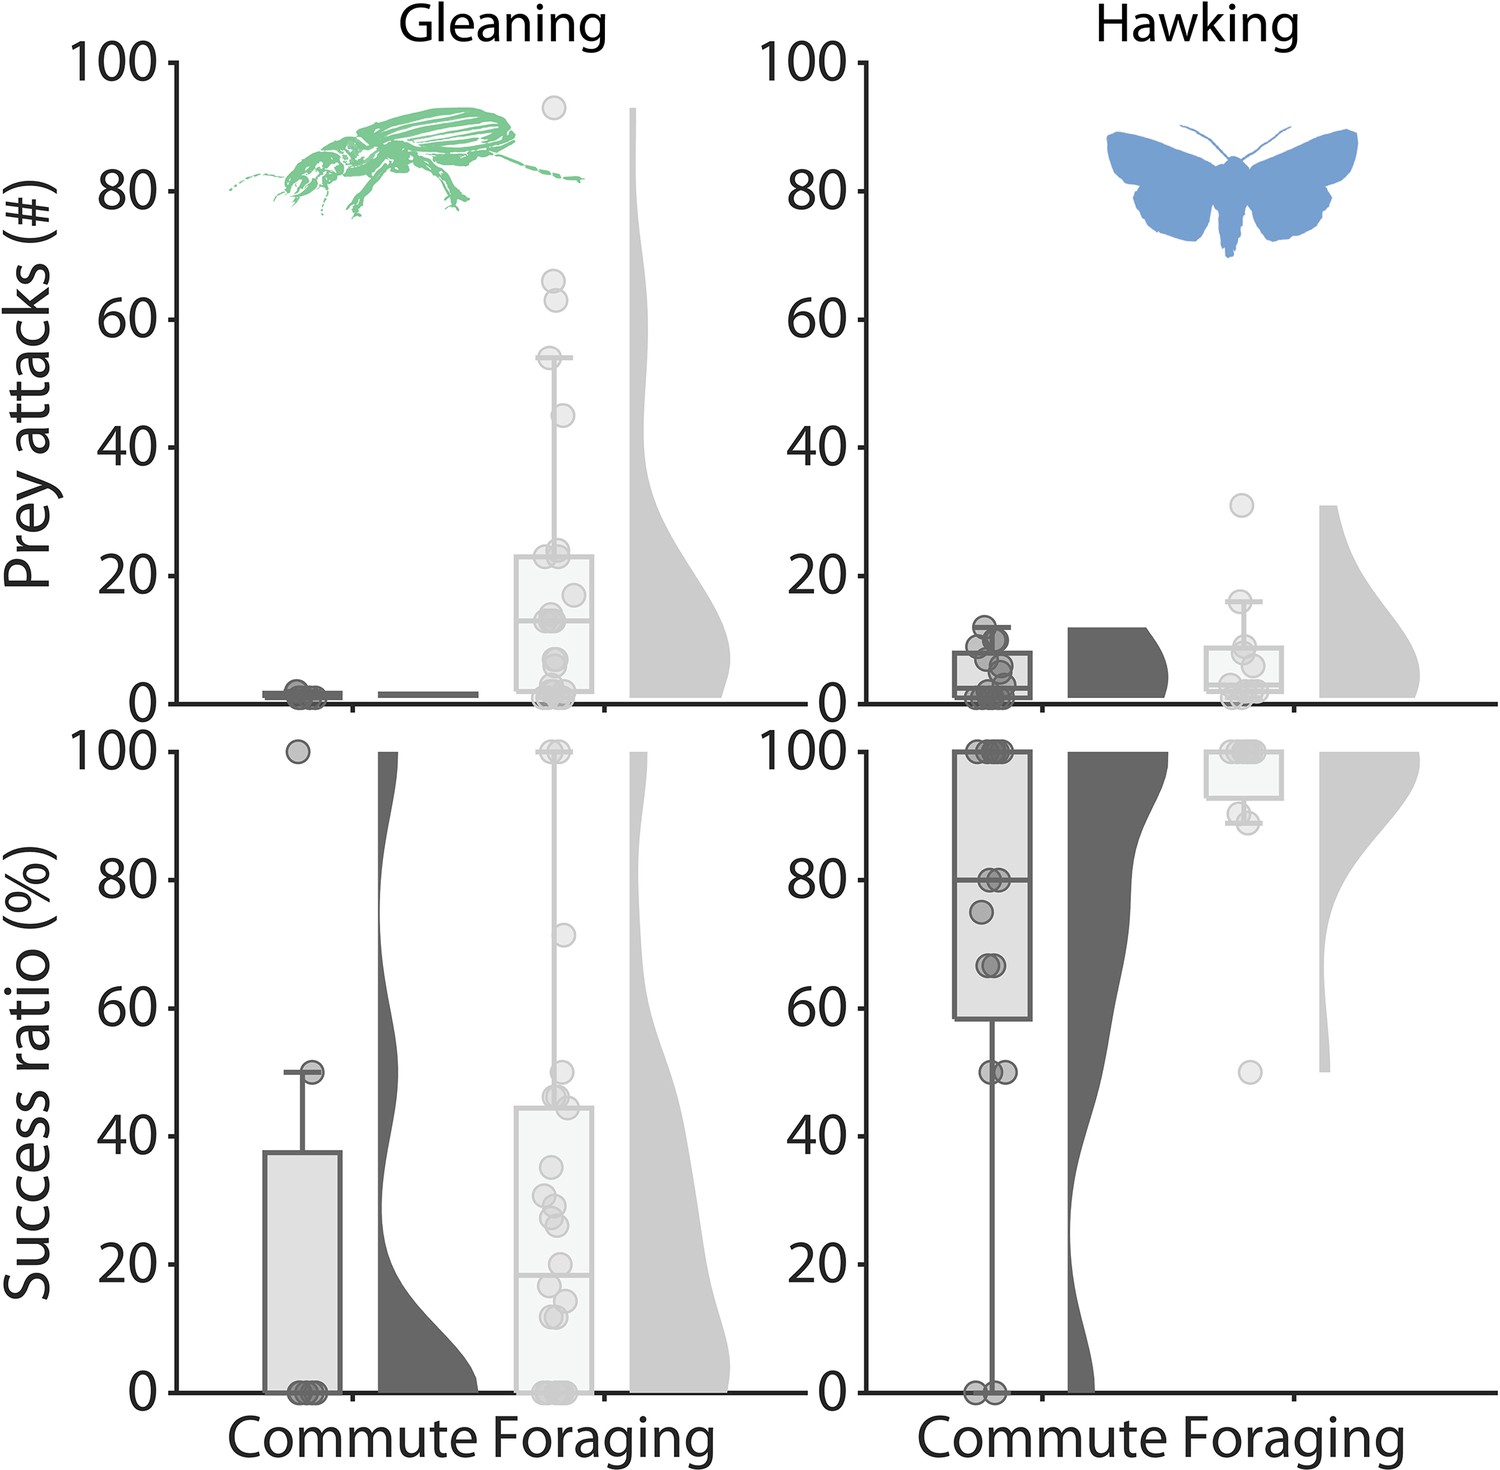
Foraging success and prey attack rates according to movement style.
The data was divided into either commuting to and from foraging sites and the cave (Commute) or foraging in foraging bouts (Foraging) and grouped according to foraging strategy.
Figure 2—figure supplement 2
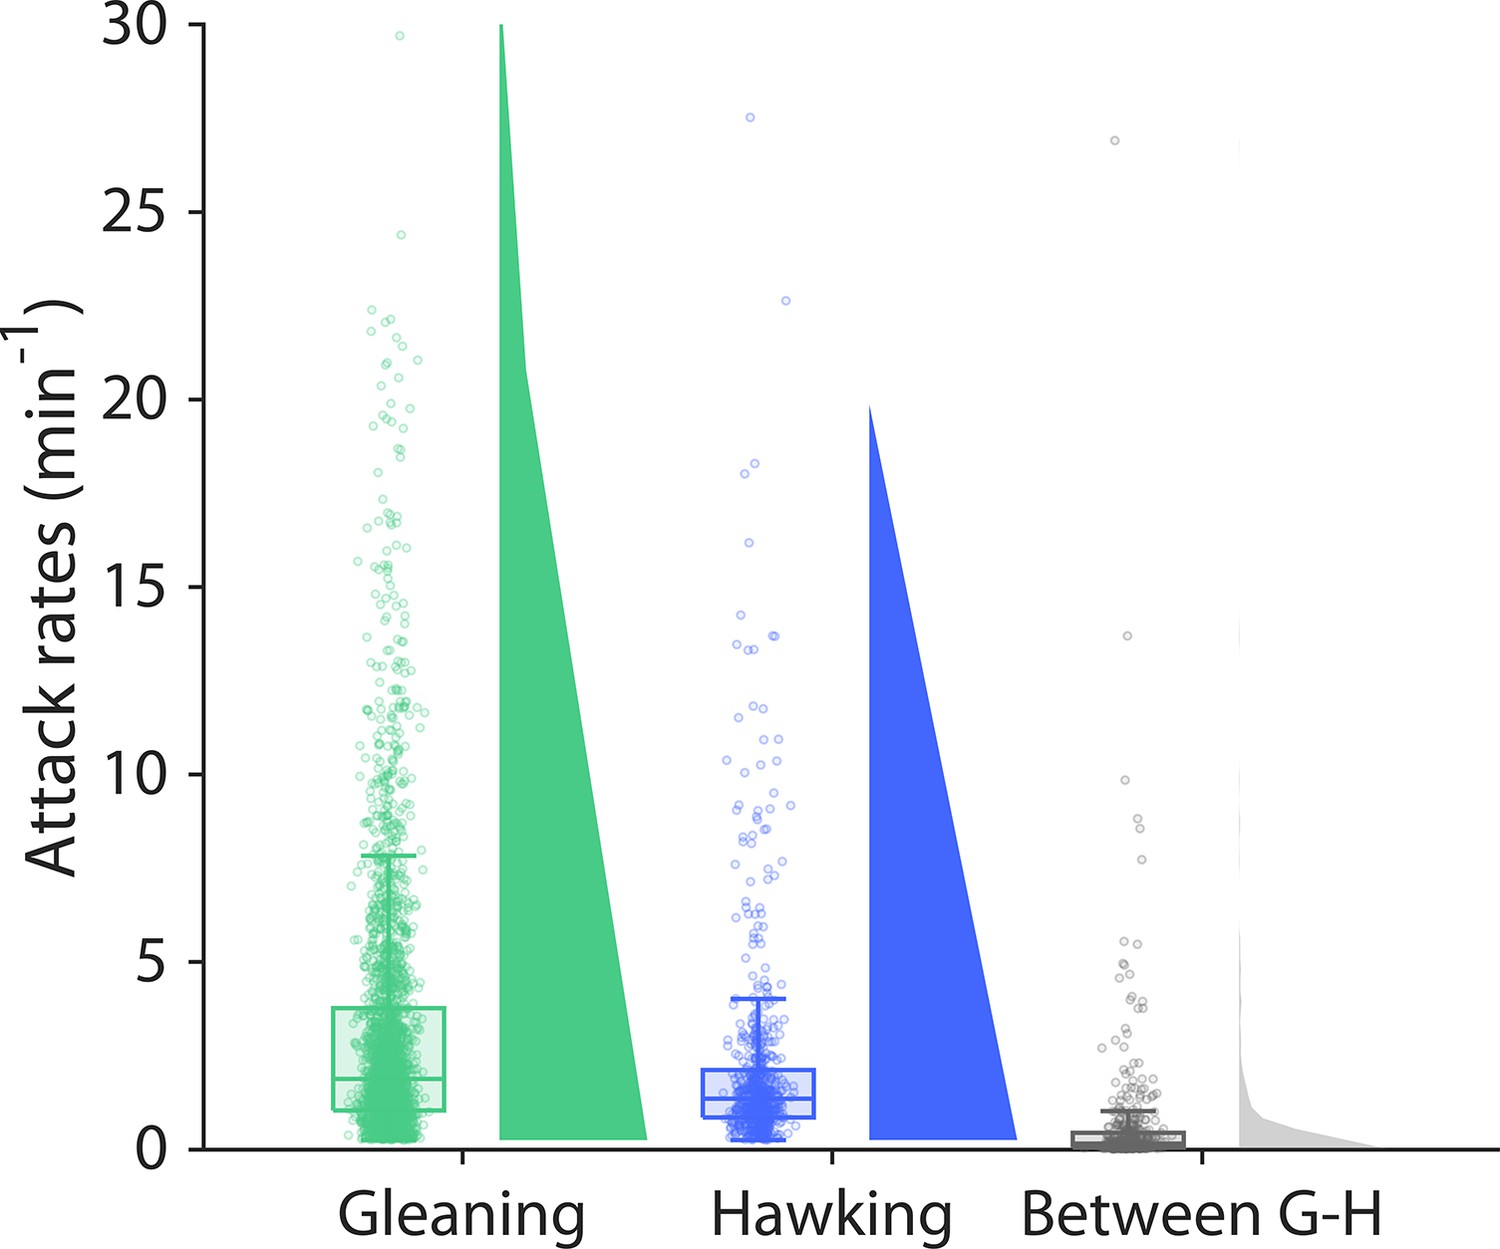
The bats mainly forage in dedicated foraging bouts.
The attack rate (i.e. the number of prey attacks per minute) for only gleaning attacks (green), only hawking (blue) attacks, or for both (purple). The attack rate across foraging strategies (gray) is on average 10 times slower than the attack rates only when gleaning or hawking. This shows that the bats mainly forage in bouts dedicated to either hawking or gleaning.
Figure 3 with 3 supplements
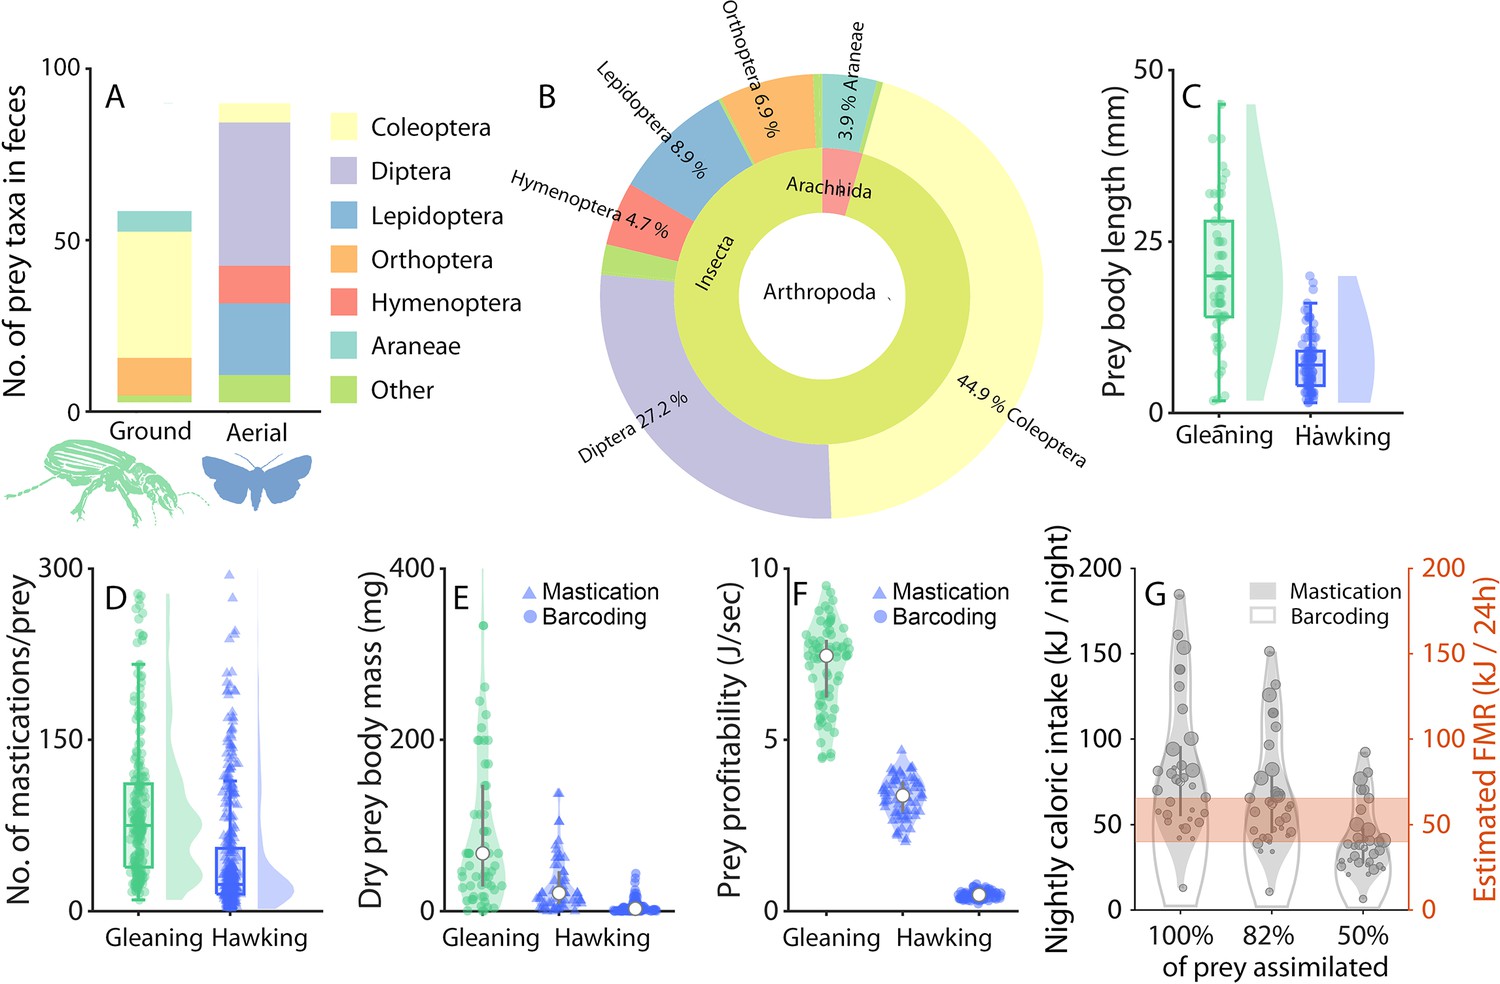
Ground prey is larger than aerial prey and sufficient to offset the lower foraging success ratios of gleaning.
(A-B) DNA metabarcoding of feces from 54 greater mouse-eared bats (48 females, six males). Insects were categorized as either ground (green) or aerial (blue). The few prey species (N=5) that are both aerial and ground were omitted from the analysis. Distribution of the targeted prey orders depicted as OTU (Operational Taxonomic Units) between ground (~40%) and aerial (~60%) niches (A) and across taxonomical units in the Arthropoda (B). (C-F): Prey properties and profitability during gleaning (ground prey, green) and aerial hawking (aerial prey, blue), with kernel densities and boxplots. (C) Body lengths of the prey sorted by foraging strategy. (D) Number of mastication sounds identified after each prey capture by an automatic detector (N=244 ground captures and 336 aerial captures across 10 bats). (E) Dry prey body masses of each prey type identified for gleaning via DNA metabarcoding (green circles) (DNA metabarcoding was used as the reference prey body mass for ground captures), and for aerial prey by mastication analysis (blue triangles) and DNA metabarcoding (blue circles). (F) Prey profitability of gleaning or hawking prey calculated from prey body masses from mastication analysis (triangles) or DNA metabarcoding (circles) combined with observed success ratios, handling, and search times (Figure 3—figure supplement 2). The data are plotted for bootstrapped data (N=70 random data points) due to varying sample sizes of each parameter. (G) Total caloric intake per night per bat calculated by multiplying the caloric intake per prey with the number of successful gleaning and hawking prey captures (Figure 1), and compared to the field metabolic rate of a 30 g bat estimated from the literature (O’Mara et al., 2017) (orange).
Figure 3—figure supplement 1
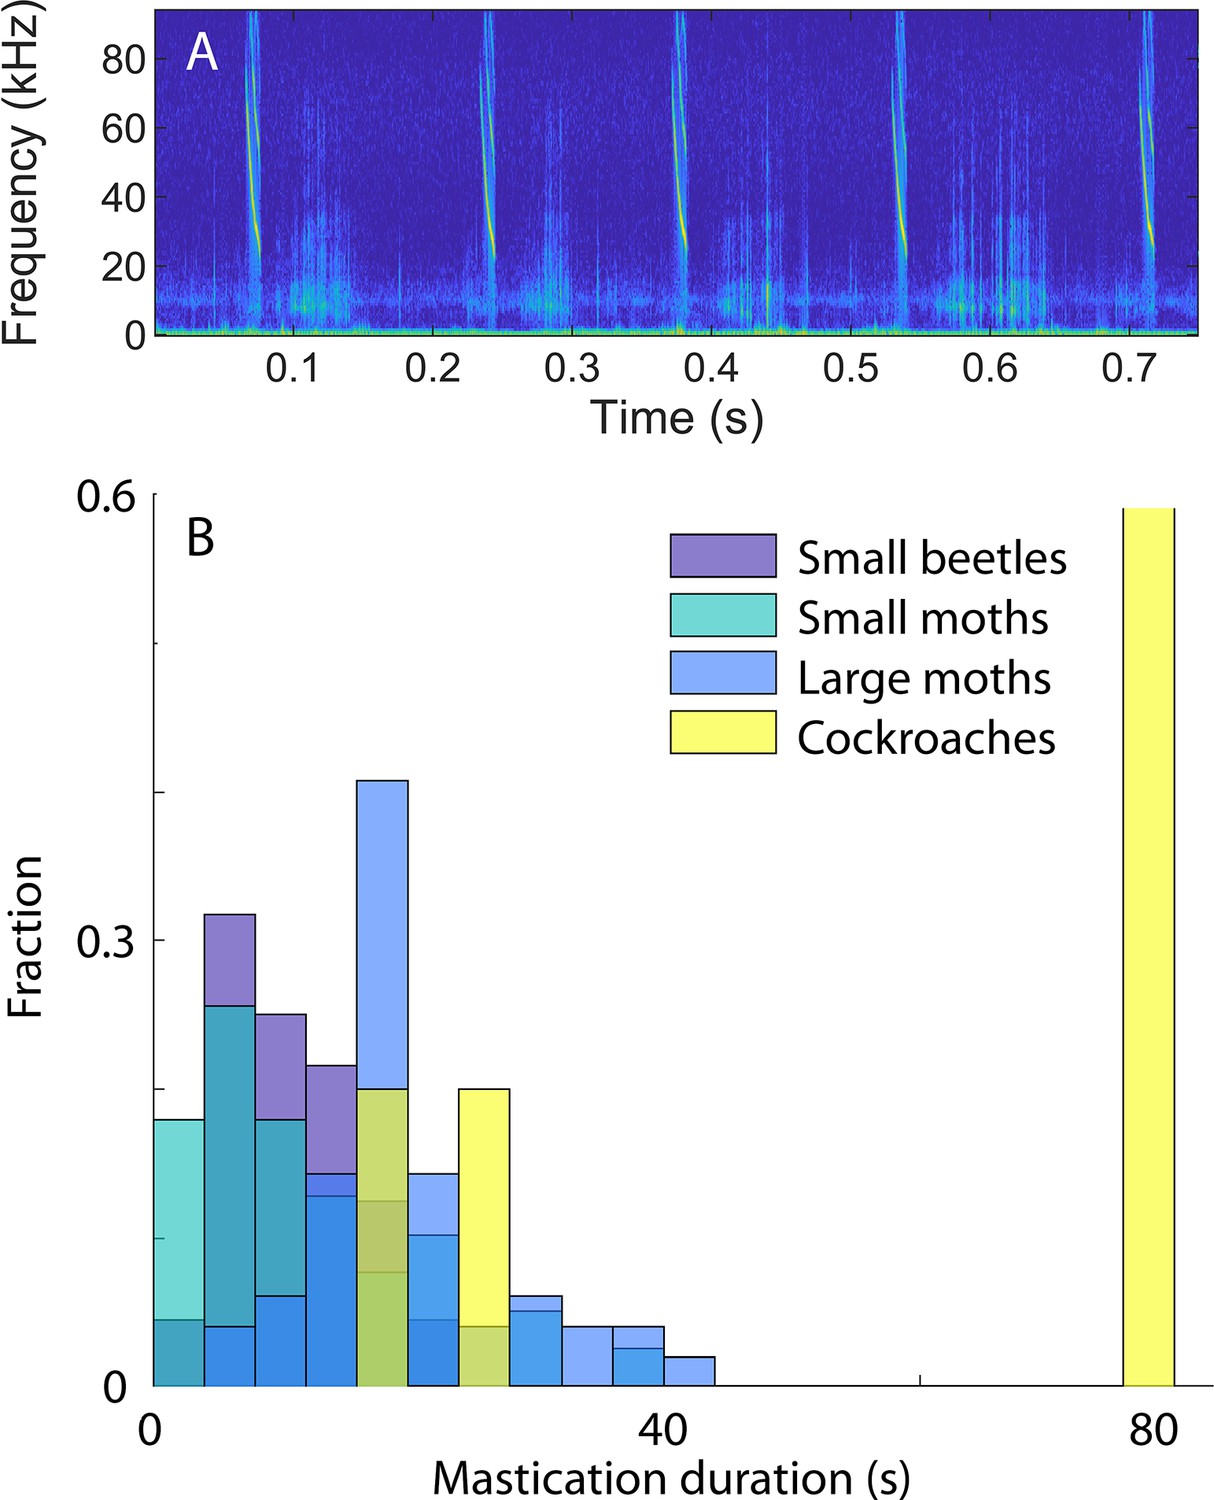
Mastication duration change with prey size.
(A) The mastication takes place between the emission of echolocation calls, and the sounds are easily recognizable in the spectrogram. The sounds can be extracted and used to estimate the duration of the mastication of each prey. (B) We fed bats prey of different sizes and extracted the duration of the chewing while the bats were flying. The duration of the chewing was dependent on the size of the known prey types in the laboratory experiments: The bigger the prey, the longer the duration of the chewing.
Figure 3—figure supplement 2
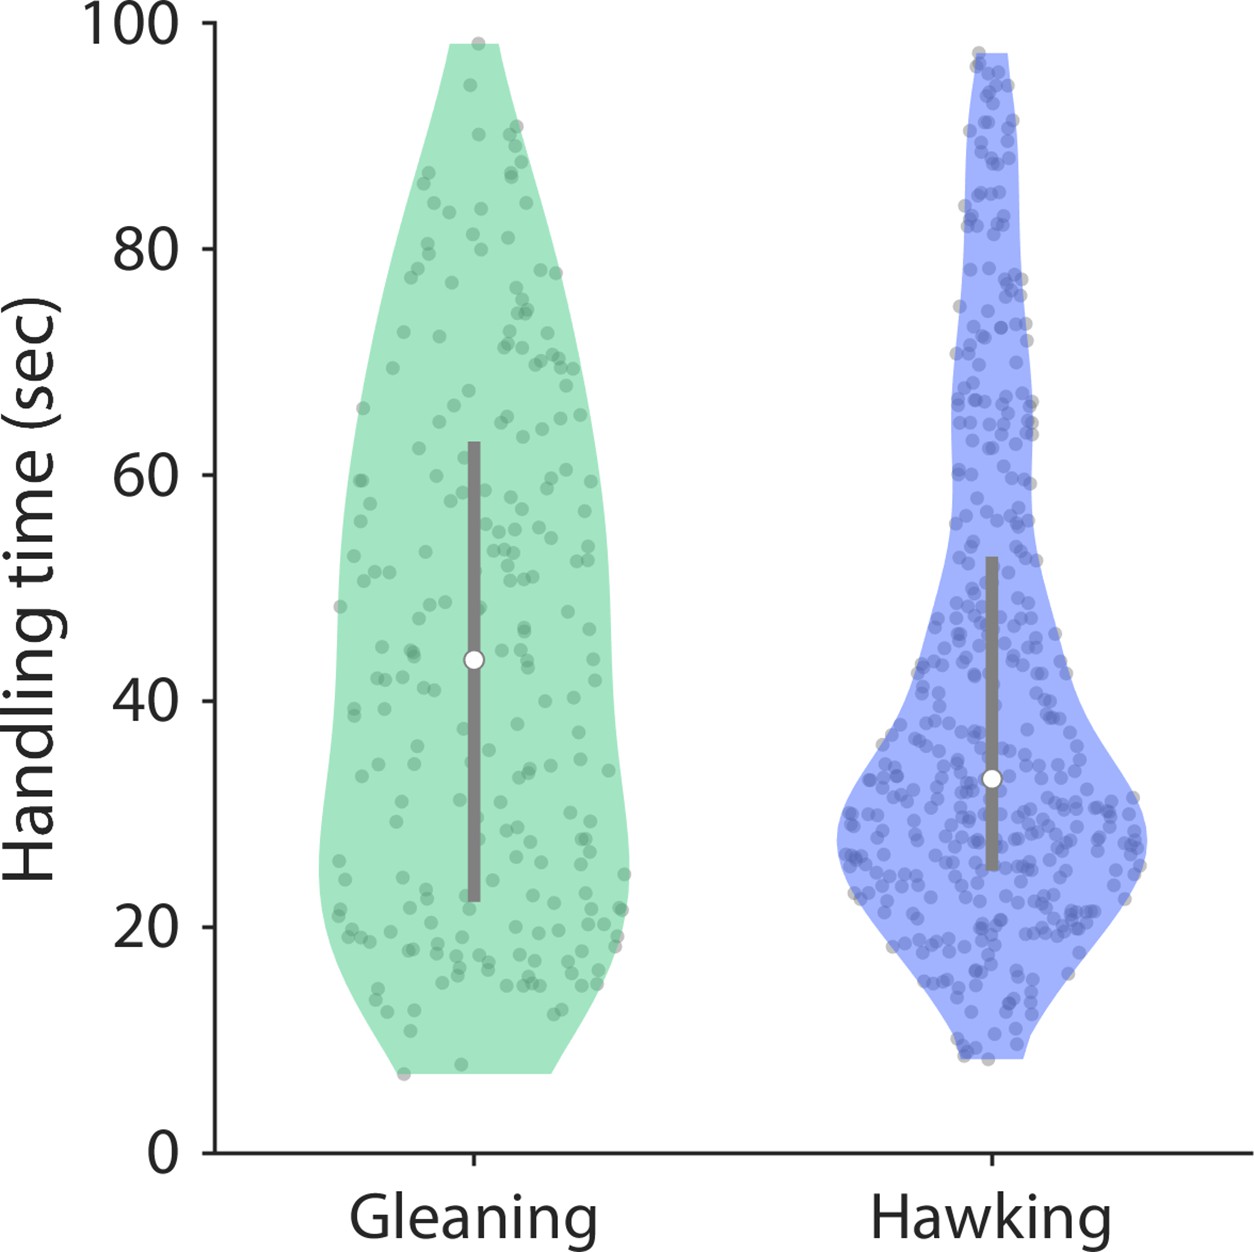
The handling time of the prey caught either by gleaning or hawking is similar.
Handling time was estimated as the time between the first and the last mastication sound. The first and last mastication sounds were determined as the 10th and 90th percentile of mastication sounds detected by an automatic mastication detector.
Figure 3—figure supplement 3
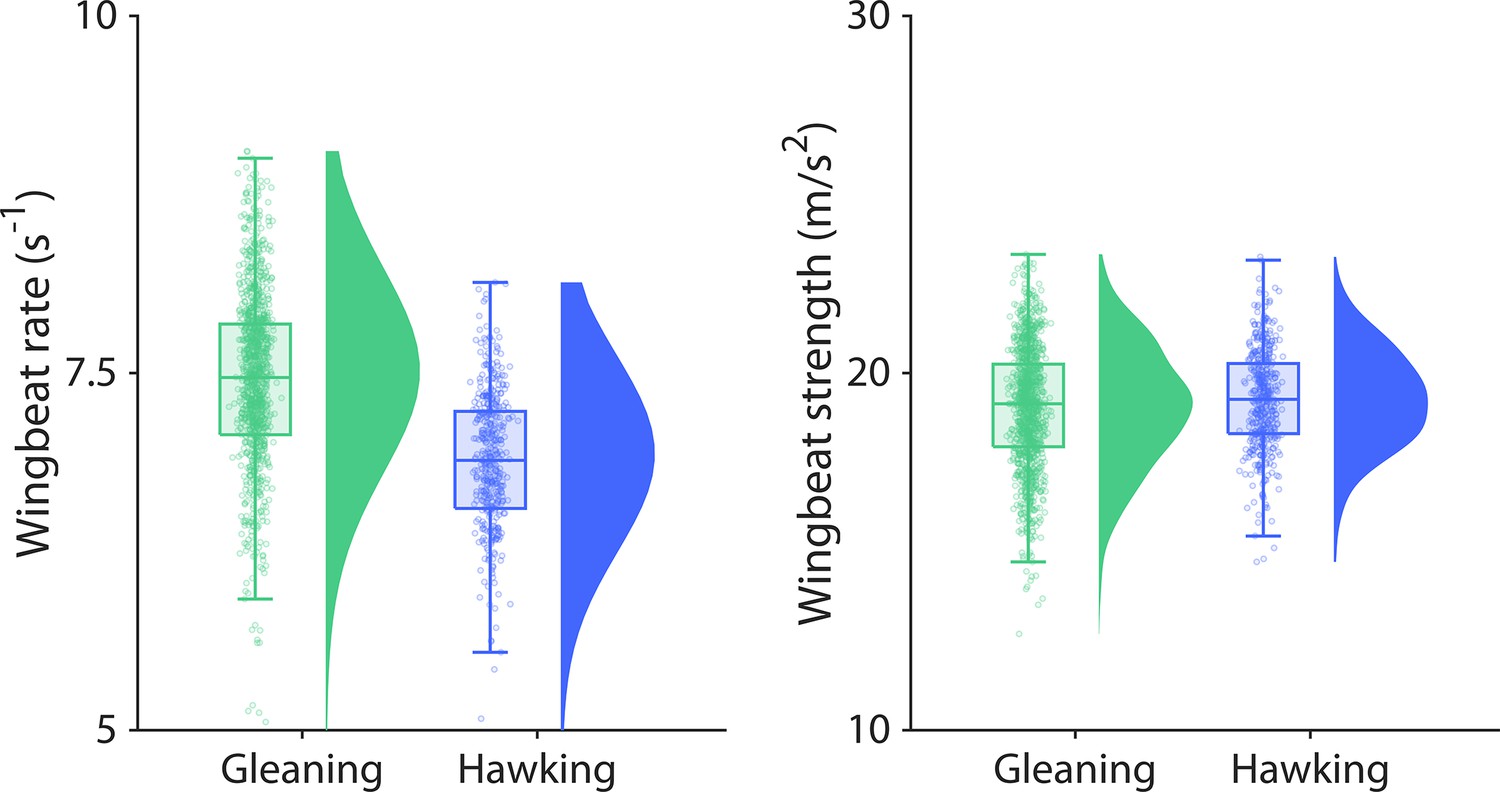
Wingbeat rate and strength are similar across foraging strategies.
(A) The mean wingbeat rate of the time interval between each prey attack is similar between both foraging strategies. (B) The wingbeat strength was calculated as the mean of the peak acceleration of each wingbeat in the time between prey attacks and was also similar between foraging strategies. All data are plotted for aerial hawking (blue) and gleaning (green) along with kernel densities and boxplots. Each dot indicates one prey capture attack.
Videos
Video 1
A bat captures prey on the ground in a forest floor reconstructed in a flight room while carrying a tag.
We used these laboratory experiments to ground truth in the wild data.
Video 2
Synchronized audio and acceleration data of a ground capture in the wild.
Here, the mating song of the targeted bush cricket is audible and can be clearly seen in the spectrogram.
Video 3
A trained greater mouse-eared bat captures a tethered moth.
We used these video recordings to ground truth the data from the wild.
Video 4
One minute of aerial hunting by a wild greater mouse-eared bat.
The 3D flight pattern is reconstructed from the sensor data on the tag and is shown in white. Each aerial prey attack is marked as circles color-coded according to foraging success (green = success vs red = failure).
Video 5
Aerial capture in the lab with a tag.
We trained bats to catch tethered moths or mealworms with and without tags in a dark flight room while filming their behavior with an infrared camera.
Video 6
Mastication of a bat is used to determine success ratios and prey sizes.
The audible mastication sounds of the greater mouse-eared bats were used to determine successful prey attacks, and to measure the relative prey sizes between foraging strategies.
Additional files
-
MDAR checklist
- https://cdn.elifesciences.org/articles/84190/elife-84190-mdarchecklist1-v1.pdf
-
Supplementary file 1
Metadata on bats, tagging experiments and statistical models.
- https://cdn.elifesciences.org/articles/84190/elife-84190-supp1-v1.xlsx
Download links
A two-part list of links to download the article, or parts of the article, in various formats.
Downloads (link to download the article as PDF)
Open citations (links to open the citations from this article in various online reference manager services)
Cite this article (links to download the citations from this article in formats compatible with various reference manager tools)
Echolocating bats prefer a high risk-high gain foraging strategy to increase prey profitability
eLife 12:e84190.
https://doi.org/10.7554/eLife.84190


