Large depth differences between target and flankers can increase crowding: Evidence from a multi-depth plane display
- Department of Psychology, Northeastern University, United States
Figures
Figure 1
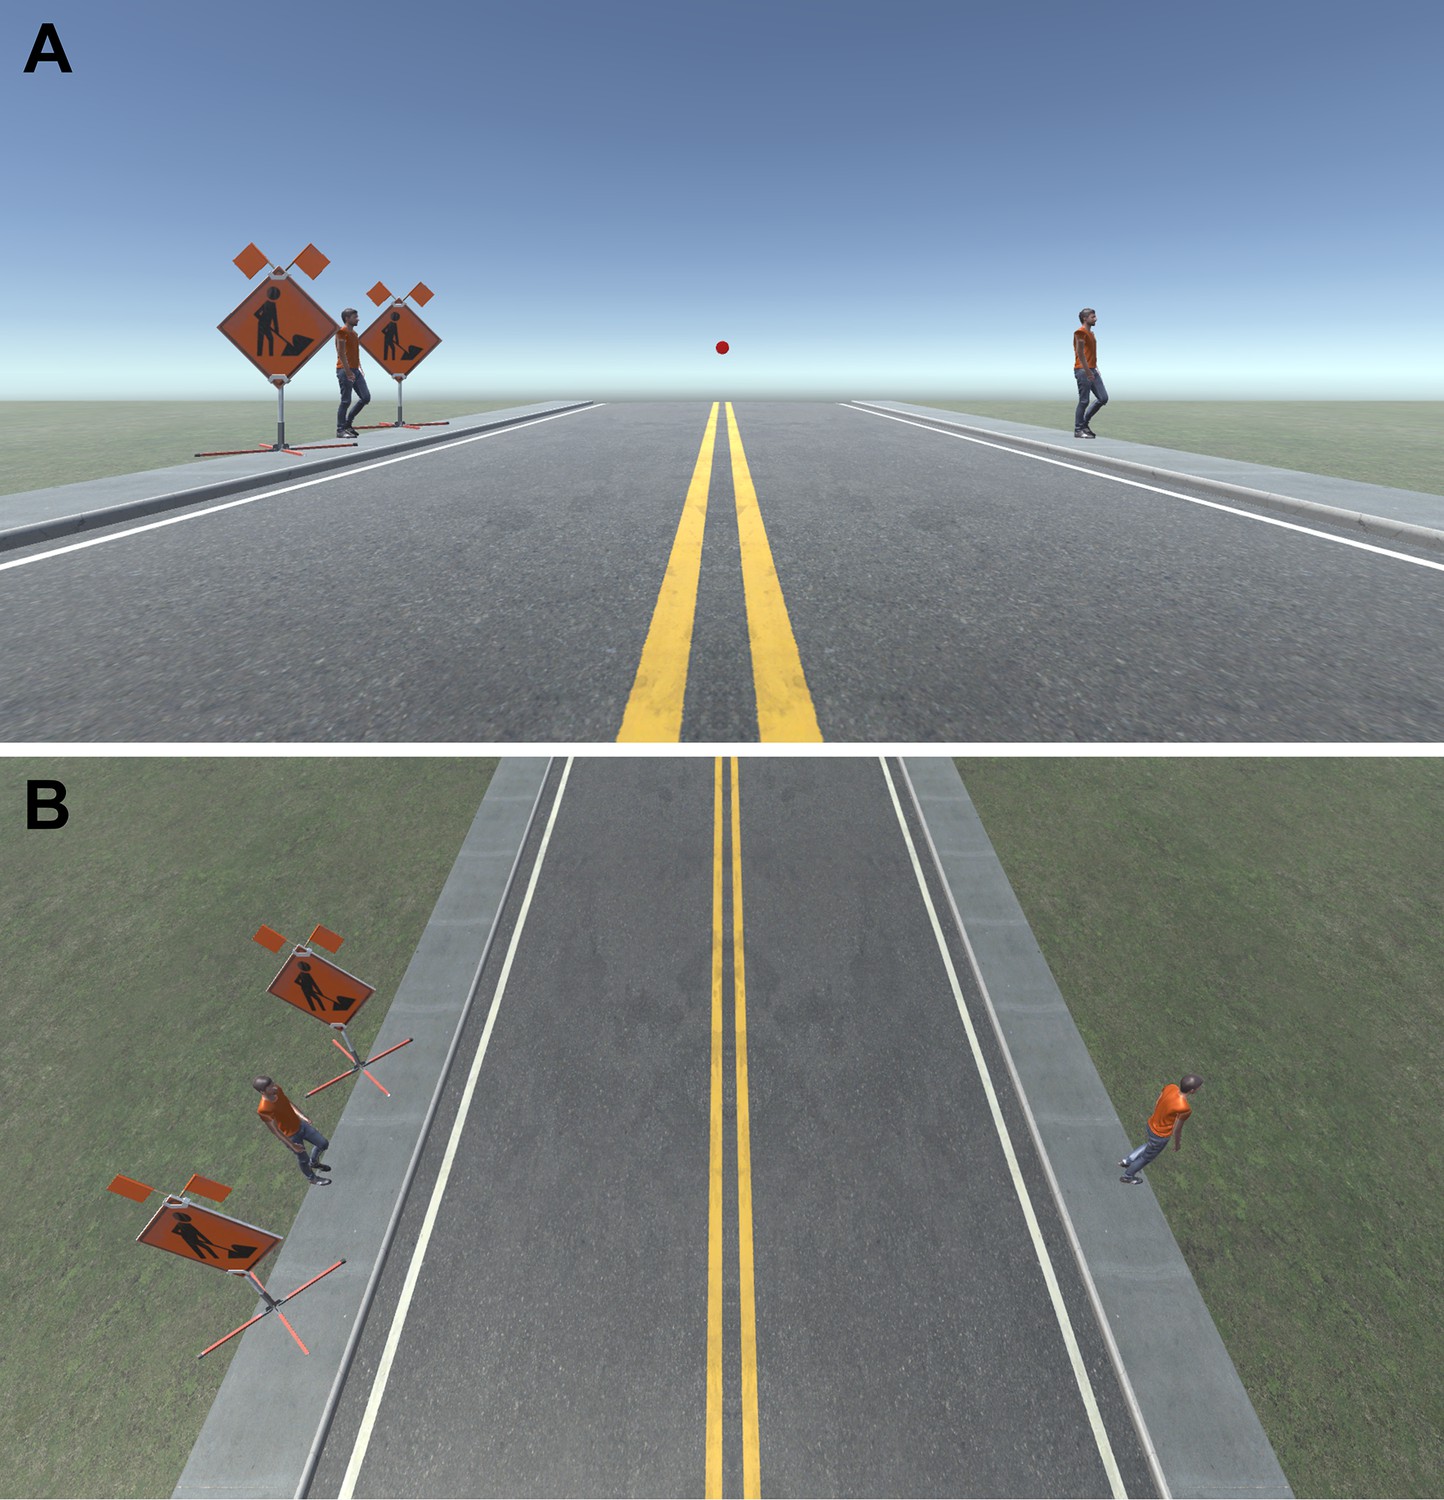
Example of crowding in a simulated everyday scene.
(A) When fixating on the red dot above the horizon, it is relatively easy to spot and recognize the person crossing on the right. However, it is more difficult, or impossible, to recognize the person about to cross the road on the left because of the presence of nearby signs. Images like this one are often used to illustrate how crowding is ubiquitous in everyday natural scenes. (B) However, in real life the two signs and the person on the left may be several meters apart and so each would appear at a different depth from the observer. Currently, little is known about how large, real differences in depth between objects affect crowding. See acknowledgments for image attributions.
Figure 2
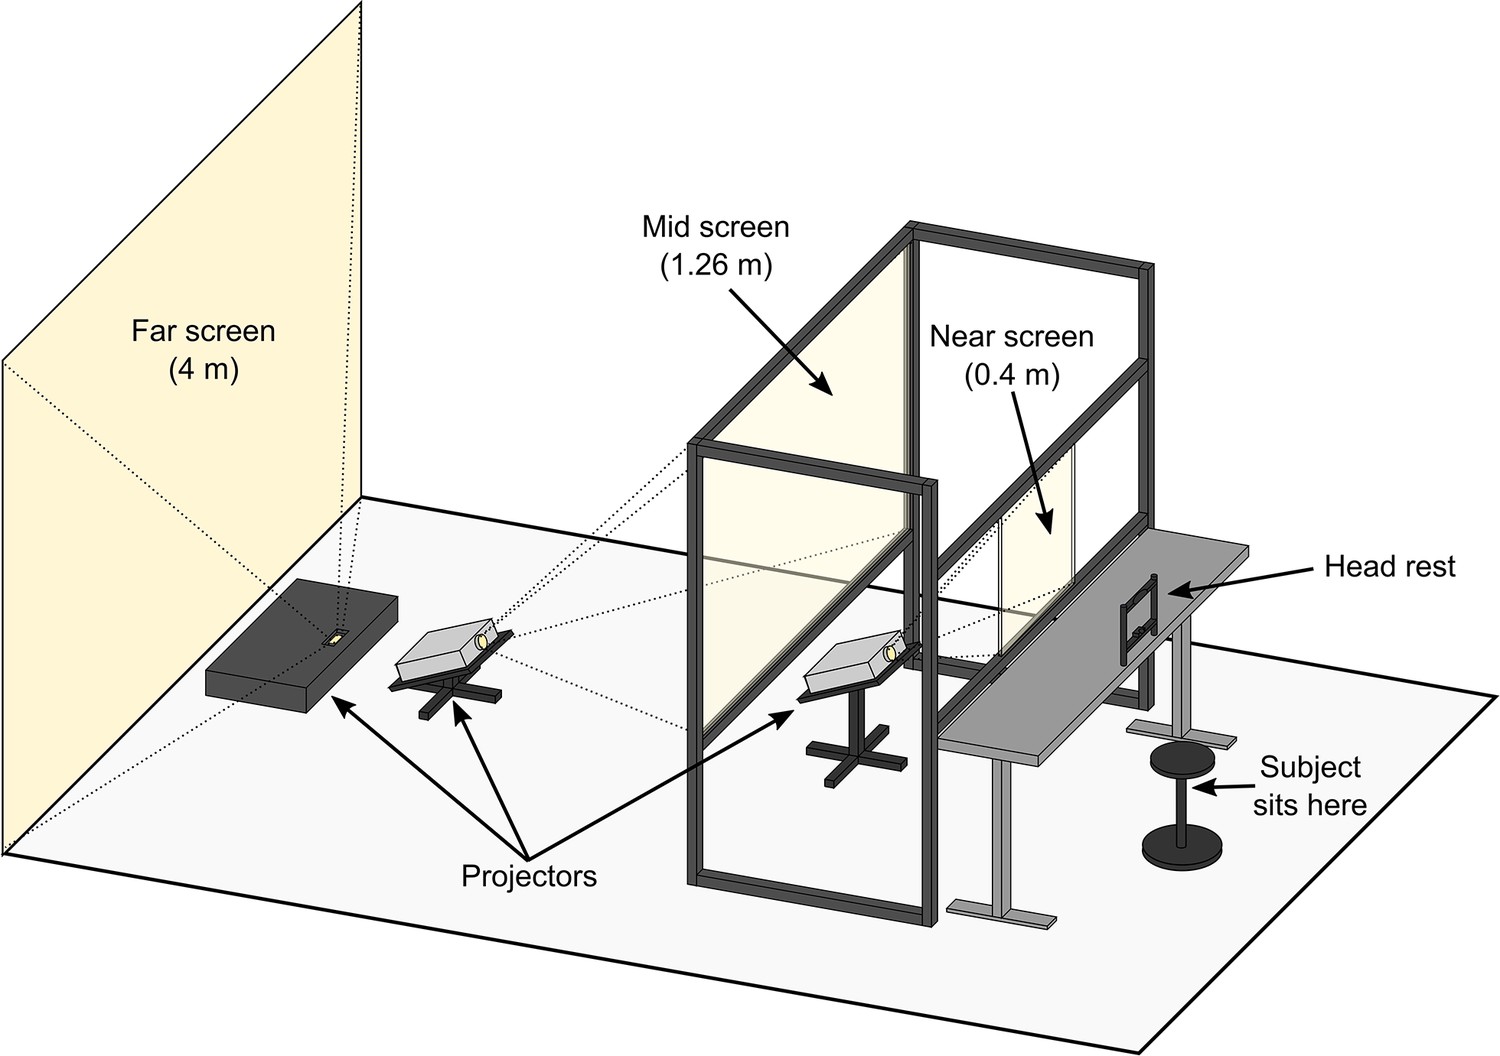
Illustration of the multi-depth plane display setup used for this study.
The near and mid screens consisted of transparent acrylic covered with ClearBright display film (see Methods for details) that enabled projected images to be displayed on to the screens while preserving their transparency (Hsu et al., 2014). This enabled observers to simultaneously view adjacent stimuli presented at different depth planes at the same time. The screens were temporally synchronized and spatially aligned (see Methods) to ensure display timing and position were consistent across the three depth planes.
Figure 3
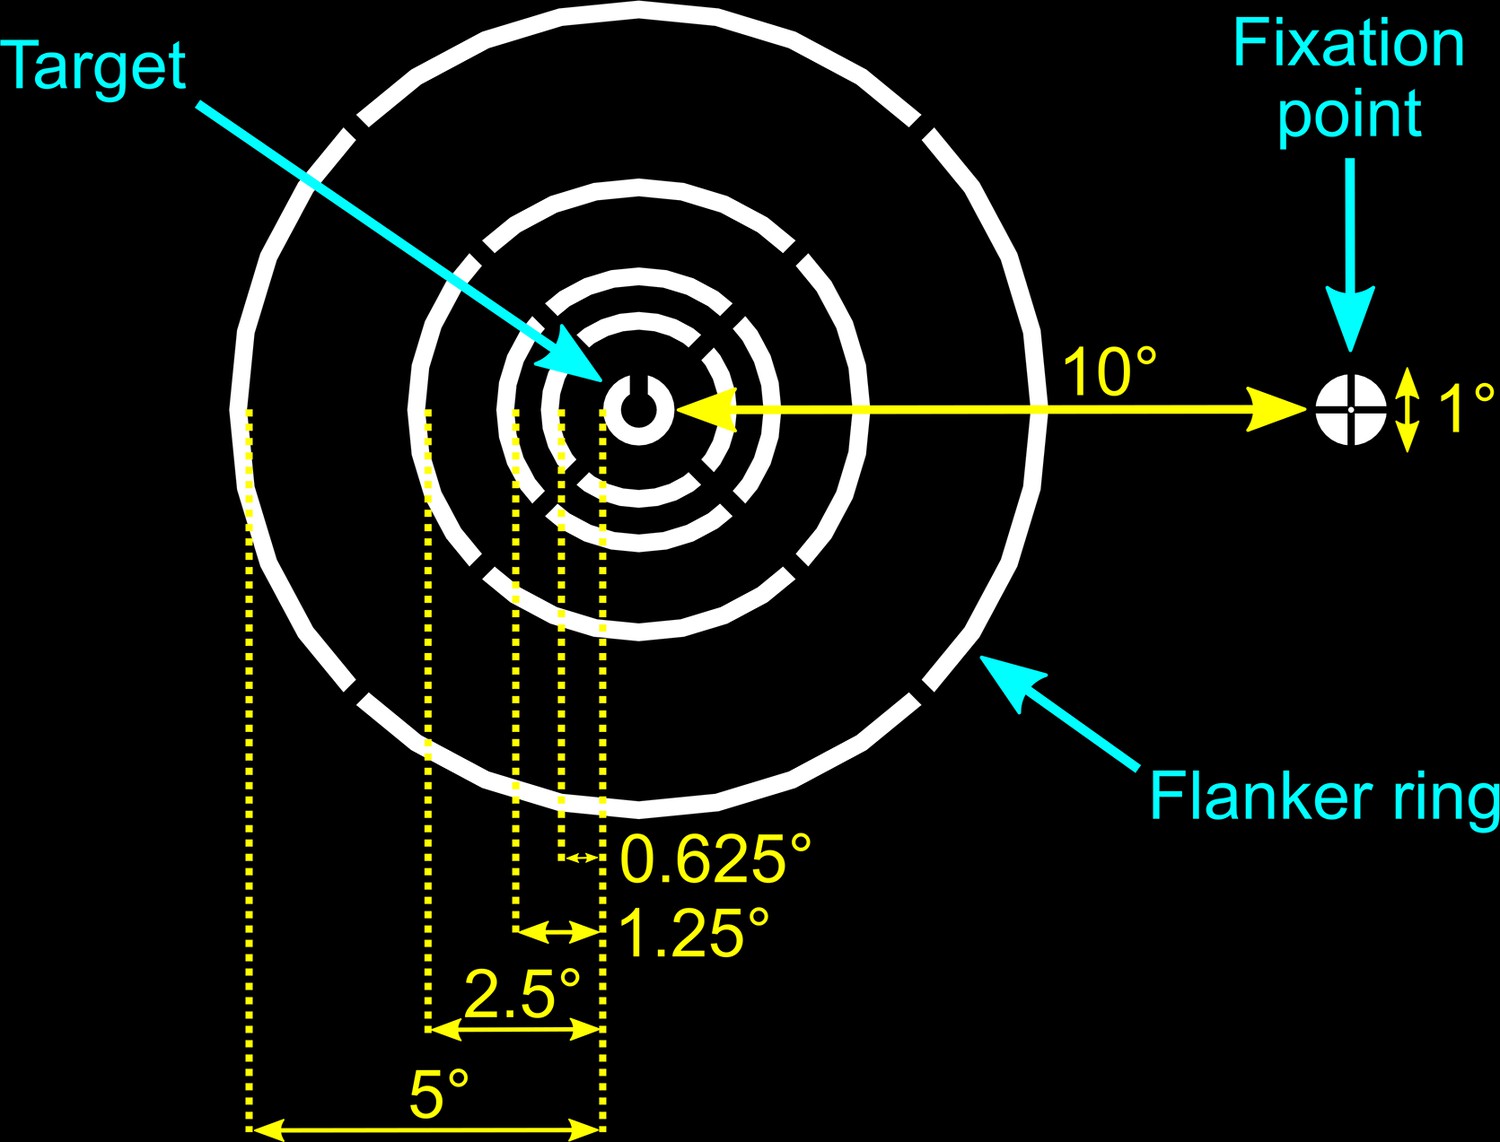
Schematic illustration of experimental stimuli and fixation marker.
In all conditions, except the no-flanker condition, the randomly orientated target (a white Landolt-C) was surrounded by a white flanker ring at one of four possible target-flanker distances. The stimuli were viewed against a black background.
Figure 4
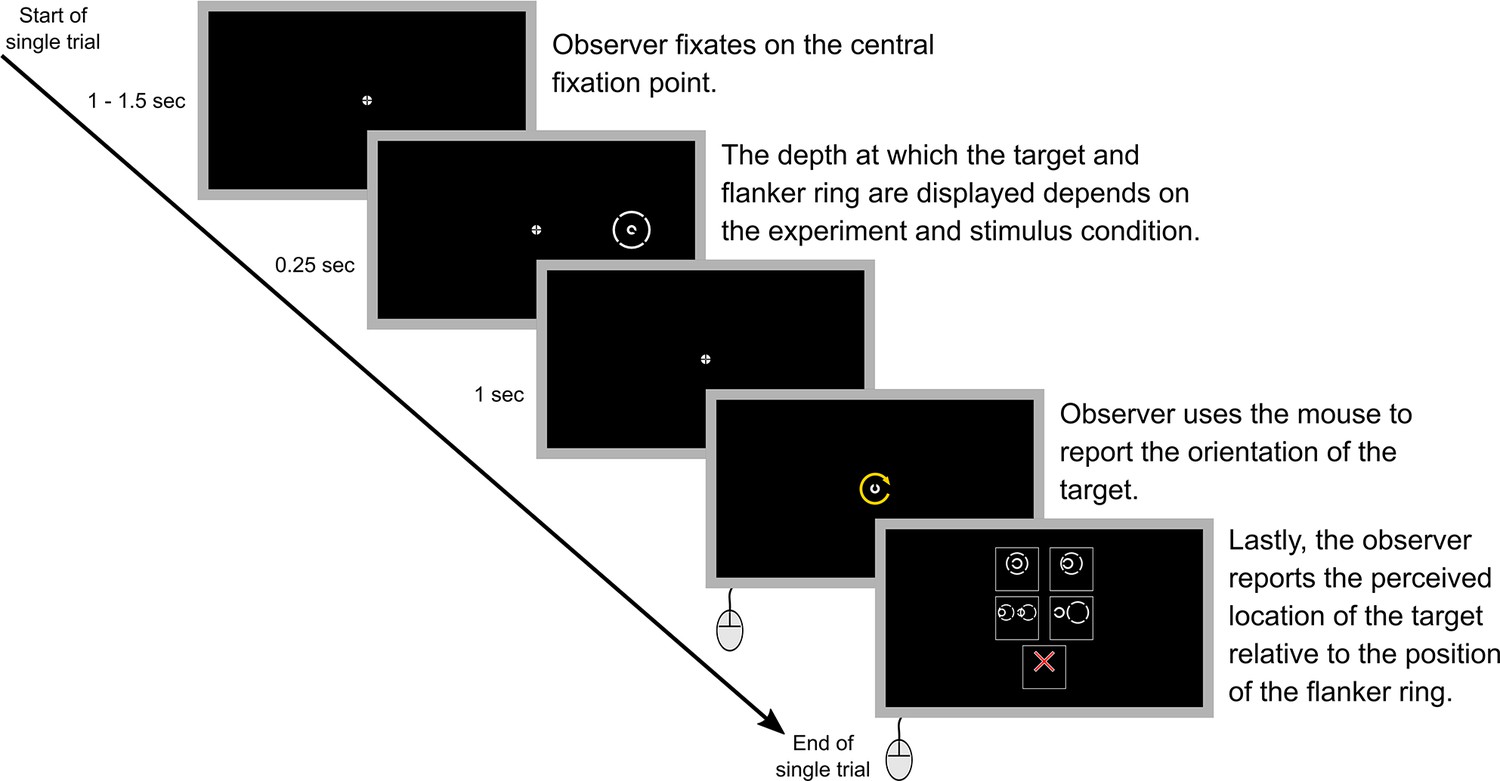
A step-by-step example of a single trial.
Note that in the actual experiments a text description of each of the five options in step five was also included within the option boxes. The text descriptions for the different options were: ‘Target in center of ring’ (top left), ‘Target inside ring but NOT in the center’ (top right), ‘Ring obstructs target’ (middle left), ‘Target outside ring’ (middle right), and ‘Unsure or no ring’ (bottom center). Step five was not included in Experiment 5 as all parts of the stimulus were always presented at the same depth.
Figure 5 with 1 supplement
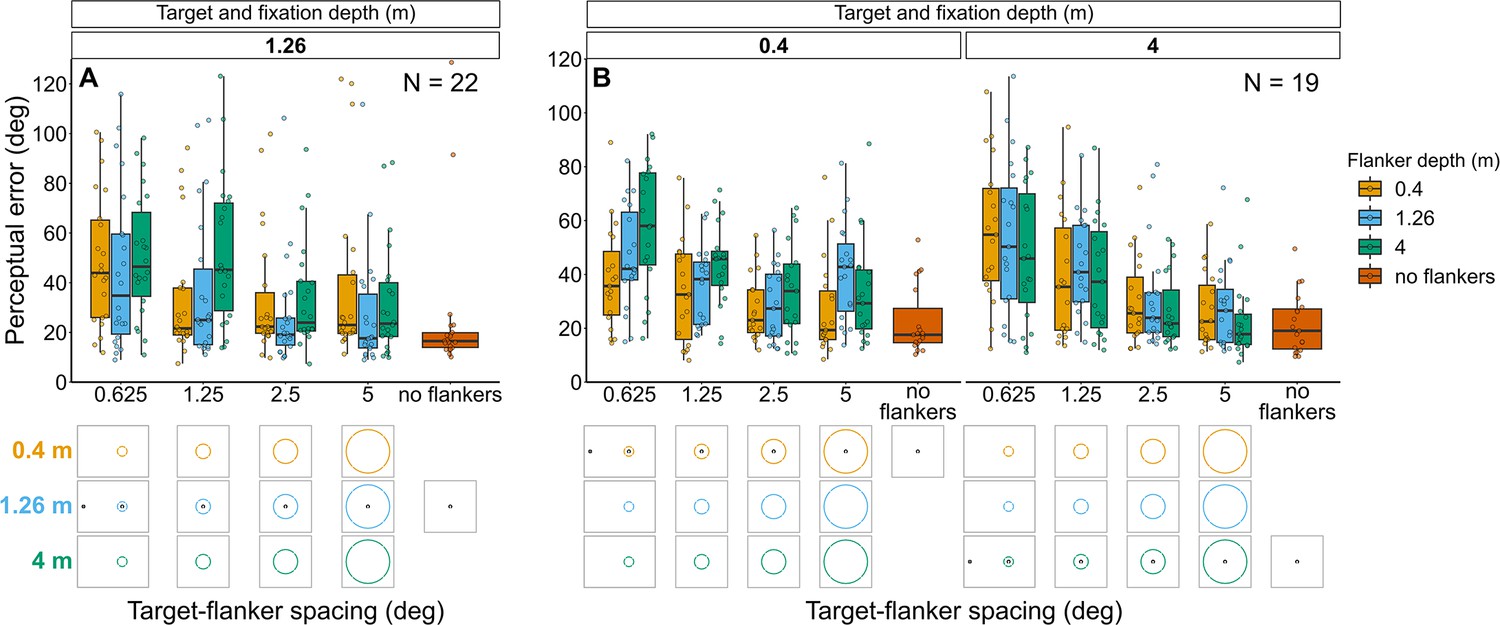
Perceptual error results for Experiments 1 (A) and 2 (B) in which flanker depth was varied while the target was always at fixation depth.
Box plots show medians plus the interquartile range (IQR), whiskers are the lowest and highest values that are within 1.5 times the IQR from the upper and lower quartiles. Points show the perceptual error for each individual observer. The visual aid below each graph shows the depth of the flanker ring (based on the same color key as the box plot) relative to the depth of the fixation point and target (shown in black) for each stimulus condition. The relative sizes of, and distances between, the fixation point, target, and flanker ring are to scale. Note that the fixation point is only shown for the 0.625° target-flanker spacing due to limited space within the figure.
Figure 5—figure supplement 1
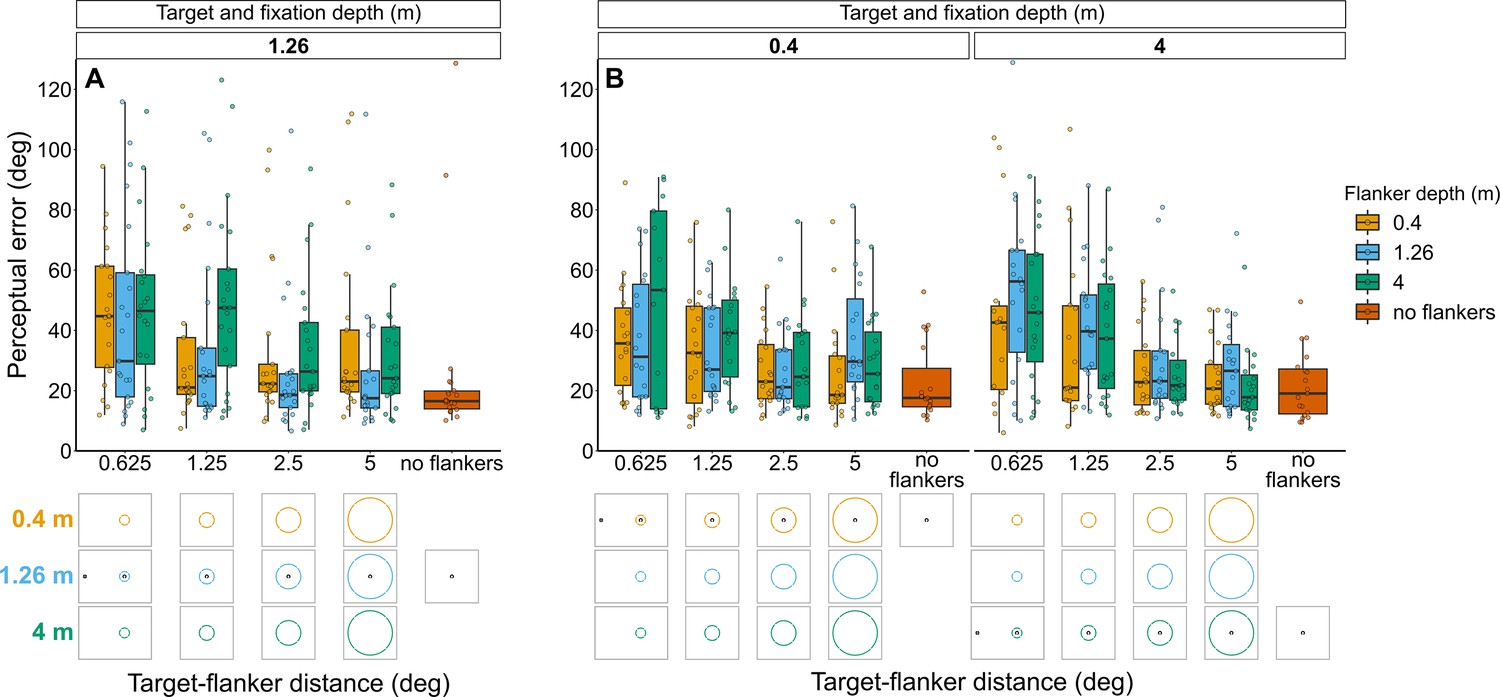
Perceptual error for Experiments 1 (A) and 2 (B) calculated only from trials in which the observer reported seeing the target inside the flanker ring.
In both experiments, flanker depth was varied while the target was always at fixation depth. Box plots show medians plus the interquartile range (IQR), whiskers are the lowest and highest values that are within 1.5 times the IQR from the upper and lower quartiles. Points show the perceptual error for each individual observer. The visual aid below each graph shows the depth of the flanker ring (based on the same color key as the box plot) relative to the depth of the fixation point and target (shown in black) for each stimulus condition. The relative sizes of, and distances between, the fixation point, target, and flanker ring are to scale. Note that the fixation point is only shown for the 0.625° target-flanker spacing due to limited space within the figure. Experiment 1: Target and fixation at 1.26 m with flanker ring presented at each depth. The effect of flanker depth relative to target-fixation depth (χ2(2)=15.69, p<0.001) and target-flanker spacing (χ2(1)=20.03, p<0.001) both remained significant. There was no significant interaction between flanker depth and target-flanker spacing (χ2(2)=1.92, p=0.384). Experiment 2: Target and fixation at 0.4 m or 4 m with flanker ring presented at each depth. When perceptual error was calculated using only trials in which the observer reported seeing the target inside the flanker ring, flanker depth had no significant effect on perceptual error (χ2(2)=5.7, p=0.058). In contrast, when perceptual error was calculated from the full data set there was a significant interaction between target-fixation depth and flanker depth (see Results section). The interaction between target-flanker spacing and target-fixation depth remained significant (χ2(1)=7.32, p=0.007). There was no significant interaction between target-fixation depth and flanker depth (χ2(2)=3.44, p=0.179) nor between flanker depth and target-flanker spacing (χ2(2)=4.85, p=0.088).
Figure 6 with 1 supplement
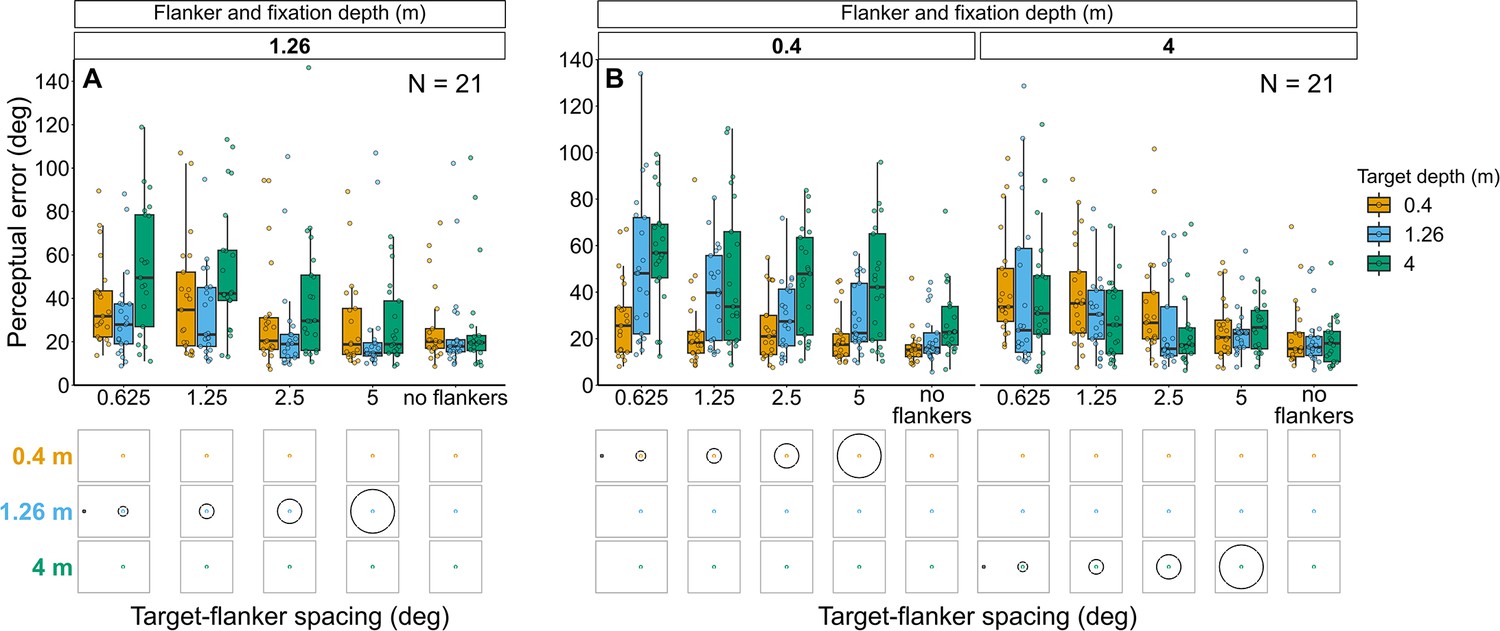
Perceptual error results for Experiments 3 (A) and 4 (B) in which target depth was varied while the flanker ring was always at fixation depth.
Box plots show medians plus the interquartile range (IQR), whiskers are the lowest and highest values that are within 1.5 times the IQR from the upper and lower quartiles. Points show the perceptual error for each individual observer. The visual aid below each graph shows the depth of the target (based on the same color key as the box plot) relative to the depth of the fixation point and flanker ring (shown in black) for each stimulus condition. The relative sizes of, and distances between, the fixation point, target, and flanker ring are to scale. Note that the fixation point is only shown for the 0.625° target-flanker spacing due to limited space within the figure.
Figure 6—figure supplement 1

Perceptual error for Experiments 3 (A) and 4 (B) calculated only from trials in which the observer reported seeing the target inside the flanker ring.
In both experiments, target depth was varied while the flanker was always at fixation depth. Box plots show medians plus the interquartile range (IQR), whiskers are the lowest and highest values that are within 1.5 times the IQR from the upper and lower quartiles. Points show the perceptual error for each individual observer. The visual aid below each graph shows the depth of the target (based on the same color key as the box plot) relative to the depth of the fixation point and flanker ring (shown in black) for each stimulus condition. The relative sizes of, and distances between, the fixation point, target, and flanker ring are to scale. Note that the fixation point is only shown for the 0.625° target-flanker spacing due to limited space within the figure. Experiment 3: Flanker ring and fixation at 1.26 m with target presented at each depth. The effect of target depth relative to flanker-fixation depth (χ2(2)=36.98, p<0.001) and target-flanker spacing (χ2(1)=50.63, p<0.001) both remained significant. There was no significant interaction between target depth and target-flanker spacing (χ2(2)=3.59, p=0.166). Experiment 4: Flanker ring and fixation at 0.4 m or 4 m with target presented at each depth. The interaction between flanker-fixation depth and target depth (χ2(2)=8.7, p=0.013), and the effect of target-flanker spacing (χ2(1)=7.58, p=0.006) both remained significant. There was no significant interaction between flanker-fixation depth and target-flanker spacing (χ2(1)=0.64, p=0.425) nor between target depth and target-flanker spacing (χ2(2)=0.98, p=0.612).
Figure 7
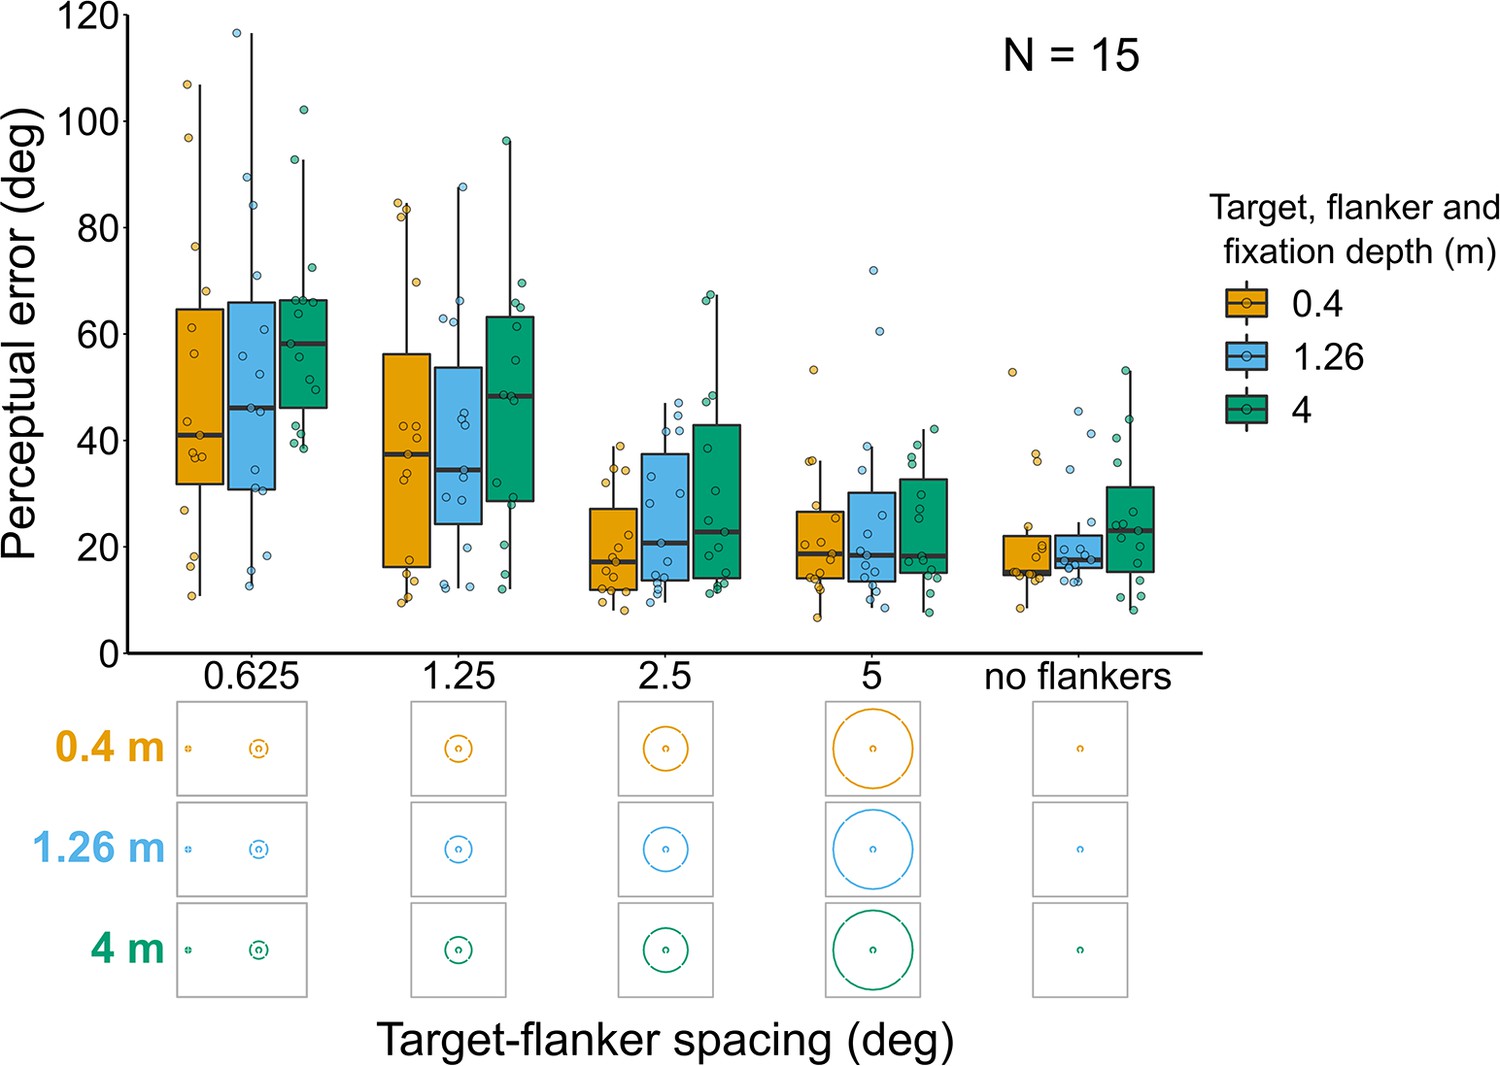
Perceptual error results for Experiment 5 in which the target and flanker ring were always presented at the same depth as the fixation point.
Box plots show medians plus the interquartile range (IQR), whiskers are the lowest and highest values that are within 1.5 times the IQR from the upper and lower quartiles. Points show the perceptual error for each individual observer. The visual aid below the graph shows the depth of the target, flanker ring, and fixation point (based on the same color key as the box plot) for each stimulus condition. The relative sizes of, and distances between, the fixation point, target, and flanker ring are to scale. Note that the fixation point is only shown for the 0.625° target-flanker spacing so not to overcrowd the figure.
Figure 8 with 2 supplements
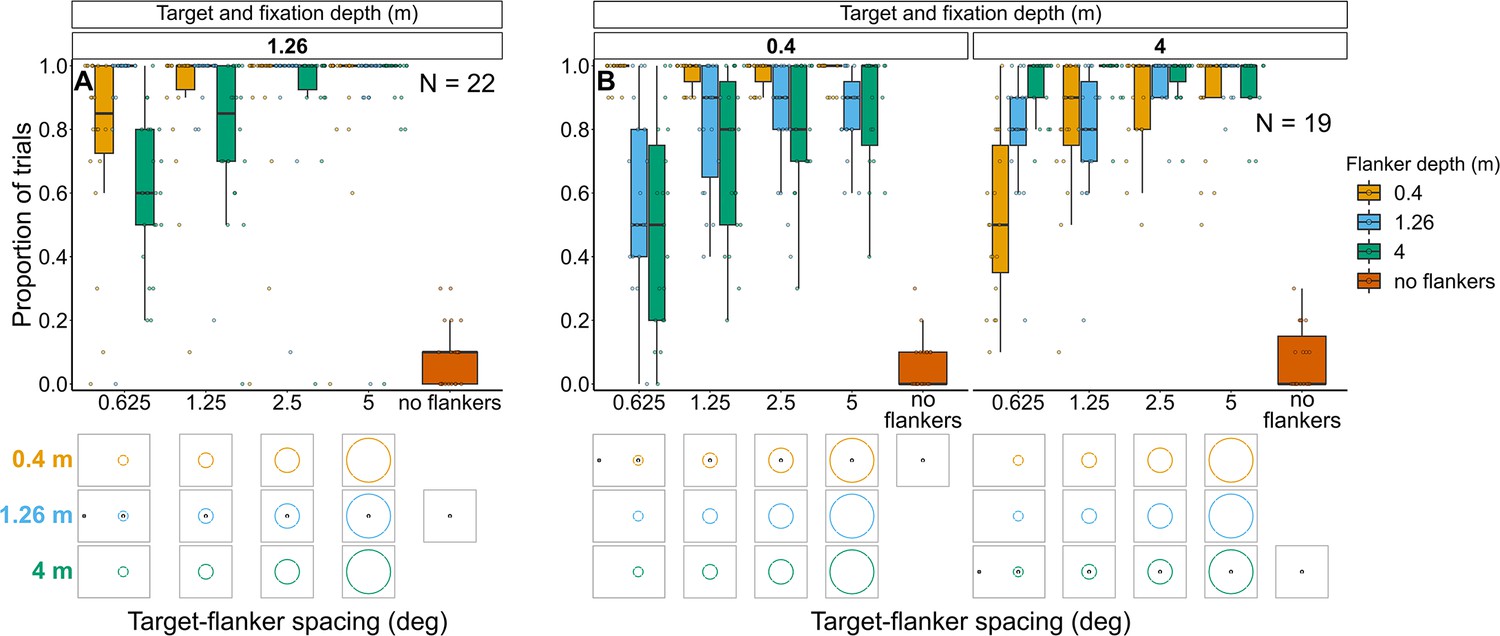
Proportion of trials in which observers reported seeing the target inside the flanker ring for Experiments 1 (A) and 2 (B).
In both experiments flanker depth was varied while the target was always at fixation depth. Box plots show medians plus the interquartile range (IQR), whiskers are the lowest and highest values that are within 1.5 times the IQR from the upper and lower quartiles. Points show the proportion of trials for each individual observer. The visual aid below each graph shows the depth of the flanker ring (based on the same color key as the box plot) relative to the depth of the fixation point and target (shown in black) for each stimulus condition. The relative sizes of, and distances between, the fixation point, target, and flanker ring are to scale. Note that the fixation point is only shown for the 0.625° target-flanker spacing due to limited space within the figure.
Figure 8—figure supplement 1

Perceived target position relative to the flanker ring in Experiment 1.
Proportion of trials in Experiment 1 in which observers reported seeing the target in the center of the flanker ring (A), within the flanker ring but not in the center (B), partly or fully obstructed by the flanker ring (C), outside the flanker ring (D), or they were unsure or there was no flanker ring (E). Flanker depth was varied while the target was always at fixation depth. Box plots show medians plus the interquartile range (IQR), whiskers are the lowest and highest values that are within 1.5 times the IQR from the upper and lower quartiles. Points show the number of trials for each individual observer. There were 10 repeats per stimulus condition.
Figure 8—figure supplement 2
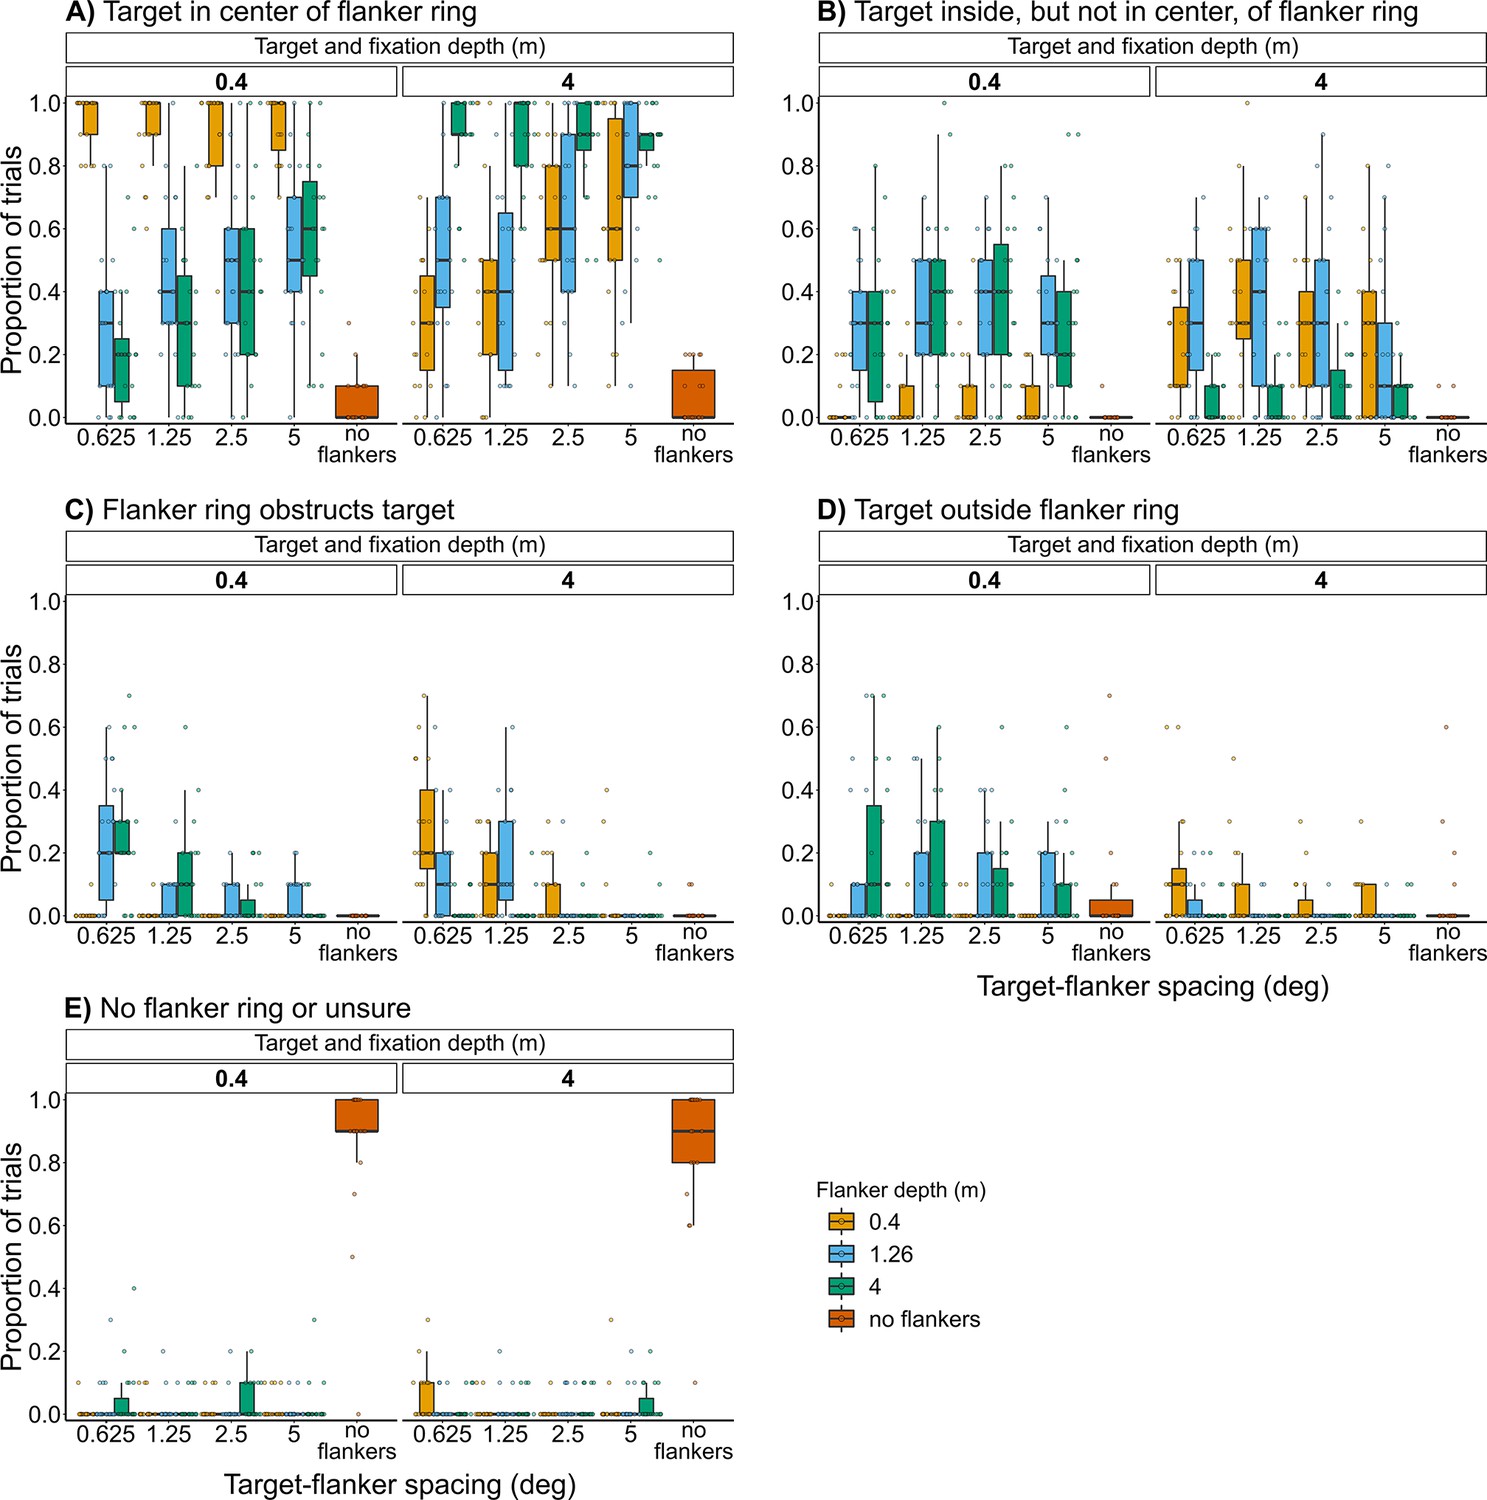
Perceived target position relative to the flanker ring in Experiment 2.
Proportion of trials in Experiment 2 in which observers reported seeing the target in the center of the flanker ring (A), within the flanker ring but not in the center (B), partly or fully obstructed by the flanker ring (C), outside the flanker ring (D), or they were unsure or there was no flanker ring (E). Flanker depth was varied while the target was always at fixation depth. Box plots show medians plus the interquartile range (IQR), whiskers are the lowest and highest values that are within 1.5 times the IQR from the upper and lower quartiles. Points show the number of trials for each individual observer. There were 10 repeats per stimulus condition.
Figure 9 with 2 supplements
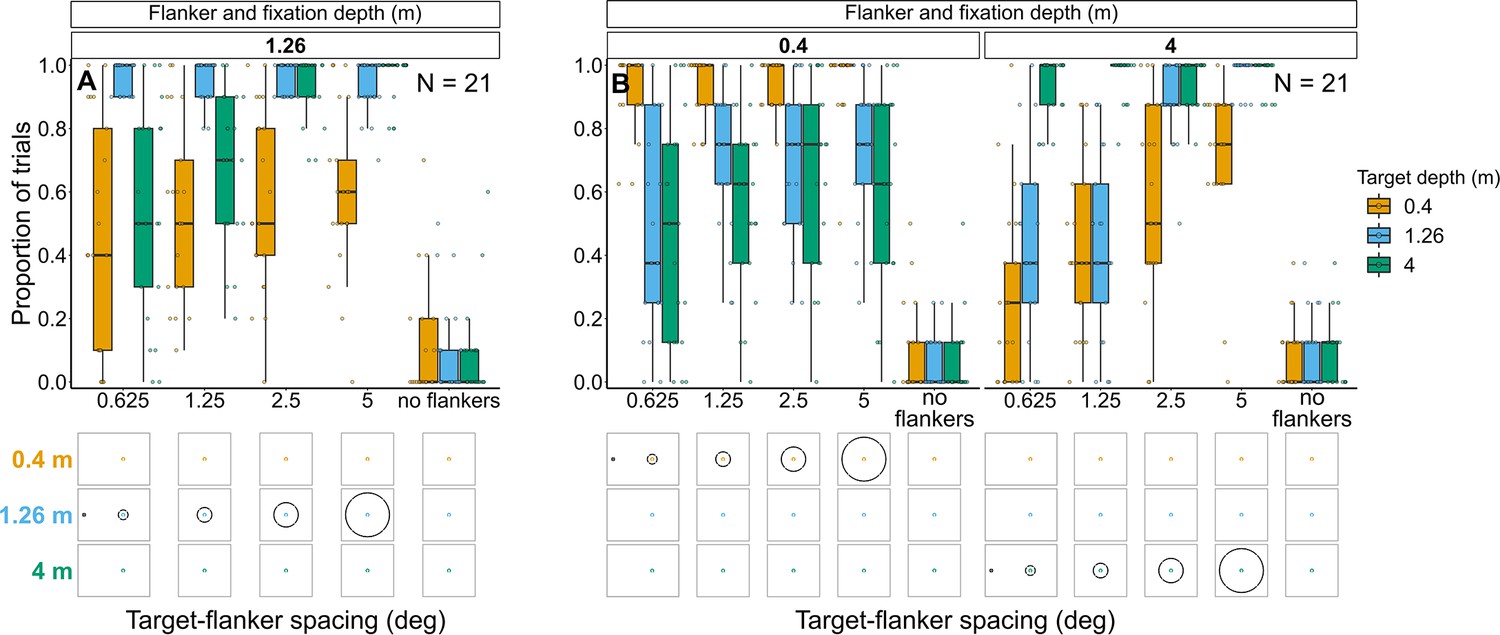
Proportion of trials in which observers reported seeing the target inside the flanker ring for Experiments 3 (A) and 4 (B).
In both experiments, target depth was varied while the flanker ring was always at fixation depth. Box plots show medians plus the interquartile range (IQR), whiskers are the lowest and highest values that are within 1.5 times the IQR from the upper and lower quartiles. Points show the proportion of trials for each individual observer. The visual aid below each graph shows the depth of the target (based on the same color key as the box plot) relative to the depth of the fixation point and flanker ring (shown in black) for each stimulus condition. The relative sizes of, and distances between, the fixation point, target, and flanker ring are to scale. Note that the fixation point is only shown for the 0.625° target-flanker spacing due to limited space within the figure.
Figure 9—figure supplement 1
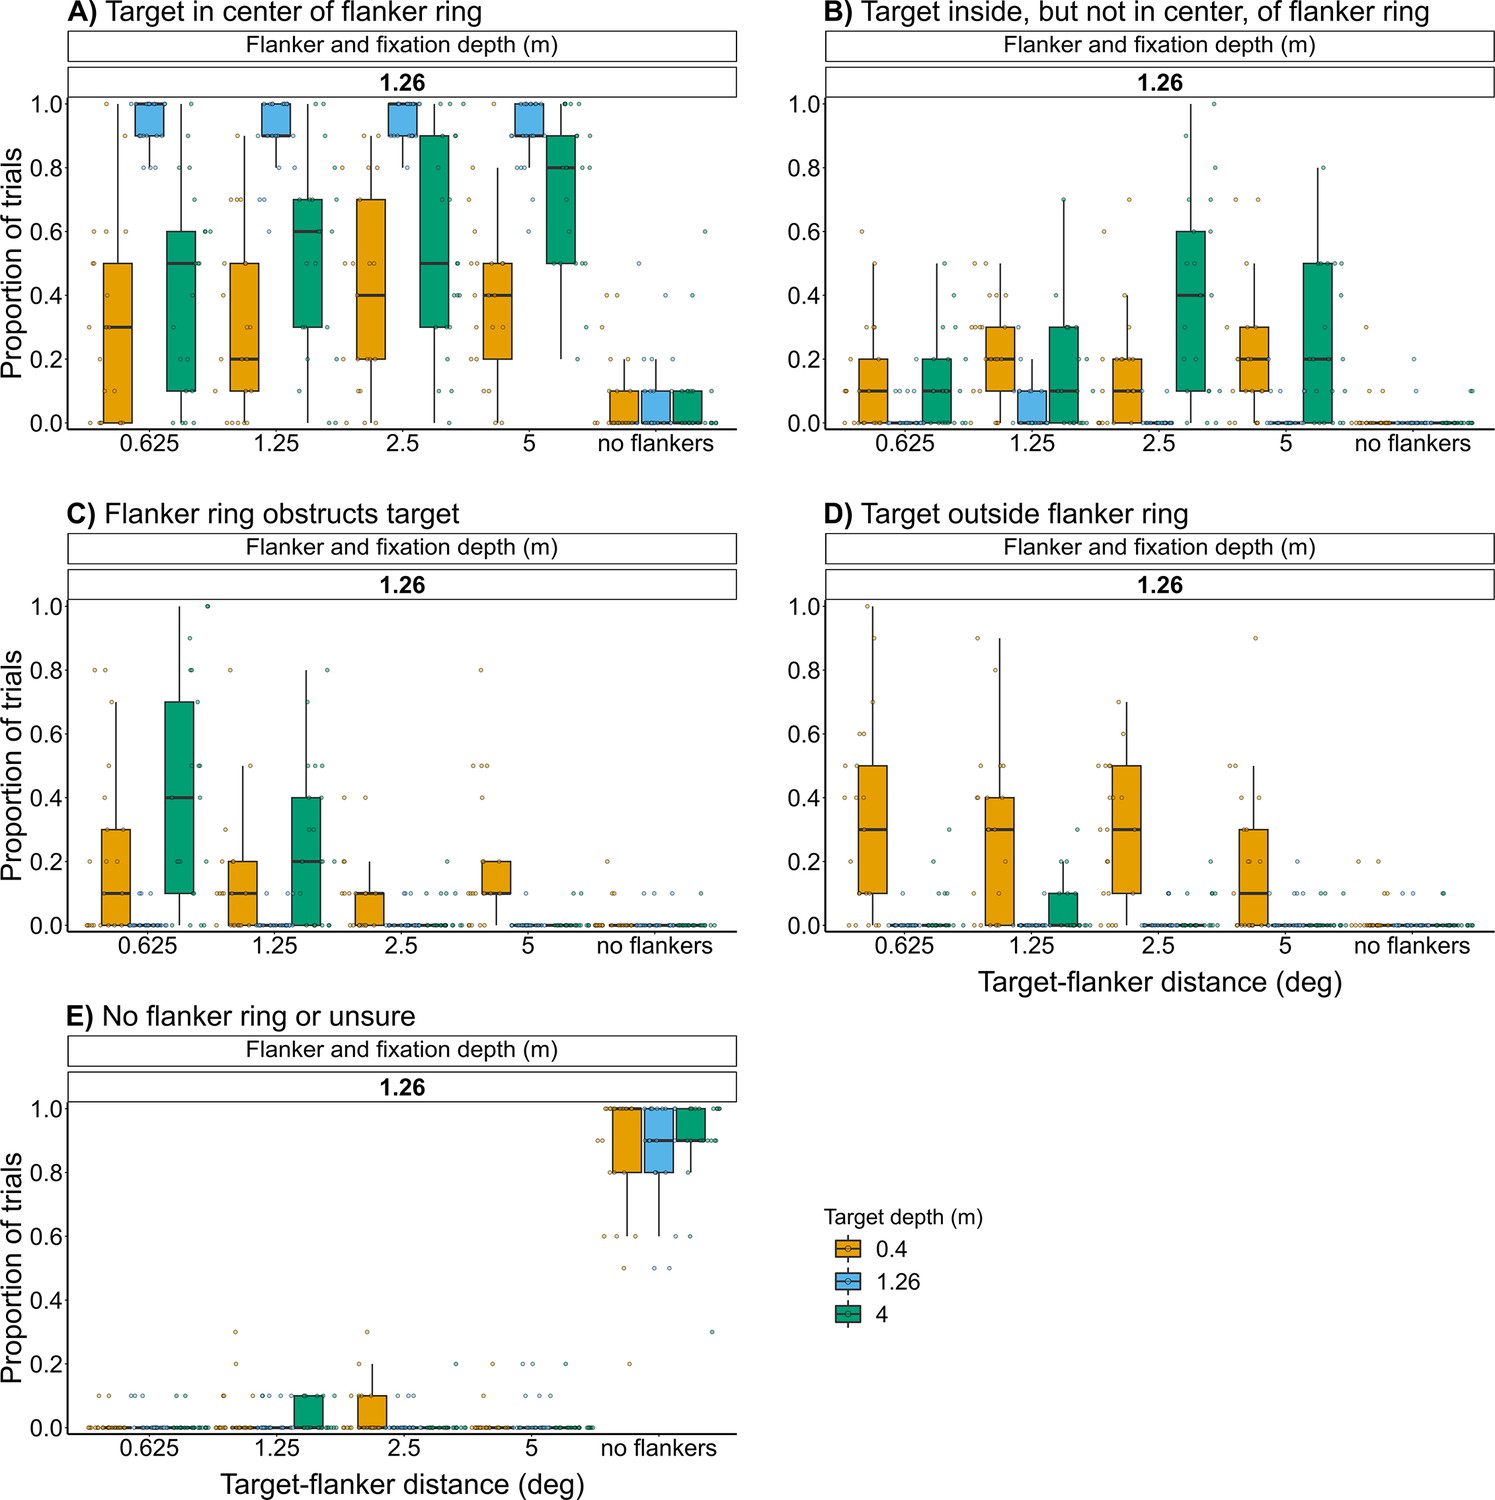
Perceived target position relative to the flanker ring in Experiment 3.
Proportion of trials in Experiment 3 in which observers reported seeing the target in the center of the flanker ring (A), within the flanker ring but not in the center (B), partly or fully obstructed by the flanker ring (C), outside the flanker ring (D), or they were unsure or there was no flanker ring (E). Target depth was varied while the flanker was always at fixation depth. Box plots show medians plus the interquartile range (IQR), whiskers are the lowest and highest values that are within 1.5 times the IQR from the upper and lower quartiles. Points show the number of trials for each individual observer. There were 10 repeats per stimulus condition.
Figure 9—figure supplement 2

Perceived target position relative to the flanker ring in Experiment 4.
Proportion of trials in Experiment 4 in which observers reported seeing the target in the center of the flanker ring (A), within the flanker ring but not in the center (B), partly or fully obstructed by the flanker ring (C), outside the flanker ring (D), or they were unsure or there was no flanker ring (E). Target depth was varied while the flanker was always at fixation depth. Box plots show medians plus the interquartile range (IQR), whiskers are the lowest and highest values that are within 1.5 times the IQR from the upper and lower quartiles. Points show the number of trials for each individual observer. There were eight repeats per stimulus condition.
Figure 10 with 2 supplements
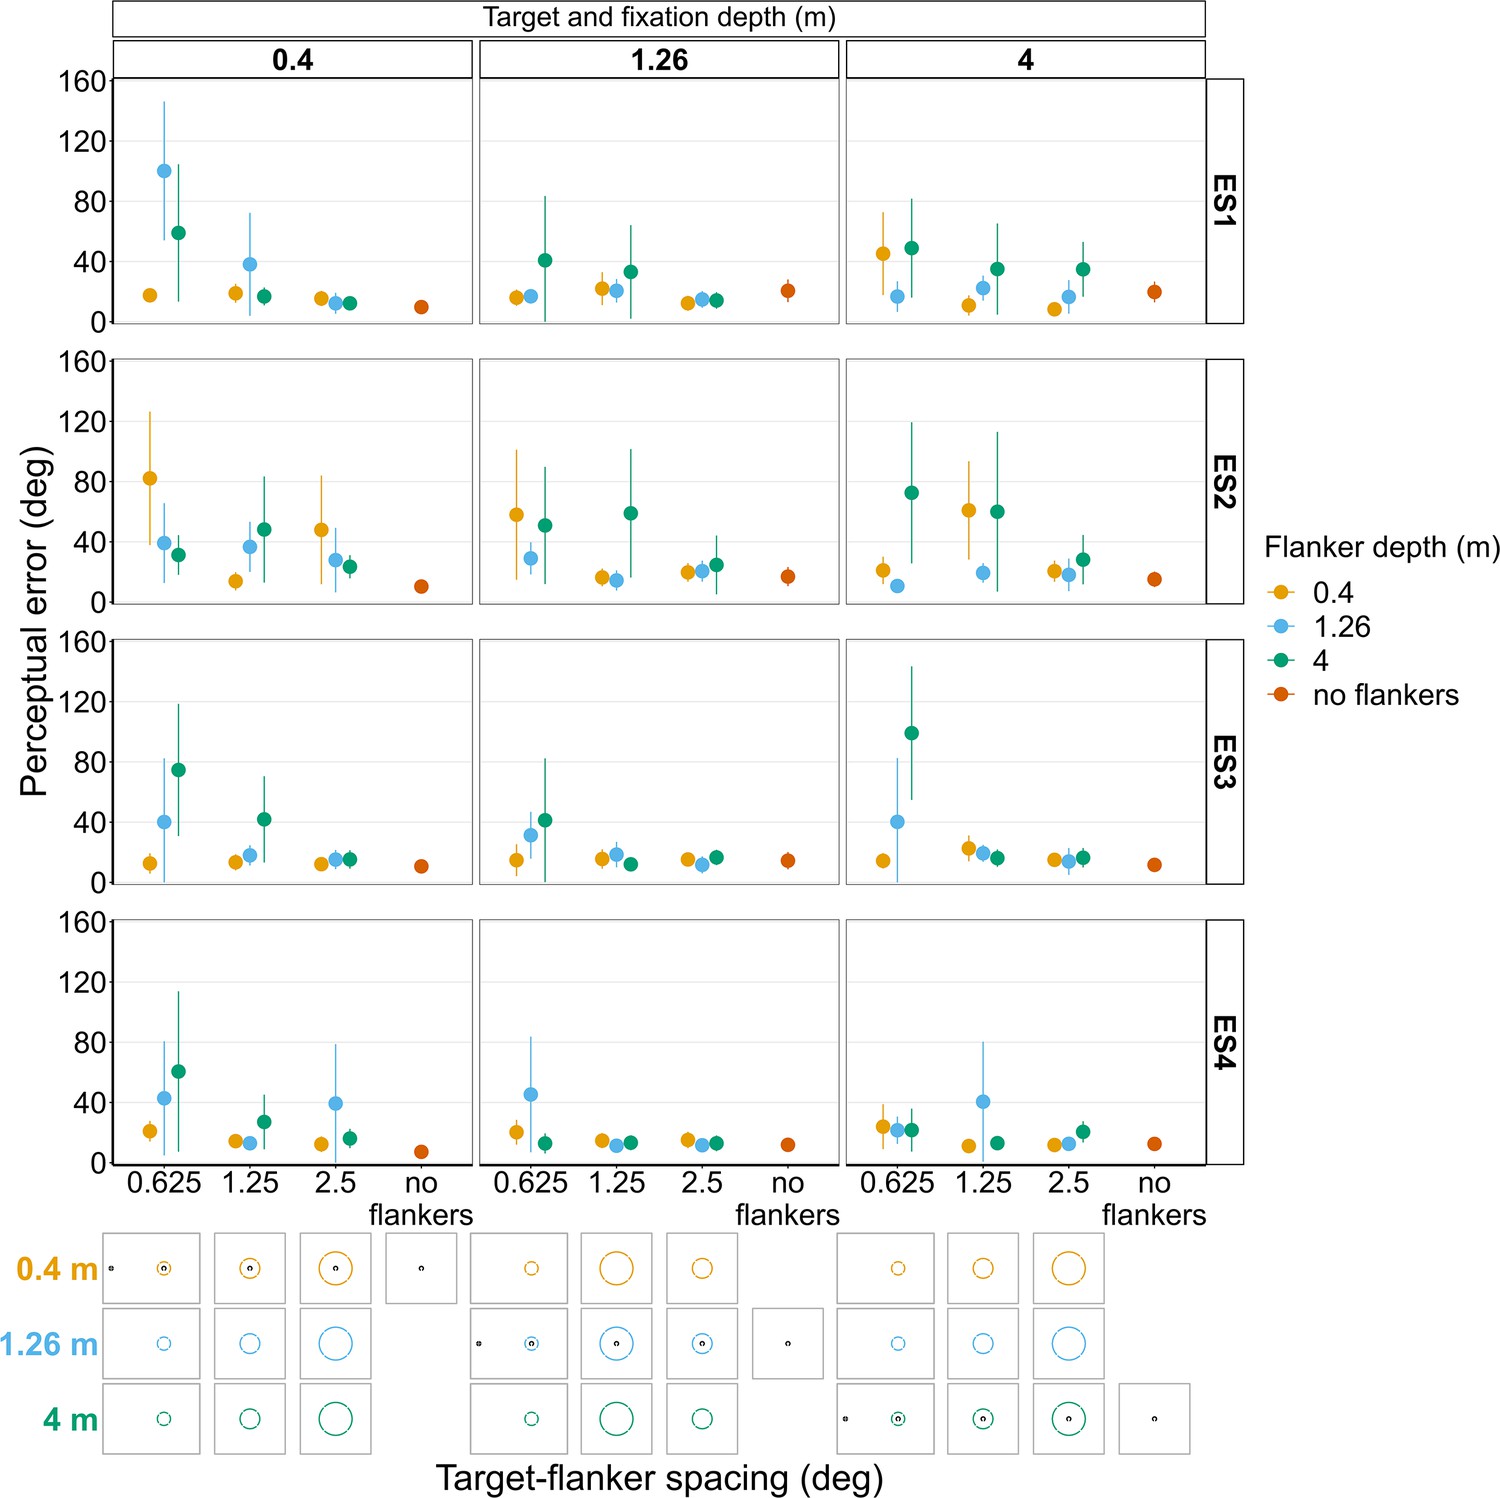
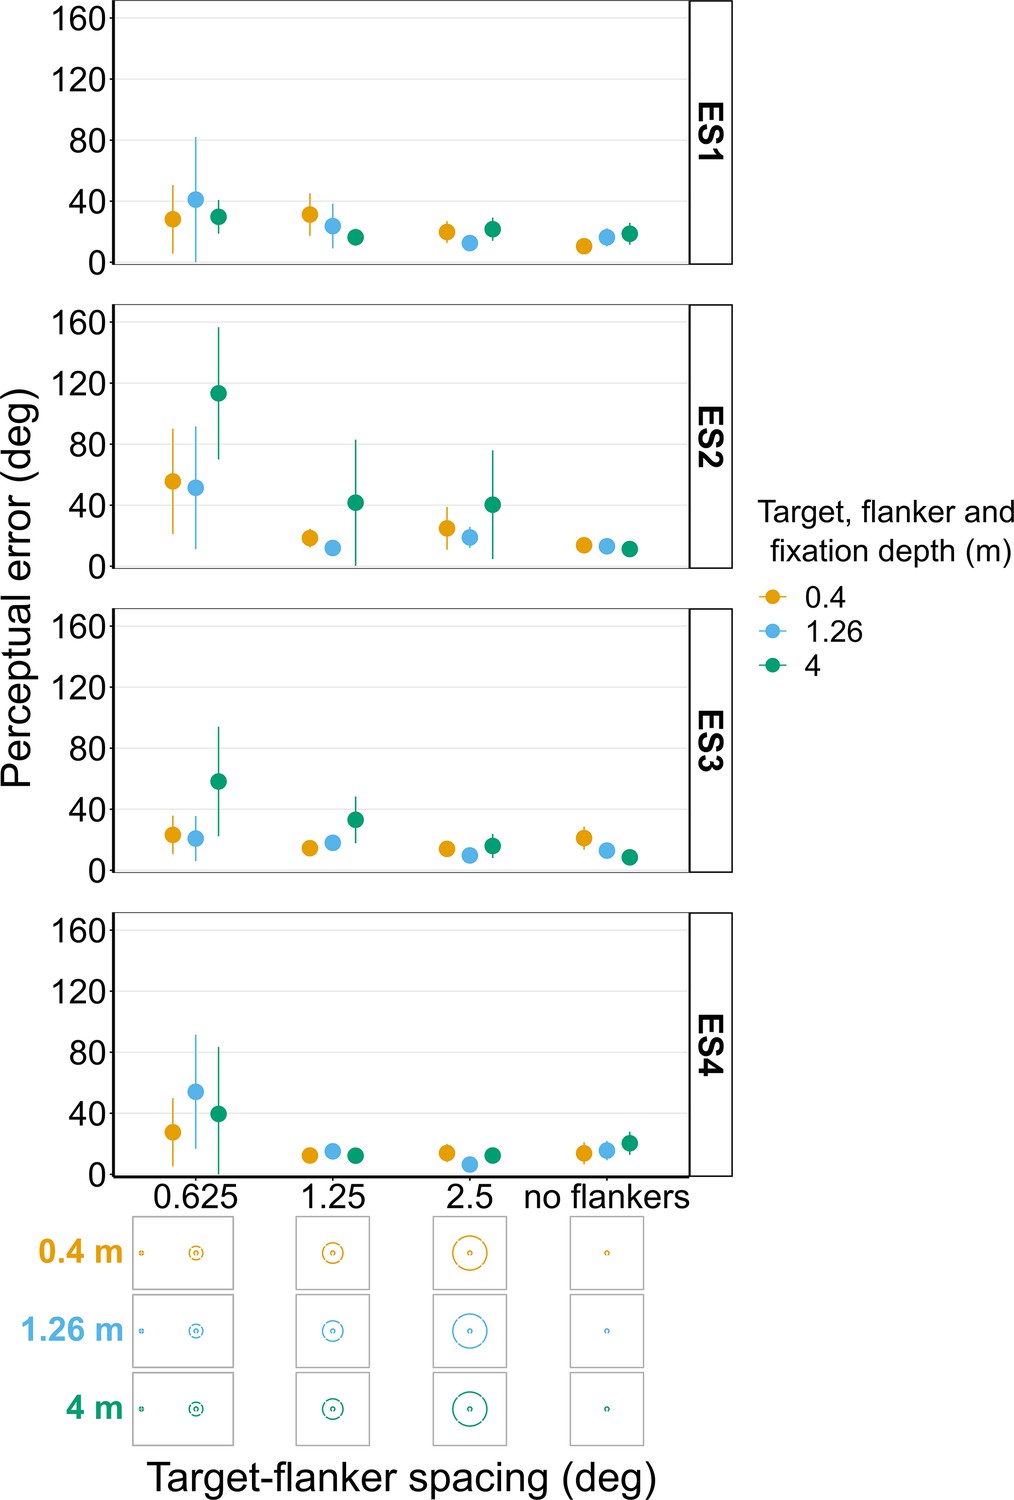
Perceptual error results from individual experienced subjects (ES1-4) for Experiments 1 and 2 in which flanker depth was varied while the target was always at fixation depth.
Error bars show 95% bootstrapped confidence intervals. Note that the 5° target-flanker spacing condition was not included in this set of experiments. Since the same subjects participated in both experiments, the results from Experiments 1 and 2 have been combined into a single figure to make it easier to compare the different conditions. The visual aid below the graph shows the depth of the flanker ring (based on the same color key as the plot) relative to the depth of the fixation point and target (shown in black) for each stimulus condition. The relative sizes of, and distances between, the fixation point, target, and flanker ring are to scale. Note that the fixation point is only shown for the 0.625° target-flanker spacing due to limited space within the figure.
Figure 10—figure supplement 1
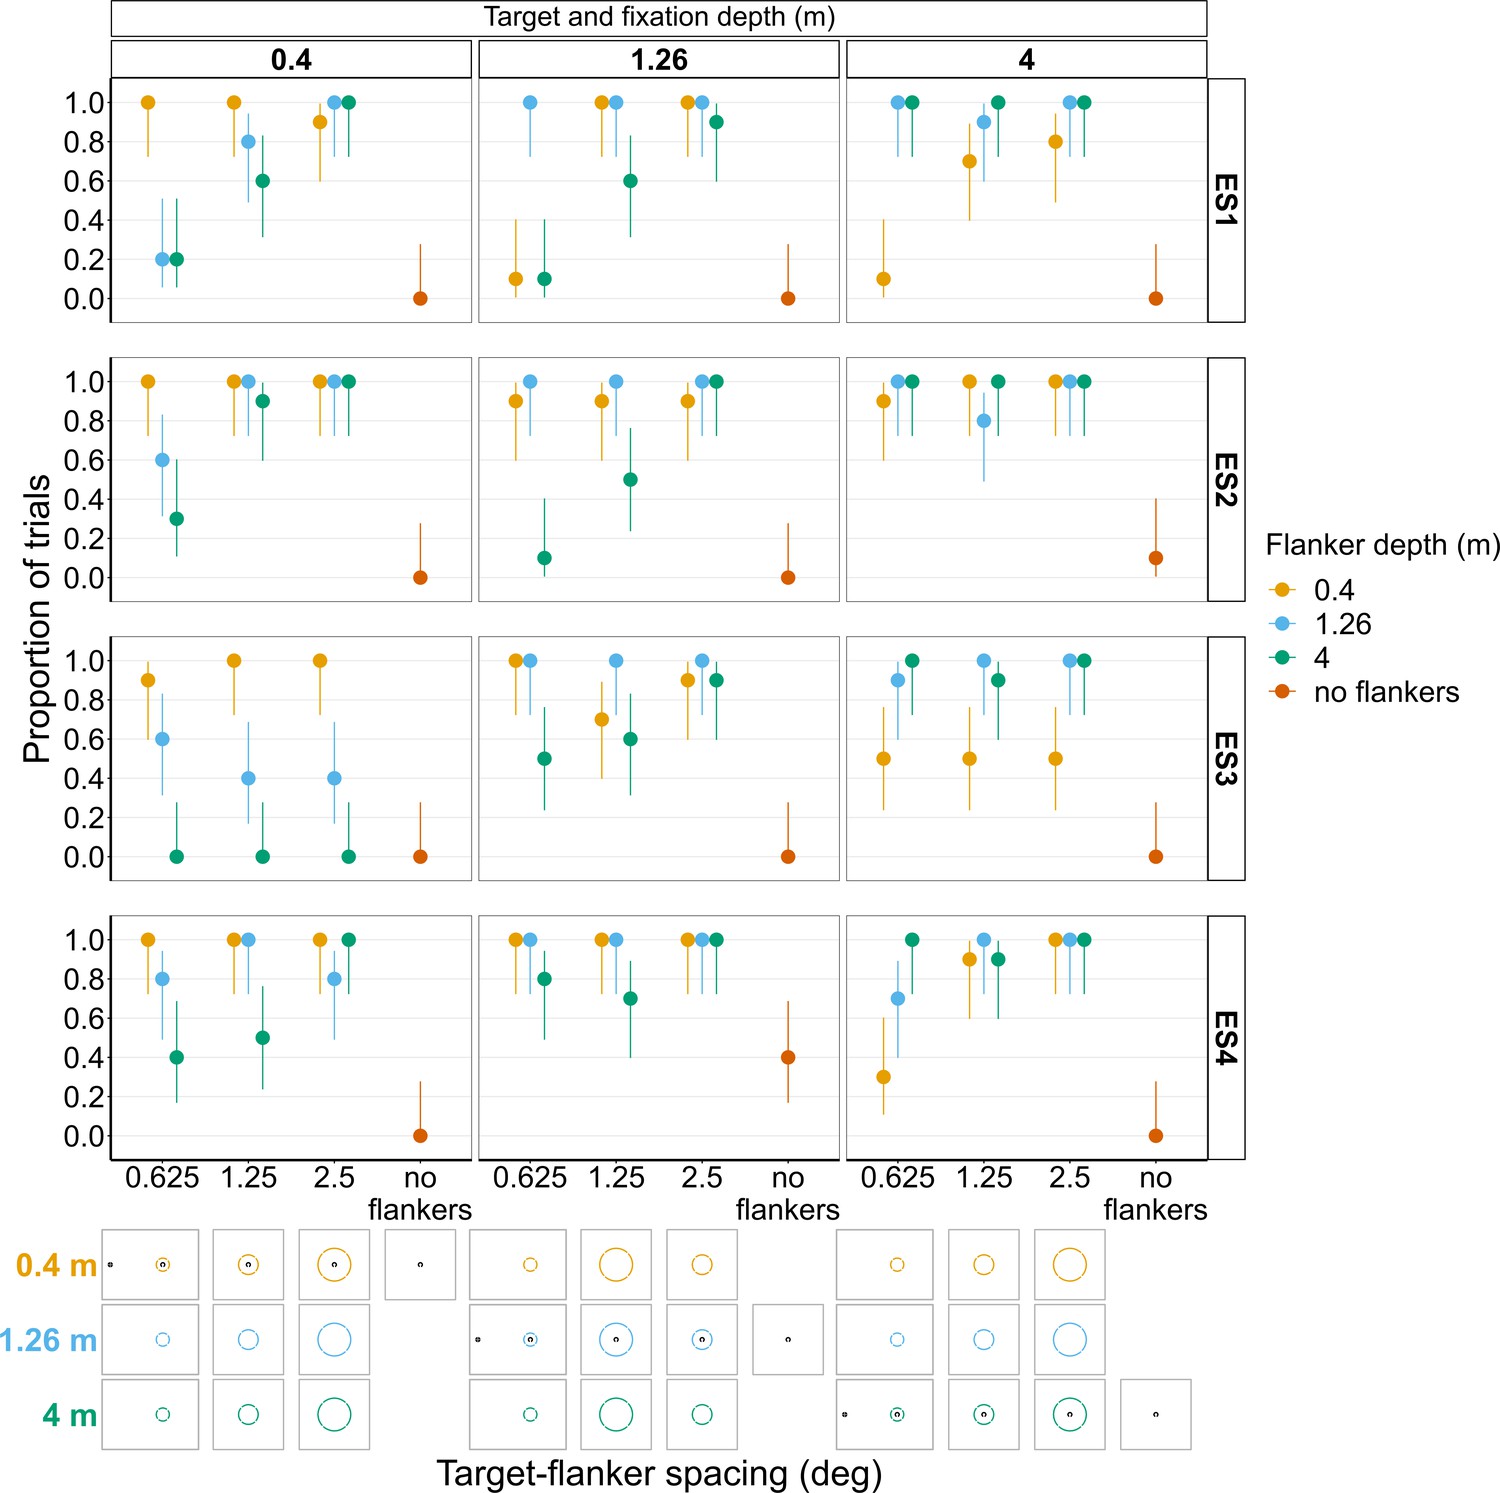
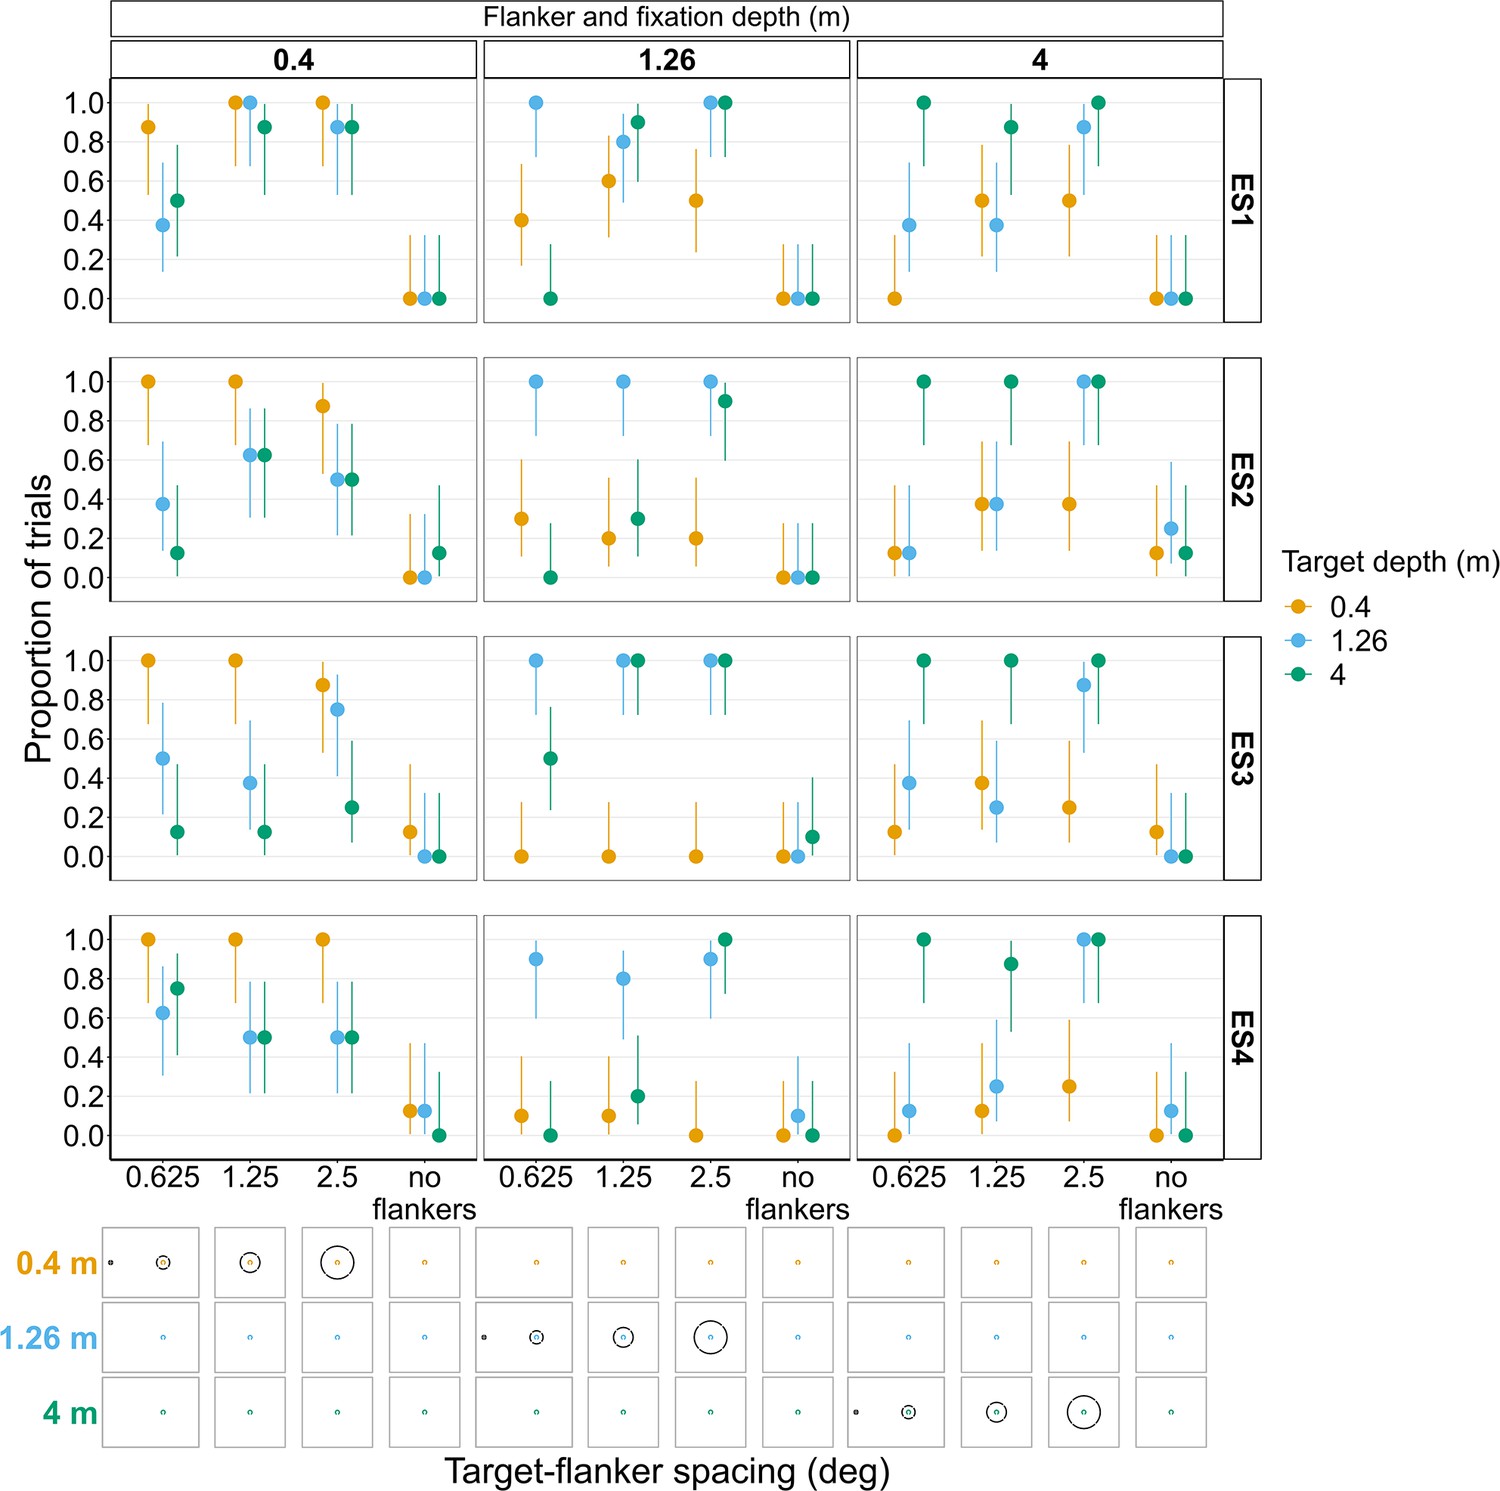
Proportion of trials in which each individual experienced subject (ES1-4) reported seeing the target inside the flanker ring for Experiments 1 and 2.
In both experiments, flanker depth was varied while the target was always at fixation depth. Error bars show Wilson score intervals. The 5° target-flanker spacing condition was not included in this set of experiments. Since the same subjects participated in both experiments, the results from Experiments 1 and 2 have been combined into a single figure to make it easier to compare the different conditions. The visual aid below the graph shows the depth of the flanker ring (based on the same color key as the plot) relative to the depth of the fixation point and target (shown in black) for each stimulus condition. The relative sizes of, and distances between, the fixation point, target, and flanker ring are to scale. Note that the fixation point is only shown for the 0.625° target-flanker spacing due to limited space within the figure.
Figure 10—figure supplement 2
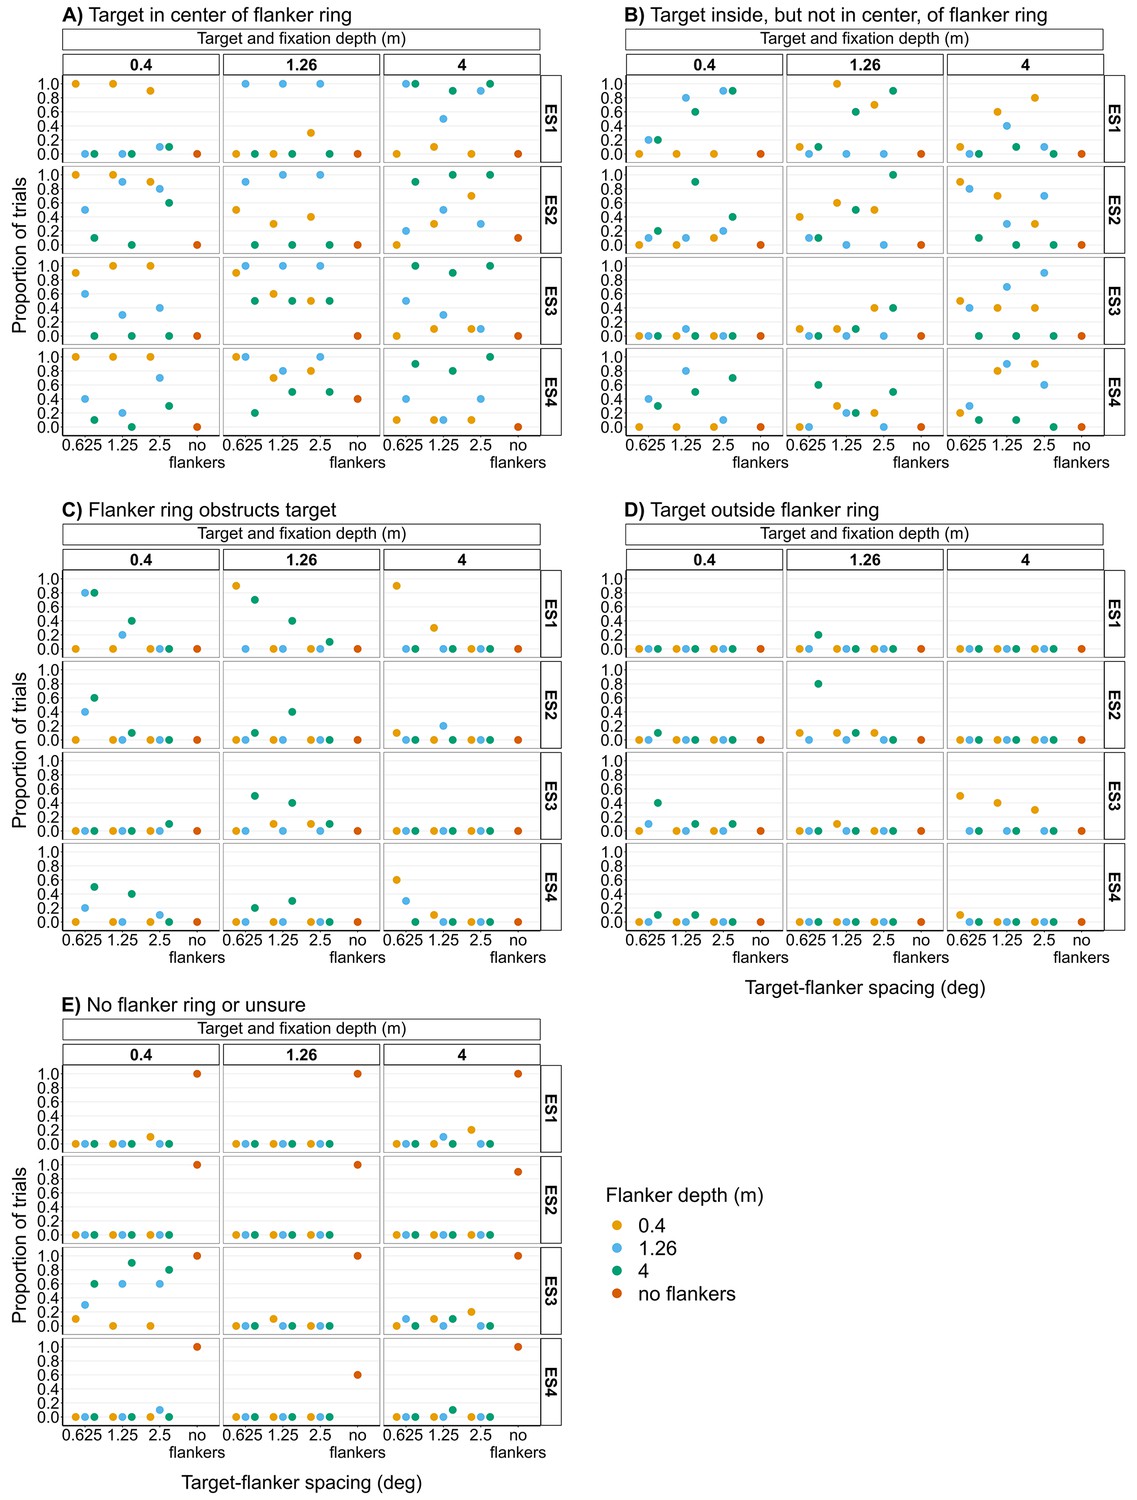
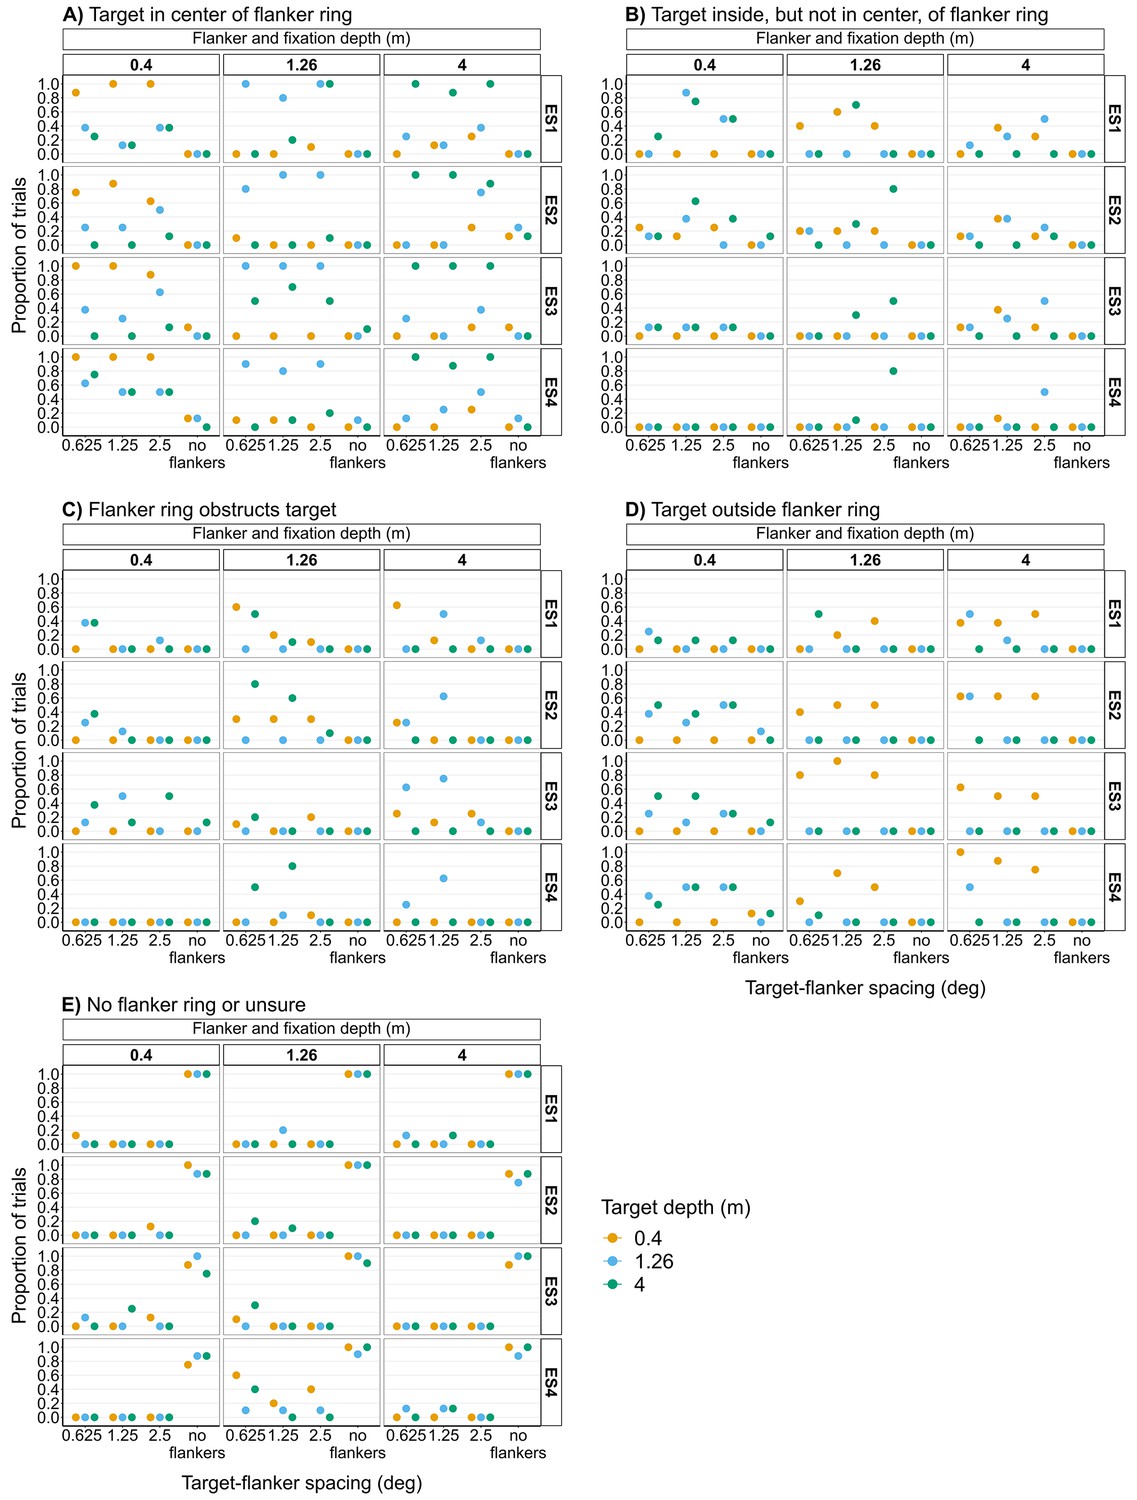
Perceived target position relative to the flanker ring reported by each individual experienced subject (ES1-4) in Experiments 1 and 2.
Proportion of trials in Experiments 1 and 2 in which each individual experienced subject (ES1-4) reported seeing the target in the center of the flanker ring (A), within the flanker ring but not in the center (B), partly or fully obstructed by the flanker ring (C), outside the flanker ring (D), or they were unsure or there was no flanker ring (E). In both experiments’ flanker depth was varied while the target was always at fixation depth. The 5° target-flanker spacing condition was not included in this set of experiments. There were 10 repeats per stimulus condition in both experiments. Since the same subjects participated in both experiments, the results from Experiments 1 and 2 have been combined into single figures to make it easier to compare the different conditions.
Figure 11 with 2 supplements
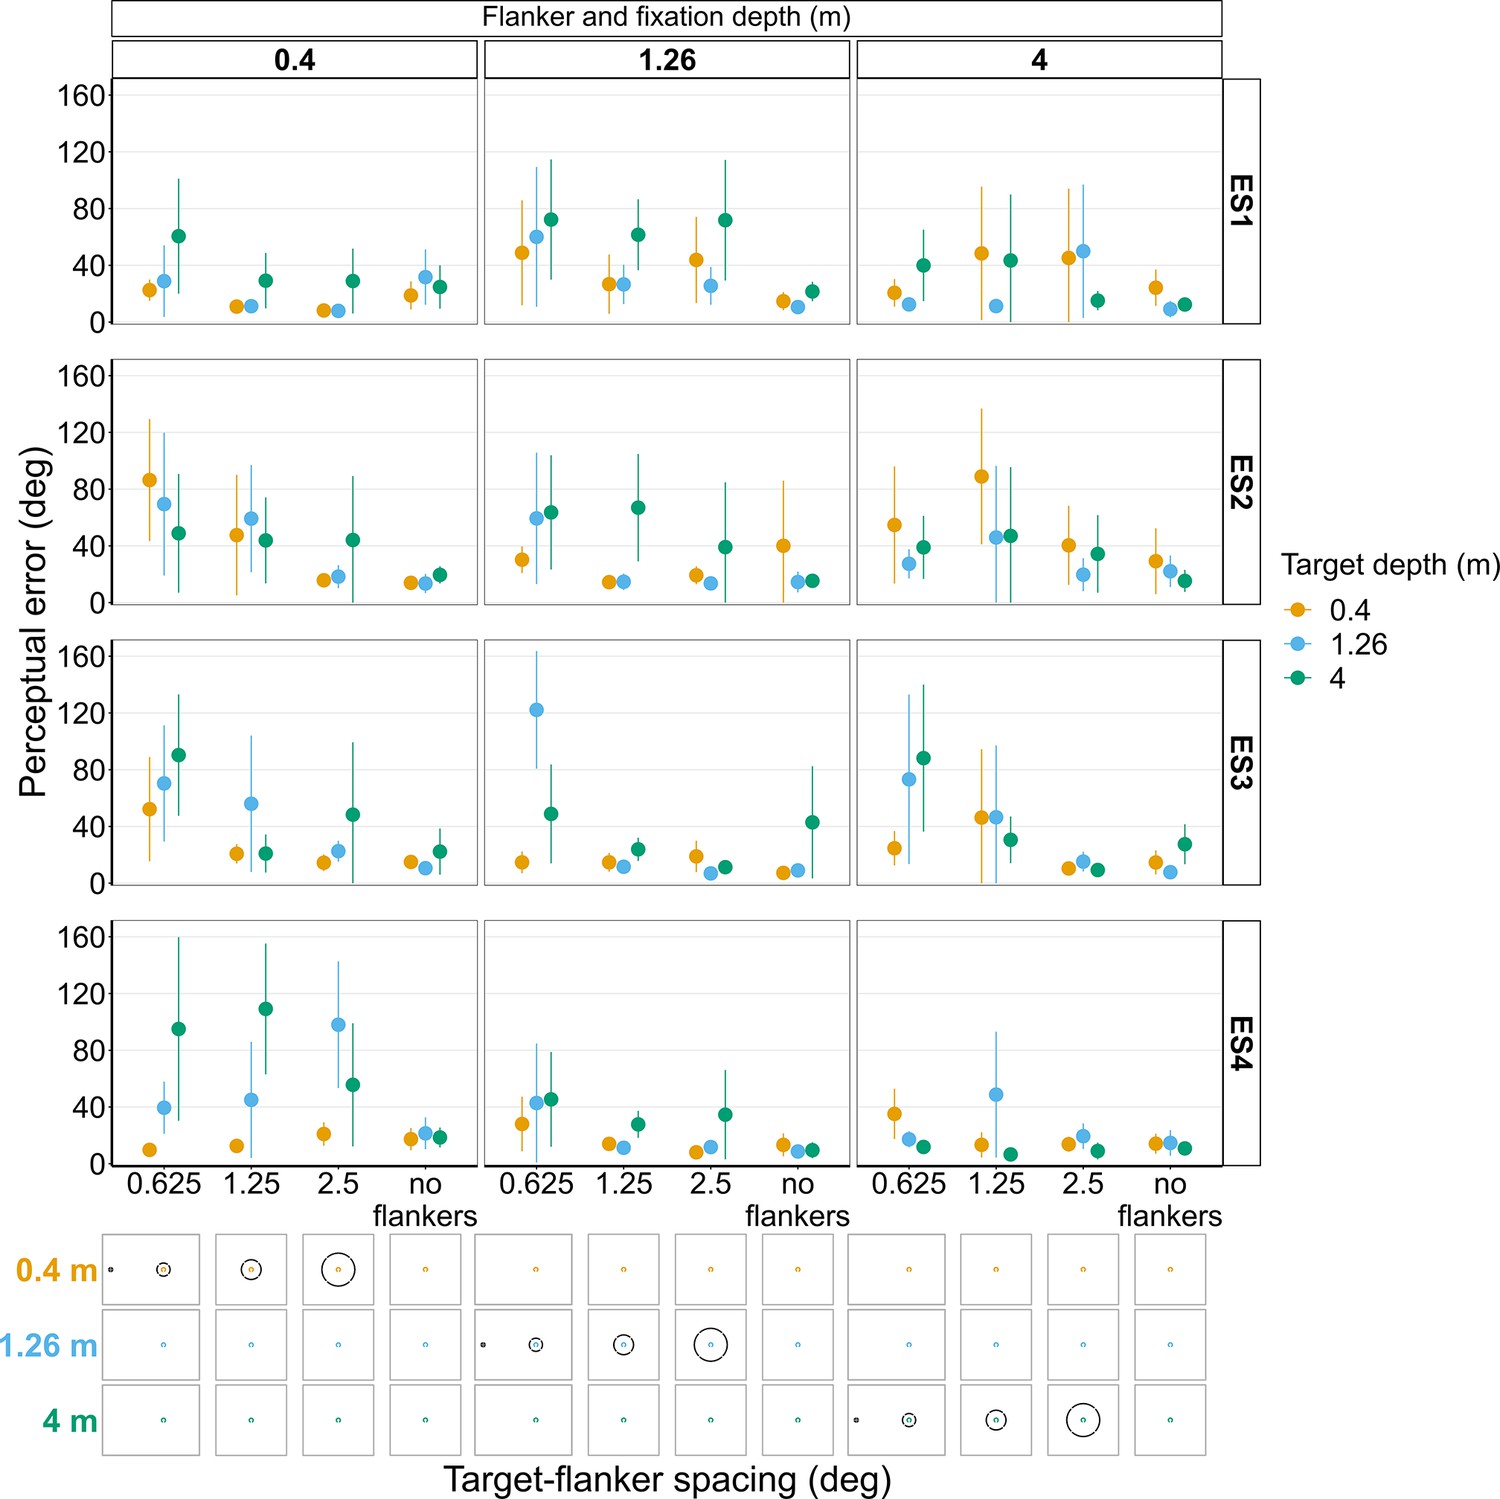
Perceptual error results from individual experienced subjects (ES1-4) for Experiments 3 and 4 in which target depth was varied while the flanker ring was always at fixation depth.
Error bars show 95% bootstrapped confidence intervals. Note that the 5° target-flanker spacing condition was not included in this set of experiments. Since the same subjects participated in both experiments, the results from Experiments 3 and 4 have been combined into a single figure to make it easier to compare the different conditions. The visual aid below each graph shows the depth of the target (based on the same color key as the plot) relative to the depth of the fixation point and flanker ring (shown in black) for each stimulus condition. The relative sizes of, and distances between, the fixation point, target, and flanker ring are to scale. Note that the fixation point is only shown for the 0.625° target-flanker spacing due to limited space within the figure.
Figure 11—figure supplement 1
Proportion of trials in which each individual experienced subject (ES1-4) reported seeing the target inside the flanker ring for Experiments 3 and 4.
In both experiments’ target depth was varied while the flanker ring was always at fixation depth. Error bars show Wilson score intervals. The 5° target-flanker spacing condition was not included in this set of experiments. Since the same subjects participated in both experiments, the results from Experiments 3 and 4 have been combined into a single figure to make it easier to compare the different conditions. The visual aid below each graph shows the depth of the target (based on the same color key as the plot) relative to the depth of the fixation point and flanker ring (shown in black) for each stimulus condition. The relative sizes of, and distances between, the fixation point, target, and flanker ring are to scale. Note that the fixation point is only shown for the 0.625° target-flanker spacing due to limited space within the figure.
Figure 11—figure supplement 2
Perceived target position relative to the flanker ring reported by each individual experienced subject (ES1-4) in Experiments 3 and 4.
Proportion of trials in Experiments 3 and 4 in which each individual experienced subject (ES1-4) reported seeing the target in the center of the flanker ring (A), within the flanker ring but not in the center (B), partly or fully obstructed by the flanker ring (C), outside the flanker ring (D), or they were unsure or there was no flanker ring (E). In both experiments, target depth was varied while the flanker ring was always at fixation depth. The 5° target-flanker spacing condition was not included in this set of experiments. There were 10 repeats per stimulus condition in Experiment 3 and eight repeats in Experiments 4. Since the same subjects participated in both experiments, the results from Experiments 3 and 4 have been combined into single figures to make it easier to compare the different conditions.
Figure 12
Perceptual error results from individual experienced subjects (ES1-4) for Experiment 5 in which the target and flanker ring were always presented at the same depth as the fixation point.
Error bars show 95% bootstrapped confidence intervals. Note that the 5° target-flanker spacing condition was not included in this set of experiments. The visual aid below the graph shows the depth of the target, flanker ring, and fixation point (based on the same color key as the plot) for each stimulus condition. The relative sizes of, and distances between, the fixation point, target, and flanker ring are to scale. Note that the fixation point is only shown for the 0.625° target-flanker spacing so not to overcrowd the figure.
Tables
Table 1
Summary of the stimulus conditions in each experiment. Note that for target-flanker spacing, ‘infinity’ = no flanker ring. For the experiments conducted with the four experienced subjects, the 5° target-flanker eccentricity condition was not included.
| Experiment | Fixation depth (m) | Target depth (m) | Flanker depth (m) | Target-flanker spacing (degrees) | No. of stimulus conditions | Total no. presentations | Sample size |
|---|---|---|---|---|---|---|---|
| Exp 1 | Mid (1.26) | Mid (1.26) | Near (0.4) | 0.625°, 1.25°, 2.5°, 5° | 13 | 130 (10 reps per stimulus) | N=22 |
| Mid (1.26) | Mid (1.26) | Mid (1.26) | 0.625°, 1.25°, 2.5°, 5°, infinity | ||||
| Mid (1.26) | Mid (1.26) | Far (4) | 0.625°, 1.25°, 2.5°, 5° | ||||
| Exp 2 | Near (0.4) | Near (0.4) | Near (0.4) | 0.625°, 1.25°, 2.5°, 5°, infinity | 26 | 260 (10 reps per stimulus) | N=19 |
| Near (0.4) | Near (0.4) | Mid (1.26) | 0.625°, 1.25°, 2.5°, 5° | ||||
| Near (0.4) | Near (0.4) | Far (4) | 0.625°, 1.25°, 2.5°, 5° | ||||
| Far (4) | Far (4) | Near (0.4) | 0.625°, 1.25°, 2.5°, 5° | ||||
| Far (4) | Far (4) | Mid (1.26) | 0.625°, 1.25°, 2.5°, 5° | ||||
| Far (4) | Far (4) | Far (4) | 0.625°, 1.25°, 2.5°, 5°, infinity | ||||
| Exp 3 | Mid (1.26) | Near (0.4) | Mid (1.26) | 0.625°, 1.25°, 2.5°, 5°, infinity | 15 | 150 (10 reps per stimulus) | N=21 |
| Mid (1.26) | Mid (1.26) | Mid (1.26) | 0.625°, 1.25°, 2.5°, 5°, infinity | ||||
| Mid (1.26) | Far (4) | Mid (1.26) | 0.625°, 1.25°, 2.5°, 5°, infinity | ||||
| Exp 4 | Near (0.4) | Near (0.4) | Near (0.4) | 0.625°, 1.25°, 2.5°, 5°, infinity | 30 | 240 (8 reps per stimulus) | N=21 |
| Near (0.4) | Mid (1.26) | Near (0.4) | 0.625°, 1.25°, 2.5°, 5°, infinity | ||||
| Near (0.4) | Far (4) | Near (0.4) | 0.625°, 1.25°, 2.5°, 5°, infinity | ||||
| Far (4) | Near (0.4) | Far (4) | 0.625°, 1.25°, 2.5°, 5°, infinity | ||||
| Far (4) | Mid (1.26) | Far (4) | 0.625°, 1.25°, 2.5°, 5°, infinity | ||||
| Far (4) | Far (4) | Far (4) | 0.625°, 1.25°, 2.5°, 5°, infinity | ||||
| Exp 5 | Near (0.4) | Near (0.4) | Near (0.4) | 0.625°, 1.25°, 2.5°, 5°, infinity | 15 | 150 (10 reps per stimulus) | N=15 |
| Mid (1.26) | Mid (1.26) | Mid (1.26) | 0.625°, 1.25°, 2.5°, 5°, infinity | ||||
| Far (4) | Far (4) | Far (4) | 0.625°, 1.25°, 2.5°, 5°, infinity |
Additional files
Download links
A two-part list of links to download the article, or parts of the article, in various formats.
Downloads (link to download the article as PDF)
Open citations (links to open the citations from this article in various online reference manager services)
Cite this article (links to download the citations from this article in formats compatible with various reference manager tools)
Large depth differences between target and flankers can increase crowding: Evidence from a multi-depth plane display
eLife 12:e85143.
https://doi.org/10.7554/eLife.85143


