Meta-Research: The effect of the COVID-19 pandemic on the gender gap in research productivity within academia
- Groningen Institute for Evolutionary Life Sciences, University of Groningen, Netherlands
- Department of Animal and Plant Sciences, University of Sheffield, United Kingdom
- Department of Biological Sciences, University of Bergen, Norway
- Department of Human Behavior, Ecology and Culture, Max Planck Institute for Evolutionary Anthropology, Germany
- Rudjer Boskovic Institute, Croatia
- Netherlands Institute of Ecology, NIOO-KNAW, Netherlands
Figures
Figure 1
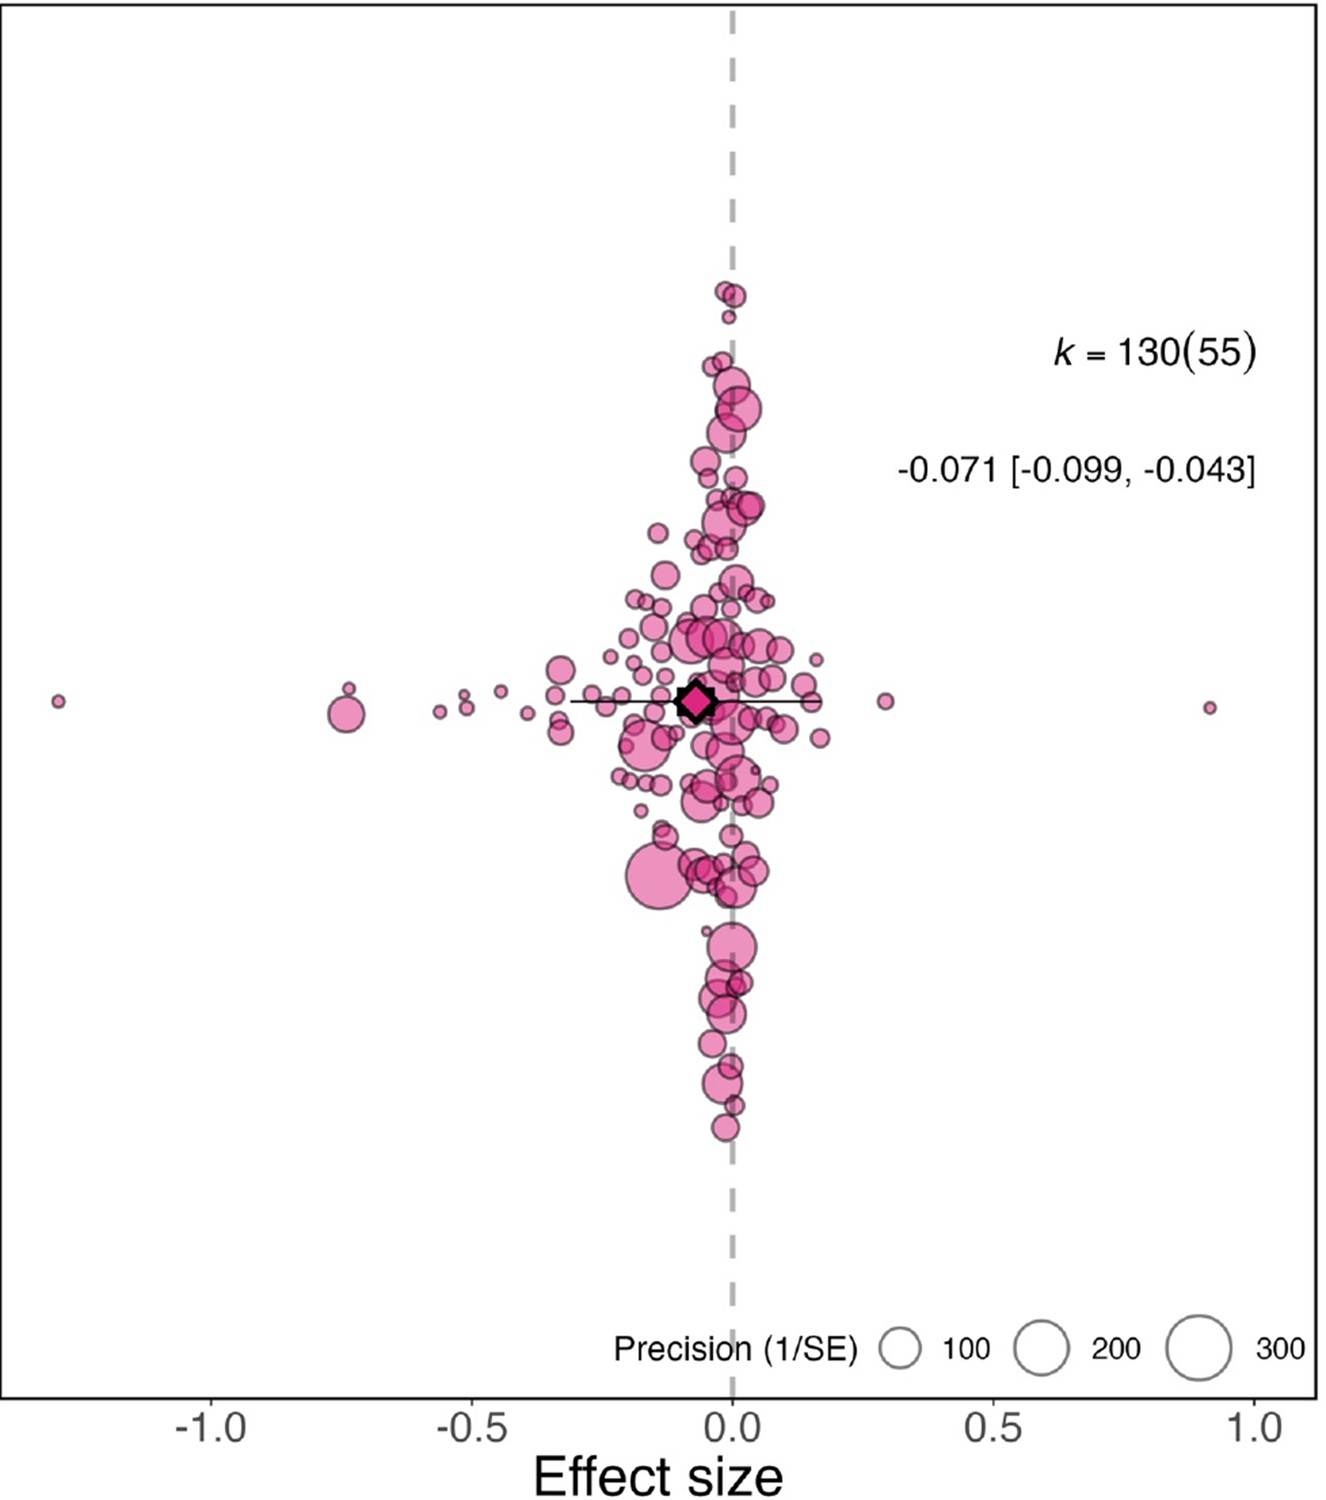
Overall effect of the pandemic on the gender gap in research productivity.
Orchard plot showing all 130 effect sizes (points), and the precision with which they were measured (point size). The plot shows the mean effect size (darker coloured point outlined in black and vertically centred), the 95% confidence interval (horizontal thick black bar), the 95% prediction interval of the expected spread of effect sizes based on between-study variance (horizontal thin black bar) and is centred at 0 (vertical dashed line). Points are spread vertically for presentation reasons to reduce overlap. k is the total number of effect sizes; the 130 effect sizes shown here were calculated from 55 studies.
Figure 2
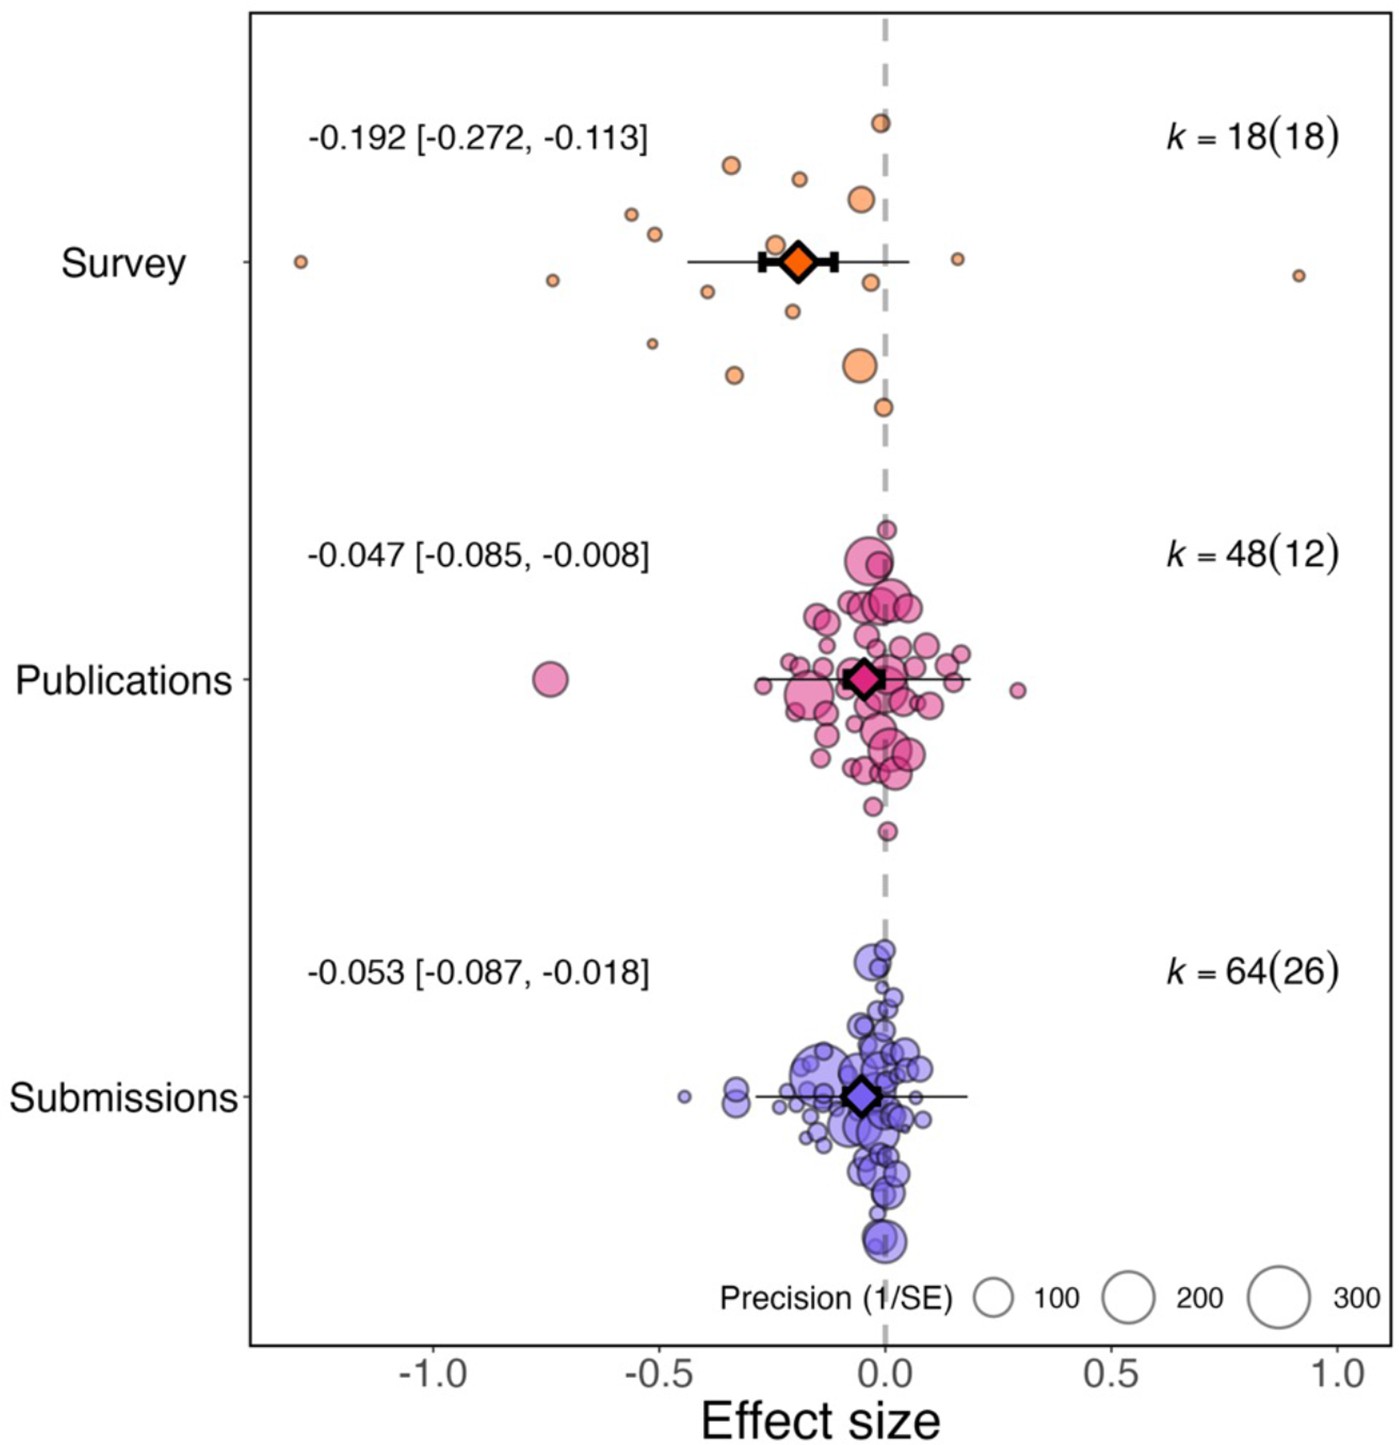
Effect of the pandemic on the gender gap in research productivity for three different measures of productivity.
Orchard plots comparing the distribution of effect sizes (points) and the precision with which they were measured (point size) when the measure of research productivity is based on responses to surveys (top), number of publications (middle), and number of submissions (bottom). Each plot shows the mean effect size (darker coloured point outlined in black and vertically centred), the 95% confidence interval (horizontal thick black bar), the 95% prediction interval of the expected spread of effect sizes based on between-study variance (horizontal thin black bar) and is centred at 0 (vertical dashed line). Within each category, points are spread vertically for presentation reasons to reduce overlap. For each subgroup, k is the total number of effect sizes, and the number of studies from which these effect sizes were calculated is given inside the brackets.
Figure 3
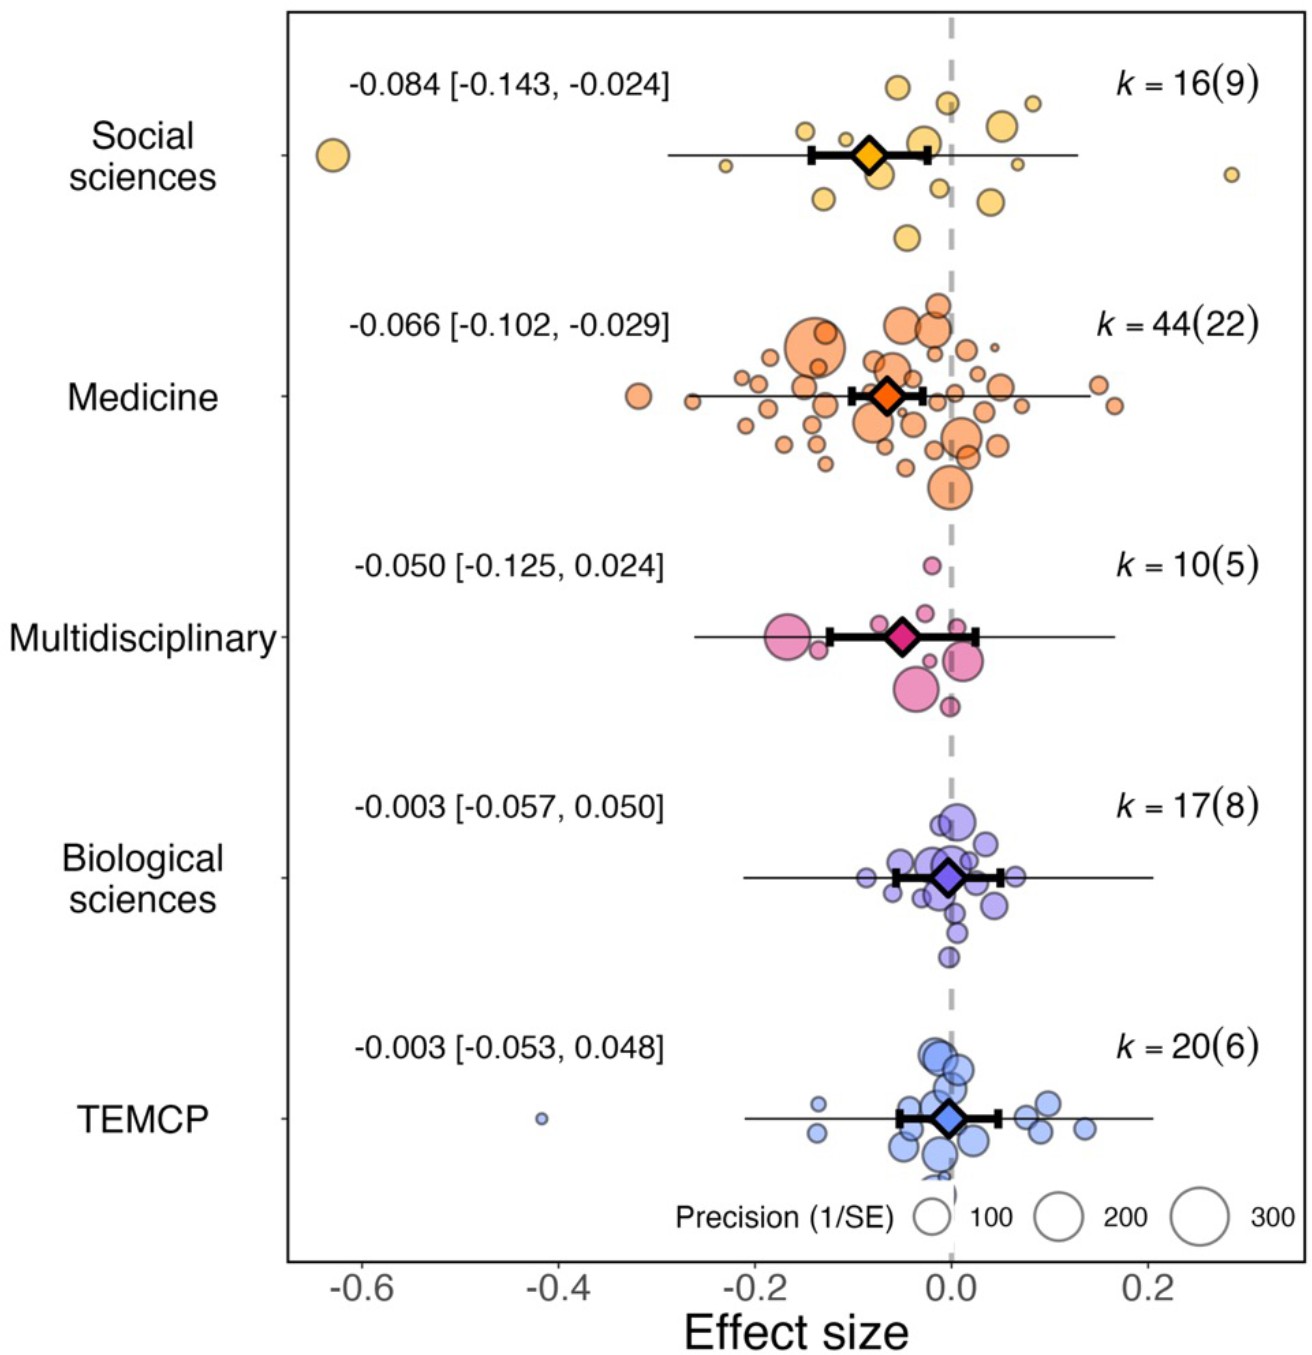
Overall effect of the pandemic on the gender gap in research productivity for five research fields.
Orchard plot comparing the distribution of effect sizes (points) and the precision with which they were measured (point sizes) for five research fields. Each plot shows the mean effect size (darker coloured point outlined in black and vertically centred), the 95% confidence interval (horizontal thick black bar), the 95% prediction interval of the expected spread of effect sizes based on between-study variance (horizontal thin black bar) and is centred at 0 (vertical dashed line). TEMCP: technology, engineering, mathematics, chemistry and physics. Within each category, points are spread vertically for presentation reasons to reduce overlap. For each subgroup, k is the total number of effect sizes, and the number of studies from which these effect sizes were calculated is given inside the brackets.
Figure 4
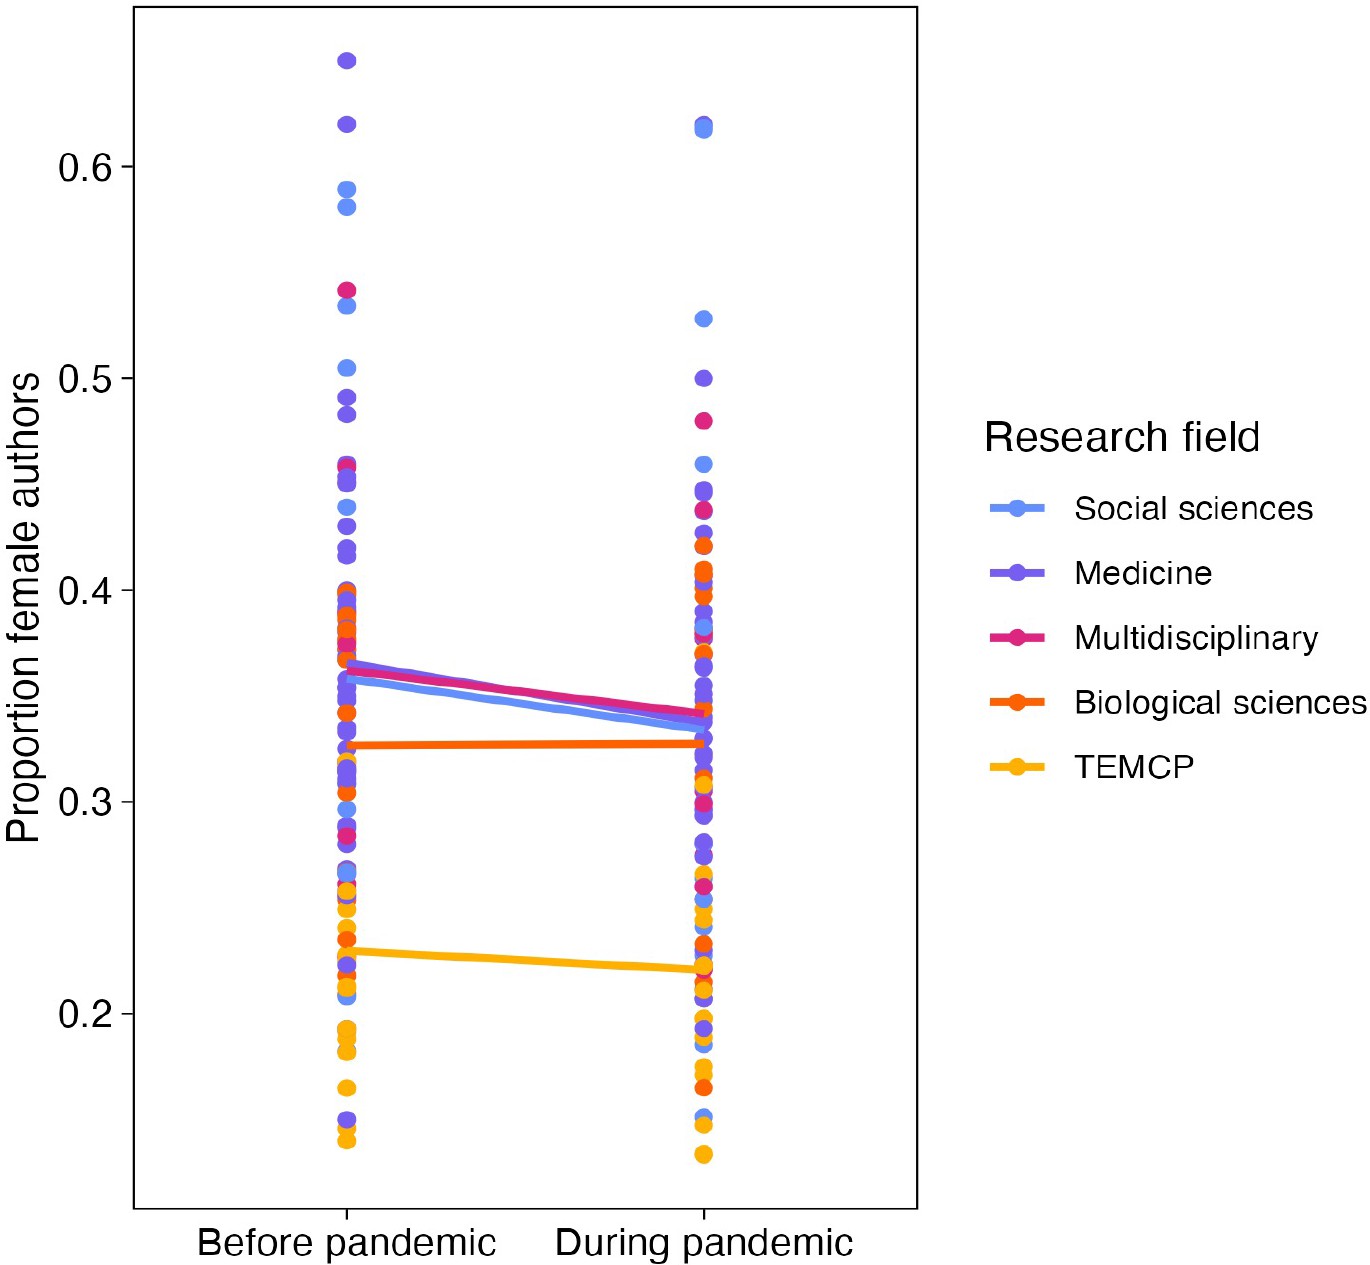
Effect of the pandemic on the gender gap in research productivity (as measured by number of articles submitted or published) for five research fields.
Each point shows the proportion of female authors before (left) or during (right) the pandemic. The solid lines connect the mean value for each research field before and during the pandemic. The largest decreases are observed for the three fields that had the highest proportions of female authors (social sciences, medicine and multidisciplinary). TEMCP reflects the technology, engineering, mathematics, chemistry and physics fields, and multidisciplinary includes studies that span fields.
Figure 5
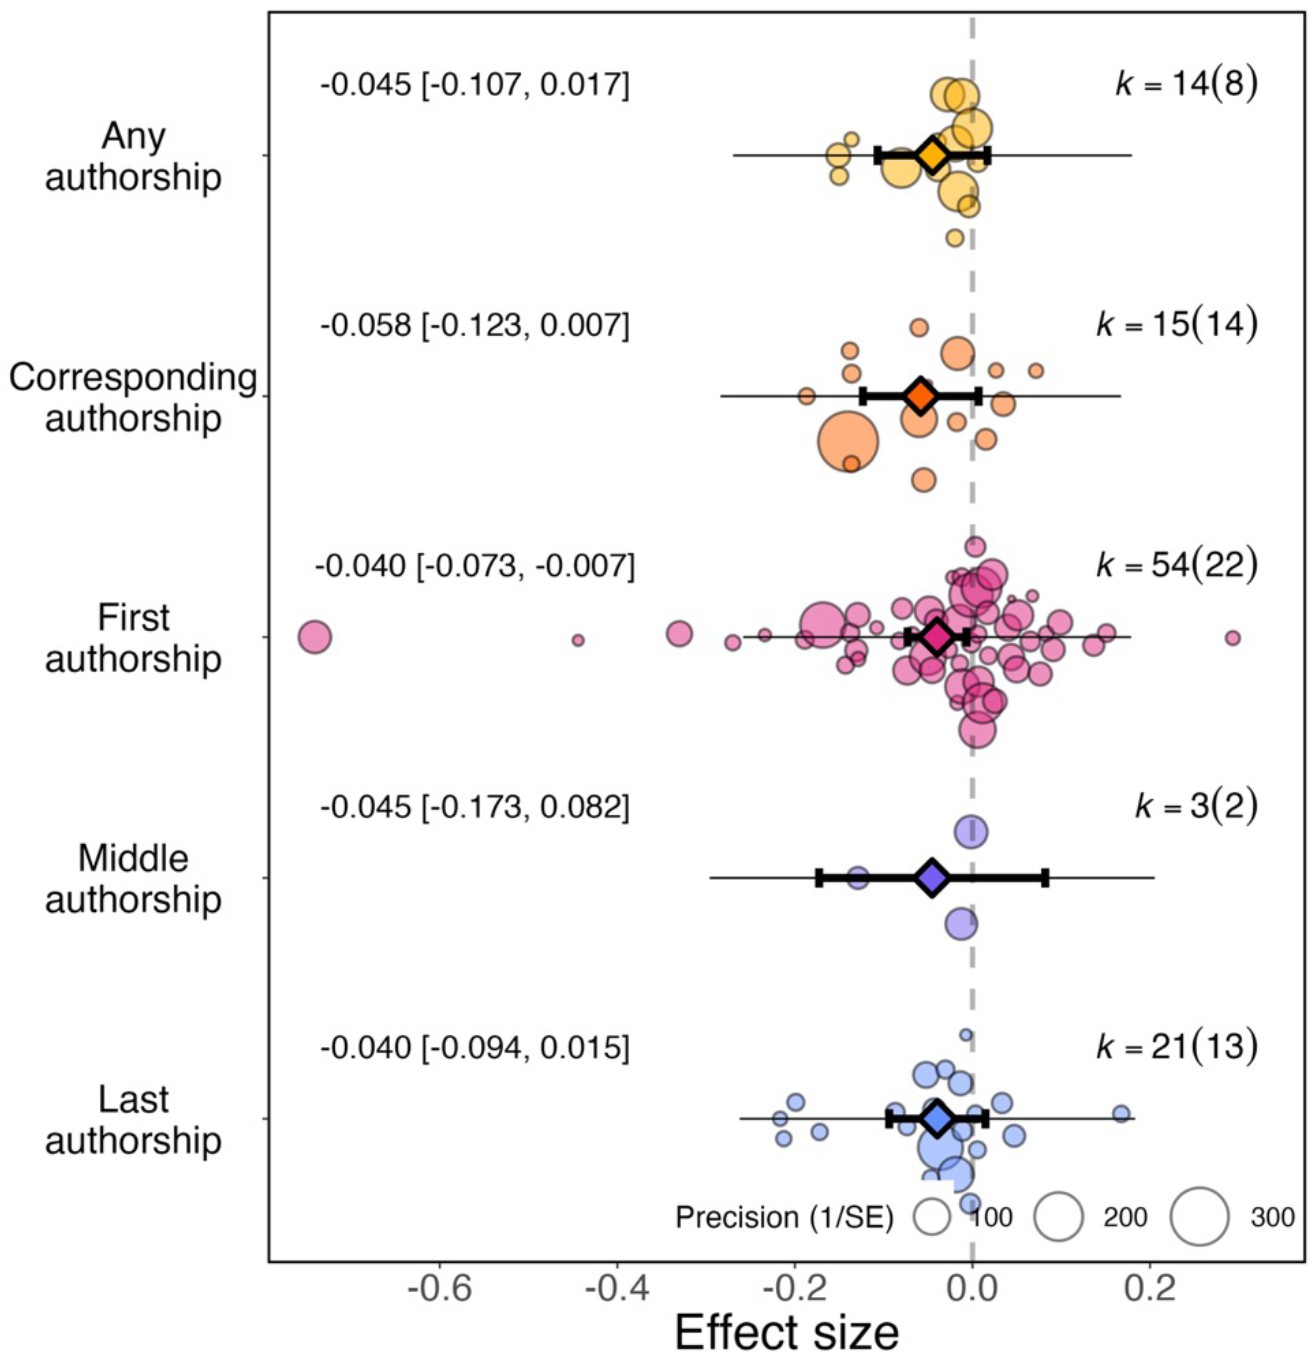
Effect of the pandemic on the gender gap in research productivity (as measured by number of articles submitted or published) for five authorship positions.
Orchard plots comparing the distribution of effect sizes (points) and the precision with which they were measured (point sizes), for various authorship positions. Each plot shows the mean effect size (darker coloured points outlined in black and vertically centred), the 95% confidence interval (horizontal thick black bar), the 95% prediction interval of the expected spread of effect sizes based on between-study variance (horizontal thin black bar) and is centred at 0 (vertical dashed line). Within each category, points are spread vertically for presentation reasons to reduce overlap. For each subgroup, k is the total number of effect sizes, and the number of studies from which these effect sizes were calculated is given inside the brackets.
Figure 6 with 1 supplement
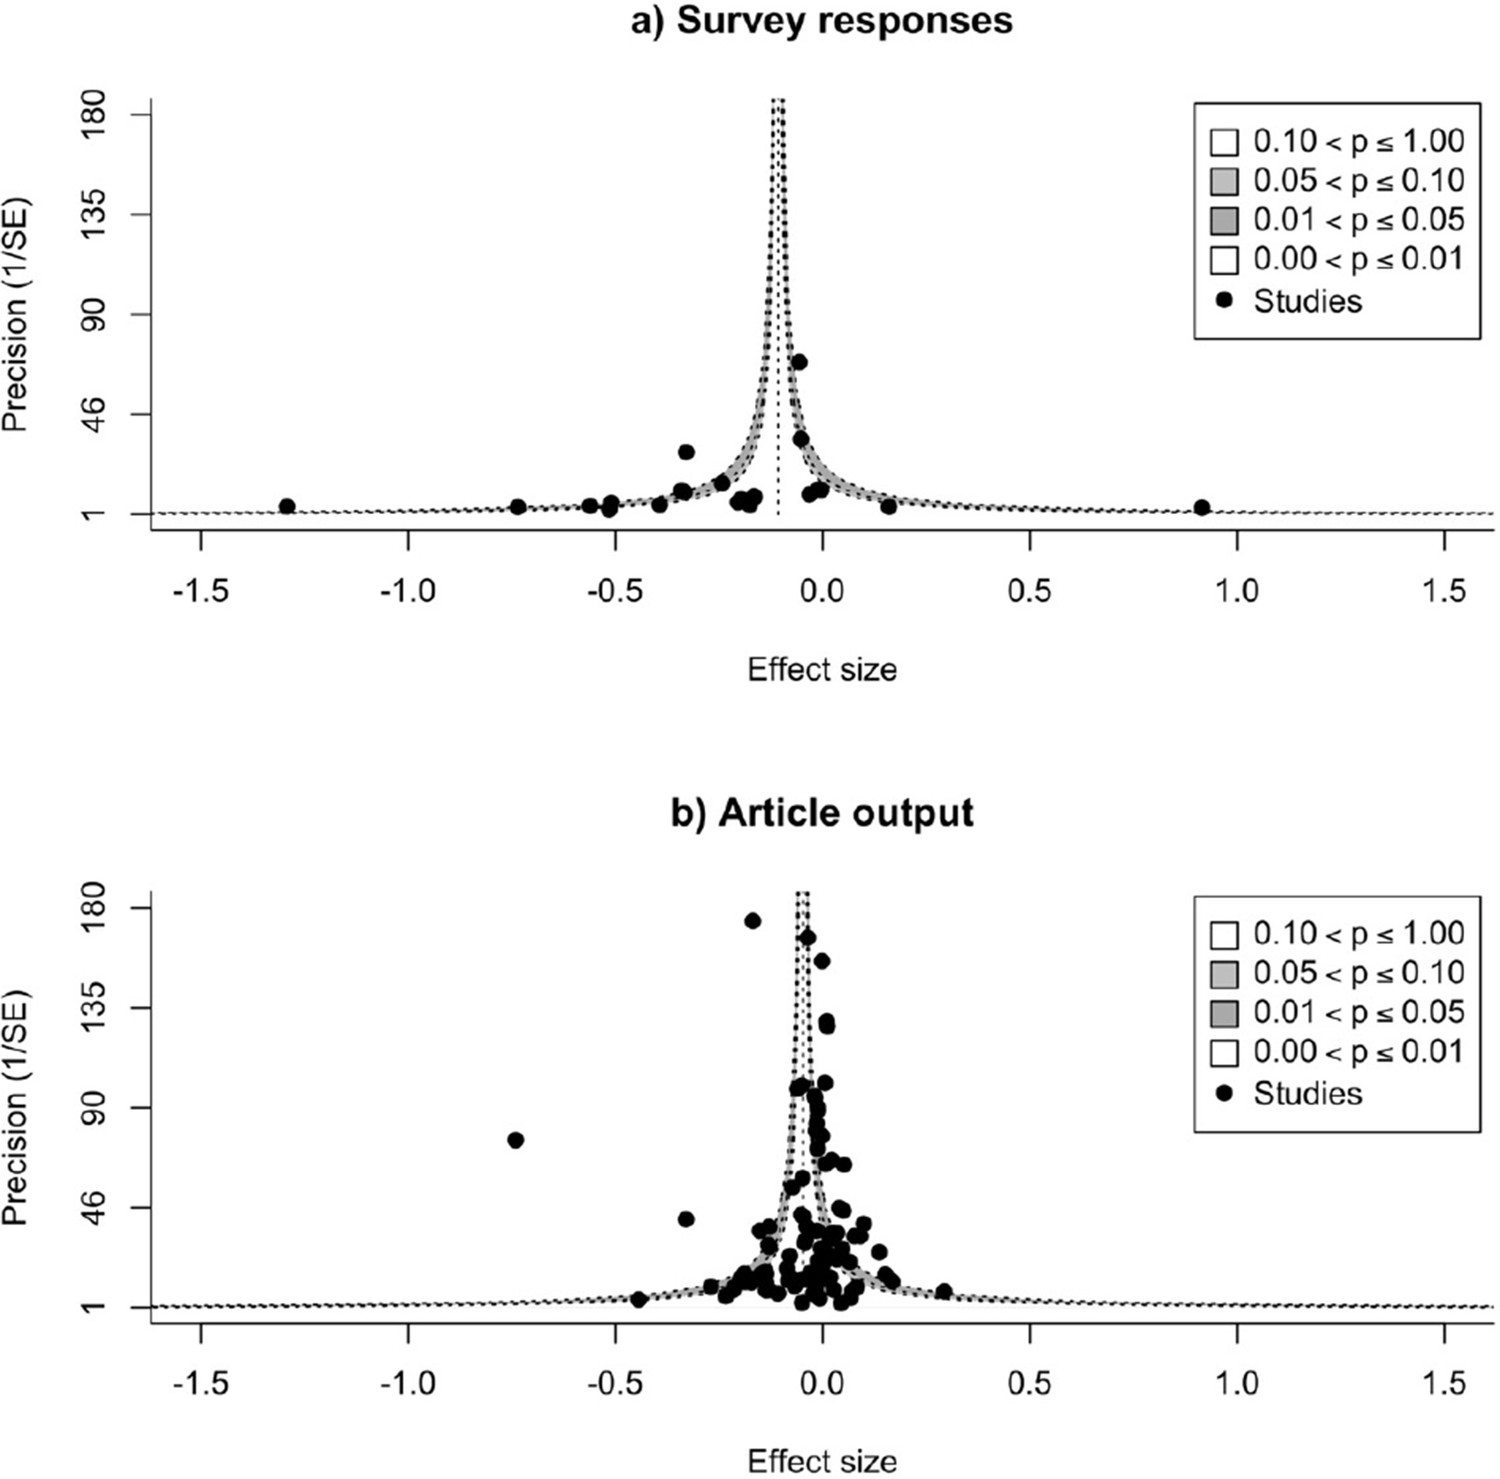
Checking for possible publication bias.
Funnel plots of effect sizes and their precision, as a function of standard error, for studies that measure research productivity by responses to a survey (A), and by number of articles published (B). The vertical dashed line is the summary effect size; the legend outlines levels of statistical significance for effect sizes based on their precision. Neither plot shows evidence for publication bias.
Figure 6—figure supplement 1
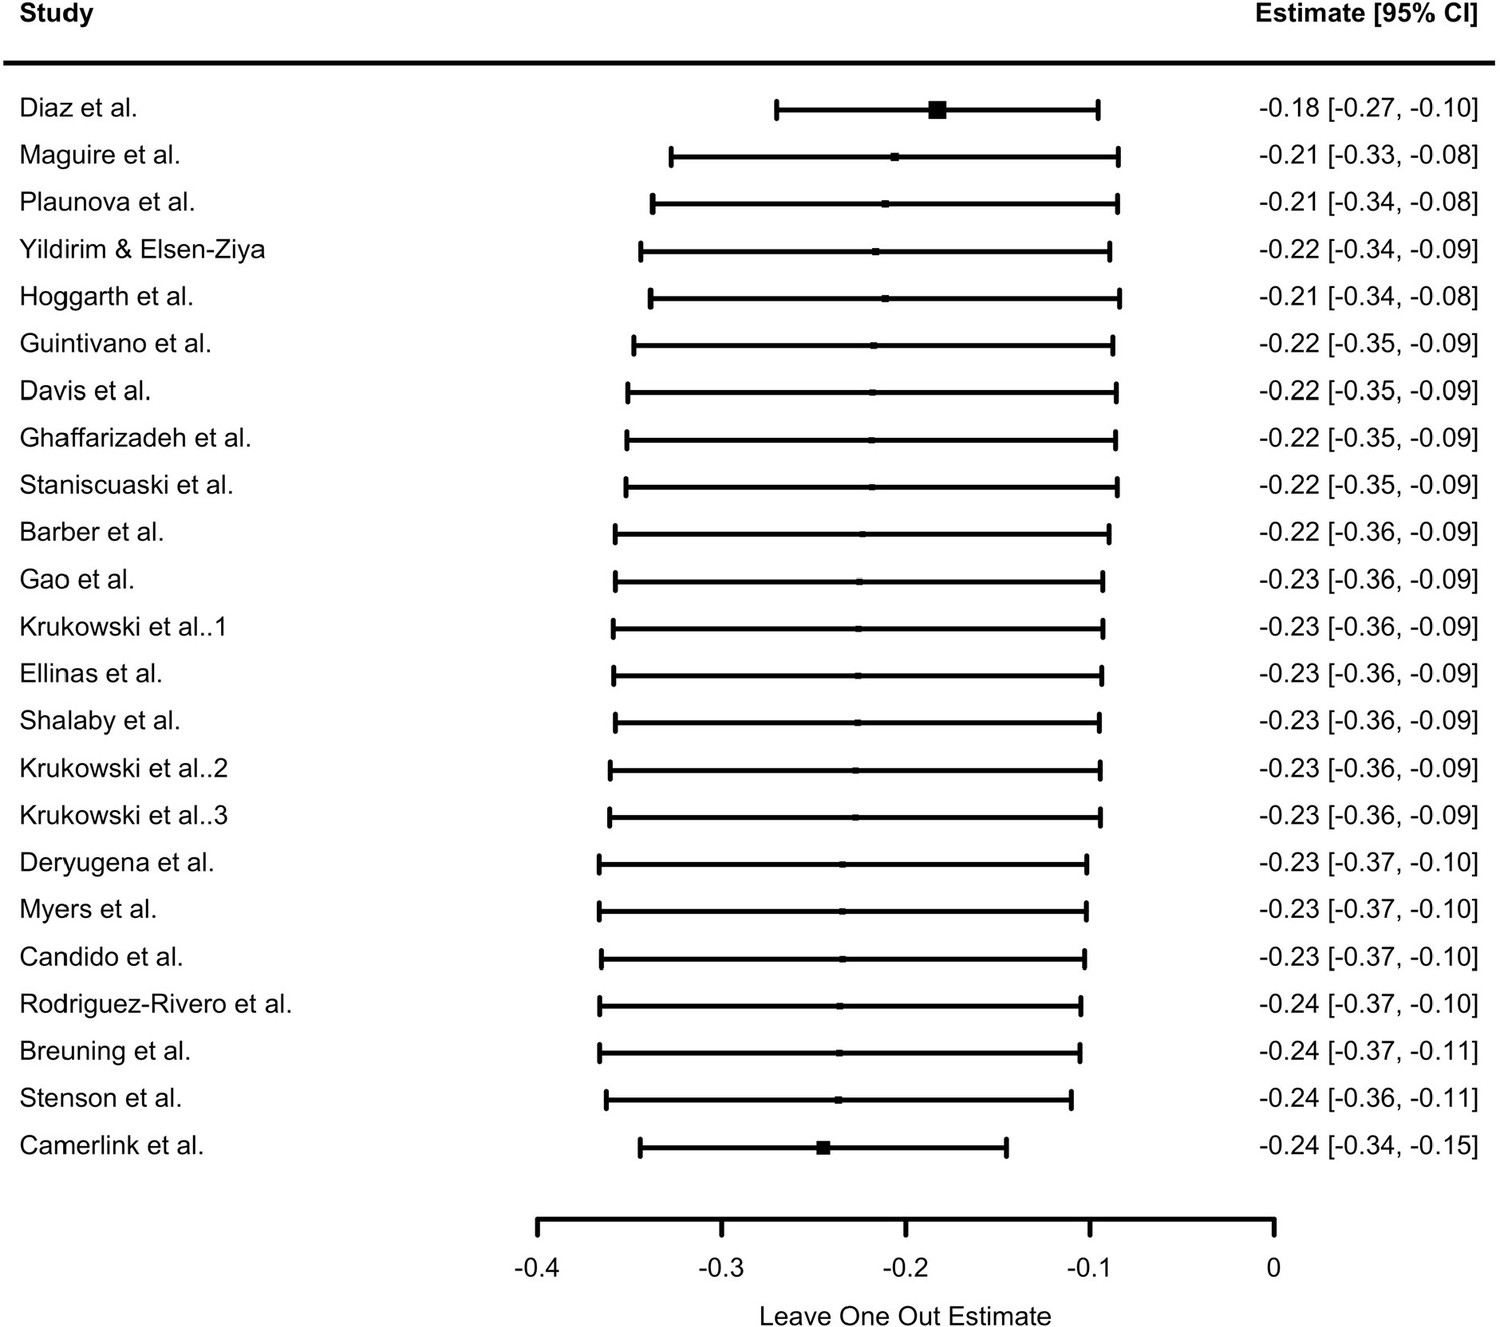
Forest plot of leave-one-out analysis for survey studies only.
For each survey-study left out, the corresponding model estimate and 95% confidence interval is given. While there is large variation in the individual estimates, there is no single study that predominantly affects the average estimate.
Tables
Table 1
Final Boolean search string used in full literature search for texts since 2020.
Terms in italics were added using litsearchR.
| Concept group | PICO group | Terms |
|---|---|---|
| Academia | Population | (academi* OR author* OR database* OR journal* OR research OR scien*) |
| Gender | Population | AND (female* OR gender OR male* OR men OR women) |
| Pandemic | Intervention | AND (coronavirus OR covid OR pandemic) |
| Inequality | Comparator | AND (bias* OR disparit* OR disproportion* OR fewer OR gap OR "gender difference*" OR imbalance* OR inequalit* OR inequit* OR parity OR "sex difference*" OR skew* OR unequal) |
| Productivity | Outcome | AND (performan* OR publication* OR publish* OR productiv*) |
| Exclusion of biomedical studies | Population | AND NOT (experiment OR laboratory OR mortality OR surviv* OR "acute respiratory" OR gis OR icu OR risk OR rna OR symptoms) |
Additional files
-
Supplementary file 1
Scoping search, calculations and variables.
- https://cdn.elifesciences.org/articles/85427/elife-85427-supp1-v2.xlsx
-
Supplementary file 2
Tables S1–S4 and Figure S1.
- https://cdn.elifesciences.org/articles/85427/elife-85427-supp2-v2.docx
-
Supplementary file 3
Study screening.
- https://cdn.elifesciences.org/articles/85427/elife-85427-supp3-v2.xlsx
-
MDAR checklist
- https://cdn.elifesciences.org/articles/85427/elife-85427-mdarchecklist1-v2.pdf
Download links
A two-part list of links to download the article, or parts of the article, in various formats.
Downloads (link to download the article as PDF)
Open citations (links to open the citations from this article in various online reference manager services)
Cite this article (links to download the citations from this article in formats compatible with various reference manager tools)
Meta-Research: The effect of the COVID-19 pandemic on the gender gap in research productivity within academia
eLife 12:e85427.
https://doi.org/10.7554/eLife.85427


