Meta-Research: The effect of the COVID-19 pandemic on the gender gap in research productivity within academia
- Groningen Institute for Evolutionary Life Sciences, University of Groningen, Netherlands
- Department of Animal and Plant Sciences, University of Sheffield, United Kingdom
- Department of Biological Sciences, University of Bergen, Norway
- Department of Human Behavior, Ecology and Culture, Max Planck Institute for Evolutionary Anthropology, Germany
- Rudjer Boskovic Institute, Croatia
- Netherlands Institute of Ecology, NIOO-KNAW, Netherlands
Abstract
Using measures of research productivity to assess academic performance puts women at a disadvantage because gender roles and unconscious biases, operating both at home and in academia, can affect research productivity. The impact of the COVID-19 pandemic on research productivity has been the subject of a number of studies, including studies based on surveys and studies based on numbers of articles submitted to and/or published in journals. Here, we combine the results of 55 studies that compared the impact of the pandemic on the research productivity of men and women; 17 of the studies were based on surveys, 38 were based on article counts, and the total number of effect sizes was 130. We find that the gender gap in research productivity increased during the COVID-19 pandemic, with the largest changes occurring in the social sciences and medicine, and the changes in the biological sciences and TEMCP (technology, engineering, mathematics, chemistry and physics) being much smaller.
Introduction
Research productivity, defined as the number of manuscripts or publications, is a widely used, but flawed, metric for evaluating academic merit because it biases against individuals according to socio-demographic circumstances. Women are disadvantaged compared to men when success is measured using traditional metrics of research productivity (Astegiano et al., 2019; Huang et al., 2020), despite no actual differences in contribution and impact of research (van den Besselaar and Sandström, 2016; van den Besselaar and Sandström, 2017). Additionally, during the COVID-19 pandemic, novel living and working conditions worsened the research productivity of many women worldwide (Anwer, 2020; Boncori, 2020; Guy and Arthur, 2020; Herman et al., 2021; Altan‐Olcay and Bergeron, 2022).
Multiple factors are likely to contribute to gendered changes in research productivity during a pandemic. First, women generally perform more unpaid caregiving and domestic work (Schiebinger et al., 2008; Schiebinger and Gilmartin, 2010). Social-distancing and facility closures during the pandemic increased caregiving and domestic work (Carli, 2020; Carlson et al., 2020) with reduced community help from nurseries, schools, care homes, house cleaners, laundrettes, nannies, babysitters and family (Myers et al., 2020; Barber et al., 2021; Breuning et al., 2021; Deryugina et al., 2021; Shalaby et al., 2021). As these tasks have disproportionately fallen on women, time and space for academic research during “work-from-home” conditions was difficult (Abdellatif and Gatto, 2020; Boncori, 2020; Guy and Arthur, 2020).
Second, the distribution of work within academic institutions is often gendered. Women undertake more ‘non-promotable’ tasks (Babcock et al., 2022) such as administrative, supportive and mentoring roles (Porter, 2007; Mitchell and Hesli, 2013; Babcock et al., 2017; Guarino and Borden, 2017; O’Meara et al., 2017a; O’Meara et al., 2017b). Changes in teaching and administration in response to the pandemic were therefore more likely to be facilitated by women (Docka‐Filipek and Stone, 2021; Minello et al., 2021).
Third, labour roles contributing towards publication are also gendered. Women generally perform more technical work such as generating data, whilst men assume more core tasks in conceptualisation, analysis, writing and publishing (Macaluso et al., 2016). Pandemic closures to research institutions would therefore likely impact women authorship from technical roles stronger than men. Additionally, the surge in publications during the pandemic (Else, 2020) could have reduced the quality of peer review, with evaluation being more influenced by cognitive shortcuts. These shortcuts are often associated with biases tending to operate against women (Kaatz et al., 2014; Reuben et al., 2014; Carli, 2020) resulting in lower success getting submissions accepted (Fox and Paine, 2019; Murray et al., 2019; Day et al., 2020; Hagan et al., 2020).
The role of these factors shaping the gender gap in research productivity during the pandemic might differ across research fields (Madsen et al., 2022). One possibility is that research fields that were already more gender-disparate may have experienced the most exacerbated gender gaps during the pandemic. In fields that were already traditionally more gender-disparate, less support may have been available to women to balance the effects of the pandemic. Male-dominated fields often lack viewpoints of female colleagues, and might therefore be less likely to identify and support paid care work or extended leave options (Clark, 2020; Nash and Churchill, 2020). An alternative possibility is that the pandemic might have eroded the support structures that existed in more gender balanced fields. The pandemic may also have exacerbated a gender gap in authorship position (first, middle or last) (King and Frederickson, 2021) if additional service, teaching, caregiving, and domestic roles taken up by female academics during the pandemic may limit their abilities to perform research (as first authors) or lead research (as last authors) but not in supporting research (as middle authors).
Here, we quantitatively calculated by meta-analysis the mean effect of the COVID-19 pandemic on the gender gap in research productivity and predicted the gap increased compared to the period just prior to the pandemic, such that male academic productivity saw even further increases. We assume that the pandemic might have influenced the multiple aspects that jointly affect gender inequality in research productivity, and our estimate reflects whether on average these effects have increased or decreased gender inequality.
First, as studies differ in the type of research productivity measured, between individual survey responses, numbers of submissions and numbers of publications, we investigated the influence this might have on the gender gap increase observed during the pandemic, but with no expectation of any differences.
Second, we explored variation in the gender gap increase across research fields and then explored the effect of research field according to the previous degree of gender disparity. We predicted the gender gap is exacerbated in fields that already had a previously greater gender gap, as according to the proportion of female authors, because of less support available to women to balance the effects of the pandemic.
Third, we explored whether the disparity in favourable authorship positions has increased. We predicted the gender gap has increased more in first and last, rather than middle authorship positions because female academics have been especially more limited in undertaking leading, but not supportive research roles in lockdown conditions.
Results
Our systematic literature review identified 55 studies that met the inclusion criteria (for details on the procedure please see the Methods section). All of the identified studies only compared women to men (see Limitations). We extracted and calculated 130 effect sizes from these studies and performed a meta-analysis and meta-regression to test our three hypotheses and related predictions. Out of 130 effect sizes, 23 are based on survey responses (survey studies), and 107 are studies that measure the number of submitted or published articles (article studies).
Has the pandemic increased the gender gap in research productivity?
Across the full dataset (N=130), after controlling for multiple effect sizes from the same study, we found the relative productivity of women to men decreased during the pandemic by –0.071 compared to before the pandemic (95% CI=−0.099 to −0.043, SE = 0.0144, p <0.001; Figure 1). This indicates that the relative productivity of women compared to men is 7% lower than what it was prior to the pandemic, meaning that in cases where men and women were estimated to be equally productive, the productivity of women now is only 93% that of men.
Figure 1
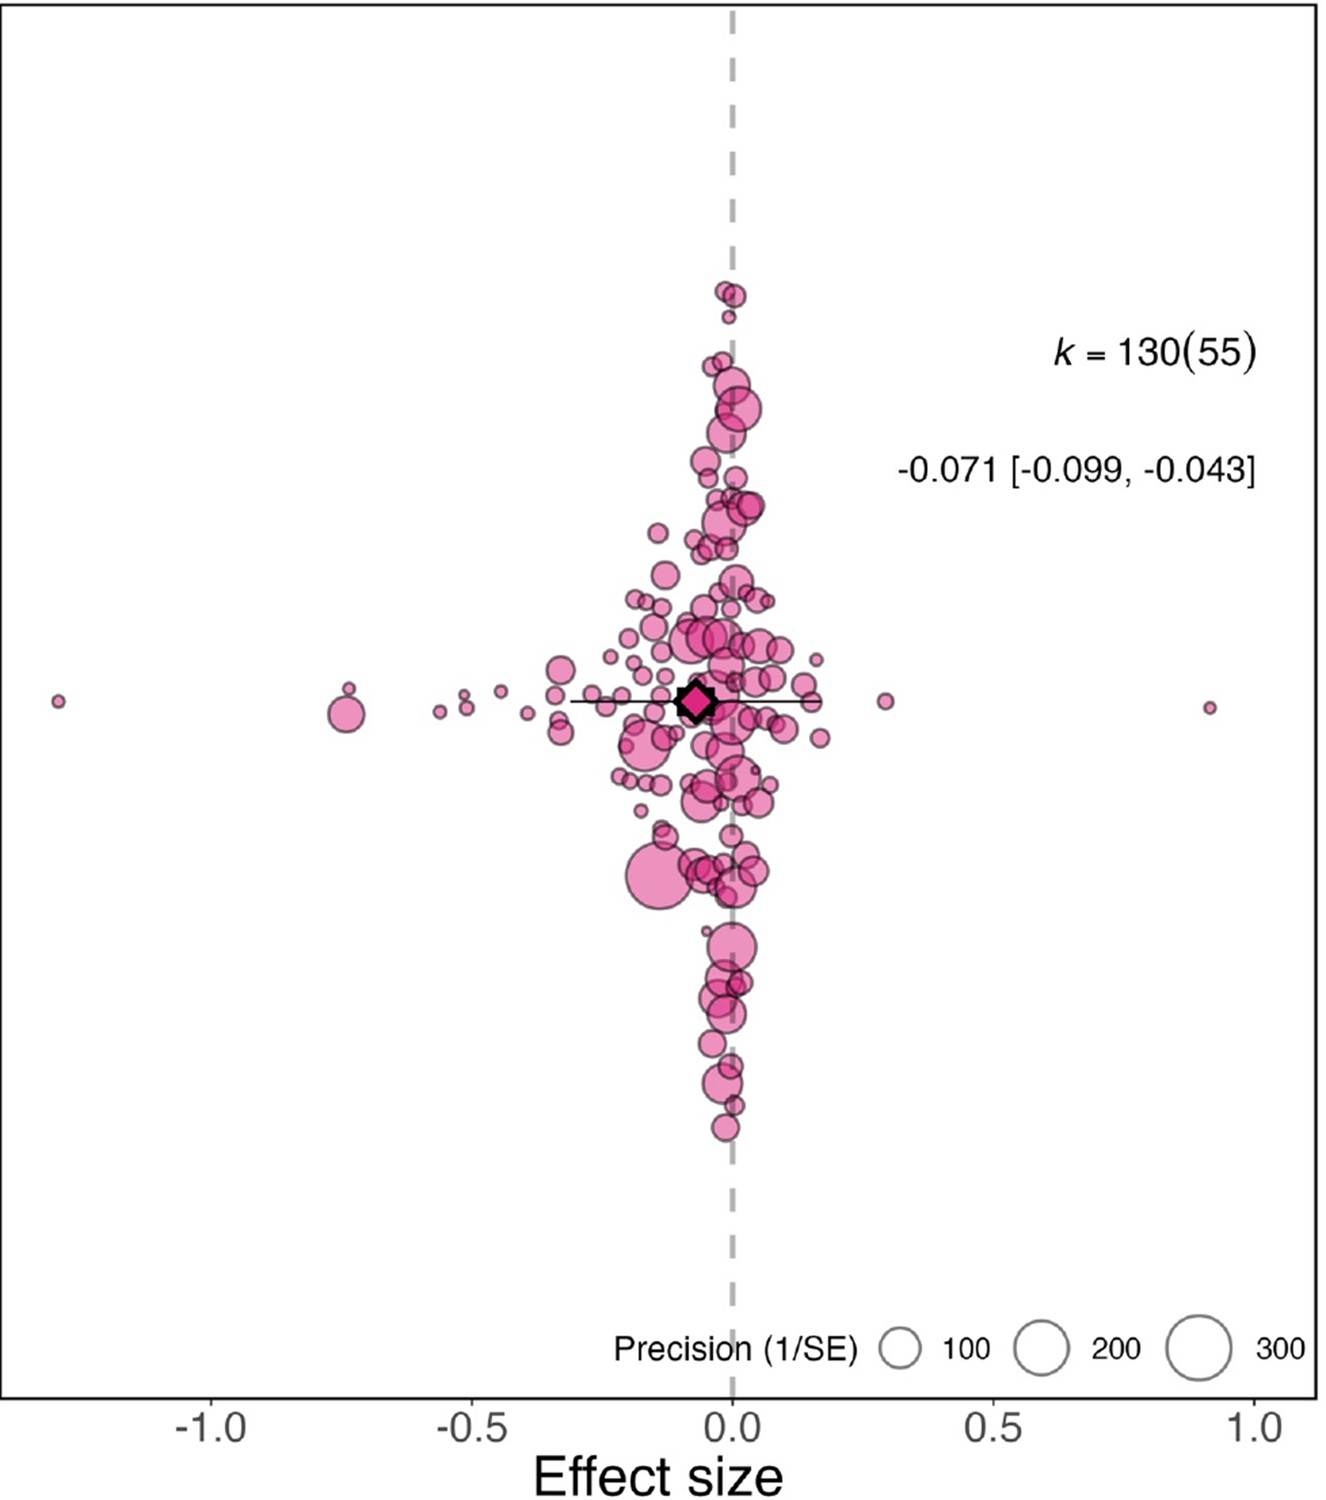
Overall effect of the pandemic on the gender gap in research productivity.
Orchard plot showing all 130 effect sizes (points), and the precision with which they were measured (point size). The plot shows the mean effect size (darker coloured point outlined in black and vertically centred), the 95% confidence interval (horizontal thick black bar), the 95% prediction interval of the expected spread of effect sizes based on between-study variance (horizontal thin black bar) and is centred at 0 (vertical dashed line). Points are spread vertically for presentation reasons to reduce overlap. k is the total number of effect sizes; the 130 effect sizes shown here were calculated from 55 studies.
There is large variation in the 130 effect sizes, with 38 indicating a clear increase in the gender gap (95% confidence intervals within negative ranges) and 56 a trend of an increase (effect size is negative but 95% confidence intervals are not within negative ranges), while 11 indicate a clear decrease in the gender gap (95% confidence intervals within positive ranges) and 25 a trend of a decrease (effect size is positive but 95% confidence intervals are not within positive ranges). Total heterogeneity was high (I2= 97.9%), with 46.6% of it explained by whether research productivity was measured by survey responses or submission/publication numbers and 52.1% explained by the individual effect sizes.
Does the gender gap change depending on how it was measured?
The change in research productivity can be measured from survey responses (survey studies, N=23 effect sizes) or from the number of articles submitted or published (article studies, N=107). The degree of increase in the gender gap caused by the pandemic differed according to the type of research productivity measured (QM (df = 3)=37.130, P<0.001; Figure 2). Studies measuring changes to research productivity during the pandemic based on surveys detected a larger overall effect (–0.192, 95% CI=−0.272 to −0.113, SE = 0.041, P<0.001) than studies that compared the number of articles published (–0.047, 95% CI=−0.085 to −0.008, P=0.017, SE = 0.020) or submitted (–0.053, 95% CI=−0.087 to −0.018, P=0.003, SE = 0.017) by authors of each gender before and during the pandemic.
Figure 2
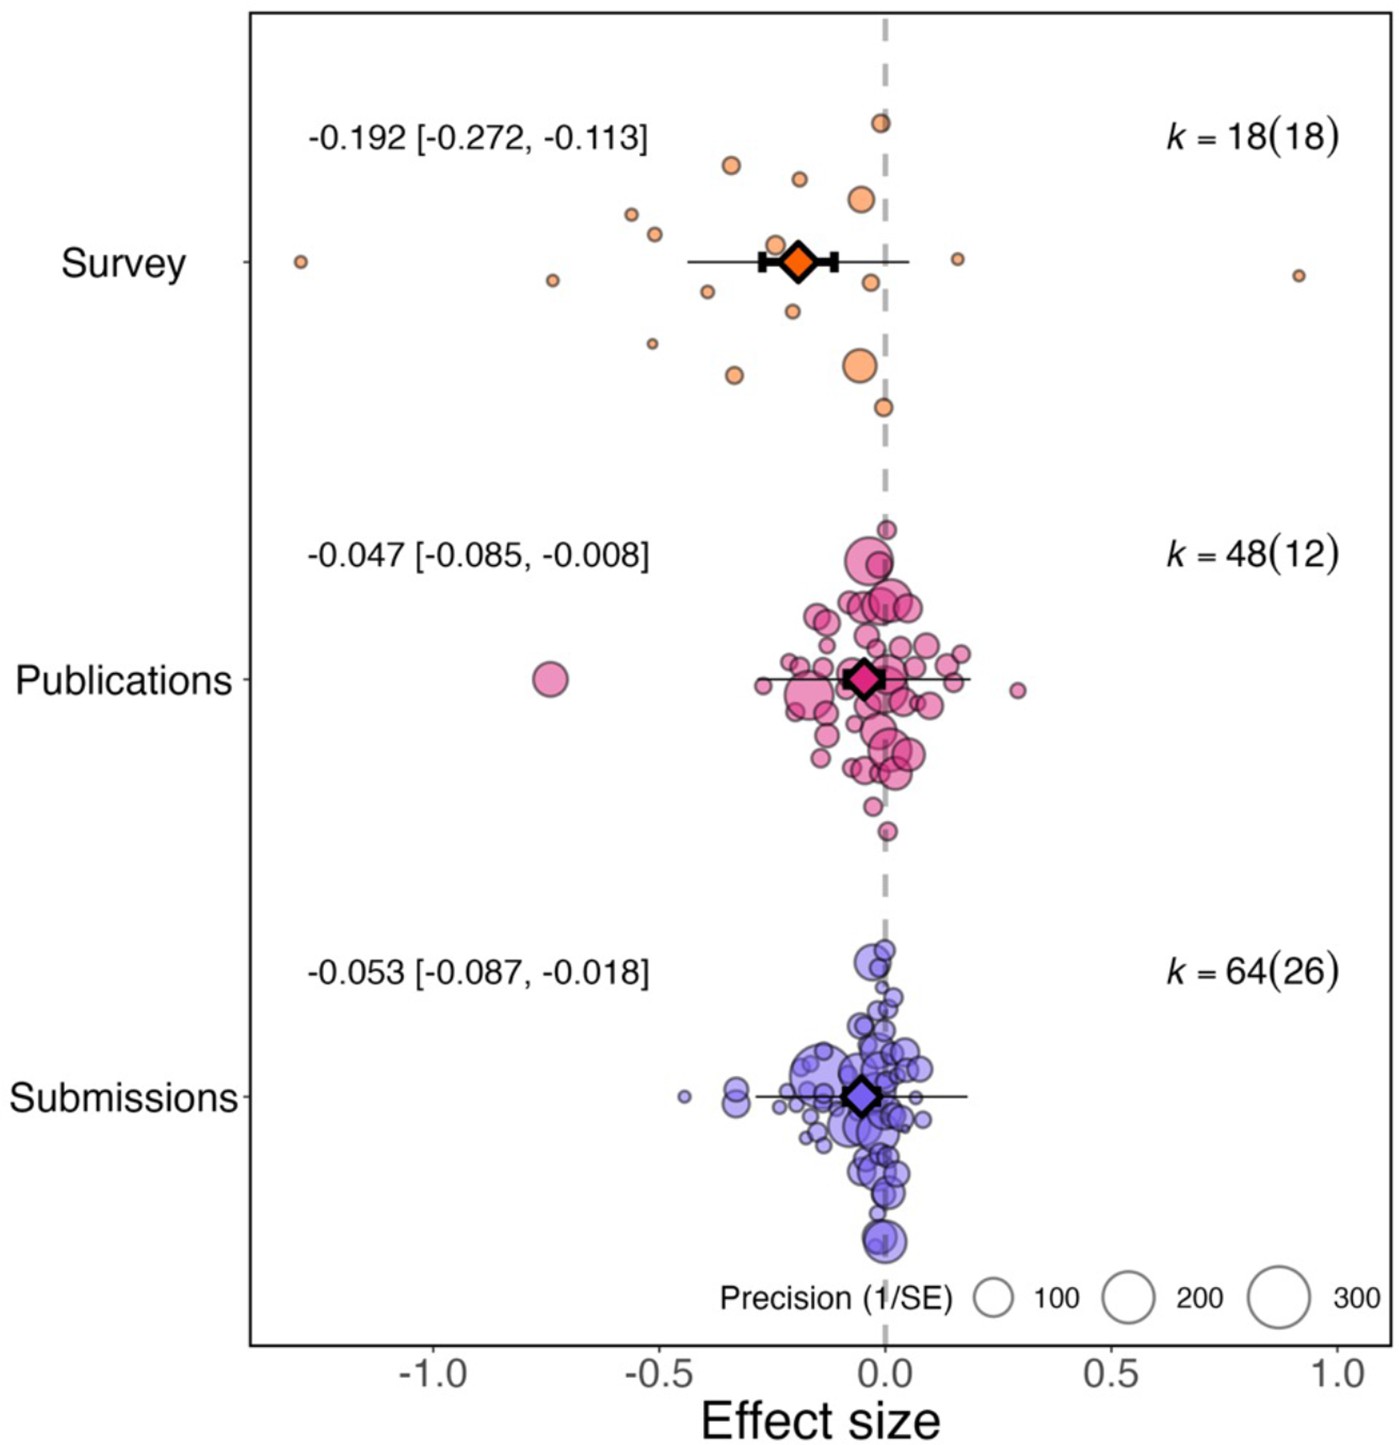
Effect of the pandemic on the gender gap in research productivity for three different measures of productivity.
Orchard plots comparing the distribution of effect sizes (points) and the precision with which they were measured (point size) when the measure of research productivity is based on responses to surveys (top), number of publications (middle), and number of submissions (bottom). Each plot shows the mean effect size (darker coloured point outlined in black and vertically centred), the 95% confidence interval (horizontal thick black bar), the 95% prediction interval of the expected spread of effect sizes based on between-study variance (horizontal thin black bar) and is centred at 0 (vertical dashed line). Within each category, points are spread vertically for presentation reasons to reduce overlap. For each subgroup, k is the total number of effect sizes, and the number of studies from which these effect sizes were calculated is given inside the brackets.
Has the pandemic affected women differently across research fields?
For effect sizes from article studies grouped by research field (N=107), we found little evidence of a significant differential impact of research fields on the reported effect sizes (QM (df = 5)=21.967, P=0.001; Figure 3). When considering research fields individually, social sciences showed the greatest increases in the academic productivity gender gap during the pandemic (–0.084, 95% CI=−0.143 to –0.024, SE = 0.030, P=0.006), followed by medicine (–0.066, 95% CI=−0.102 to –0.029, SE = 0.019, P<0.001).
Figure 3
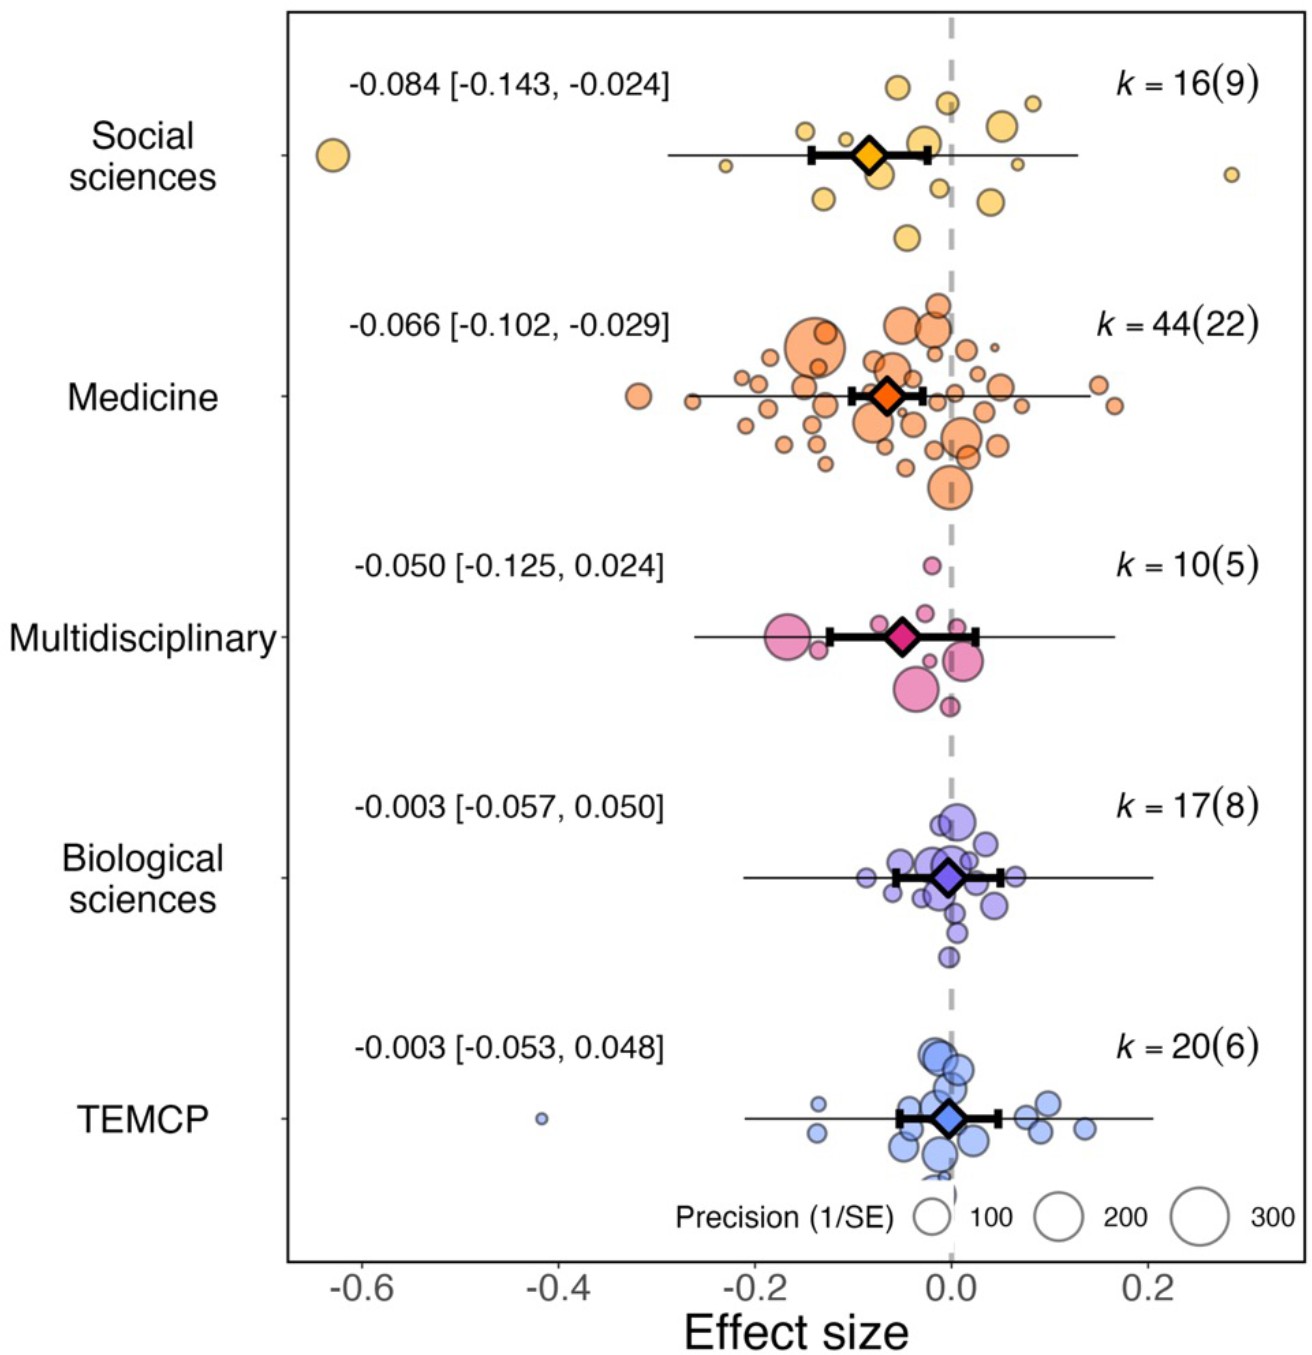
Overall effect of the pandemic on the gender gap in research productivity for five research fields.
Orchard plot comparing the distribution of effect sizes (points) and the precision with which they were measured (point sizes) for five research fields. Each plot shows the mean effect size (darker coloured point outlined in black and vertically centred), the 95% confidence interval (horizontal thick black bar), the 95% prediction interval of the expected spread of effect sizes based on between-study variance (horizontal thin black bar) and is centred at 0 (vertical dashed line). TEMCP: technology, engineering, mathematics, chemistry and physics. Within each category, points are spread vertically for presentation reasons to reduce overlap. For each subgroup, k is the total number of effect sizes, and the number of studies from which these effect sizes were calculated is given inside the brackets.
The pandemic showed little effect in multidisciplinary fields (–0.050, 95% CI=−0.125 to 0.024, SE = 0.038, P=0.188), biological sciences (–0.003, 95% CI=−0.057 to 0.050, SE = 0.027, P=0.902), or technology, engineering, mathematics, chemistry and physics (–0.003, 95% CI=−0.053 to 0.048, SE = 0.026, P=0.916).
Has the pandemic exacerbated existing differences in gender disparity?
For the article studies with available data (N=99), we recorded the number of female and male authors before the pandemic, as defined by the time-period sampled in the respective study and used this ratio as a proxy for the size of the previous gender disparity in that population sampled. Based on this subset of data, we found that the pandemic has increased the gender gap in article output more in journals/repositories/pre-print servers that were previously less gender-disparate (QM(df = 1)=10.285, P=0.001).
When grouping studies by research fields (Figure 4), those with a smaller gender gap prior to the pandemic experienced greater gender disparity in academic productivity during the pandemic compared with fields where the gender gap was already large to start with (Social sciences: 35.8% to 33.4%, medicine: 36.6% to 33.8%, multidisciplinary: 36.2% to 34.2%, biological sciences: 32.7% to 32.7%, Technology, Engineering, Mathematics, Chemistry and Physics: 23.0% to 22.1%).
Figure 4
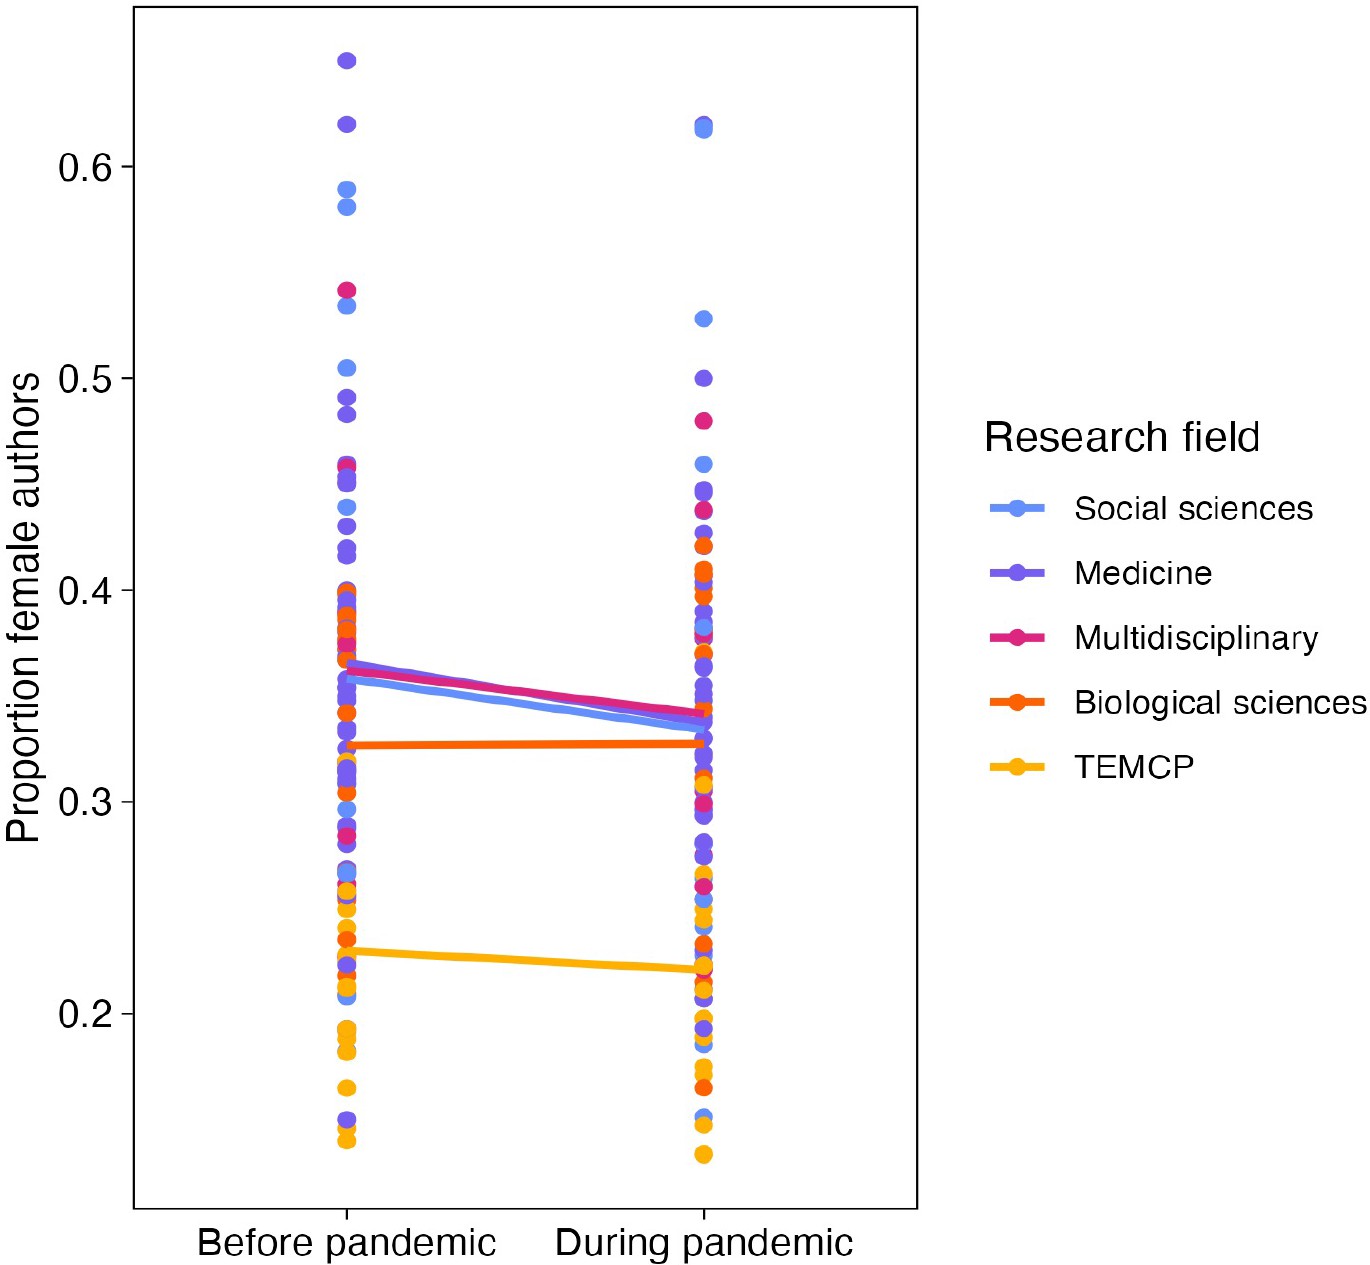
Effect of the pandemic on the gender gap in research productivity (as measured by number of articles submitted or published) for five research fields.
Each point shows the proportion of female authors before (left) or during (right) the pandemic. The solid lines connect the mean value for each research field before and during the pandemic. The largest decreases are observed for the three fields that had the highest proportions of female authors (social sciences, medicine and multidisciplinary). TEMCP reflects the technology, engineering, mathematics, chemistry and physics fields, and multidisciplinary includes studies that span fields.
Does the gender gap differ across authorship roles?
For article studies (N=107), we recorded whether first (N=54), middle (N=3), last (N=21), corresponding (N=15), or the total number of (N=14) authors were studied. Based on these data, we found no evidence of a significant differential impact of authorship position on effect sizes (QM(df = 5)=13.190, P=0.022; Figure 5).
Figure 5
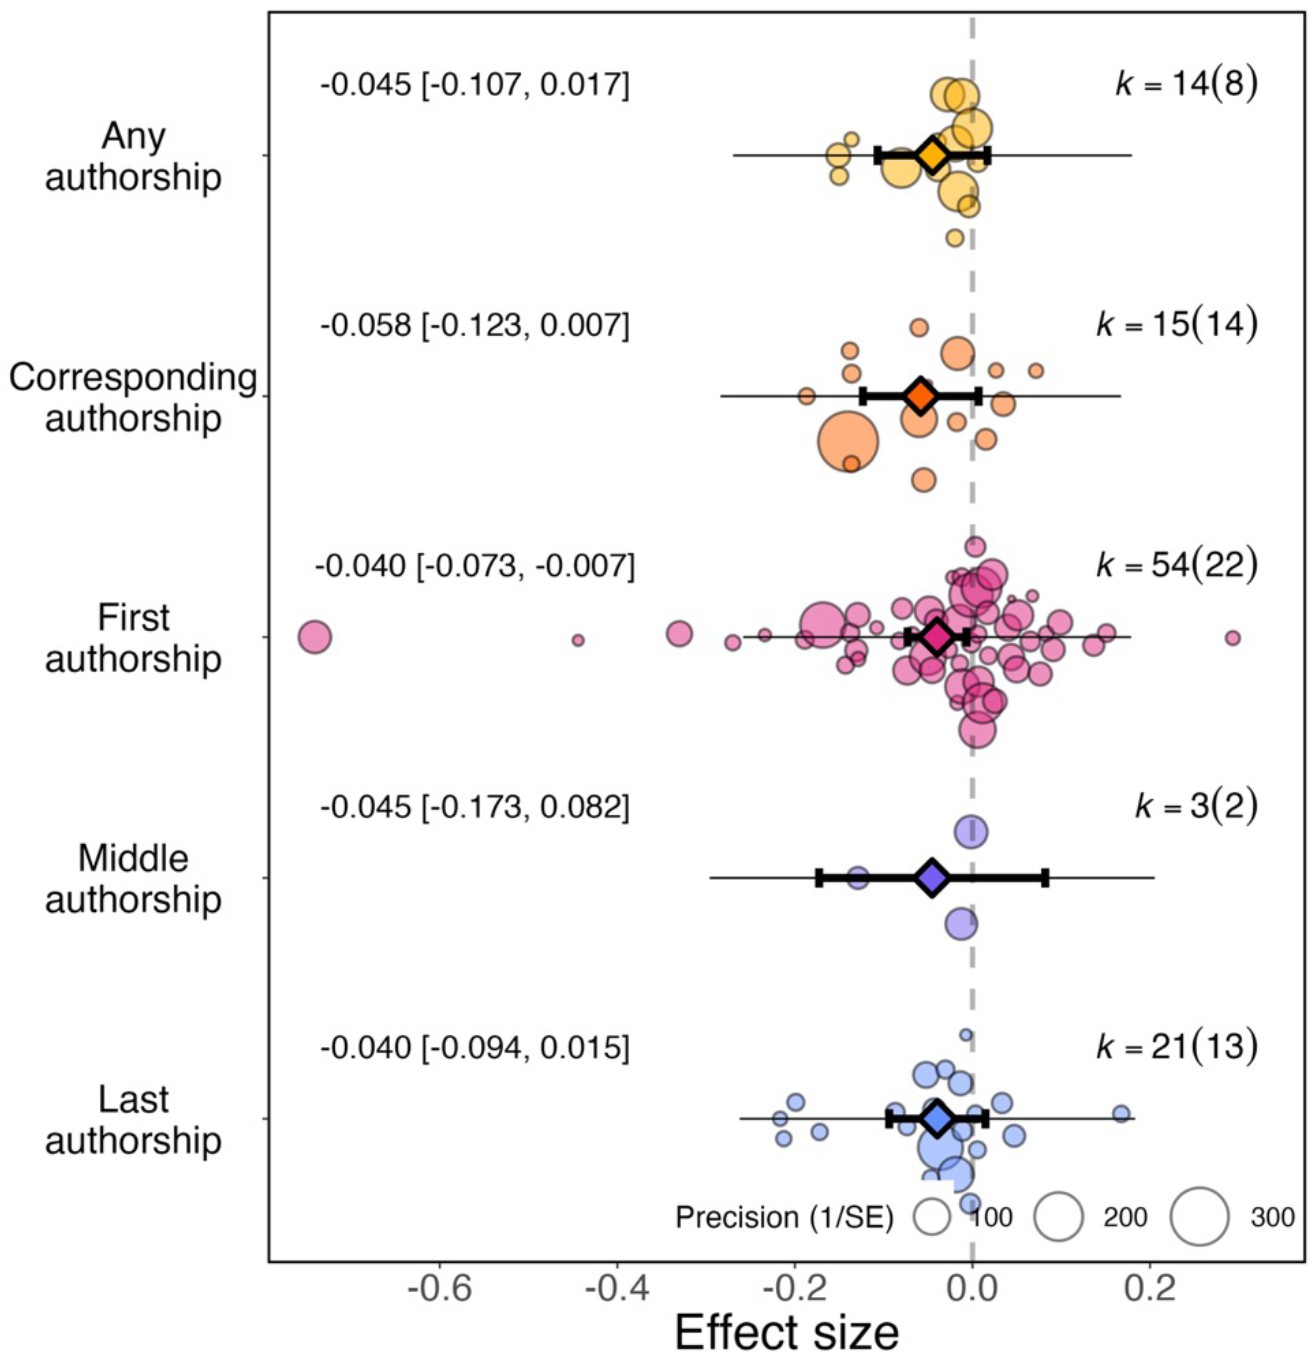
Effect of the pandemic on the gender gap in research productivity (as measured by number of articles submitted or published) for five authorship positions.
Orchard plots comparing the distribution of effect sizes (points) and the precision with which they were measured (point sizes), for various authorship positions. Each plot shows the mean effect size (darker coloured points outlined in black and vertically centred), the 95% confidence interval (horizontal thick black bar), the 95% prediction interval of the expected spread of effect sizes based on between-study variance (horizontal thin black bar) and is centred at 0 (vertical dashed line). Within each category, points are spread vertically for presentation reasons to reduce overlap. For each subgroup, k is the total number of effect sizes, and the number of studies from which these effect sizes were calculated is given inside the brackets.
The pandemic had a significant effect on first authorship roles (–0.040, 95% CI=−0.073 to –0.007, SE = 0.017, P=0.019) but not for all authorship roles (–0.045, 95% CI=−0.107 to 0.017, SE = 0.320, P=0.154), corresponding authorship roles (–0.058, 95% CI=−0.123 to 0.007, SE = 0.033, P=0.080), middle authorship roles (–0.045, 95% CI=−0.173 to 0.820, SE = 0.065, P=0.485) or last authorship roles (–0.040, 95% CI=−0.094 to 0.015, SE = 0.028, P=0.152).
Is there evidence of publication bias?
The multilevel meta-regression, including article studies and survey studies as a moderator because of their differences in sample size, showed no evidence of publication bias (article studies: slope = –0.025, 95% CI=−0.059 to −0.009, SE = 0.017, P=0.148; survey studies: slope = –0.157, 95% CI=−0.244 to −0.071, SE = 0.044, P<0.001). This model correlates standard error with effect size and a negative slope suggests small studies do not have large effect sizes, with the negative slope among survey studies indicating the large heterogeneity that exists among these kinds of studies (see Discussion).
A visual inspection of the funnel plots similarly did not indicate any suggestion of publication bias (Figure 6).
Figure 6 with 1 supplement see all
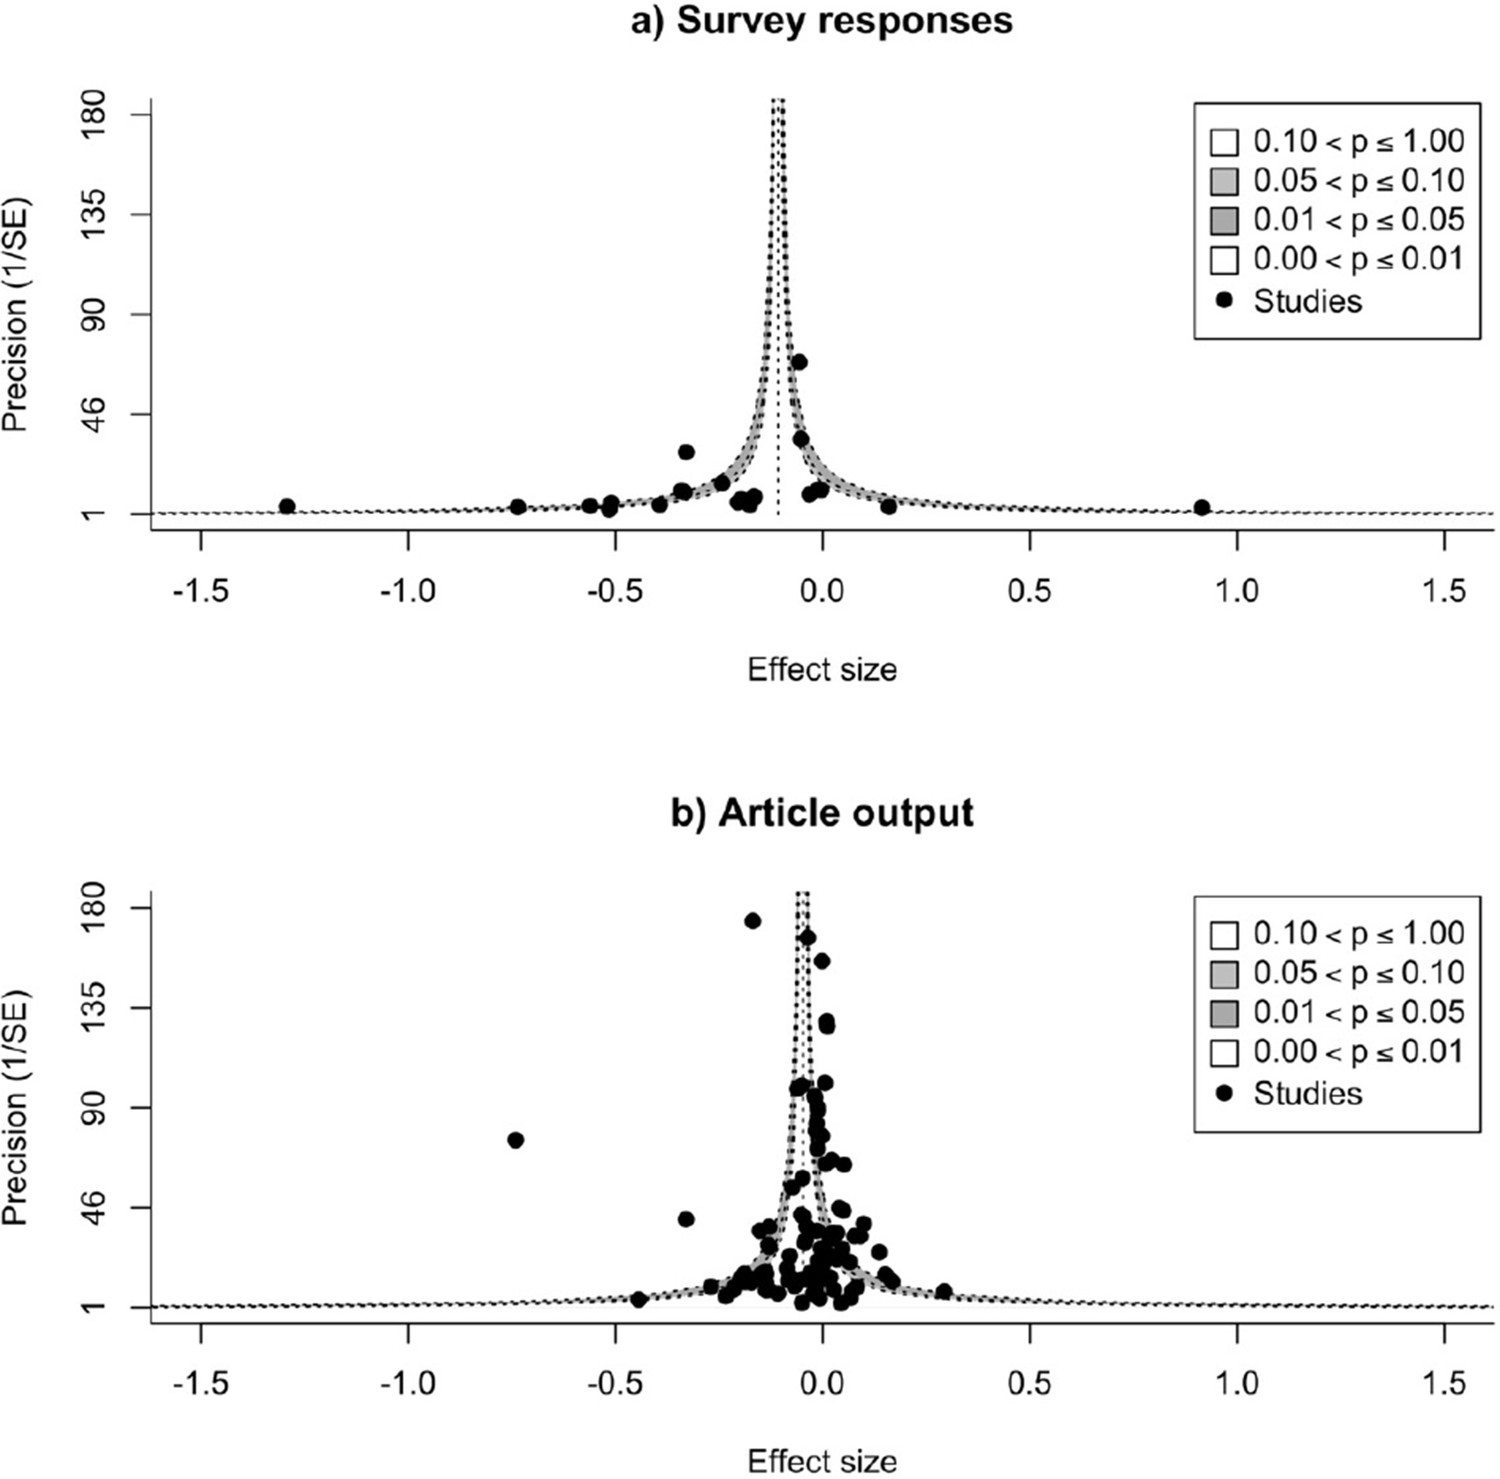
Checking for possible publication bias.
Funnel plots of effect sizes and their precision, as a function of standard error, for studies that measure research productivity by responses to a survey (A), and by number of articles published (B). The vertical dashed line is the summary effect size; the legend outlines levels of statistical significance for effect sizes based on their precision. Neither plot shows evidence for publication bias.
Are our results robust?
Our results changed little when we conducted a sensitivity analysis that excluded seven effect sizes using four measures of productivity from survey studies that are less directly comparable: research time (N=4), job loss (N=1), burnout (N=1) and the number of projects (N=1). When excluding these effect sizes, the overall estimate was –0.063 (95% CI=−0.0892 to −0.0372, SE = 0.0133, P<0.001), and the estimate for survey studies only was –0.239 (95% CI=−0.3419 to −0.1352, SE = 0.0527, P<0.001).
Overly large effect sizes did not change the results in a leave-one-out analysis, which repeatedly fitted the overall model as in prediction 1 a, but for survey studies only, leaving out one effect size at a time to see the effect on the overall estimate for surveystudies (Figure 6—figure supplement 1). Leaving out the most influential effect size, the overall estimate was –0.183 (95% CI=−0.270 to −0.096, SE = 0.045, P<0.001).
Discussion
Our study finds quantitative evidence, based on 55 studies and 130 effect sizes, to support the hypothesis that the COVID-19 pandemic has exacerbated gender gaps in academic productivity. These findings are consistent with the notion that novel social conditions induced by the pandemic have disadvantaged women in academia even more than before. Overall, the studies summarised in our meta-analysis suggest that gender gaps in research productivity within academia increased on average by 7% relative to the gender gaps that existed before the pandemic. We found no evidence of a publication bias in the studies investigating changes in the gender gap.
There is high heterogeneity in the effect sizes reported from different studies, arising from the type of research productivity measured. When measuring research productivity as the number of published or submitted articles, we find a slightly smaller increase in the gap of around 5%. This corresponds to the proportion of authors on submitted or published articles who are women declining from an average of 33.2% pre-pandemic to 31.4% during the pandemic (–0.05 * 33.2%=–1.7%). Such a change might reflect lower submission and acceptance rates of articles by women compared to their male colleagues or an increased drop-out of woman from academia caused by the pandemic. When measured by surveys, productivity reduction was 19% higher than in men. Future studies might therefore detect different effects of the pandemic on gender disparity in productivity, depending on the outcomes they assess and the timeframe over which these changes are analysed. As our data and analytical codes are open, and the literature on pandemic effects is increasing, we hope our work can form a first step in a living systematic review on the topic.
Our study likely underestimates the pandemic effect on article productivity in women because writing and publishing can take a long time (Powell, 2016). Many of the articles submitted or published during the pandemic were likely started and at least partially completed prior to the pandemic, given that most research grants span multiple years. Most of the studies in our sample obtained their data relatively soon after when the WHO officially declared a pandemic (median of 7 months after January 2020). With restricted access to laboratories, field sites and collaborators, many new projects have been delayed (Corbera et al., 2020). It is likely that the article studies we could include in our study underestimates the long-term effects of the pandemic, which might span over many years. However, the exact time dynamics are difficult to predict as adjustments and changes in conditions might lead to a normalising in production patterns over time (Clark, 2023). In support of this view, we find some indication for a larger, real-time effect from the effect sizes based on survey responses, which indicate a much stronger negative effect of the pandemic on women’s productivity compared to men’s (effect size = –0.192). This signals that women are nearly one fifth more likely than men to indicate that the pandemic has negatively affected their academic activities, which may stem from a combination of women on average feeling a larger strain, and a larger proportion of women being severely affected by the pandemic. In the literature used within our meta-analysis, five of six survey studies report evidence of a negative interaction effect of being both female and a parent on research productivity during the pandemic, presumably because of increased caregiving demands.
Our analysis suggests the pandemic may have differentially impacted female researchers across research fields, with increases in gender gaps particularly visible in research fields that were nearest to being gender-equal before the pandemic. Social sciences and medicine were two fields closest to gender equality that experienced the most significant decrease in female authors. Female researchers working in fields with previously gender-equitable environments may have experienced new, difficult research conditions induced by the pandemic, whereas in gender-biased fields, these difficulties might already have been present. Alternatively, social sciences and medicine are fields that could have had the greatest surge in COVID-19 and pandemic-related research. Women in social sciences and medicine potentially had less opportunities to pursue this new pandemic-related research because of extra work performed in gender roles, or because women already had relatively smaller collaborative networks, fewer senior positions, and less funding. Additionally, many medical journals sped up the publication process (Horbach, 2020), so the real-time effect of the pandemic on research productivity in women versus men may be reflected more in papers submitted and published in medicine than in other fields.
We found that the pandemic increased the gender gap particularly among first authors, potentially suggesting that women were particularly more restricted in the time they had available to write papers. However, we cannot exclude that other authorship positions underwent a similar increase in the gender gap because the samples were uneven, with half of effect sizes focussed on first authorship roles. Additionally, not all fields have the same authorship order norms making comparisons difficult.
It seems unlikely that this change in the gender gap during the pandemic simply represents a normal temporal fluctuation. The survey results, which report the strongest effects, specifically focused on the influence of the pandemic above and beyond the pressures researchers might already normally experience. The 5% decline in the proportion of authors who are women also likely indicates the extraordinary circumstances of the pandemic. This decline is steep relative to a study comparing the change in the proportion of female authors between 1945 and 2005 that showed a steady increase from 14% of all authors being women to 35%, with no apparent year-on-year decline since at least 1990 (Huang et al., 2020). Other studies that explore mechanisms affecting gender equality during the pandemic may offer insight into the trend of reduced relative research productivity of women to men that we find in this study. These mechanisms are likely to be a combination of gender inequalities that affect all women during the pandemic such as changes in carer roles and financial stability (Collins et al., 2021; Fisher and Ryan, 2021; Flor et al., 2022), and those specifically affecting women working in academia such as changes in the potential to start new projects (Malisch et al., 2020; Herman et al., 2021; Pereira, 2021) and changes in research topics and publication processes to cover new topics (Viglione, 2020; Clark, 2023).
Our study has several limitations, which are fully outlined in the Limitations section of the methods and summarised here. Causes of the increased gender disparity in research productivity during the pandemic are not identified. Gender is investigated only as a binary variable, mostly using first-name prediction tools, with no investigation into non-binary or transgender. Geographic regions are not investigated, limiting generalisability as our samples are not equally representative of all geographic regions. All studies are to some extent unique by combined differences in sampling method and analyses performed. Survey studies may unintentionally sample respondents with extreme opinions and can suffer from recall limitations and self-serving bias. This diversity in approaches does however offer future studies the potential to investigate which specific mechanisms might have interacted to shape the overall increase in the gender gap we observe.
Conclusion
Overall, our study highlights exacerbated gender gaps in academic research productivity during the COVID-19 pandemic. Despite the heterogeneity in our sample with regards to different outcome measures reflecting research productivity and different approaches to estimate effects, we overall find that most studies performed to date indicate that the gender gap in research productivity has increased during the pandemic. This finding suggests that the COVID-19 pandemic has likely influenced many of the processes that contribute to differences in the achieved research productivity of women compared to men. This gender gap was exacerbated more in social sciences and medicine, which are fields that were previously less gender-disparate and may represent regression in progress made towards gender equality.
Our study cannot speak to the potential mechanisms that might have led to changes in gender inequality during the pandemic and is therefore limited in deriving suggestions for potential interventions to potentially ameliorate unfair differential productivity besides indicating that such inequalities appear pervasive. Academic institutions should acknowledge and carefully accommodate the pandemic period when using research productivity to evaluate female academics for career progression in the coming years. For example, tenure-clock extensions designed to accommodate pandemic disruption may inadvertently exacerbate the gender gap by extending the period that advantaged individuals can outperform. More emphasis must be placed evaluating academic merit using more holistic measures and on an individual basis. We recommend future studies to investigate potential mechanisms of the increased gender gap in academic productivity, to continue monitoring the gendered disparity of academic productivity, and to investigate any long-term implications that can arise from reduced productivity of women.
Methods
Search process
We carried out a systematic review to identify, select and critically evaluate relevant research through data collection and analysis. We reported it following PRISMA guidelines (Moher et al., 2009). We carried out the literature search process in three steps: (1) a scoping search, (2) an initial search with pre-selected author terms, and (3) a refined search using terms as recommended by the litsearchR 1.0.0 (Grames et al., 2019). All searches were filtered for texts from 2020 onwards. We initially performed a scoping search to determine if there were over ten texts with primary research investigating differences by gender in academic productivity before and during the pandemic. The scoping search was conducted on 30/06/2021 by Google searching combinations of synonyms for: (1) the COVID-19 pandemic, (2) gender, (3) academia, (4) inequality and (5) productivity. The scoping search identified 21 original research publications with quantitative metrics investigating differences in academic productivity by gender before and during the pandemic (Supplementary file 1, “Scoping search” sheet). Of these 21 studies (scoped texts), 14 were indexed by Web of Science, and 17 (including the same 14 from Web of Science) were indexed by Scopus.
Terms for the initial search were selected by scanning the title, abstract and keywords of scoped texts. We constructed an initial Boolean search string according to the PICO (Population, Intervention, Comparator, Outcome) framework (Livoreil et al., 2017). Population was represented by “academia”, Intervention by “pandemic”, Comparator by “gender” and Outcome by “inequality” and “productivity” (see Table S1 in Supplementary file 2). A sixth concept group contained terms used to exclude irrelevant studies that did not investigate studies in hypothesis one. Terms within concept groups were connected by the Boolean OR operator, and the concept groups were connected by the AND or AND NOT operators, enabling searches for any combination that includes one term from each of the six concept groups. Terms in the initial search were selected by scanning the title, abstract and keywords of scoped texts. The initial search in Scopus generated 722 texts, including 13/17 (76.5%) of scoped texts indexed by Scopus.
To improve the 13/722 (1.8%) efficiency of finding scoped texts from our initial search, we imported all 722 texts into R and used litsearchR. Using litsearchR, potential key terms were extracted from the title, abstract and keywords of texts using the Rapid Automatic Keyword Extraction algorithm. A ranked list of important terms was then created from building a key term co-occurrence network (see Table S2 in Supplementary file 2). Six high-strength terms within the key term co-occurrence matrix, describing research not relevant to our study, such as those of an epidemiological or experimental nature, were added to the AND NOT operator concept group to exclude texts mentioning these terms. Table 1 describes terms of the refined Boolean search string and their respective concept groups. We performed the refined search on 27/07/2021 and generated 700 total texts combined from Scopus (126 texts, including 13/17 studies found in the scoping search), the Web of Science core collection (199 texts), EBSCO (276 texts and Proquest (99 texts)) from 2020 onwards. The final search hit rate had an efficiency of 10.3% (13/126) on Scopus. After removing duplicates, 580 texts remained to enter the study screening stage. We did not perform the search in any grey literature databases.
Table 1
Final Boolean search string used in full literature search for texts since 2020.
Terms in italics were added using litsearchR.
| Concept group | PICO group | Terms |
|---|---|---|
| Academia | Population | (academi* OR author* OR database* OR journal* OR research OR scien*) |
| Gender | Population | AND (female* OR gender OR male* OR men OR women) |
| Pandemic | Intervention | AND (coronavirus OR covid OR pandemic) |
| Inequality | Comparator | AND (bias* OR disparit* OR disproportion* OR fewer OR gap OR "gender difference*" OR imbalance* OR inequalit* OR inequit* OR parity OR "sex difference*" OR skew* OR unequal) |
| Productivity | Outcome | AND (performan* OR publication* OR publish* OR productiv*) |
| Exclusion of biomedical studies | Population | AND NOT (experiment OR laboratory OR mortality OR surviv* OR "acute respiratory" OR gis OR icu OR risk OR rna OR symptoms) |
Study screening
To be included in our meta-analysis, studies had to quantitatively investigate gender differences in productivity within academia before and during the pandemic. In our initial screen of titles, abstracts and keywords of studies we kept only those suggesting the study investigated: (1) academia, (2) gender, (3) the COVID-19 pandemic and (4) some measure of productivity (see Table S3 in Supplementary file 2). We included any text returned by the database, of any publication status, including grey literature in any language, though all texts had abstracts with an English version. To ensure repeatability of the screening process, we used Rayyan.ai (Ouzzani et al., 2016) to blind the inclusion or exclusion of 420 randomly selected studies by two reviewers (KGLL and DL). The agreement rate between reviewers was 97%, with 49 studies that both authors agreed to include, 357 studies which both excluded, ten studies one reviewer included but the other excluded, and four studies only included by the other reviewer. This agreement rate resulted in a, “strong” (McHugh, 2012) to “near perfect” (Landis and Koch, 1977) Cohen’s kappa of 0.86. Of the 14 studies which were included by one but excluded the other, three were included after joint review. To reduce workload, we did not double-initial-screen 160 remaining texts because of 97% agreement rates achieved during the sample of double-screened texts. Overall, out of the 580 texts, 70 were retained for the full text screening (Supplementary file 3).
Full texts were then screened to identify articles that had included four qualifiers: (1) both genders, (2) some quantifiable metric of academic productivity measured, and (3) compared a time period before the pandemic with a time period during the pandemic (time periods chosen according to the authors’ discretion), (4) primary data. Full-text screening was conducted by recording which, if any of the four qualifiers were missing for each text in an excel spreadsheet and only performed by KGLL. Studies were not assigned quality weightings as there is no common standard to do this. Thus, 25 studies that all contained necessary metrics to calculate effect sizes were retained for data extraction, excluding 45 studies (Supplementary file 3).
Iterating the search
To find studies that had been published since the 27/07/21 search (Table 1), we iterated the search and screen process. The second search was repeated on 28/02/2022, generating 1646 total texts combined from Scopus (258 texts, including 14/17 studies found in the scoping search), the Web of Science core collection (413 texts), EBSCO (542 texts) and Proquest (433 texts) from 2020 onwards. We removed 438 duplicates using Rayyan.ai, leaving 1208 de-duplicated studies. To ensure our methods are repeatable, we checked and found all 580 de-duplicated studies from the previous search were also found again. Out of the 1208 texts from the final search, we included 170 after screening titles, abstracts and keywords. For these 169, we screened the full texts, excluding 120 studies (53 studies missed one qualifier, 38 studies missed two qualifiers, 27 studies miss three qualifiers, 1 study missed four qualifiers) and keeping 50 (including the 25 identified in the original search) that all contained the necessary information to calculate the effect sizes (Supplementary file 3). Two studies with full texts in Spanish were translated to English by Google translate, of which one was included. Five studies found in the scoping search but not returned in database searches were also included, resulting in 55 total studies used to extract variables for analysis. The full PRISMA flow diagram outlining the number of texts included at each stage in first and iterated search is found in Figure S1 in Supplementary file 2.
Our sample
Our sample consists of 130 effect sizes obtained from 55 studies including surveys of potentially affected people (Myers et al., 2020; Rodríguez-Rivero et al., 2020; Barber et al., 2021; Breuning et al., 2021; Camerlink et al., 2021; Candido, 2021; Deryugina et al., 2021; Ovalle Diaz et al., 2021; Ellinas et al., 2022; Gao et al., 2021; Ghaffarizadeh et al., 2021; Guintivano et al., 2021; Hoggarth et al., 2021; Krukowski et al., 2021; Maguire et al., 2021; Plaunova et al., 2021; Shalaby et al., 2021; Staniscuaski et al., 2021; Yildirim and Eslen-Ziya, 2021; Davis et al., 2022; Stenson et al., 2022), and comparisons of numbers of articles submitted or published by gender before and during the pandemic (Amano-Patiño, 2020; Andersen et al., 2020; Bell and Green, 2020; Cushman, 2020; Inno et al., 2020; Kibbe, 2020; Vincent-Lamarre et al., 2020; Wehner et al., 2020; Bell and Fong, 2021; Biondi et al., 2021; Cook et al., 2021; DeFilippis et al., 2021; Forti et al., 2021; Fox and Meyer, 2021; Gayet-Ageron et al., 2021; Gerding et al., 2021; Ipe et al., 2021; Jemielniak et al., 2021; Jordan and Carlezon, 2021; King and Frederickson, 2021; Lerchenmüller et al., 2021; Mogensen et al., 2021; Muric et al., 2021; Nguyen et al., 2021; Quak et al., 2021; Ribarovska et al., 2021; Squazzoni et al., 2021; Williams et al., 2021; Anabaraonye et al., 2022; Ayyala and Trout, 2022; Chen and Seto, 2022; Cui et al., 2022; Harris et al., 2022; Wooden and Hanson, 2022).
Extracting variables
Effect size
We extracted values needed to calculate 130 effect sizes from 55 articles investigating the effect of the pandemic on academic research productivity of both genders, comparing the productivity before and during the pandemic, using time periods chosen according to authors’ discretion. We calculated our own effect sizes wherever possible using the available summary statistics and/or statistical inferences. For 10 effect sizes which did not have data available to calculate our own effect sizes, we used already calculated percentage changes in the gender gap in academic productivity as predicted from lasso regression (N=2), Somers’ delta (N=2), ordered logistic regression (N=1) and mixed-effect models (N=5). For 120 effect sizes, we entered summary data (N=117) or simple statistical tests (N=3) into Campbell collaboration’s effect size calculator (Wilson, 2019) to calculate a standardised mean difference (d) effect size. For effect sizes calculated using summary data, 99 relied on the proportion of raw numbers of female and male authors before and after the pandemic, and 18 on the mean changes and standard deviations or standard errors in research productivity changes during the pandemic for female and male researchers. For effect sizes calculated from reported simple statistical tests, one converted the f-test statistic and sample size from a general linear model investigating the effect of gender on perceived work production, one converted the chi-square comparing proportions of female and male academics that experienced productivity changes due to the pandemic, and one converted the p-values from a t-test comparing mean changes in research time due to the pandemic. 10 effect sizes were calculated by obtaining raw numbers from graphs, estimated using Adobe Acrobat’s measure tool (Supplementary file 1, “Calculations” sheet). Two effect sizes (Jemielniak et al., 2021; Stenson et al., 2022) were calculated using sample sizes obtained by personal correspondence with the article authors. Six studies investigated numbers of articles at different time points during the course of the pandemic. From these studies, we calculated 30 effect sizes using numbers of articles across the entire pandemic period. We calculated multiple effect sizes from one study if they were referring to different research fields or authorship positions. We set the sign for effect sizes as negative if the pandemic had reduced relative research productivity of women (increased gender gap) and positive if the pandemic had increased the relative research productivity of women (reduced gender gap). A subset of 59 effect sizes were double-checked by A.C., A.M. and D.L and inconsistencies were discussed to ensure repeatability. K.L. then extracted the remaining 71 effect sizes.
Variance
Of 10 effect sizes already calculated in the original studies, 7 provided variance as the standard error, which we squared to obtain the variance; and 3 provided the variance as 95% confidence intervals, which we divided by 1.96 and then squared (Nakagawa et al., 2022). For the other 120 effect sizes, variance was estimated in the Campbell collaboration calculator (Wilson, 2019) when calculating effect sizes.
Research productivity measure
We first recorded whether the change in research productivity was measured from survey responses (survey studies, N=23 effect sizes) or from the number of articles submitted or published (article studies, N=107 effect sizes). Survey studies measured change in research productivity during the pandemic for each gender based on academics self-reporting their gender and change in general productivity (N=11 effect sizes), number of submissions (N=5 effect sizes), research time (N=4 effect sizes), number of projects (N=1 effect sizes), burn-out (N=1 effect sizes), or job loss (N=1 effect sizes). As 5 survey studies measured research productivity in the number of submissions, we included these studies in the articles submitted and published category. This resulted in 18 effect sizes from surveys measuring some aspect of research productivity, 64 effect sizes measuring numbers of article submissions, and 48 effect sizes measuring numbers of publications.
Research field
For the article studies (N=107 effect sizes), we recorded the research field sampled based on the description in the original studies as either Medicine (N=44 effect sizes), Technology, Engineering, Mathematics, Chemistry and Physics (N=20 effect sizes), Social sciences (N=16 effect sizes), Biological sciences (N=17 effect sizes), or Multidisciplinary (N=10 effect sizes), following the classification scheme of Astegiano et al., 2019.
Previous gender disparity
For the article studies with available data (N=99 effect sizes), we recorded the number of female and male authors before the pandemic, as defined by the time-period sampled in the respective study and use this ratio as a proxy for size of the previous gender disparity in that population sampled.
Authorship position
For the article studies (N=107 effect sizes), we recorded whether first (N=54 effect sizes), middle (N=3 effect sizes), last (N=21 effect sizes), corresponding (N=15 effect sizes), or any (N=14 effect sizes) authorship positions were studied. We classified one effect size studying submitting authors, as studying corresponding authors (Fox et al., 2016) and two effect sizes studying sole authors as studying last authors (Moore and Griffin, 2006).
We also extracted data for the following variables to enable description of the datasets: timeframe before the pandemic; timeframe during the pandemic; geographic region; data availability for gender and geographic region interaction effect; data availability for gender and career stage/age interaction effect; data availability for gender and parent status interaction effect; gender assignment accuracy threshold for article studies and gender inference method used. Please see Supplementary file 1, “Variables” sheet, for descriptions of all the variables.
Analyses
We conducted all analyses in R 3.6.2 (R Development Core Team, 2022). We used the ‘metafor’ package 3.0.2 to fit models, and build funnel and forest plots (Viechtbauer, 2010). We used ‘orchaRd’ 0.0.0.9000 to build orchard plots to visualise distribution of effect sizes (points) and their precision (point size), calculated as a function of standard error (Nakagawa et al., 2021).
We fitted separate models for each prediction. All models included the identity of the article the effect size was extracted from as a random effect to control for dependency in effect sizes obtained from the same study. Models that include moderators use an omnibus test of parameters reported as a QM metric, which tests the null hypothesis that all moderator effect sizes are equal and is significant when at least two moderators are different. We tested prediction 1 a in a model investigating the overall effect size and we displayed this as an orchard plot. We then tested prediction 1b in a model investigating the method of measuring research productivity (survey responses, number of submissions and number of publications) as a moderator of effect size and displayed this as an orchard plot. We included the outlier (Jemielniak et al., 2021) in the funnel plot of article studies because this effect size was obtained by personal correspondence clarifying the sample sizes used in the study, which we assume was verified. We tested prediction 2 a in a model investigating research field as a moderator of effect size for article studies in a model and displayed this as an orchard plot. We tested prediction 2b in a model investigating how previous gender disparity in research productivity before the pandemic, as measured by the proportion of female authors, influenced effect size and displayed this as a line graph, grouped by research field. To test prediction 3 a, we tested in a model authorship position as a moderator on effect size for publication studies. We tested for publication bias by performing a multilevel regression model (Nakagawa et al., 2022) which investigates whether small studies have large effect sizes, including research productivity measure as a moderator because of differences in sample size between article studies and survey studies. We display this relationship in funnel plots. We tested for total heterogeneity (I2) using the ‘i2_ml’ function in ‘orchaRd’. We applied a sensitivity analysis testing prediction 1 a (overall pandemic effect on gender gap) and prediction 1b (method of research productivity effect on pandemic gender gap) excluding seven effect sizes using four measures of productivity from survey-based studies that are less directly comparable: research time (N=4), job-loss (N=1), burnout (N=1) and the number of projects (N=1). We also performed a leave-one-out analysis using the ‘leave1out’ function in ‘metafor’. This performed a meta-analysis on survey studies, leaving out exactly one study at a time to see the effect of individual studies on the overall estimate for survey studies. A full PRISMA checklist is found in Table S4 in Supplementary file 2.
Limitations
Our focus is on comparing the effect of the pandemic on women relative to men. We recognize that gender extends beyond this comparison, and that biases are even more likely to target individuals whose identities are less represented and often ignored. These biases also reflect in a lack of studies of the full diversity of gender. While several of the surveys we include had the option for respondents to identify beyond the binary women/men, none of these studies report on these individuals, presumably because of the respective small samples. In addition, studies using numbers of submissions or publications (38 out of 55) to measure research productivity used automatic approaches that are more likely to mis-gender individuals as they inferred binary gender based on first names. While these approaches seemingly offer the potential to identify trends in larger samples, they themselves introduce and reinforce biases in relation to gender that are hard to assess, intersecting with biases in ethnicity as these approaches are often restricted to names common in English speaking countries (Mihaljević et al., 2019). For survey studies, only 18 effect sizes were used. These had a large heterogeneity in effect sizes, possibly reflecting subtle differences in the measure of research productivity asked in the survey. Surveys sample limited numbers of respondents, potentially biased towards sampling those holding extreme opinions of the pandemic. Subjectivity in survey responses could skew the estimate because of recall limitations and self-serving bias. We do not include grey literature databases in our searches, which may bias our samples to studies with positive effects. We did not perform forwards or backwards searches, meaning we may have missed some relevant studies. However, we expect the literature on the topic to grow, and hope that further work will build on our study and add these new effect sizes to our dataset. Most studies explored academic populations worldwide (N=99 effect sizes), or from Western (N=28 effect sizes) regions, but not the Global South (N=3 effect sizes) limiting investigation of interaction effects between geographic regions. Although 22/130 effect sizes from 8/55 studies held data subdivided between geographic regions, we did not extract separate effect sizes as they differed in the scale of geographic region sampled, which limited our ability to make geographic comparisons. Conclusions from survey studies are also limited to North American and Western European, since 18/23 studies are exclusive to or have the majority of respondents from these regions. We recognise there are differences between article- studies in the length of time considered as before the pandemic (mean = 11 months, standard deviation = 10 months, range = 1–50 months) and during the pandemic (mean = 7 months, standard deviation = 5 months, range = 1–17 months). Survey studies were fielded at different times, (mean = 21/08/2020, standard deviation = 99 days, range = 20/04/2020 – 28/02/21) which potentially affects participants’ beliefs of productivity changes. Investigating research field and authorship position effects is limited by the unequal and sometimes small sample sizes of variables that are compared. We used raw data to calculate effect sizes using the same modelling techniques wherever possible. This was not possible in 10 studies, where we consequently used effect size as provided in the study. We recognize that their different modelling techniques may have contributed to the estimated effect sizes. The patterns we describe should be seen as a potential indication that biases exist, but alternative approaches are needed to speculate about potential underlying causes and remedies.
Data availability
All data and materials to reproduce the meta-analysis can be found at Zenodo: https://doi.org/10.5281/zenodo.8116754.
References
-
It’s OK not to be OK: Shared reflections from two PhD parents in a time of pandemicGender, Work, and Organization 27:723–733.https://doi.org/10.1111/gwao.12465
-
Care in times of the pandemic: Rethinking meanings of work in the universityGender, Work & Organization 1:12871.https://doi.org/10.1111/gwao.12871
-
BookThe Unequal Effects of Covid-19 on Economists Research ProductivityUniversity of Cambridge Press.https://doi.org/10.17863/CAM.57979
-
Impact of the early COVID-19 pandemic on gender participation in academic publishing in radiation oncologyAdvances in Radiation Oncology 7:100845.https://doi.org/10.1016/j.adro.2021.100845
-
Academic labor and the global pandemic: Revisiting life-work balance under COVID-19Susan Bulkeley Butler Center for Leadership Excellence and Advance Working Paper Series 3:5–13.
-
Unravelling the gender productivity gap in science: a meta-analytical reviewRoyal Society Open Science 6:181566.https://doi.org/10.1098/rsos.181566
-
Gender differences in accepting and receiving requests for tasks with low promotabilityAmerican Economic Review 107:714–747.https://doi.org/10.1257/aer.20141734
-
What explains differences in finance research productivity during the pandemic?The Journal of Finance 76:1655–1697.https://doi.org/10.1111/jofi.13028
-
Gender differences in first and corresponding authorship in public health research submissions during the COVID-19 pandemicAmerican Journal of Public Health 111:159–163.https://doi.org/10.2105/AJPH.2020.305975
-
The never-ending shift: A feminist reflection on living and organizing academic lives during the coronavirus pandemicGender, Work, and Organization 27:677–682.https://doi.org/10.1111/gwao.12451
-
Impacts of the COVID-19 pandemic on animal behaviour and welfare researchersApplied Animal Behaviour Science 236:105255.https://doi.org/10.1016/j.applanim.2021.105255
-
Social sciences in the COVID-19 pandemic: Work rotuines and inequalitiesSociologia & Antropologia 11:31–65.https://doi.org/10.1590/2238-38752021v11esp2
-
Women, gender equality and COVID-19Gender in Management 35:647–655.https://doi.org/10.1108/GM-07-2020-0236
-
PreprintUS couples’ divisions of housework and childcare during COVID-19 pandemicOpen Science Framework.https://doi.org/10.31235/osf.io/jy8fn
-
Gender and authorship patterns in urban land scienceJournal of Land Use Science 17:245–261.https://doi.org/10.1080/1747423X.2021.2018515
-
ReportReflections on institutional equity for faculty in response to COVID-19Susan Bulkeley Butler Center for Leadership Excellence and ADVANCE Working Paper Series.
-
COVID-19 and the gender gap in work hoursGender, Work, and Organization 28:101–112.https://doi.org/10.1111/gwao.12506
-
Gender differences in authorship of obstetrics and gynecology publications during the coronavirus disease 2019 pandemicAmerican Journal of Obstetrics & Gynecology MFM 3:100268.https://doi.org/10.1016/j.ajogmf.2020.100268
-
Academia in the time of COVID-19: Towards an ethics of carePlanning Theory & Practice 21:191–199.https://doi.org/10.1080/14649357.2020.1757891
-
Gender inequality in research productivity during the COVID-19 pandemicManufacturing & Service Operations Management 24:707–726.https://doi.org/10.1287/msom.2021.0991
-
Gender gap in women authors is not worse during COVID-19 pandemic: Results from RPTHResearch and Practice in Thrombosis and Haemostasis 4:672–673.https://doi.org/10.1002/rth2.12399
-
Is there a gender gap in chemical sciences scholarly communication?Chemical Science 11:2277–2301.https://doi.org/10.1039/c9sc04090k
-
Gender differences in publication authorship during COVID‐19: A bibliometric analysis of high‐impact cardiology journalsJournal of the American Heart Association 10:e019005.https://doi.org/10.1161/JAHA.120.019005
-
COVID-19 disruptions disproportionately affect female academicsAEA Papers and Proceedings 111:164–168.https://doi.org/10.1257/pandp.20211017
-
Gender inequalities during COVID-19Group Processes & Intergroup Relations 24:237–245.https://doi.org/10.1177/1368430220984248
-
Trade-off between urgency and reduced editorial capacity affect publication speed in ecological and medical journals during 2020Humanities and Social Sciences Communications 8:1–9.https://doi.org/10.1057/s41599-021-00920-9
-
Potentially long-lasting effects of the pandemic on scientistsNature Communications 12:6188.https://doi.org/10.1038/s41467-021-26428-z
-
Scholarly productivity in clinical pharmacology amid pandemic-related workforce disruptions: Are men and women affected equally?Clinical Pharmacology and Therapeutics 110:841–844.https://doi.org/10.1002/cpt.2358
-
An automated approach to identifying search terms for systematic reviews using keyword co‐occurrence networksMethods in Ecology and Evolution 10:1645–1654.https://doi.org/10.1111/2041-210X.13268
-
Faculty service loads and gender: Are women taking care of the academic family?Research in Higher Education 58:672–694.https://doi.org/10.1007/s11162-017-9454-2
-
Psychiatric genomics research during the COVID-19 pandemic: A survey of Psychiatric Genomics Consortium researchersAmerican Journal of Medical Genetics. Part B, Neuropsychiatric Genetics 186:40–49.https://doi.org/10.1002/ajmg.b.32838
-
Academic motherhood during COVID‐19: Navigating our dual roles as educators and mothersGender, Work & Organization 27:887–899.https://doi.org/10.1111/gwao.12493
-
Exploratory investigation of gender differences in school psychology publishing before and during the initial phase of COVID-19Canadian Journal of School Psychology 37:204–211.https://doi.org/10.1177/08295735221074473
-
The impact of the pandemic on early career researchers: What we already know from the internationally published literatureEl Profesional de La Información 30:mar.08.https://doi.org/10.3145/epi.2021.mar.08
-
Pandemic publishing: Medical journals strongly speed up their publication process for COVID-19Quantitative Science Studies 1:1056–1067.https://doi.org/10.1162/qss_a_00076
-
COVID-19 lockdown effects on gender inequalityNature Astronomy 4:1114.https://doi.org/10.1038/s41550-020-01258-z
-
COVID-19 effect on the gender gap in academic publishingJournal of Information Science 1:016555152110681.https://doi.org/10.1177/01655515211068168
-
Threats to objectivity in peer review: The case of genderTrends in Pharmacological Sciences 35:371–373.https://doi.org/10.1016/j.tips.2014.06.005
-
Research interrupted: The impact of the COVID-19 pandemic on multiple sclerosis research in the field of rehabilitation and quality of lifeMultiple Sclerosis Journal - Experimental, Translational and Clinical 7:20552173211038030.https://doi.org/10.1177/20552173211038030
-
Interrater reliability: The kappa statisticBiochemia Medica 22:276–282.https://doi.org/10.11613/BM.2012.031
-
Reflections on gender analyses of bibliographic corporaFrontiers in Big Data 2:29.https://doi.org/10.3389/fdata.2019.00029
-
The impact of the COVID-19 pandemic on journal scholarly activity among female contributorsJournal of the American College of Radiology 18:1044–1047.https://doi.org/10.1016/j.jacr.2021.01.011
-
Gender disparity in the authorship of biomedical research publications during the COVID-19 pandemic: Retrospective observational studyJournal of Medical Internet Research 23:e25379.https://doi.org/10.2196/25379
-
Unequal effects of the COVID-19 pandemic on scientistsNature Human Behaviour 4:880–883.https://doi.org/10.1038/s41562-020-0921-y
-
The orchard plot: Cultivating a forest plot for use in ecology, evolution, and beyondResearch Synthesis Methods 12:4–12.https://doi.org/10.1002/jrsm.1424
-
Methods for testing publication bias in ecological and evolutionary meta‐analysesMethods in Ecology and Evolution 13:4–21.https://doi.org/10.1111/2041-210X.13724
-
Impact of COVID-19 on longitudinal ophthalmology authorship gender trendsGraefe’s Archive for Clinical and Experimental Ophthalmology 259:733–744.https://doi.org/10.1007/s00417-021-05085-4
-
Constrained choices: A view of campus service inequality from annual faculty reportsJournal of Higher Education 88:672–700.https://doi.org/10.1080/00221546.2016.1257312
-
Asked more often: Gender differences in faculty workload in research universities and the work interactions that shape themAmerican Educational Research Journal 54:1154–1186.https://doi.org/10.3102/0002831217716767
-
Rayyan: A web and mobile app for systematic reviewsSystematic Reviews 5:210.https://doi.org/10.1186/s13643-016-0384-4
-
A closer look at faculty service: What affects participation on committees?Journal of Higher Education 78:523–541.https://doi.org/10.1353/jhe.2007.0027
-
SoftwareR: A language and environment for statistical computingR Foundation for Statistical Computing, Vienna, Austria.
-
Gender inequality in publishing during the COVID-19 pandemicBrain, Behavior, and Immunity 91:1–3.https://doi.org/10.1016/j.bbi.2020.11.022
-
ReportDual-career academic couples: What universities need to knowMichelle R. Clayman Institute for Gender Research, Stanford University.
-
Impact of COVID-19 on access to laboratories and human participants: Exercise science faculty perspectivesAdvances in Physiology Education 46:211–218.https://doi.org/10.1152/advan.00146.2021
-
Conducting meta-analyses in R with the metafor packageJournal of Statistical Software 36:1–48.https://doi.org/10.18637/jss.v036.i03
-
Effects of the COVID-19 pandemic on authors and reviewers of American Geophysical Union journalsEarth and Space Science 9:e2021EA002050.https://doi.org/10.1029/2021EA002050
-
The differential impact of COVID-19 on the work conditions of women and men academics during the lockdownGender, Work, and Organization 28:243–249.https://doi.org/10.1111/gwao.12529
Decision letter
-
Peter RodgersSenior and Reviewing Editor; eLife, United Kingdom
In the interests of transparency, eLife publishes the most substantive revision requests and the accompanying author responses.
Decision letter after peer review:
Thank you for submitting your article "Meta-research: The effect of the COVID-19 pandemic on the gender gap in research productivity within academia" to eLife for consideration as a Feature Article. Your article has been reviewed by two peer reviewers, and the evaluation has been overseen by a member of the eLife Features Team (Peter Rodgers). The following individuals involved in review of your submission have agreed to reveal their identity: Emil Bargmann Madsen.
The reviewers and editors have discussed the reviews and we have drafted this decision letter to help you prepare a revised submission. The points that need to be addressed in a revised version are listed below. As you will see, there are quite a few points that need to be addressed.
Summary
This study provides fundamental evidence substantially advancing our understanding of the gender-specific impacts of the Covid-19 pandemic on academic research productivity. However, there are a number of concerns that need to be addressed.
Essential revisions
1) I am concerned about the use of the included studies for a formal meta-analysis. Firstly, it is clear from the authors well-structured description in the methods section that many studies are not measuring the same outcome.
Many studies use number of submitted or published articles, which may be a fairly comparable metric, but many of the survey studies use very different measures of productivity:
a. Research time (N = 4), job-loss (N = 1), burnout (N = 1), and number of projects (N = 1).
b. These are highly different outcomes, and should not be analysed as comparable.
2) Secondly, it is not clear how the studies differ in their use of the pandemic as an "intervention".
a. Some studies will ask respondents to compare their productivity before and after, while some studies will provide actual comparisons of productivity before and after. Both methods will have their share of drawbacks, but I do not think they are comparable.
b. The different survey studies will also have been fielded at different times, making the "intervention" (the pandemic) very different. Perhaps the loss of research time is most acute in the beginning, before academics have had time to adapt? Or later, because of burn-out?
3) Thirdly, the diversity of research design and modelling techniques makes it hard to conduct formal comparisons of effect estimates.
None of the included studies are randomised controlled experiments. In fact, the research design (and modelling techniques) differs immensely across included studies. Therefore:
a. We do not know to what degree individual, and thus by extension, individual gender gap estimates can be causally interpreted. This should be more explicitly acknowledged in the article.
b. Different estimates may be relatively closer to a causal effect, depending on the research design. By treating all designs equally, the authors gloss over these crucial differences in what we can gleam from each study.
c. It is not clear what "estimand" we get from the meta-analytical model. Some studies are cross-sectional, and will give us the average between-subject difference in productivity. Other studies, longitudinal ones, may give us the "difference in differences", i.e. the average difference in within-subject publication productivity trend. These are fundamentally two different answers to the question: Has the pandemic exacerbated the gender gap in research?
d. The guidance from e.g. Cochrane is to use a random effects model to account for variation in what effect is estimated. The authors seem to use a random effects model to account for dependency between effects extracted, but I think they should also be more explicit in leveraging this for accounting for variation in what effect is estimated.
e. Each included paper will have different modelling strategies. E.g. the Myers et al. 2020 paper uses regularised regression (Lasso), while the Andersen et al. (2020) used a hierarchical logit model. These differences may contribute to differences in estimated gender gaps in ways we don't know or lead to overfitting.
When 49 % of variation is explained, simply, by the data employed (survey, publication, or submission, see p. 5 of manuscript), it makes me wonder how much is simply explained by differences in research design or modeling strategy.
4) Another concern is the conclusions drawn from the differences in meta-analytic effect drawn from figure 2. To me, the arguments of survey estimates being more "true" to the actual effect, because they are closer to the real-time events (p. 17) could easily be turned on its head.
Those estimates are also self-reported, and only a snapshot at one point.
a. People are bad at judging changes.
b. Productivity may have been severely hampered early on, when surveys were fielded, and then normalised over time.
c. Survey estimates are around 4.2 and 4.9 times larger than estimates from publication data (0.193/0.046) and submission data (0.193/0.039) (p. 7), but also has the smallest sample sizes (I think from looking at 1/SE in figure 2). Couldn't this easily be an effect of higher degrees of noise and lower power in this data?
d. Often, large-scale international surveys of researcher suffer from very low response rates and often mostly cover few countries (North American and Western Europe). At best, it makes it hard to generalise beyond these areas, and at worst this bias the results.
I appreciate a discussion of why survey estimates differ so much from publication- or submission-based studies, but this discussion is currently one-sided. The authors should consider if perhaps survey data suffers from other problems that could inflate estimates.
5) The authors seem to conflate gender inequality with gender bias throughout the paper (e.g. on line 55 or 281). In science studies, one would often denote a difference in outcome as a bias only if there is a provable mechanism of discrimination or differential treatment of women in e.g. journal accept rates, grant funding, etc. Instead, an indirect or structural difference could be a disparity or inequality brought on by other factors (e.g. women being disproportionally allotted more teaching load, domestic work, not being promoted to equal degree, etc.).
a. There is a great working paper by Traag and Waltman with a discussion of these, and I suggest the authors use some of their clarification (doi.org/10.48550/arXiv.2207.13665).
b. I think this is important, not because I want to downplay potential bias, but because it matters for possible interventions. What we should do to ameliorate unfair differential productivity differs according to the causal mechanism at work.
6) How was "before " and "during" pandemic defined? – this is not specified in the inclusion criteria, nor in how the data was extracted.
Lines 456-457: unclear how you define "before the pandemic" and form where you get the data on the numbers. E.g., my first impression was that you analysed yourself all publications for a given discipline as your baseline. Please clarify.
7) Screening
– Study screening section: the inclusion criteria are too vague to be reproducible. It is also incomplete. Was publication status used to exclude evidence? How about publication language and full text availability? Was there a limitation on the geographical scope or targeted career stages for the included studies and was this information coded in any way?
– Line 360: why not all articles were double-screened to avoid errors? It would not add much work.
– Line 368 and 382: no details provided how full-text articles were screened, e.g., in terms of the used software, also it is not specified if they were double-screened.
– Table 1 header: first and only mention that articles were screened from 2020 only – this is a first mention on having such a limit on publication searches – this should be in the search strategy description.
– The authors should describe whether some quality weighting was used or quality assessment played a part in the inclusion criteria.
8) Data and meta-data
– Extracting variables section: please refer the reader to a proper meta-data SI file describing in detail all extracted variables, at a level that enables replication of the data extraction and fully informed data reuse (the "meta-data" file archived on Zenodo does not provide such information in sufficient detail and some of the variables in the provided raw data file are quite cryptic).
– A data file is needed including a list of articles at the full-text screening stage, with individual reasons for exclusion.
– A meta-data file is needed describing in detail all extracted variables, at a level that enables replication of the data extraction and fully informed data reuse (the "meta-data" file archived on Zenodo does not provide such information in sufficient detail and some of the variables in the provided raw data file are quite cryptic).
9) Lines 324-327: Only 17 out of 21 eligible articles were included in the extracted data set – what happened with the remaining 4? Why were they not included in the dataset? From the data files available on Zenodo I can see these were not published as journals articles, however inclusion criteria do not state that only grey literature should be excluded.
10) Line 339-352: The search string used had only 14/17 sensitivity (82%). However, the next step of search strategy refined did not improve the sensitivity and just removed some of the irrelevant studies to reduce the screening effort.
Given the limited sample size, and limited scope of the searches, it is of concern that a significant proportion of potentially available evidence has been missed (at least 20%). The main reason for using "test set" (benchmarking) articles is to improve search sensitivity, with search precision being less important. Since it is hard to get 100% sensitivity in database searches, additional search strategies should be used to locate potentially missed articles, for example by collecting and screening articles that were cited by or cited already included articles (after the main database searching and screening is completed). Also, grey literature should have been searched.
11) Lines 350-251: the recommended 10% hit rate should be calculated from pilot screening round not from how many "test set" articles have been captured by the search string.
12) Lines 411-413: regression models per se are not effect sizes, please specify which estimates from these models were used as effect sizes and how they were combined with other effect sizes.
13) Analyses section: no description of any sensitivity analyses (e.g., doing analyses leaving out outliers or leaving-one-study-out approach).
14) Limitations section: there are many potential limitations of this study that are not mentioned here. For example, limitations of the search conducted to find the evidence – not searching grey literature, no other additional searches, not searching in languages other than English. This potentially resulted in biased evidence as well as limited the sample size. Also, some statistical analyses are less reliable due to small numbers of effect sizes within some of the levels of categorical variables tested.
15) Table S4 item 20d: Figures 2, 3, 5 show meta-regression results testing secondary hypotheses. Those are not sensitivity analyses.
https://doi.org/10.7554/eLife.85427.sa1Author response
Essential revisions
1) I am concerned about the use of the included studies for a formal meta-analysis. Firstly, it is clear from the authors well-structured description in the methods section that many studies are not measuring the same outcome.
Many studies use number of submitted or published articles, which may be a fairly comparable metric, but many of the survey studies use very different measures of productivity:
a. Research time (N = 4), job-loss (N = 1), burnout (N = 1), and number of projects (N = 1).
b. These are highly different outcomes, and should not be analysed as comparable.
We conducted a sensitivity analysis excluding the survey studies and found little change in the results. We now mention the sensitivity analysis in the main text:
“Our results changed little when we conducted a sensitivity analysis that excluded seven effect sizes using four measures of productivity from survey-based studies that are less directly comparable: research time (N = 4), job-loss (N = 1), burnout (N = 1) and the number of projects (N = 1). When excluding these effect sizes, the overall estimate is -0.063, 95% CI = [-0.0892- -0.0372] , SE = 0.0133, p < 0.001 and the estimate for survey studies only is -0.239, 95% CI = [-0.3419- -0.1352], SE = 0.0527, p < 0.001.”
We include all the studies in the main analysis because although they are not directly the same as productivity output in terms of submissions and publications, they are relevant to an academic’s productivity and likely reflect the overall change in the gender bias in academic productivity that our article aims to assess.
2) Secondly, it is not clear how the studies differ in their use of the pandemic as an "intervention".
a. Some studies will ask respondents to compare their productivity before and after, while some studies will provide actual comparisons of productivity before and after. Both methods will have their share of drawbacks, but I do not think they are comparable.
All but 5 survey studies are about perceived impacts and not actual impacts, so these effects become separated in prediction 1b when we investigate survey and submission and publication studies as moderators. In addition, we recognize that none of our studies measure actual comparisons of individual-level productivity before and after the start of the pandemic. As we mention in the discussion, in the first submission, the findings of the studies comparing publication patterns:
“might reflect lower submission and acceptance rates of articles by women compared to their male colleagues or an increased drop-out of women from academia caused by the pandemic.”
b. The different survey studies will also have been fielded at different times, making the "intervention" (the pandemic) very different. Perhaps the loss of research time is most acute in the beginning, before academics have had time to adapt? Or later, because of burn-out?
We now include this point in the ‘Limitations’ section:
“We recognise there are differences between article studies in the length of time sampled before the pandemic (mean = 11 months, standard deviation = 10 months, range = 1-50 months) and during the pandemic (mean = 7 months, standard deviation = 5 months, range = 1-17 months). Survey studies were fielded at different times, (mean = 21/08/2020, standard deviation = 99 days, range = 20/04/2020 – 28/02/21) which potentially affects participants’ feelings of productivity changes.”
In addition, we mention in the discussion:
“It is likely that the article studies we could include in our study underestimates the long-term effects of the pandemic, which might span over many years.”
3) Thirdly, the diversity of research design and modelling techniques makes it hard to conduct formal comparisons of effect estimates.
Diversity in research designs is common in most fields as there are generally no set of standards on how to conduct a certain type of a study. This is why there is commonly a very large difference in between study heterogeneity in effect sizes. However, a part of the heterogeneity will be explained by certain common features of the studies, and we have tried to capture these in our analysis.
None of the included studies are randomised controlled experiments. In fact, the research design (and modelling techniques) differs immensely across included studies. Therefore:
a. We do not know to what degree individual, and thus by extension, individual gender gap estimates can be causally interpreted. This should be more explicitly acknowledged in the article.
We now include the following sentence in the ‘Limitations’ of the ‘Methods’:
“The patterns we describe should be seen as a potential indication that biases exist, but alternative approaches are needed to speculate about potential underlying causes and remedies.”
Our finding that the gender gap has increased in academic productivity, is contextualised around evidence in other studies that the pandemic has enhanced gendered work roles and disadvantaging women. We start the final paragraph of the discussion with:
“Our study has several limitations, which are outlined in the Limitations of the methods and summarised here. Causes of the increased gender disparity in research productivity during the pandemic are not identified.”
b. Different estimates may be relatively closer to a causal effect, depending on the research design. By treating all designs equally, the authors gloss over these crucial differences in what we can gleam from each study.
Unlike medical meta-analyses, our approach does not assume that there is one causal effect that is being estimated by all studies. Rather, we assume that there can be multiple effects that all shape the gender inequality in academic productivity. Our question is to assess whether overall, these effects have changed during the pandemic such that also the gender inequality has either generally increased or decreased. The summary statements we provide reflect the average effect rather than our estimate of the true effect. We now clarify this in the introduction:
“We assume that the pandemic might have influenced the multiple aspects that jointly affect gender inequality in research productivity, and our estimate reflects whether on average these effects have increased or decreased gender inequality.”
and in the discussion:
“Future studies might therefore detect different effects of the pandemic on gender disparity in productivity, depending on the outcomes they assess and the time-frame over which these changes are analysed.”
and:
“Despite the heterogeneity in our sample, with regards to different outcome measures reflecting research productivity and different approaches to estimate effects, we overall find that the majority of studies performed to date indicate that the gender gap in research productivity has increased during the pandemic. This finding suggests that the COVID-19 pandemic has likely influenced many of the processes that contribute to differences in the achieved research productivity of women compared to men.”
The most fundamental difference in research design of studies is between studies that assess productivity by numbers of male and female authors before and during the pandemic, and those that use surveys to assess productivity differences of individuals. We separate these studies in prediction 1b and Figure 2, and then subsequently only use measures of numbers of submissions and publications in downstream analyses investigating effects of research field, size of previous gender gap and authorship position. Finally, while Risk of Bias is commonly a part of meta-analysis in medicine, and sometimes in environmental evidence, it is almost never done in other fields. While we agree that this is an important component of meta-analysis, unfortunately there are no Risk of Bias standards or tools for the kind of studies we have used.
c. It is not clear what "estimand" we get from the meta-analytical model. Some studies are cross-sectional, and will give us the average between-subject difference in productivity. Other studies, longitudinal ones, may give us the "difference in differences", i.e. the average difference in within-subject publication productivity trend. These are fundamentally two different answers to the question: Has the pandemic exacerbated the gender gap in research?
We referred to the difference between cross-sectional and longitudinal studies in our discussion, acknowledging that for cross-sectional studies selective disappearance may occur:
“Such a change might reflect lower submission and acceptance rates of articles by women compared to their male colleagues or an increased drop-out of women from academia caused by the pandemic.”
All the included studies investigating productivity before and during the pandemic were cross-sectional. The ‘publishing’ studies aggregate data across individuals, and the surveys were only conducted at a single time point, asking people whether they thought the pandemic had affected their productivity. We also clarify in the ‘Extracting variables’ sub-section on ‘Effect sizes’ that:
“Six studies investigated numbers of articles at different time points during the course of the pandemic. From these studies, we calculated 30 effect sizes using numbers of articles across the entire pandemic period.”
d. The guidance from e.g. Cochrane is to use a random effects model to account for variation in what effect is estimated. The authors seem to use a random effects model to account for dependency between effects extracted, but I think they should also be more explicit in leveraging this for accounting for variation in what effect is estimated.
We are limited in using such an approach, because, as also pointed out by the reviewers, given the diverse factors shaping academic productivity we can only estimate the potential average effect of the pandemic on gender biases in research productivity rather than one true effect.
e. Each included paper will have different modelling strategies. E.g. the Myers et al. 2020 paper uses regularised regression (Lasso), while the Andersen et al. (2020) used a hierarchical logit model. These differences may contribute to differences in estimated gender gaps in ways we don't know or lead to overfitting.
When 49 % of variation is explained, simply, by the data employed (survey, publication, or submission, see p. 5 of manuscript), it makes me wonder how much is simply explained by differences in research design or modeling strategy.
We include the following in the ‘Limitations’ sections of the ‘Methods’:
“We used raw data to calculate effect sizes using the same modelling techniques wherever possible. This was not possible in 10 studies, where we consequently used effect size as provided in the study. We recognize that their different modelling techniques may have contributed to the estimated effect sizes.”
4) Another concern is the conclusions drawn from the differences in meta-analytic effect drawn from figure 2. To me, the arguments of survey estimates being more "true" to the actual effect, because they are closer to the real-time events (p. 17) could easily be turned on its head.
Those estimates are also self-reported, and only a snapshot at one point.
a. People are bad at judging changes.
We include the following at the end of the second paragraph of the Discussion:
“As with any survey study, survey data are prone to subjectivity and suffer from limited numbers of respondents sampled which may influence the overall estimate.”
b. Productivity may have been severely hampered early on, when surveys were fielded, and then normalised over time.
In our data, surveys were not fielded earlier (or later) compared to when the data collection for the publication studies occurred (both occurred at a median of 6-7 months into the pandemic). In addition, the reports we had found mostly indicated that research projects take longer between conception and final publication than the duration of the pandemic, suggesting that the effect of the pandemic on publication rates might persist for extended periods of time. However, the patterns over time are indeed difficult to predict, and we have therefore amended our statement in the discussion:
“It is likely that the article studies we could include in our study underestimate the long-term effects of the pandemic, which might span over many years.. However, the exact time dynamics are difficult to predict as adjustments and changes in conditions might lead to a normalising in production patterns over time (Clark 2023).”
c. Survey estimates are around 4.2 and 4.9 times larger than estimates from publication data (0.193/0.046) and submission data (0.193/0.039) (p. 7), but also has the smallest sample sizes (I think from looking at 1/SE in figure 2). Couldn't this easily be an effect of higher degrees of noise and lower power in this data?
We include a leave-one-out sensitivity analysis for survey studies only. We did not detect evidence of publication bias that might have substantially shifted the values up, but with the small sample there could be relatively high uncertainty around the mean effect estimate of the survey studies. The results of this are described:
“Overly large effect sizes did not change the results in a leave-one-out analysis, which repeatedly fitted the overall model as in prediction 1a, but for survey studies only, leaving out one effect size at a time to see the effect on the overall survey-study estimate (Figure S2). Leaving out the most influential effect size, the overall estimate was -0.183, 95% CI = [-0.270 - -0.096] , SE = 0.045, p < 0.001.”
and methods outlined:
“We also performed a leave-one-out analysis using the ‘leave1out’ function in ‘metafor’. This was a meta-analysis on survey studies, leaving out exactly one study at a time to see the effect of individual studies on the overall survey-study estimate.”
d. Often, large-scale international surveys of researcher suffer from very low response rates and often mostly cover few countries (North American and Western Europe). At best, it makes it hard to generalise beyond these areas, and at worst this bias the results.
We include the following in the ‘Limitations’ section of the ‘Methods’:
“Conclusions from survey studies are also limited to North American and Western European, since 18/23 studies are exclusive to or dominated by respondents from these regions.”
I appreciate a discussion of why survey estimates differ so much from publication- or submission-based studies, but this discussion is currently one-sided. The authors should consider if perhaps survey data suffers from other problems that could inflate estimates.
We have balanced the discussion for survey data following Comment 4 as in the preceding comments and corresponding author action/responses.
5) The authors seem to conflate gender inequality with gender bias throughout the paper (e.g. on line 55 or 281). In science studies, one would often denote a difference in outcome as a bias only if there is a provable mechanism of discrimination or differential treatment of women in e.g. journal accept rates, grant funding, etc. Instead, an indirect or structural difference could be a disparity or inequality brought on by other factors (e.g. women being disproportionally allotted more teaching load, domestic work, not being promoted to equal degree, etc.).
a. There is a great working paper by Traag and Waltman with a discussion of these, and I suggest the authors use some of their clarification (doi.org/10.48550/arXiv.2207.13665).
We have revisited where we express “bias” and now avoid use of the word unless in context of mechanisms at play.
b. I think this is important, not because I want to downplay potential bias, but because it matters for possible interventions. What we should do to ameliorate unfair differential productivity differs according to the causal mechanism at work.
We have added a sentence to our ‘Conclusions’:
“Our study cannot speak to the potential mechanisms that might have led to changes in gender inequality during the pandemic and is therefore limited in deriving suggestions for potential interventions to potentially ameliorate unfair differential productivity besides indicating that such inequalities appear pervasive.”
6) How was "before " and "during" pandemic defined? – this is not specified in the inclusion criteria, nor in how the data was extracted.
Lines 456-457: unclear how you define "before the pandemic" and form where you get the data on the numbers. E.g., my first impression was that you analysed yourself all publications for a given discipline as your baseline. Please clarify.
We specify in the ‘Methods’ for inclusion criteria for the full-text screen that time periods for before and after the pandemic are chosen according to the authors’ discretion:
“Full texts were then screened to identify articles that had included four qualifiers: (1) both genders, (2) some quantifiable metric of academic productivity measured, and (3) compared a time period before the pandemic with a time period during the pandemic (time periods chosen according to the authors’ discretion), (4) primary data.”
We remind readers of this in the ‘Methods’:
“Effect size: We extracted values needed to calculate 130 effect sizes from 55 articles investigating the effect of the pandemic on academic research productivity of both genders, comparing the productivity before and during the pandemic, using time periods chosen according to authors’ discretion”
and:
“Previous gender disparity: For the article studies with available data (N=99 effect sizes), we recorded the number of female and male authors before the pandemic, as defined by the time-period sampled in the respective study and use this ratio as a proxy for size of the previous gender disparity in that population sampled.”
7) Screening
– Study screening section: the inclusion criteria are too vague to be reproducible. It is also incomplete? Was publication status used to exclude evidence? How about publication language and full text availability?
We include the following in the ‘Study screening’ section of the ‘Methods’:
“We included any text returned by the database, of any publication status, including grey literature in any language, though all texts had abstracts with an English version.”
We include in the ‘Iterating the search’ of the ‘Methods’:
“Two studies with full texts in Spanish were translated to English by Google translate, of which one was included.”
We include in the ‘Iterating the search’ section of the ‘Methods’:
“All full-texts were available”.
We include the following in the ‘Extracting variables’ sub-section of the ‘Methods’:
“We also extracted data for the following variables, to enable description of the datasets: date range before the pandemic; date range during the pandemic; geographic region; data availability for gender and geographic region interaction effect; data availability for gender and career stage/age interaction effect; data availability for gender and parent status interaction effect; gender assignment accuracy threshold for article studies and gender inference method used (Supplementary file 2, see also ‘Limitations’).”
Was there a limitation on the geographical scope or targeted career stages for the included studies and was this information coded in any way?
We acknowledge in the ‘Limitations’ section of the ‘Methods’:
“Most studies explored academic populations worldwide (N = 99 effect sizes), or from Western (N = 28 effect sizes) regions, but not the Global South (N = 3 effect sizes) limiting investigation of interaction effects between geographic regions. Although 22/130 effect sizes from 8/55 studies held data subdivided between geographic regions, we did not extract separate effect sizes as they differed in the scale of geographic region sampled, which limited our ability to make geographic comparisons. Conclusions from survey studies are also limited to North American and Western European, since 18/23 studies are exclusive to, or have the majority of respondents from these regions. Additionally, we recognise there are differences between article studies in the length of time considered as before the pandemic (mean = 11 months, standard deviation = 10 months, range = 1-50 months) and during the pandemic (mean = 6.6 months, standard deviation = 5 months, range = 1-17 months). Survey studies were fielded at different times, (mean = 21/08/2020, standard deviation = 99 days, range = 20/04/2020 – 28/02/21) which potentially affects participants’ beliefs of productivity changes”
– Line 360: why not all articles were double-screened to avoid errors? It would not add much work.
We include the following the ‘Study screening’ section of the ‘Methods’:
“To reduce workload, we did not double-initial-screen 160 texts because of 97% agreement rates achieved.. We acknowledge this may miss up to 13% of studies (Waffenschmidt et al., 2019)”
– Line 368 and 382: no details provided how full-text articles were screened, e.g., in terms of the used software, also it is not specified if they were double-screened.
We include in the ‘Study screening’ section of the ‘Methods’:
“Full texts were then screened to identify articles that had included four qualifiers: (1) both genders, (2) some quantifiable metric of academic productivity measured, and (3) compared a time period before the pandemic with a time period during the pandemic (time periods chosen according to the authors’ discretion), (4) primary data. Full-text screening was conducted by recording which, if any of the four qualifiers were missing for each text in an excel spreadsheet and only performed by K.L.”
– Table 1 header: first and only mention that articles were screened from 2020 only – this is a first mention on having such a limit on publication searches – this should be in the search strategy description.
We include in the ‘Search process’ section of the ‘Methods’:
“All searches were filtered for texts from 2020 onwards.”
– The authors should describe whether some quality weighting was used or quality assessment played a part in the inclusion criteria.
We include in the ‘Study screening’ section of the ‘Methods’:
“Studies were not assigned quality weightings as there is no common standard to do this.”
8) Data and meta-data
– Extracting variables section: please refer the reader to a proper meta-data SI file describing in detail all extracted variables, at a level that enables replication of the data extraction and fully informed data reuse (the "meta-data" file archived on Zenodo does not provide such information in sufficient detail and some of the variables in the provided raw data file are quite cryptic).
We include a datafile (Supplementary file 2, “Variables” sheet) describing all variables extracted. We include the following in the ‘Extracting variables’ section of ‘Methods’:
“We also extracted data for the following variables to enable description of our datasets: date range before the pandemic; date range during the pandemic; geographic region; data availability for gender and geographic region interaction effect; data availability for gender and career stage/age interaction effect; data availability for gender and parent status interaction effect; gender assignment accuracy threshold for article studies and gender inference method used. Please see Supplementary file 2, “Variables” sheet, for descriptions of all the variables”
– A data file is needed including a list of articles at the full-text screening stage, with individual reasons for exclusion.
We include a datafile (Supplementary file 1) describing individual reasons for excluding articles.
We included in the ‘Iterating the search’ section of the ‘Methods’:
“For these 169, we screened the full texts, excluding 120 studies (53 studies missed one qualifier, 38 studies missed two qualifiers, 27 studies miss three qualifiers, 1 study missed four qualifiers) and keeping 50 (including the 25 identified in the original search) that all contained the necessary information to calculate the effect sizes (Supplementary file 1)”
– A meta-data file is needed describing in detail all extracted variables, at a level that enables replication of the data extraction and fully informed data reuse (the "meta-data" file archived on Zenodo does not provide such information in sufficient detail and some of the variables in the provided raw data file are quite cryptic).
9) Lines 324-327: Only 17 out of 21 eligible articles were included in the extracted data set – what happened with the remaining 4? Why were they not included in the dataset? From the data files available on Zenodo I can see these were not published as journals articles, however inclusion criteria do not state that only grey literature should be excluded.
There are five, not four studies, because the original submission listed 14/17 scoped articles indexed in Scopus picked up by the search, when this should have been 13/17 articles. This has since been corrected.
We have included the five articles that were scoped but not picked up in the databases and re-run the analyses using these data and state this in the Iterating the search section of the ‘Methods’:
“Five studies found in the scoping search but not returned in database searches were also included, resulting in 55 total studies used to extract variables for analysis.”
10) Line 339-352: The search string used had only 14/17 sensitivity (82%). However, the next step of search strategy refined did not improve the sensitivity and just removed some of the irrelevant studies to reduce the screening effort.
Given the limited sample size, and limited scope of the searches, it is of concern that a significant proportion of potentially available evidence has been missed (at least 20%). The main reason for using "test set" (benchmarking) articles is to improve search sensitivity, with search precision being less important. Since it is hard to get 100% sensitivity in database searches, additional search strategies should be used to locate potentially missed articles, for example by collecting and screening articles that were cited by or cited already included articles (after the main database searching and screening is completed). Also, grey literature should have been searched.
Minimising work load at the expense of potentially missing some available evidence was a trade-off we were willing to make given the need to quickly produce results in the context of a potentially pressing issue. For this, we chose to use litsearchR to improve efficiency of finding texts and to not perform forwards and backwards searches. Additionally, given the research topic is so new, we will consistently be finding new articles if we performed backwards and forwards searches and so we chose to not perform these. We did not search specific grey literature databases, but did not filter against grey literature during screening. We welcome future research to incorporate our scripts and methods to monitor this new research topic including more research as and when it becomes available.
11) Lines 350-251: the recommended 10% hit rate should be calculated from pilot screening round not from how many "test set" articles have been captured by the search string.
We have deleted the statement about “above the 10% hit rate recommended by Foo et. al”.
12) Lines 411-413: regression models per se are not effect sizes, please specify which estimates from these models were used as effect sizes and how they were combined with other effect sizes.
We include in the ‘Extracting variables’ section of the ‘Methods’:
“For 10 effect sizes which did not have data available to calculate our own effect sizes, we used already calculated percentage changes in the gender gap in academic productivity as predicted from lasso regression (N = 2), Somers’ δ (N = 2), ordered logistic regression (N = 1) and mixed-effect models (N = 5).”
13) Analyses section: no description of any sensitivity analyses (e.g., doing analyses leaving out outliers or leaving-one-study-out approach).
We include the following sensitivity analysis leaving studies in the ‘Are our results robust?’ section of the ‘Results’:
“Our results show little change in a sensitivity analysis that excludes seven effect sizes using four measures of productivity from survey-based studies that are less directly comparable: research time (N = 4), job-loss (N = 1), burnout (N = 1) and the number of projects (N = 1). When excluding these effect sizes, the overall estimate is -0.063, 95% CI = [-0.0892- -0.0372] , SE = 0.0133, p < 0.001 and the estimate for survey studies only is -0.239, 95% CI = [-0.3419- -0.1352], SE = 0.0527, p < 0.001.”
We now include a leave-one-out analysis for the overall effect of the pandemic on the gender gap and record the results in the ‘Are our results robust?’ section of the ‘Results’:
“Overly large effect sizes did not change the results in a leave-one-out analysis, which repeatedly fitted the overall model as in prediction 1a, but for survey studies only, leaving out one effect size at a time to see the effect on the overall survey-study estimate (Figure S2). Leaving out the most influential effect size, the overall estimate was -0.183, 95% CI = [-0.270 - -0.096] , SE = 0.045, p < 0.001.” and display this as a forest plot as Figure S2.
These analyses are written in ‘Analyses’ section of the ‘Methods’:
“We applied a sensitivity analysis testing prediction 1a (overall pandemic effect on gender gap) and prediction 1b (method of research productivity influence on pandemic effect on gender gap) excluding seven effect sizes using four measures of productivity from survey-based studies that are less directly comparable: research time (N = 4), job-loss (N = 1), burnout (N = 1) and the number of projects (N = 1). We also performed a leave-one-out analysis using the ‘leave1out’ function in ‘metafor’. This performed a meta-analysis on survey studies, leaving out exactly one study at a time to see the effect of individual studies on the overall estimate for survey studies.”
14) Limitations section: there are many potential limitations of this study that are not mentioned here. For example, limitations of the search conducted to find the evidence – not searching grey literature, no other additional searches, not searching in languages other than English. This potentially resulted in biased evidence as well as limited the sample size. Also, some statistical analyses are less reliable due to small numbers of effect sizes within some of the levels of categorical variables tested.
We have considerably expanded our ‘Limitations’ section in the ‘Methods’, including all the examples given by the reviewer:
“Our focus is on comparing the effect of the pandemic on women relative to men. We recognize that gender extends beyond this comparison, and that biases are even more likely to target individuals whose identities are less represented and often ignored. These biases also reflect in a lack of studies of the full diversity of gender. While several of the surveys we include had the option for respondents to identify beyond the binary women/men, none of these studies report on these individuals, presumably because of the respective small samples. In addition, all studies using numbers of submissions or publications (38 out of 55) to measure research productivity used automatic approaches that are more likely to mis-gender individuals as they inferred binary gender based on first names. While these approaches seemingly offer the potential to identify trends in larger samples, they themselves introduce and reinforce biases in relation to gender that are hard to assess, intersecting with biases in ethnicity as these approaches are often restricted to names common in English speaking countries (Mihaljević et al., 2019). We do not include grey literature databases in our searches, which may bias our samples to studies with positive effects. We did not perform forwards or backwards searches, meaning we may have missed some relevant studies. However, we expect the literature on the topic to grow, and hope that further work will build on our study and add these new effect sizes to our dataset. Most studies explored academic populations worldwide (N = 99 effect sizes), or from Western (N = 28 effect sizes), regions, but not the Global South (N = 3 effect sizes), limiting investigation of interaction effects between geographic regions. Although 22/130 effect sizes from 8/55 studies held data subdivided between geographic regions, we did not extract separate effect sizes as they differed in the scale of geographic region sampled, which limited our ability to make geographic comparisons. Conclusions from survey studies are also limited to North American and Western European, since 18/23 studies are exclusive to or have the majority of respondents from these regions. We recognise there are differences between article studies in the length of time considered as before the pandemic (mean = 11 months, standard deviation = 10 months, range = 1-50 months) and during the pandemic (mean = 7 months, standard deviation = 5 months, range = 1-17 months). Survey studies were fielded at different times, (mean = 21/08/2020, standard deviation = 99 days, range = 20/04/2020 – 28/02/21) which potentially affects participants’ beliefs of productivity changes. Investigating research field and authorship position effects is limited by the unequal and sometimes small sample sizes of variables that are compared. We use 10 studies that provide effect sizes without raw data available to calculate our own effect size and recognise their differing modelling techniques may contribute to the estimated effect sizes. The patterns we describe should be seen as a potential indication that biases exist, but alternative approaches are needed to speculate about potential underlying causes and remedies.”
We also close the ‘Discussion’ with a summary of limitations:
“Our study has several limitations, which are outlined in the Limitations section of the methods and summarised here. Causes of the increased gender disparity in research productivity during the pandemic are not identified. Gender is investigated only as a binary variable, mostly using first-name prediction tools, with no investigation into non-binary or transgender. Geographic regions are not investigated, limiting generalisability as our samples are not equally representative of all geographic regions. All studies are to some extent unique by combined differences in sampling method and analyses performed.”
15) Table S4 item 20d: Figures 2, 3, 5 show meta-regression results testing secondary hypotheses. Those are not sensitivity analyses.
We changed the entry for 20d sensitivity analyses in Table S4 to refer to the places where we added the results from the sensitivity analyses in the ‘Are our results robust?’ section of the methods: “Page 15, Figure S2”.
https://doi.org/10.7554/eLife.85427.sa2Article and author information
Author details
Funding
No external funding was received for this work.
Acknowledgements
We express gratitude for papers not behind paywalls.
Publication history
- Received:
- Accepted:
- Accepted Manuscript published:
- Version of Record published:
Copyright
© 2023, Lee et al.
This article is distributed under the terms of the Creative Commons Attribution License, which permits unrestricted use and redistribution provided that the original author and source are credited.
Metrics
-
- 1,509
- views
-
- 184
- downloads
-
- 28
- citations
Views, downloads and citations are aggregated across all versions of this paper published by eLife.
Citations by DOI
-
- 28
- citations for umbrella DOI https://doi.org/10.7554/eLife.85427
Download links
A two-part list of links to download the article, or parts of the article, in various formats.
Downloads (link to download the article as PDF)
Open citations (links to open the citations from this article in various online reference manager services)
Cite this article (links to download the citations from this article in formats compatible with various reference manager tools)
Meta-Research: The effect of the COVID-19 pandemic on the gender gap in research productivity within academia
eLife 12:e85427.
https://doi.org/10.7554/eLife.85427


