Species and habitat specific changes in bird activity in an urban environment during Covid 19 lockdown
- School of Zoology, Faculty of Life Sciences, Tel Aviv University, Israel
- College of Life Sciences, Hebei Normal University, China
- Hebei Collaborative Innovation Center for Eco-Environment, Hebei Normal University, China
- Faculty of Architecture and Town Planning, Technion, Israel Institute of Technology, Israel
- The Steinhardt Museum of Natural History, National Research Center for Biodiversity Studies, Tel-Aviv University, Israel
- Sagol School of Neuroscience, Tel Aviv University, Israel
Figures
Figure 1
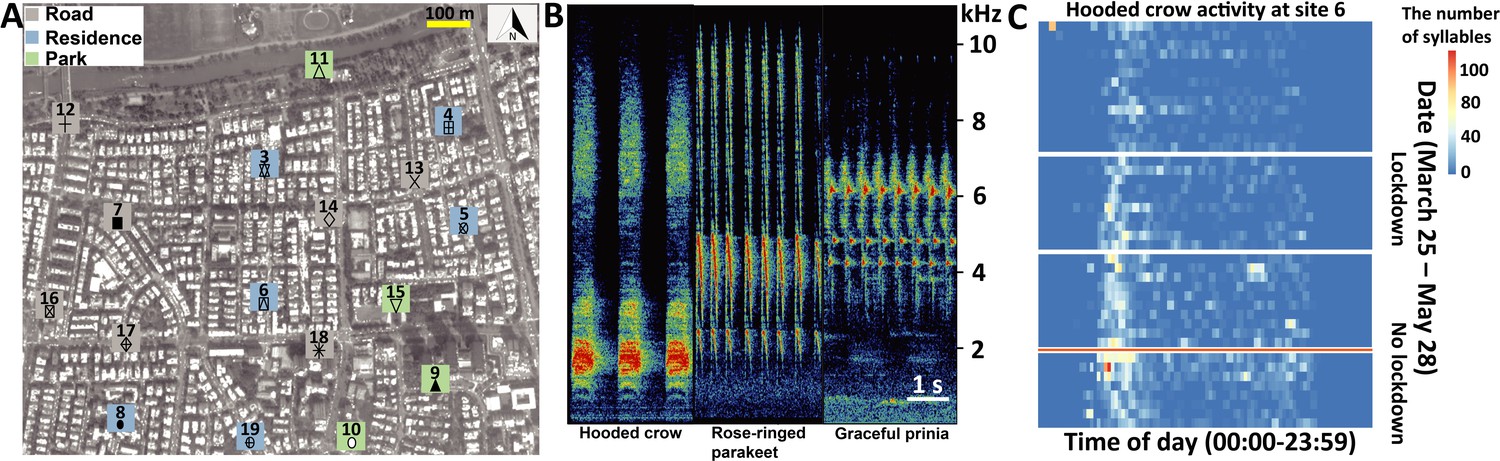
Study system, vocal characters, and vocal activities.
(A) The seventeen sampling sites (Grey square: road; Blue square: residence; Green square: Park). The total activity for each species at each location is shown in bars for the lockdown (red) and no-lockdown (blue) periods. Different sampling sites are represented by different symbols. (B) Spectrograms of vocalizations with Hooded crow, Rose-ringed parakeet, and Graceful prinia vocalizations. (C) An example of a heat-map indicating the activity of Hooded crows at site 11 monitored continuously between March 31 and May 28 (without the dates between April 9 – April 23, May 4 – May 6, May 17 – May 20, depicted by white gaps). The x-axis depicts the time of day (not normalized to sunrise). The y-axis is the date. The red horizontal line separates lockdown from no lockdown periods. The figure also suggests an overall seasonal increase in activity, but our models suggest a lockdown effect on top of this seasonal effect.
-
Figure 1—source data 1
The activity of hooded crow at 17 sites in central Tel-Aviv.
(A) Study area and (B) recording site. The yellow star refers to the audiomoth’s location. (C) Heatmap indicating the activity of Corvus corone cornix along the day. The x-axis refers to the time of day. The y-axis is the date. The numbers in parentheses for dates represent the total number of events detected during the day. The orange line separates lockdown from no lockdown periods.
- https://cdn.elifesciences.org/articles/88064/elife-88064-fig1-data1-v1.pdf
-
Figure 1—source data 2
The activity of rose-ringed parakeet at 17 sites in central Tel-Aviv.
(A) Study area and (B) recording site. The yellow star refers to the audiomoth’s location. (C) Heatmap indicating the activity of Psittacula krameri along the day. The x-axis refers to the time of day. The y-axis is the date. The numbers in parentheses for dates represent the total number of events detected during the day. The orange line separates lockdown from no lockdown periods.
- https://cdn.elifesciences.org/articles/88064/elife-88064-fig1-data2-v1.pdf
-
Figure 1—source data 3
The activity of graceful prinia at 17 sites in central Tel-Aviv.
(A) Study area and (B) recording site. The yellow star refers to the audiomoth’s location. (C) Heatmap indicating the activity of Prinia gracilis along the day. The x-axis refers to the time of day. The y-axis is the date. The numbers in parentheses for dates represent the total number of events detected during the day. The orange line separates lockdown from no lockdown periods.
- https://cdn.elifesciences.org/articles/88064/elife-88064-fig1-data3-v1.pdf
Figure 2 with 6 supplements
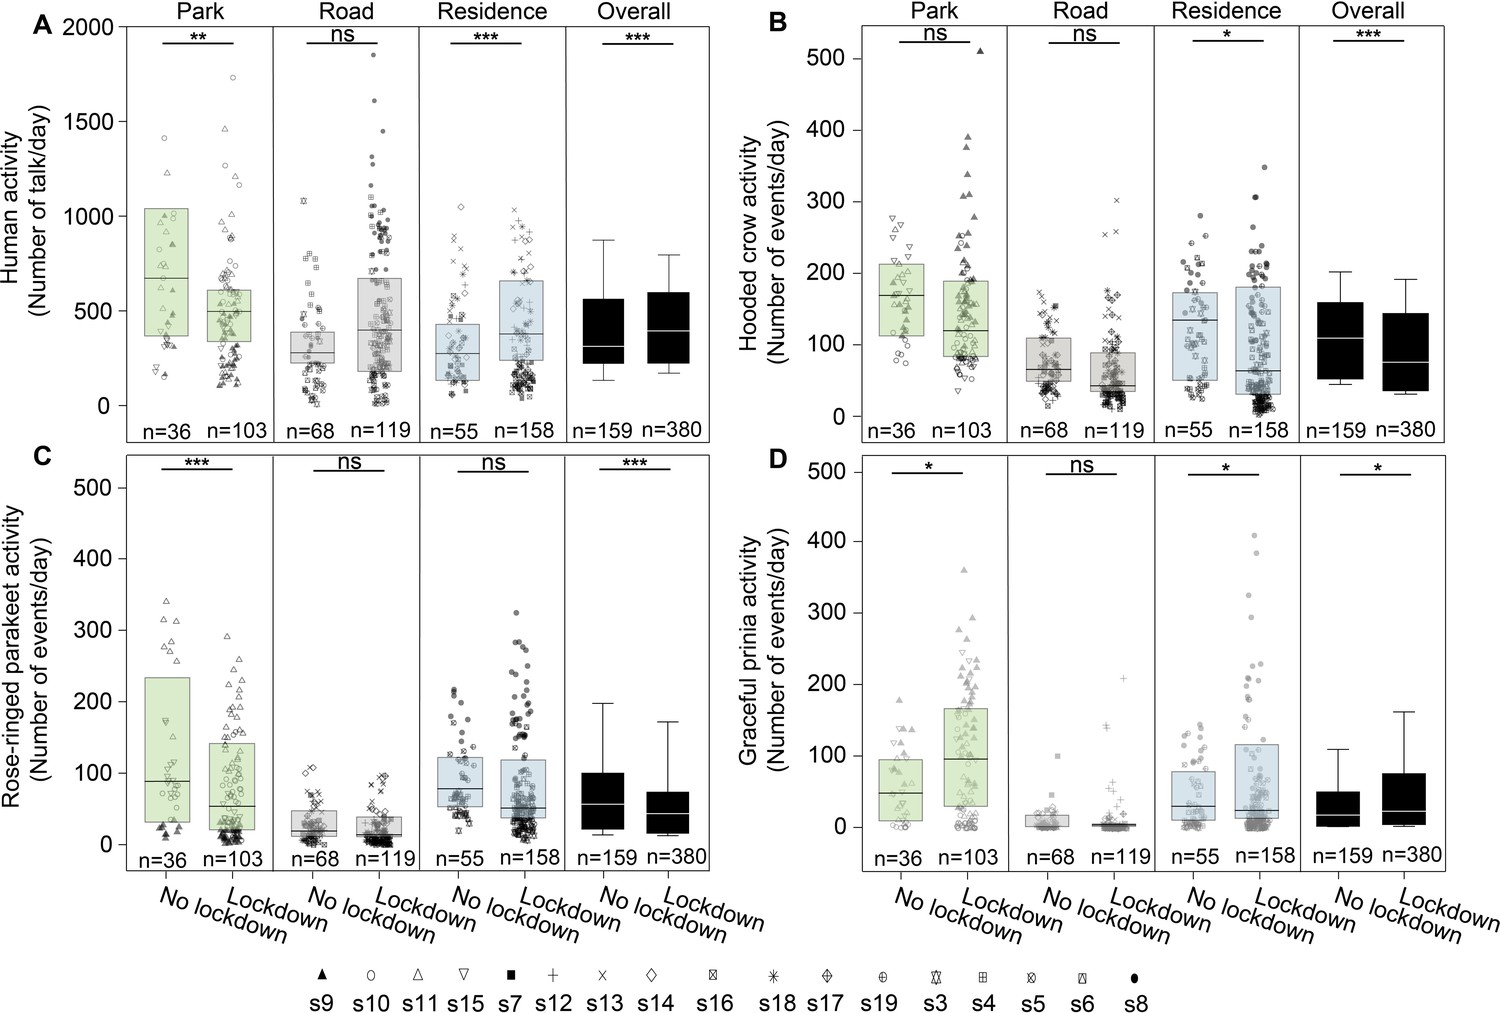
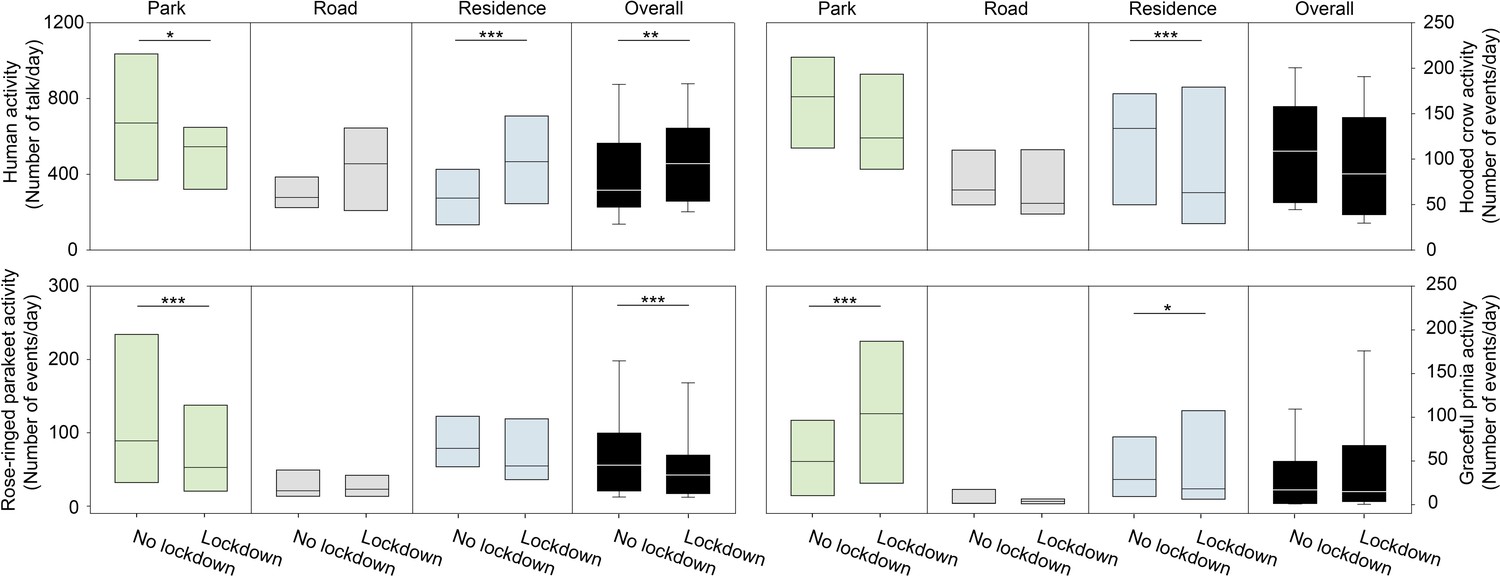
Activity of birds.
Boxplots show the activity of (A) Human activity, (B) Hooded crow, (C) Rose-ringed parakeet, and (D) Graceful prinia for each site category during no lockdown and during lockdown. Green box plot: park; Grey box plot: road; Blue box plot: residence; Black box plot: overall. Note that human activity was assessed based on human speech so the increase observed during lockdowns in roads represents pedestrian and not car activity. Box plot lower and upper box boundaries show the 25th and 75th percentiles, respectively, with the median inside. The lower and upper error lines depict the 10th and 90th percentiles, respectively. Outliers of the data are shown as black dots. Different sampling sites represented by different symbols. Except for roads (GLMM, p=0.632), there were significant differences in human activity between no lockdown period and lockdown period for all sites (GLMM, p<0.0001), for parks (GLMM, p=0.002) and for residential sites (GLMM, residential sites: p<0.0001). In [B], [C] and [D] post hoc tests are indicated with significance levels: *p<0.05, **p<0.01, ***p<0.001, not significant [ns]. n indicates the number of sampling days.
Figure 2—figure supplement 1
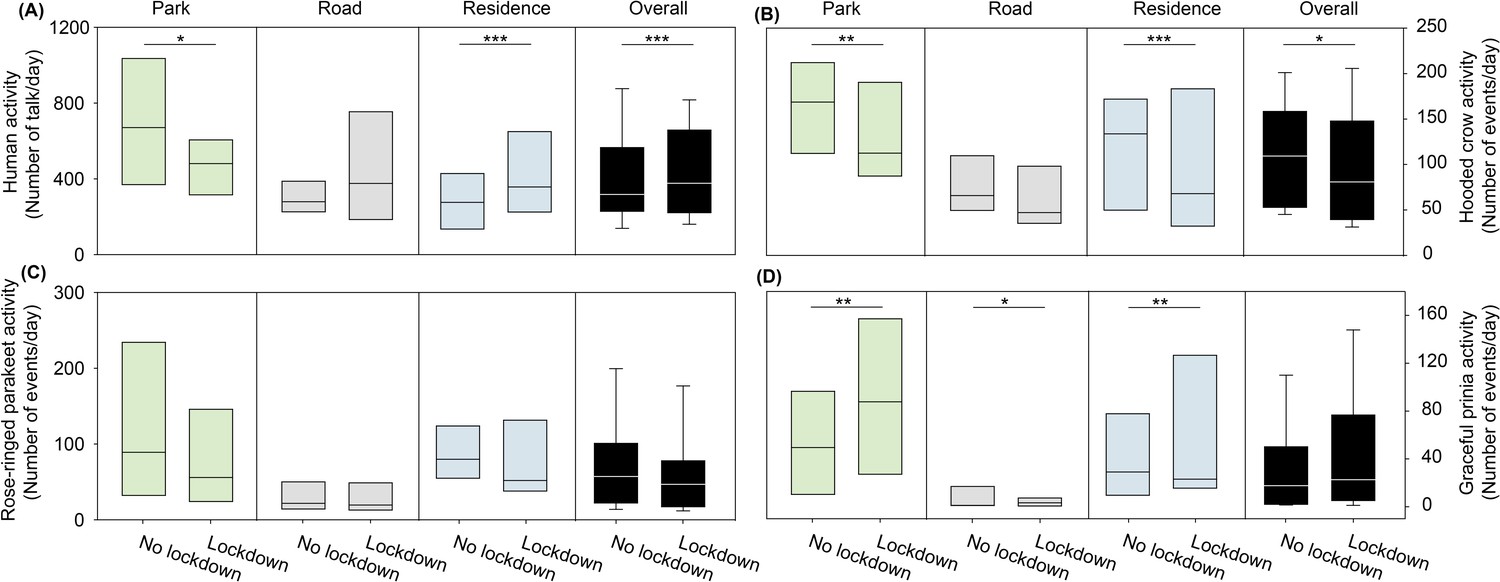
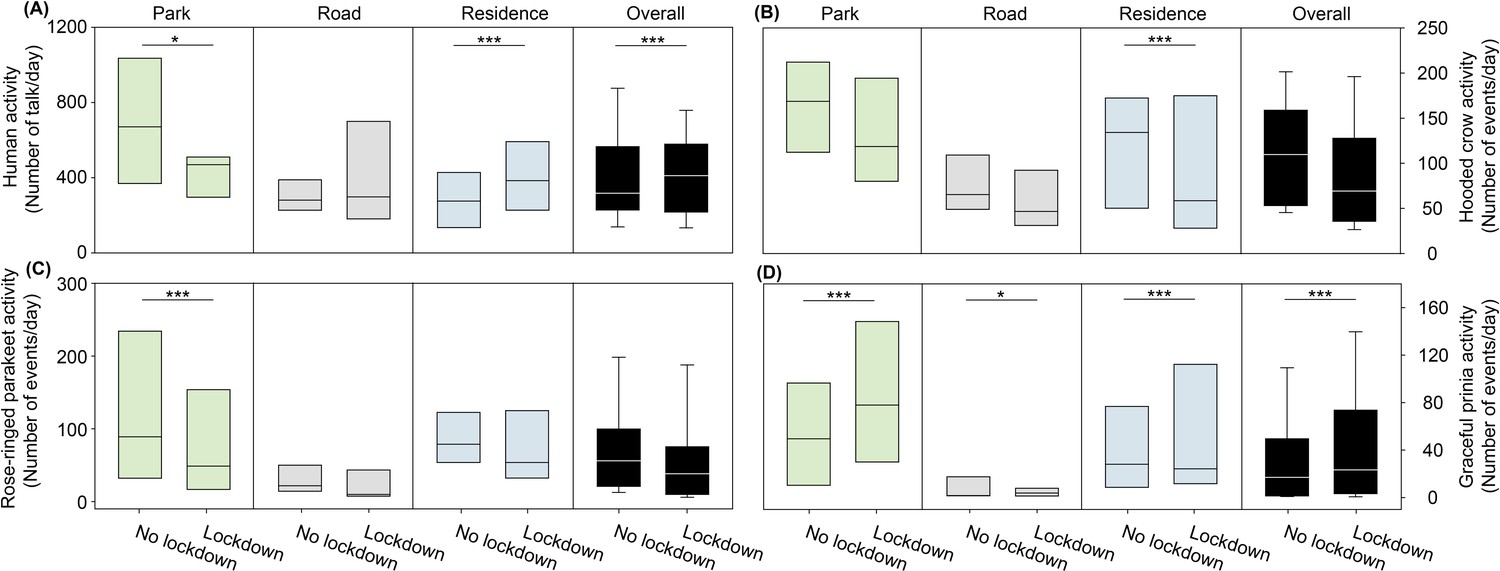
Activity of birds.
Boxplots show the activity of (A) Human activity, (B) Hooded crow, (C) Rose-ringed parakeet, and (D) Graceful prinia for each site category during no lockdown and during lockdown. Green box plot: park; Grey box plot: road; Blue box plot: residence; Black box plot: overall. Note that human activity was assessed based on human speech so the increase observed during lockdowns in roads represents pedestrian and not car activity. Box plot lower and upper box boundaries show the 25th and 75th percentiles, respectively, with the median inside. The lower and upper error lines depict the 10th and 90th percentiles, respectively. Outliers of the data are shown as black dots. *p<0.05, **p<0.01, ***p<0.001.
Figure 2—figure supplement 2

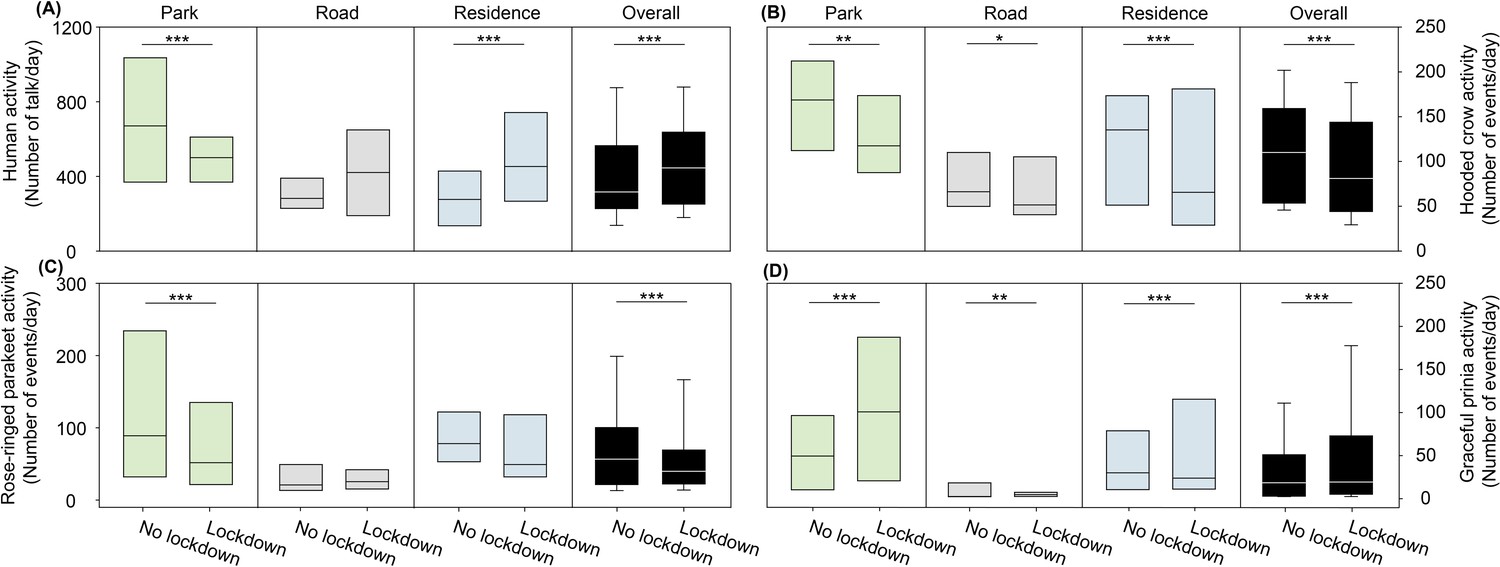
Activity of birds.
Boxplots show the activity of (A) Human activity, (B) Hooded crow, (C) Rose-ringed parakeet, and (D) Graceful prinia for each site category during no lockdown and during lockdown. Green box plot: park; Grey box plot: road; Blue box plot: residence; Black box plot: overall. Note that human activity was assessed based on human speech so the increase observed during lockdowns in roads represents pedestrian and not car activity. Box plot lower and upper box boundaries show the 25th and 75th percentiles, respectively, with the median inside. The lower and upper error lines depict the 10th and 90th percentiles, respectively. Outliers of the data are shown as black dots. *p<0.05, **p<0.01, ***p<0.001.
Figure 2—figure supplement 3
Activity of birds.
Boxplots show the activity of (A) Human activity, (B) Hooded crow, (C) Rose-ringed parakeet, and (D) Graceful prinia for each site category during no lockdown and during lockdown. Green box plot: park; Grey box plot: road; Blue box plot: residence; Black box plot: overall. Note that human activity was assessed based on human speech so the increase observed during lockdowns in roads represents pedestrian and not car activity. Box plot lower and upper box boundaries show the 25th and 75th percentiles, respectively, with the median inside. The lower and upper error lines depict the 10th and 90th percentiles, respectively. Outliers of the data are shown as black dots. *p<0.05, **p<0.01, ***p<0.001.
Figure 2—figure supplement 4
Activity of birds.
Boxplots show the activity of (A) Human activity, (B) Hooded crow, (C) Rose-ringed parakeet, and (D) Graceful prinia for each site category during no lockdown and during lockdown. Green box plot: park; Grey box plot: road; Blue box plot: residence; Black box plot: overall. Note that human activity was assessed based on human speech so the increase observed during lockdowns in roads represents pedestrian and not car activity. Box plot lower and upper box boundaries show the 25th and 75th percentiles, respectively, with the median inside. The lower and upper error lines depict the 10th and 90th percentiles, respectively. Outliers of the data are shown as black dots. *p<0.05, **p<0.01, ***p<0.001.
Figure 2—figure supplement 5
Activity of birds.
Boxplots show the activity of (A) Human activity, (B) Hooded crow, (C) Rose-ringed parakeet, and (D) Graceful prinia for each site category during no lockdown and during lockdown. Green box plot: park; Grey box plot: road; Blue box plot: residence; Black box plot: overall. Note that human activity was assessed based on human speech so the increase observed during lockdowns in roads represents pedestrian and not car activity. Box plot lower and upper box boundaries show the 25th and 75th percentiles, respectively, with the median inside. The lower and upper error lines depict the 10th and 90th percentiles, respectively. Outliers of the data are shown as black dots. *p<0.05, **p<0.01, ***p<0.001.
Figure 2—figure supplement 6
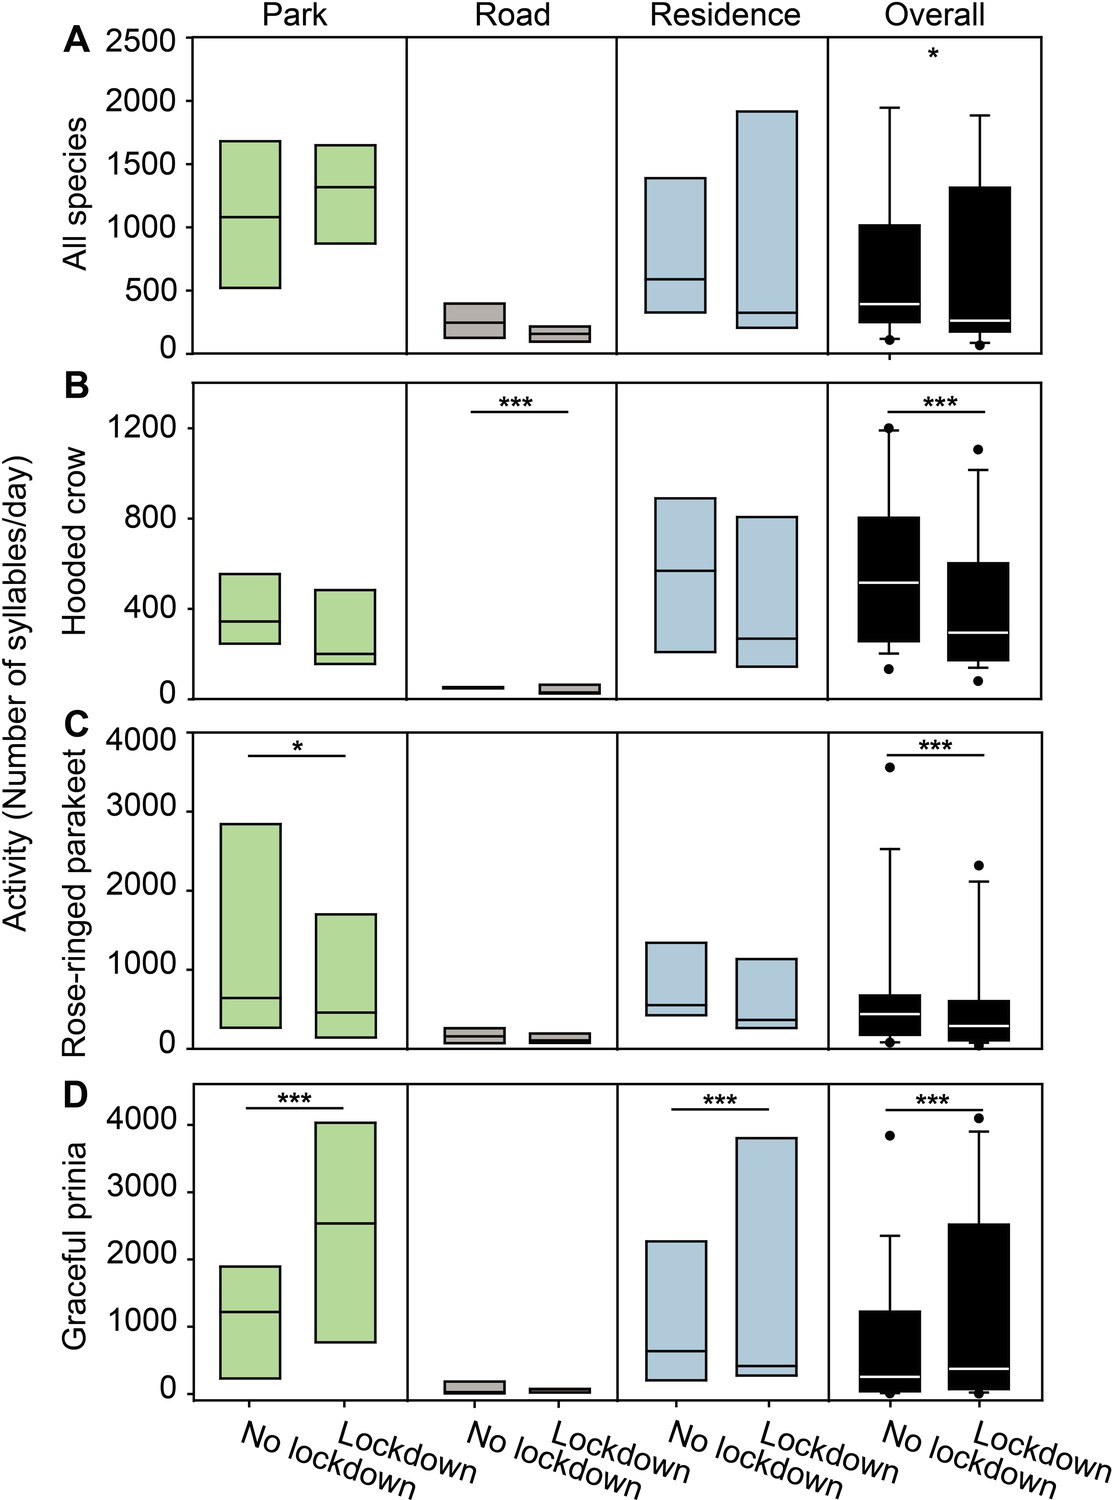
Activity of birds.
Boxplots show the activity of (A) all species, (B) Hooded crow, (C) Rose-ringed parakeet, and (D) Graceful prinia for each site category during no lockdown and during lockdown. Green box plot: park; Grey box plot: road; Blue box plot: residence; Black box plot: overall. Box plot lower and upper box boundaries show the 25th and 75th percentiles, respectively, with the median inside. The lower and upper error lines depict the 10th and 90th percentiles, respectively. Outliers of the data are shown as black dots. Asterisks indicate significant differences between no lockdown and lockdown periods. *p<0.05, **p<0.01, ***p<0.001.
Figure 3 with 2 supplements
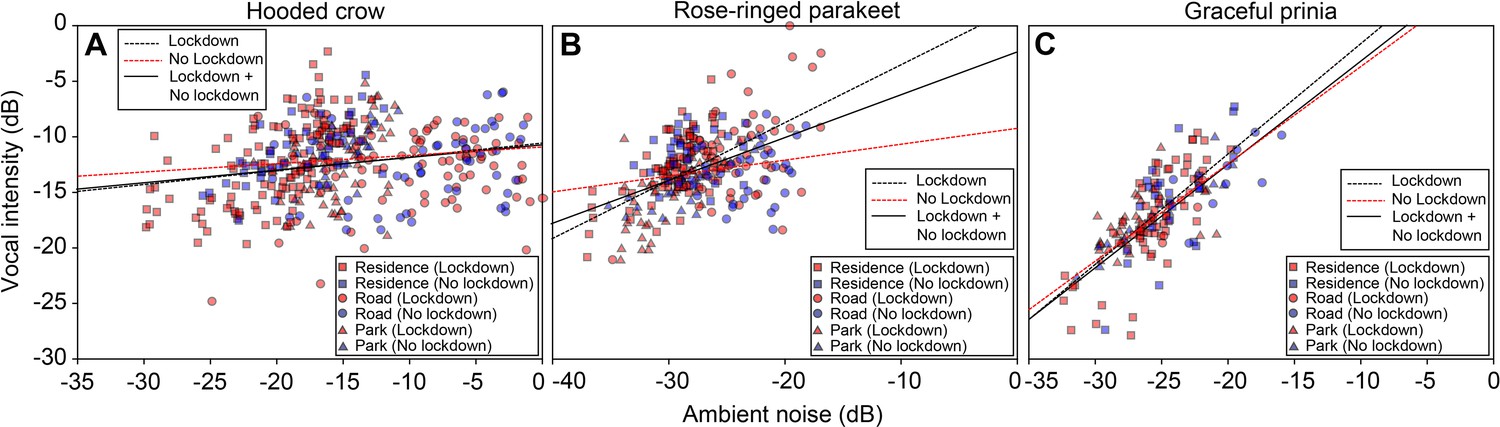
Vocal intensity as a function of ambient noise (normalized to maximum) for (A) Hooded crows.
(B) Rose-ringed parakeets and (C) Graceful prinia. Red colors and blue colors represent data collected during no lockdown and during lockdown, respectively (each point represents the average over 1 day). Square: Residences; Circle: Roads; Triangle: Parks. The lines represent regression lines (solid line: Lockdown and No lockdown together; black dashed line: Lockdown; red black dashed line: No lockdown). The equations of the linear fits: y=0.124 x – 10.554 (Hooded crow; Lockdown; n=264); y=0.075 x – 10.877 (Hooded crow; No lockdown; N=119); y=0.521 x+1.705 (Rose-ringed parakeet; Lockdown; n=184); y=0.143 x – 9.204 (Rose-ringed parakeet; No lockdown; n=82); y=0.993 x+8.354 (Graceful prinia; Lockdown; n=108); y=0.876 x+5.110 (Graceful prinia; No lockdown; n=49). There were significant and positive relationships between ambient noise levels and vocal intensity for all bird species (LMM, Hooded crows: n=448; t=7.054, p<0.0001; Rose-ringed parakeets: n=266; t=7.772, p<0.0001; Graceful prinia: n=157; t=9.449, p<0.0001).
Figure 3—figure supplement 1
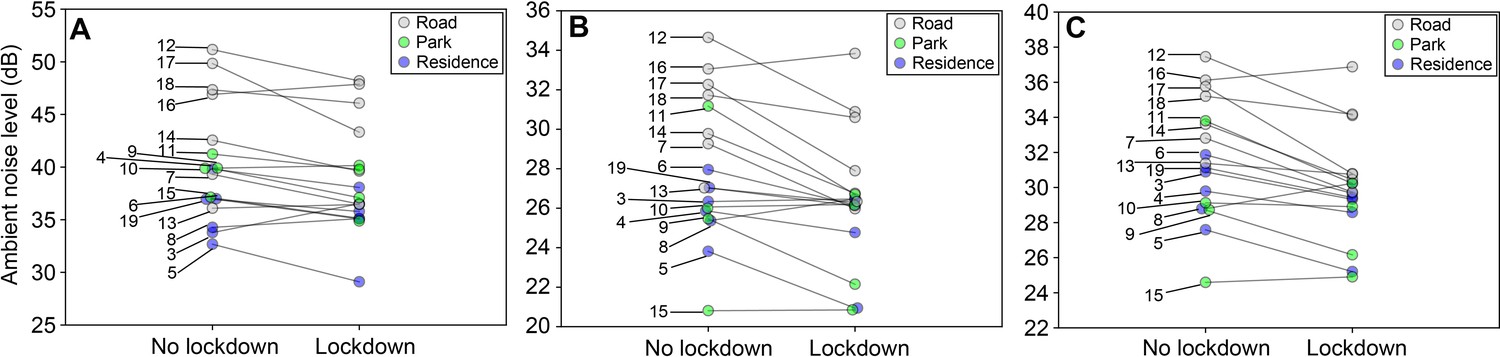
The ambient noise level (dB) between no lockdown period and lockdown period.
Figure 3—figure supplement 2
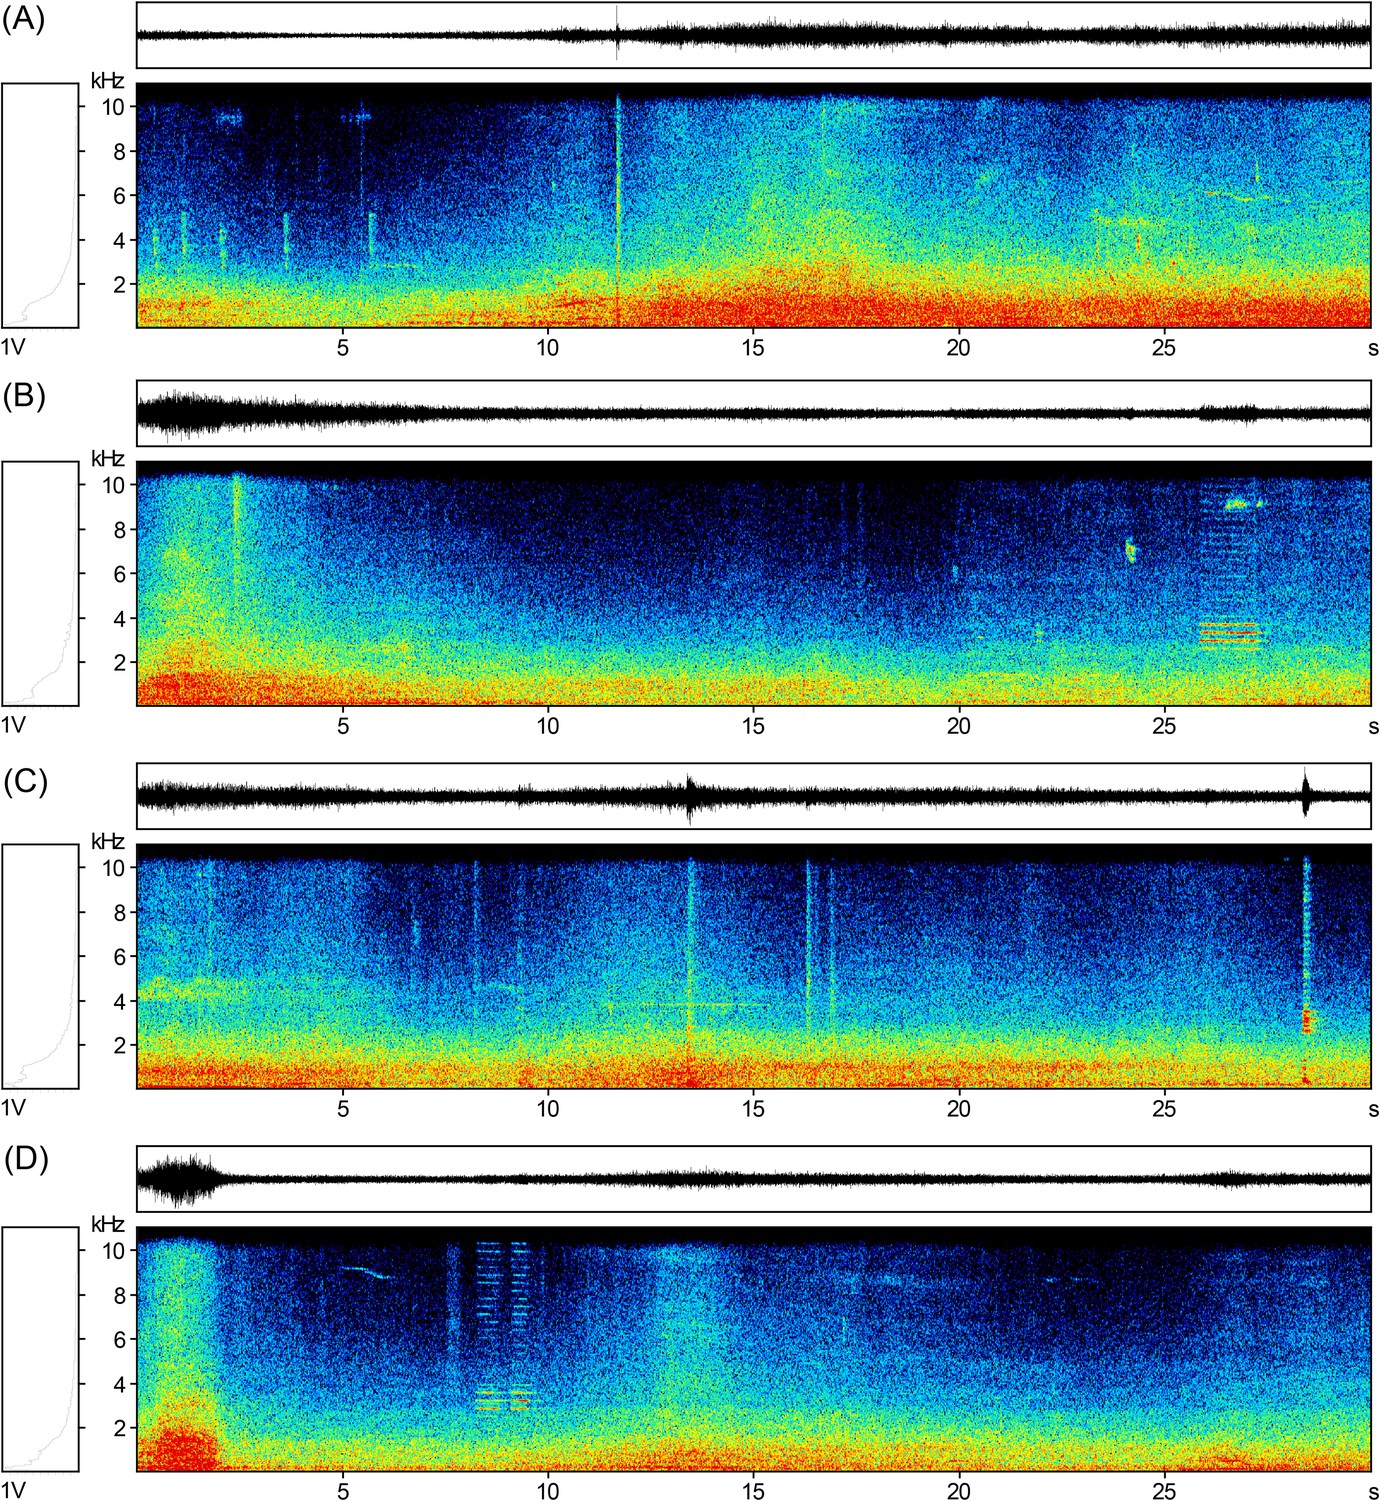
The examples of different types of noise.
(A-C) Car noise; (D) Motorcycle noise. Oscillograms (above), power spectrum (left) and spectrograms (below).
Author response image 1
Videos
Video 1
Dynamic illustrations of the changes in crow’s activity.
Video 2
Dynamic illustrations of the changes in parakeet’s activity.
Video 3
Dynamic illustrations of the changes in prinia’s activity.
Tables
Table 1
Effects of predictor variables on birds’ activity based on generalized and general linear mixed models (GLMM and LMM).
Estimates were calculated in % per day for the following units: Temperature – per degree, Noise – per dB, Human activity – per 1 talking event, Lockdown related parameter – per existence of the lockdown (yes/no).
| Species | Dependent variable | Predictors | Estimate | z | p | 95% CI | Percent |
|---|---|---|---|---|---|---|---|
| All species | Activity- Number of events/day | (Intercept) | 7.850 | 22.541 | <0.001 | - | - |
| Bird_species | –0.623 | –84.742 | <0.001 | - | 46.367 | ||
| Lockdown_status | –0.404 | –2.623 | 0.009 | - | 33.236 | ||
| Human_activity | –0.00001 | –0.539 | 0.590 | - | 0.001 | ||
| Noise | –0.062 | –20.625 | <0.001 | - | 6.012 | ||
| Temperature | 0.045 | 4.194 | <0.001 | - | 4.649 | ||
| Site_category_residence | –0.739 | –2.764 | 0.006 | - | 53.286 | ||
| Site_category_road | –0.923 | –3.558 | <0.001 | - | 62.075 | ||
| Lockdown_status Count_down* | 0.008 | 3.820 | <0.001 | - | 0.835 | ||
| Lockdown_status Site_category_residence* | –0.072 | –3.435 | 0.001 | - | 7.294 | ||
| Lockdown_status Site_category_road* | 0.094 | 4.074 | <0.001 | - | 10.447 | ||
| Lockdown_status Noise* | –0.007 | –2.723 | 0.006 | - | 0.746 | ||
| Lockdown_status Human_activity* | 0.0003 | 14.074 | <0.001 | - | 0.032 | ||
| Bird_species Lockdown_status* | 0.253 | 29.155 | <0.001 | - | 31.379 | ||
| †Activity variability- CV of the number of events/day | (Intercept) | –0.963 | 5.975 | <0.001 | −1.282,–0.618 | - | |
| Bird_species | 0.208 | 16.877 | <0.001 | 0.184, 0.233 | - | ||
| Lockdown_status | 0.565 | 4.238 | <0.001 | 0.269, 0.839 | - | ||
| Noise | 0.025 | 8.554 | <0.001 | 0.0198, 0.030 | - | ||
| Site_category_residence | 0.170 | 2.403 | 0.016 | 0.030, 0.310 | - | ||
| Site_category_road | 0.224 | 3.238 | 0.001 | 0.089, 0.361 | - | ||
| Human_activity | –0.00004 | 1.150 | 0.250 | –0.0001, 0.00003 | - | ||
| Temperature | –0.010 | 3.394 | 0.001 | −0.016,–0.004 | - | ||
| Bird_species Lockdown_status* | –0.057 | 3.888 | <0.001 | −0.086,–0.028 | - | ||
| Count_down Lockdown_status* | –0.001 | 1.503 | 0.133 | –0.003, 0.0004 | - | ||
| Lockdown_status Noise* | –0.008 | 3.157 | 0.002 | −0.013,–0.003 | - | ||
| Lockdown_status Human_activity* | –0.00005 | 1.308 | 0.191 | –0.00018, 0.00003 | - | ||
| Lockdown_status Site_category_residence* | 0.023 | 0.641 | 0.522 | –0.048, 0.098 | - | ||
| Lockdown_status Site_category_road* | 0.036 | 0.995 | 0.320 | –0.042, 0.106 | - | ||
| Hooded crow | †Activity- Number of events/day | (Intercept) | 7.475 | 20.026 | <0.001 | 6.743, 8.206 | - |
| Lockdown_status | –0.647 | 4.508 | <0.001 | −0.928,–0.366 | 47.639 | ||
| Noise | –0.045 | 12.324 | <0.001 | −0.052,–0.038 | 4.400 | ||
| Site_category_residence | –0.790 | 2.374 | 0.018 | −1.443,–0.1386 | 54.616 | ||
| Site_category_road | –0.738 | 2.284 | 0.022 | −1.372,–0.105 | 52.193 | ||
| Human_activity | –0.0001 | 3.376 | 0.001 | −0.0002,–0.00004 | 0.010 | ||
| Count_down Lockdown_status* | 0.017 | 6.542 | <0.001 | 0.012, 0.022 | 1.749 | ||
| Lockdown_status Site_category_residence* | –0.064 | 2.288 | 0.022 | −0.119,–0.009 | 6.385 | ||
| Lockdown_status Site_category_road* | 0.221 | 7.606 | <0.001 | 0.164, 0.278 | 25.722 | ||
| Lockdown_status Human_activity* | 0.0004 | 10.456 | <0.001 | 0.0003, 0.0004 | 0.042 | ||
| Lockdown_status Noise* | –0.002 | 0.682 | 0.495 | –0.009, 0.0056 | 0.212 | ||
| Temperature | –0.009 | 0.645 | 0.519 | –0.037, 0.019 | 0.959 | ||
| †Activity variability- CV of the number of events/day | (Intercept) | –1.447 | 7.373 | <0.001 | −1.827,–1.023 | - | |
| Lockdown_status | 0.889 | 5.473 | <0.001 | 0.534, 1.217 | - | ||
| Noise | 0.033 | 9.604 | <0.001 | 0.026, 0.040 | - | ||
| Site_category_residence | 0.293 | 2.958 | 0.003 | 0.095, 0.486 | - | ||
| Site_category_road | 0.236 | 2.479 | 0.013 | 0.048, 0.423 | - | ||
| Human_activity | 0.00004 | 0.999 | 0.318 | –0.00005, 0.0001 | - | ||
| Lockdown_status Noise* | –0.015 | 4.618 | <0.001 | −0.021,–0.008 | - | ||
| Lockdown_status Human_activity | –0.0001 | 2.959 | 0.003 | −0.0002,–0.00005 | - | ||
| Temperature | –0.003 | 1.074 | 0.283 | –0.010, 0.003 | - | ||
| Count_down Lockdown_status* | –0.001 | 1.032 | 0.302 | –0.003, 0.001 | - | ||
| Lockdown_status Site_category_residence* | 0.045 | 1.000 | 0.317 | –0.0414, 0.141 | - | ||
| Lockdown_status Site_category_road* | –0.009 | 0.204 | 0.838 | –0.095, 0.082 | - | ||
| Rose-ringed parakeet | †Activity- Number of events/day | (Intercept) | 6.320 | 11.848 | <0.001 | 5.272, 7.373 | - |
| Lockdown_status | –0.106 | 0.379 | 0.704 | –0.656, 0.443 | 10.058 | ||
| Noise | –0.061 | 10.900 | <0.001 | −0.072,–0.050 | 5.918 | ||
| Site_category_residence | –0.493 | 1.175 | 0.240 | –1.314, 0.329 | 38.921 | ||
| Site_category_road | –1.201 | 2.949 | 0.003 | −1.999,–0.403 | 69.911 | ||
| Human_activity | –0.0003 | 6.891 | <0.001 | −0.0004,–0.0002 | 0.030 | ||
| Temperature | 0.060 | 3.990 | <0.001 | 0.031, 0.089 | 6.307 | ||
| Lockdown_status Noise | –0.016 | 3.268 | 0.001 | −0.026,–0.006 | 1.635 | ||
| Lockdown_status Site_category_residence | 0.408 | 9.968 | <0.001 | 0.328, 0.488 | 52.396 | ||
| Lockdown_status Site_category_road | 0.574 | 13.488 | <0.001 | 0.491, 0.658 | 81.412 | ||
| Lockdown_status Human_activity | 0.001 | 15.304 | <0.001 | 0.0006, 0.0008 | 0.106 | ||
| Count_down Lockdown_status | 0.004 | 1.234 | 0.217 | –0.002, 0.011 | 0.429 | ||
| †Activity variability- CV of the number of events/day | (Intercept) | –0.460 | 3.225 | 0.001 | −0.751,–0.178 | - | |
| Lockdown_status | 0.249 | 2.775 | 0.006 | 0.065, 0.442 | - | ||
| Noise | 0.020 | 8.303 | <0.001 | 0.015, 0.025 | - | ||
| Site_category_residence | 0.090 | 1.054 | 0.292 | –0.078, 0.256 | - | ||
| Site_category_road | 0.196 | 2.376 | 0.018 | 0.032, 0.357 | - | ||
| Human_activity | 0.00001 | 0.419 | 0.675 | –0.00005, 0.00007 | - | ||
| Temperature | –0.007 | 2.331 | 0.020 | −0.012,–0.001 | - | ||
| Count_down Lockdown_status* | –0.003 | 4.333 | <0.001 | −0.005,–0.002 | - | ||
| Lockdown_status Site_category_residence* | –0.051 | 1.818 | 0.069 | –0.105, 0.005 | - | ||
| Lockdown_status Site_category_road* | –0.109 | 3.915 | <0.001 | −0.164,–0.053 | - | ||
| Lockdown_status Human_activity* | –0.0001 | 3.108 | 0.002 | −0.0002,–0.00004 | - | ||
| Lockdown_status Noise* | –0.002 | 0.866 | 0.387 | –0.008, 0.0033 | - | ||
| Graceful prinia | Activity- Number of events/day | (Intercept) | 3.314 | 2.245 | 0.025 | - | - |
| Lockdown_status | –0.352 | –0.595 | 0.552 | - | 29.672 | ||
| Human_activity | 0.00017 | 2.367 | 0.018 | - | 0.017 | ||
| Noise | –0.165 | –17.114 | <0.001 | - | 15.211 | ||
| Temperature | 0.365 | 6.533 | <0.001 | - | 44.051 | ||
| Site_category_residence | –1.012 | –1.440 | 0.150 | - | 64.287 | ||
| Site_category_road | –1.484 | –2.164 | 0.030 | - | 78.874 | ||
| Lockdown_status Count_down* | –0.104 | –14.979 | <0.001 | - | 10.174 | ||
| Lockdown_status Site_category_residence* | –0.062 | –1.159 | 0.247 | - | 6.252 | ||
| Lockdown_status Site_category_road* | –1.203 | –13.290 | <0.001 | - | 73.469 | ||
| Lockdown_status Noise* | 0.066 | 7.072 | <0.001 | - | 7.232 | ||
| Lockdown_status Human_activity* | 0.003 | 3.513 | <0.001 | - | 0.300 | ||
| †Activity variability- CV of the number of events/day | (Intercept) | 0.920 | 1.496 | 0.135 | –0.284, 2.100 | - | |
| Lockdown_status | –0.194 | 0.655 | 0.513 | –0.782, 0.425 | - | ||
| Noise | 0.018 | 1.823 | 0.068 | –0.002, 0.038 | - | ||
| Site_category_residence | 0.210 | 0.946 | 0.344 | –0.227, 0.643 | - | ||
| Site_category_road | 0.556 | 2.452 | 0.014 | 0.117, 1.009 | - | ||
| Temperature | –0.031 | 2.592 | 0.010 | −0.054,–0.007 | - | ||
| Count_down Lockdown_status* | 0.005 | 1.578 | 0.115 | –0.001, 0.011 | - | ||
| Lockdown_status Site_category_residence* | 0.172 | 1.461 | 0.144 | –0.058, 0.406 | - | ||
| Lockdown_status Site_category_road* | 0.274 | 2.089 | 0.037 | 0.0163, 0.532 | - | ||
| Lockdown_status Noise* | –0.005 | 0.403 | 0.687 | –0.029, 0.020 | - | ||
| Human_activity | –0.00004 | 0.437 | 0.662 | –0.0003, 0.0002 | - | ||
| Lockdown_status Human_activity* | 0.00007 | 0.394 | 0.694 | –0.0003, 0.0004 | - |
-
CV: coefficient of variance.
-
*
Interaction effect. 95% confidence intervals of the parameters that did not overlap zero are indicated in bold.
-
†
model average.
Table 2
Effects of predictor variables on the root mean square (RMS) and peak frequency in three bird species based on the linear mixed models (LMM).
| Species | Dependent variable | Predictors | Estimate | t | p |
|---|---|---|---|---|---|
| Hooded crow | RMS | Lockdown_status | 0.064 | 0.148 | 0.883 |
| Noise | 0.354 | 7.054 | <0.0001 | ||
| Peak frequency | Lockdown_status | –5.99E-04 | –0.601 | 0.552 | |
| Noise | 9.17E-05 | 0.728 | 0.468 | ||
| Rose-ringed parakeet | RMS | Lockdown_status | 1.065 | 3.290 | 0.001 |
| Noise | 0.470 | 7.772 | <0.0001 | ||
| Peak frequency | Lockdown_status | 3.93E-03 | 3.235 | 0.001 | |
| Noise | 1.34E-04 | 0.783 | 0.435 | ||
| Graceful prinia | RMS | Lockdown_status | 0.208 | 0.475 | 0.635 |
| Noise | 0.844 | 9.449 | <0.0001 | ||
| Peak frequency | Lockdown_status | 1.31E-04 | 0.083 | 0.935 | |
| Noise | 2.40E-03 | 0.928 | 0.357 |
Additional files
-
Source data 1
The bird species, site category, date, bird activity, lockdown type, nose levels, temperature and human activity.
The data for Figure 2A-D and for Figure 2—figure supplement 6A-D.
- https://cdn.elifesciences.org/articles/88064/elife-88064-data1-v1.xlsx
-
Source data 2
The bird species, date, vocal intensity, vocal frequency, lockdown type and nose levels.
The data for Figure 3A-C, and for Figure 3—figure supplement 1A-C.
- https://cdn.elifesciences.org/articles/88064/elife-88064-data2-v1.xlsx
-
Source data 3
The bird species, site category, date, bird activity, lockdown type and human activity.
The data for Figure 2—figure supplement 1A-D.
- https://cdn.elifesciences.org/articles/88064/elife-88064-data3-v1.xlsx
-
Source data 4
The bird species, site category, date, bird activity, lockdown type and human activity.
The data for Figure 2—figure supplement 2A-D.
- https://cdn.elifesciences.org/articles/88064/elife-88064-data4-v1.xlsx
-
Source data 5
The bird species, site category, date, bird activity, lockdown type and human activity.
The data for Figure 2—figure supplement 3A-D.
- https://cdn.elifesciences.org/articles/88064/elife-88064-data5-v1.xlsx
-
Source data 6
The bird species, site category, date, bird activity, lockdown type and human activity.
The data for Figure 2—figure supplement 4A-D.
- https://cdn.elifesciences.org/articles/88064/elife-88064-data6-v1.xlsx
-
Source data 7
The bird species, site category, date, bird activity, lockdown type and human activity.
The data for Figure 2—figure supplement 5A-D.
- https://cdn.elifesciences.org/articles/88064/elife-88064-data7-v1.xlsx
-
MDAR checklist
- https://cdn.elifesciences.org/articles/88064/elife-88064-mdarchecklist1-v1.pdf
-
Supplementary file 1
The sampling time, sampling site, bird activity, statistical results for bird activity and activity variability.
- https://cdn.elifesciences.org/articles/88064/elife-88064-supp1-v1.docx
Download links
A two-part list of links to download the article, or parts of the article, in various formats.
Downloads (link to download the article as PDF)
Open citations (links to open the citations from this article in various online reference manager services)
Cite this article (links to download the citations from this article in formats compatible with various reference manager tools)
Species and habitat specific changes in bird activity in an urban environment during Covid 19 lockdown
eLife 12:RP88064.
https://doi.org/10.7554/eLife.88064.3


