Deciphering deep-sea chemosynthetic symbiosis by single-nucleus RNA-sequencing
- Center of Deep-Sea Research, Institute of Oceanology, Chinese Academy of Sciences, China
- Laboratory for Marine Biology and Biotechnology, Qingdao Marine Science and Technology Center, Laoshan Laboratory, China
- Southern Marine Science and Engineering Guangdong Laboratory (Guangzhou), China
- Department of Ocean Science, Hong Kong University of Science and Technology, China
- Key Laboratory of Conservation and Application in Biodiversity of South China, School of Life Sciences, Guangzhou University, China
- State Key Laboratory of Primate Biomedical Research, Institute of Primate Translational Medicine, Kunming University of Science and Technology, China
- South China Sea Institute of Oceanology, Chinese Academy of Sciences, China
- University of Chinese Academy of Sciences, China
Figures
Figure 1 with 4 supplements
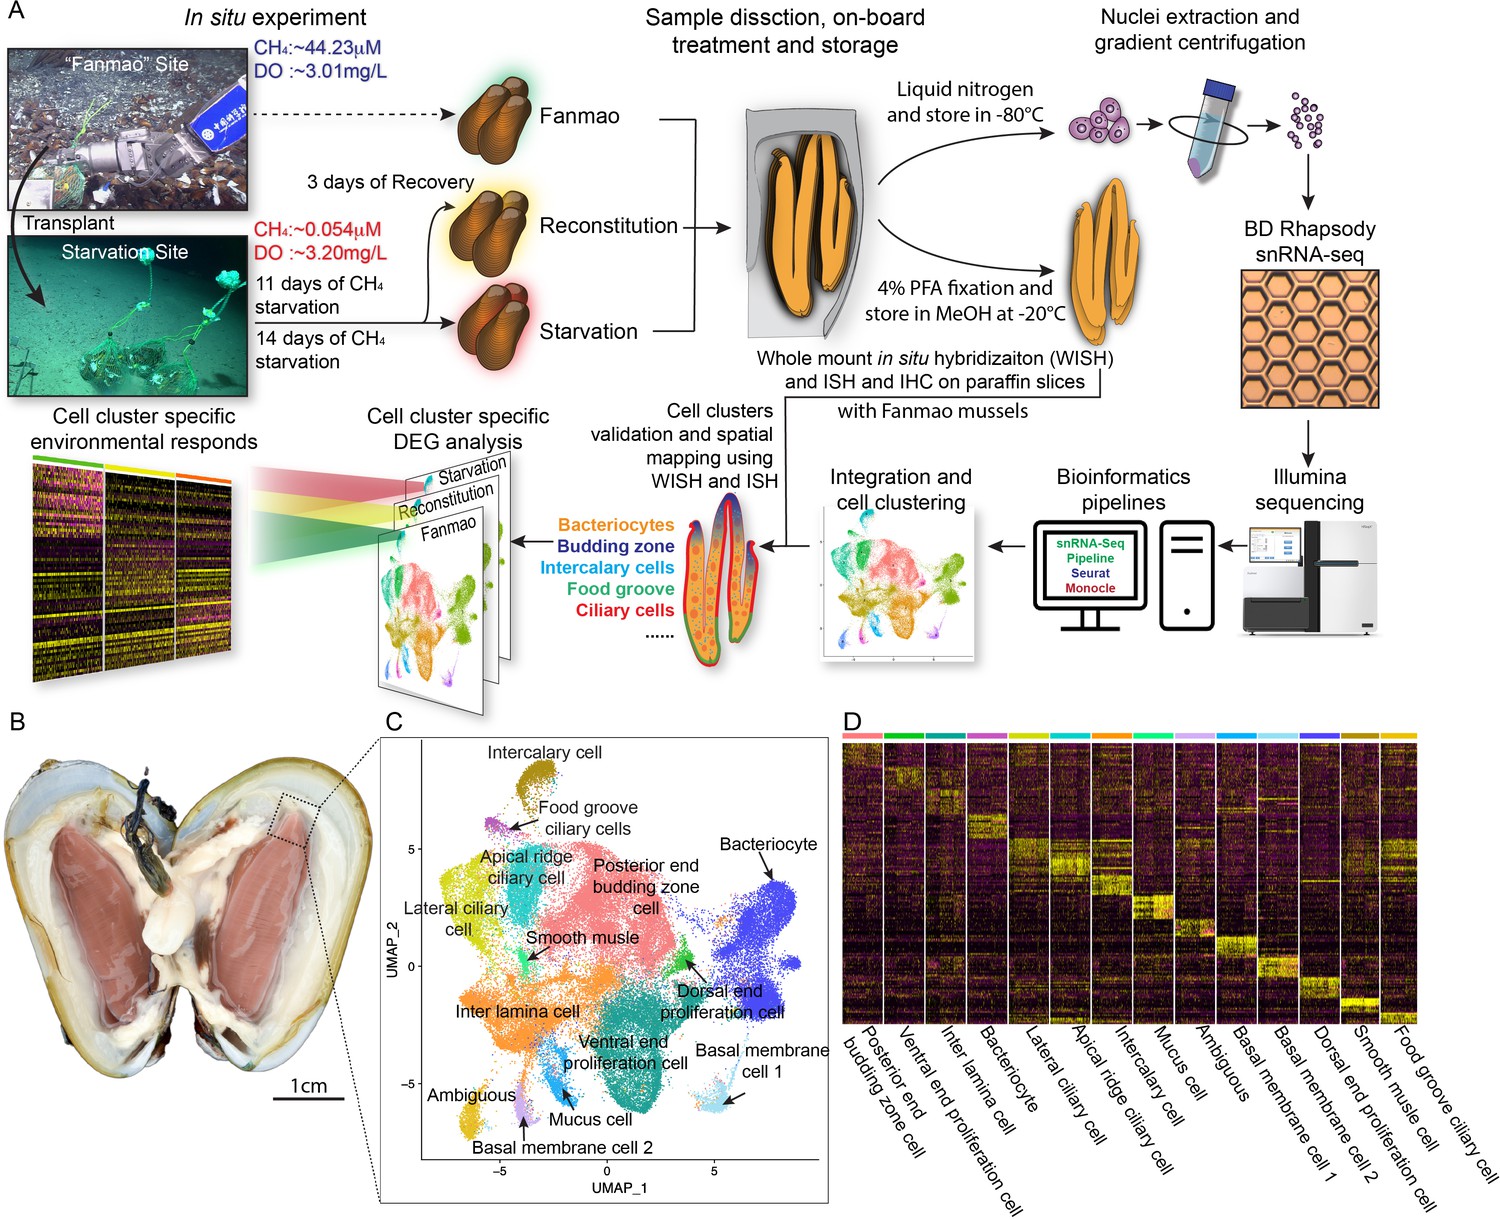
Identification of 14 cell types in the gill of deep-sea symbiotic mussel Gigantidas platifrons.
(A) Overall experimental scheme describing the deep-sea in situ transplant experiment, the sample preparation procedures, and the single-cell analysis and validation pipeline. Three G. platifrons samples were included in the present study: 'Fanmao,' starvation, and reconstitution. The cell nucleus was extracted from each sample, which included a pool of gill posterior tip of three mussels. The snRNA-seq libraries were constructed according to the BD Rhapsody single-nuclei 3´ protocol. Cell population-specific markers were validated by whole-mount in situ hybridisation (WISH) and in situ hybridisation (ISH). (B) The image shows the posterior end of the gill of G. platifrons. (C) Uniform Manifold Approximation and Projection (UMAP) representation of G. platifrons gill single cells. Cell clusters are coloured and distinctively labelled. (D) Heat map profile of markers in each cluster. The colour gradient represents the expression level of every single cell.
Figure 1—figure supplement 1

Image showing the gill tissues of the coastal shallow-water mussel Modiolus philippinarum and deep-sea chemosynthetic mussel Gigantidas platifrons.
Compared with the thin gill tissue of M. philippinarum, the gill filaments of G. platifrons are noticeably expanded (scale bar = 1 cm).
Figure 1—figure supplement 2
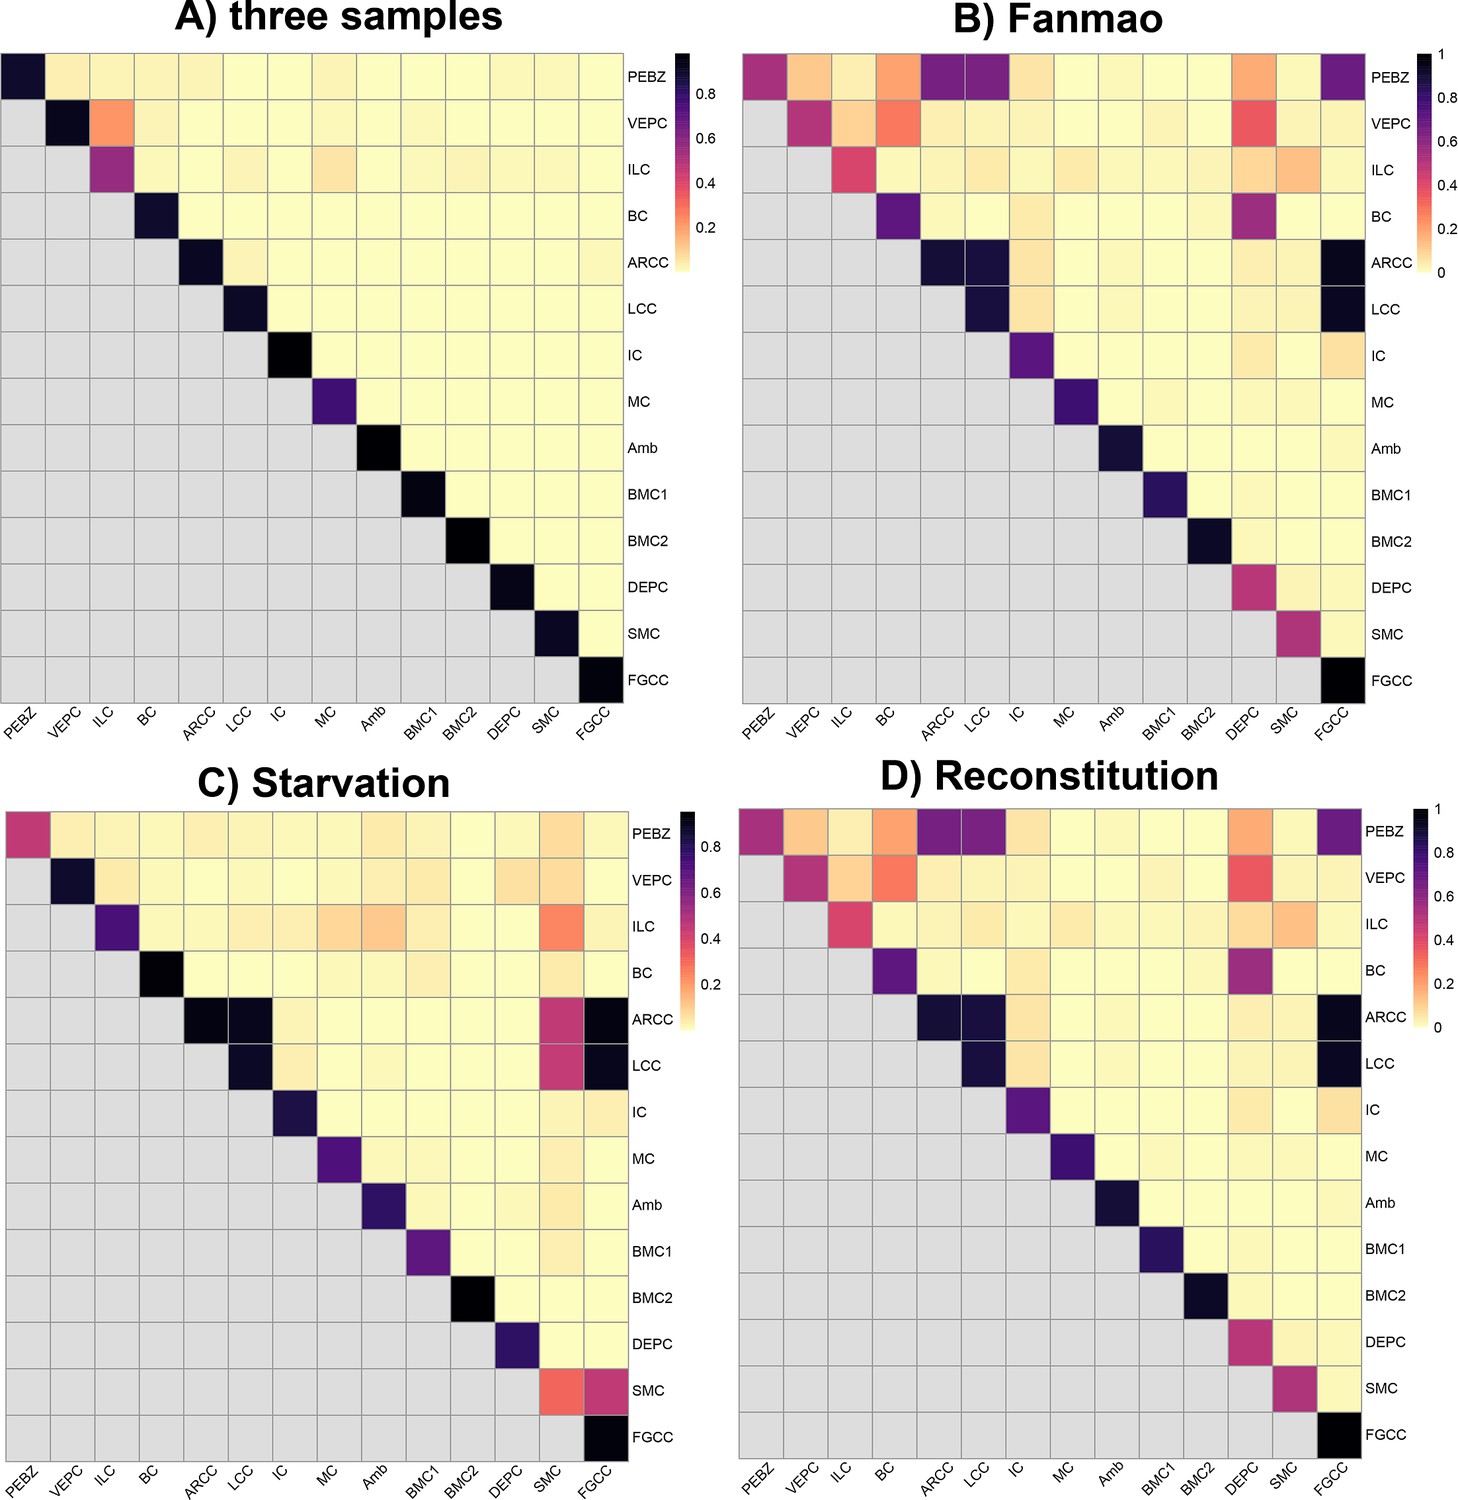
Heat maps of co-assignment probabilities of bootstrap sampling estimated for recognised clusters using cells in all three samples (A) and using cells in individual sample of Fanmao (B), starvation, (C) and reconstitution (D).
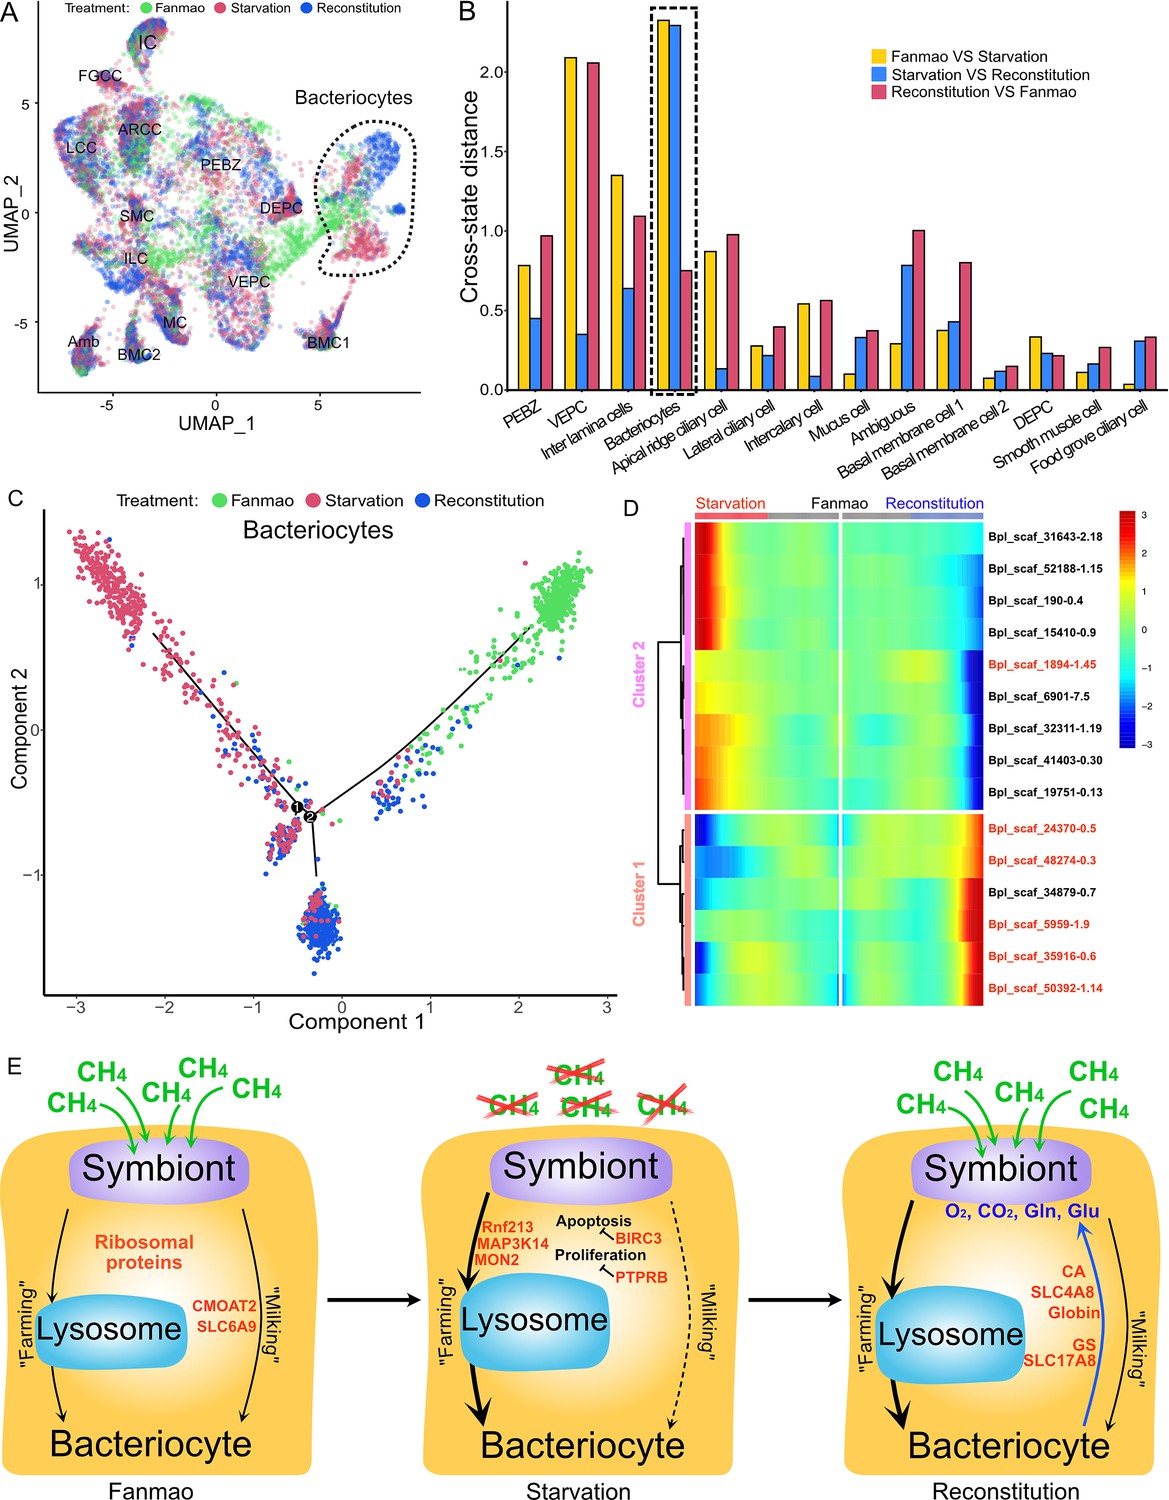
PEBZ: posterior end budding zone cell; VEPC: ventral end proliferation cell; ILC: inter lamina cell; BC: bacteriocyte; ARCC: apical ridge ciliary cell; LCC: lateral ciliary cell; IC: intercalary cell; MC: mucus cell; Amb: ambiguous cell; BMC1: basal membrane cell 1; BMC2: basal membrane cell 2; DEPC: dorsal end proliferation cell; SMC: smooth muscle cell; FGCC: food groove ciliary cell.
Figure 1—figure supplement 3
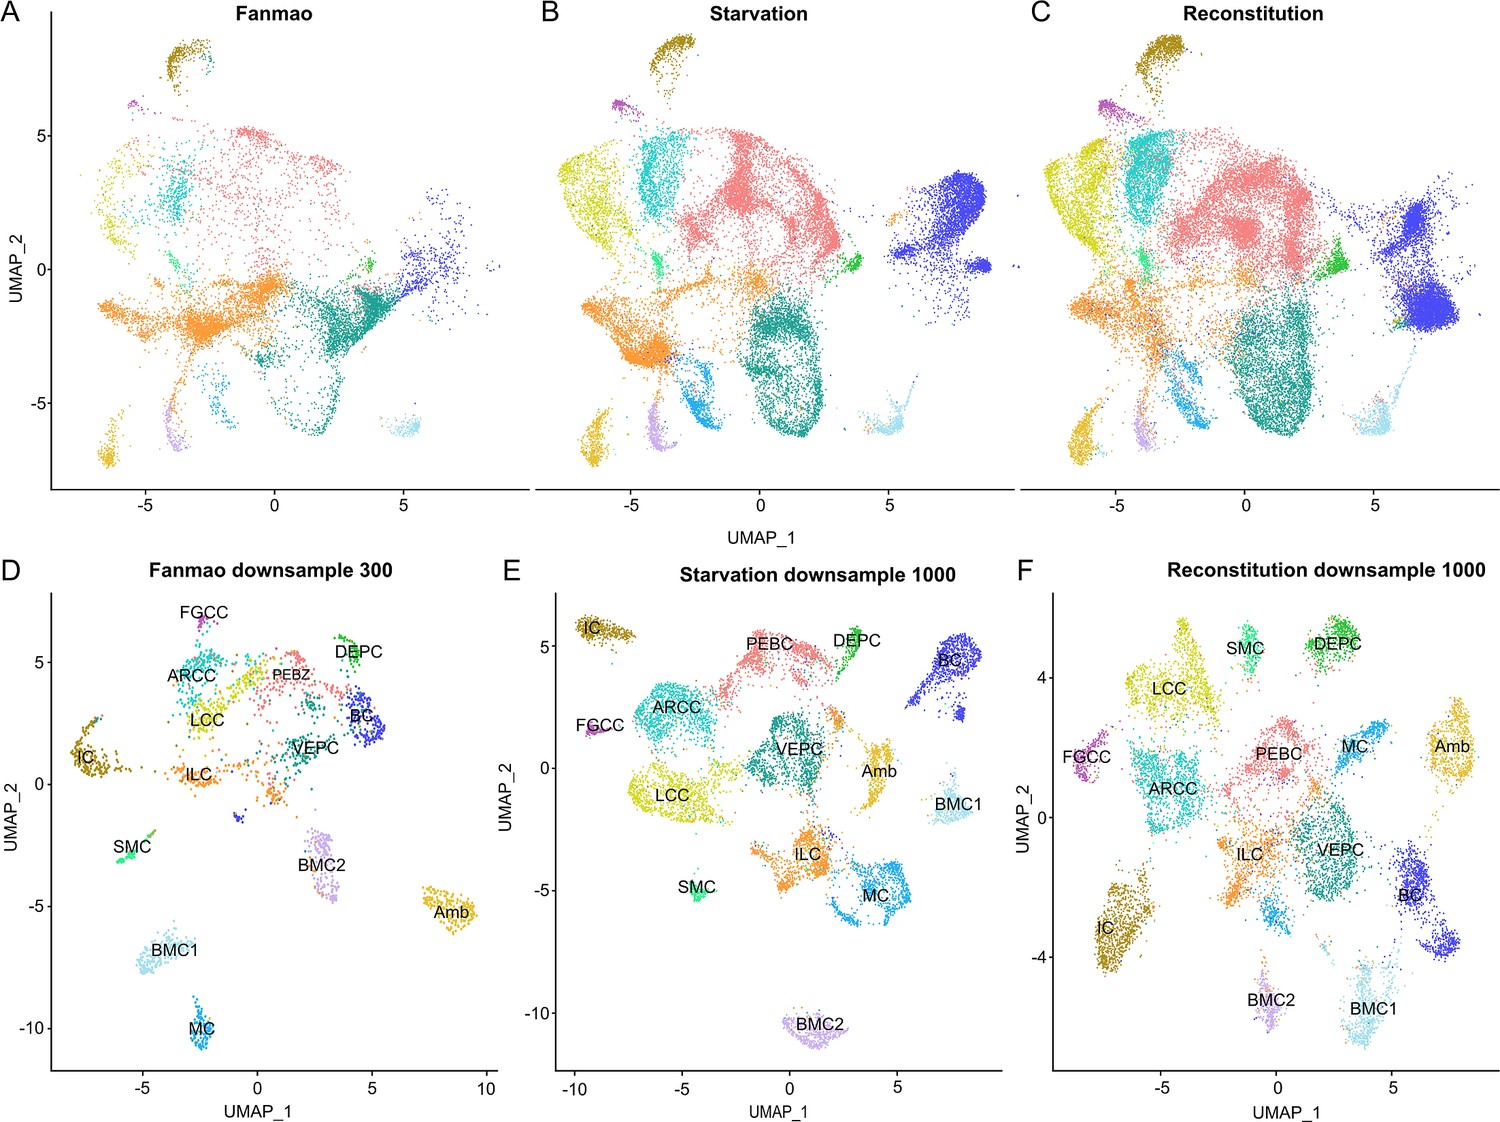
Uniform Manifold Approximation and Projection (UMAP) plots showing distribution patterns of 14 clusters in Fanmao, starvation, and reconstitution states.
(A–C) show a representation of cells per cluster in each individual state when analysing all three samples together; (D–F) show a representation of cells in each cluster when analysing UMAP for each sample individually.
Figure 1—figure supplement 4
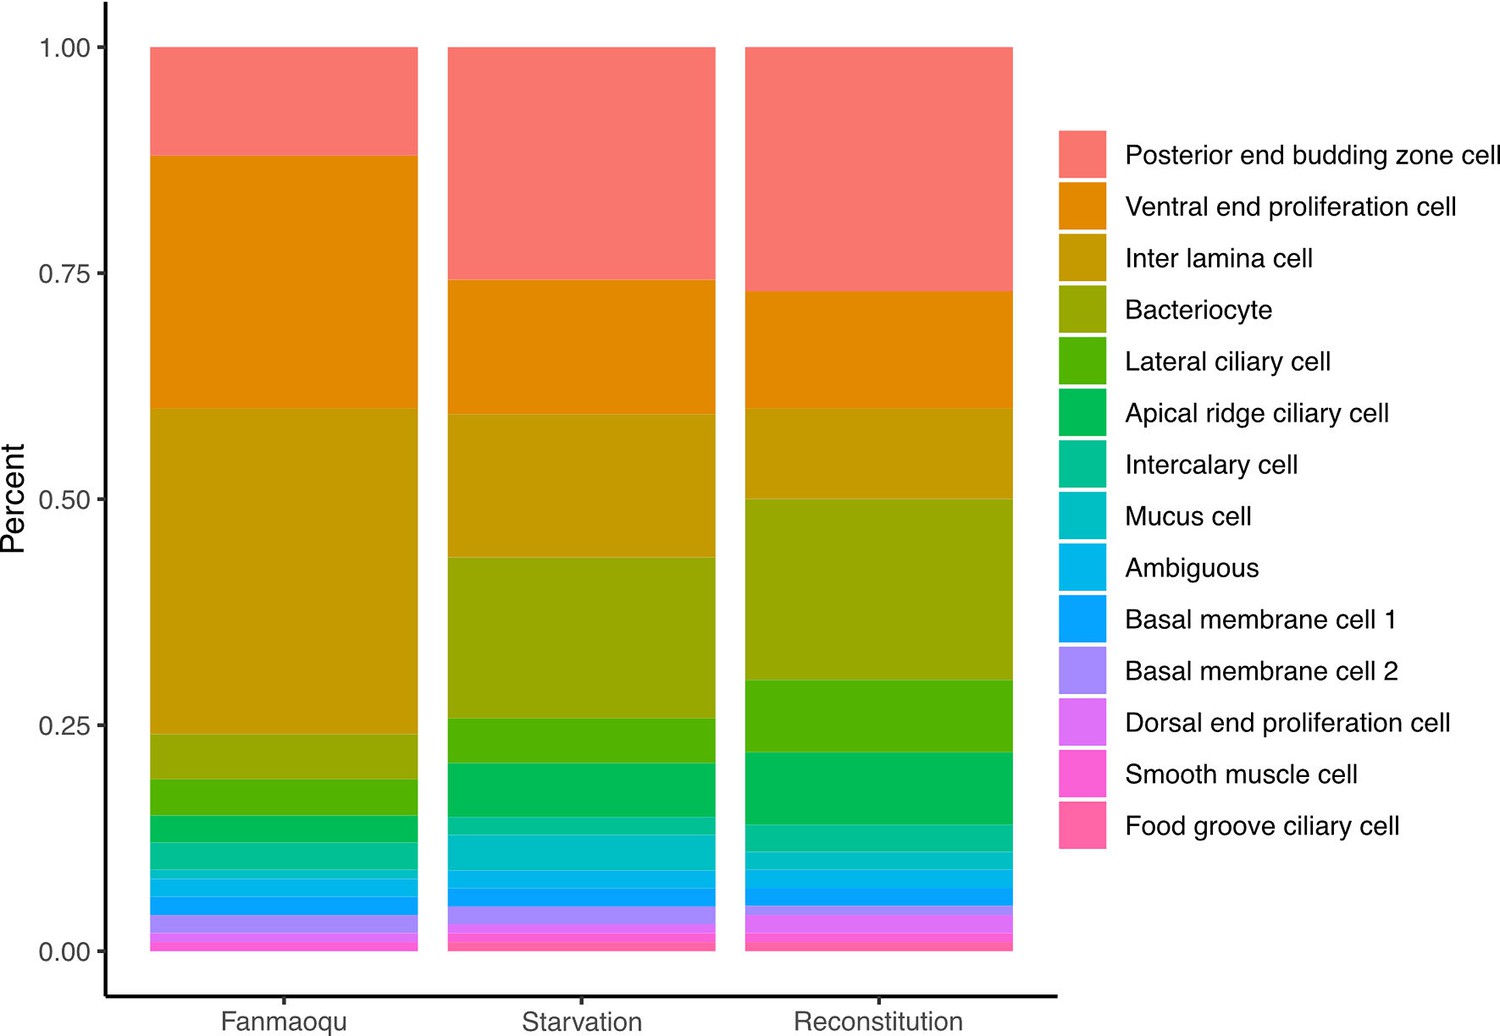
Stacked bar plots showing the percentages of cells per cluster in each sample (Fanmao, starvation and reconstitution).
Figure 2 with 1 supplement
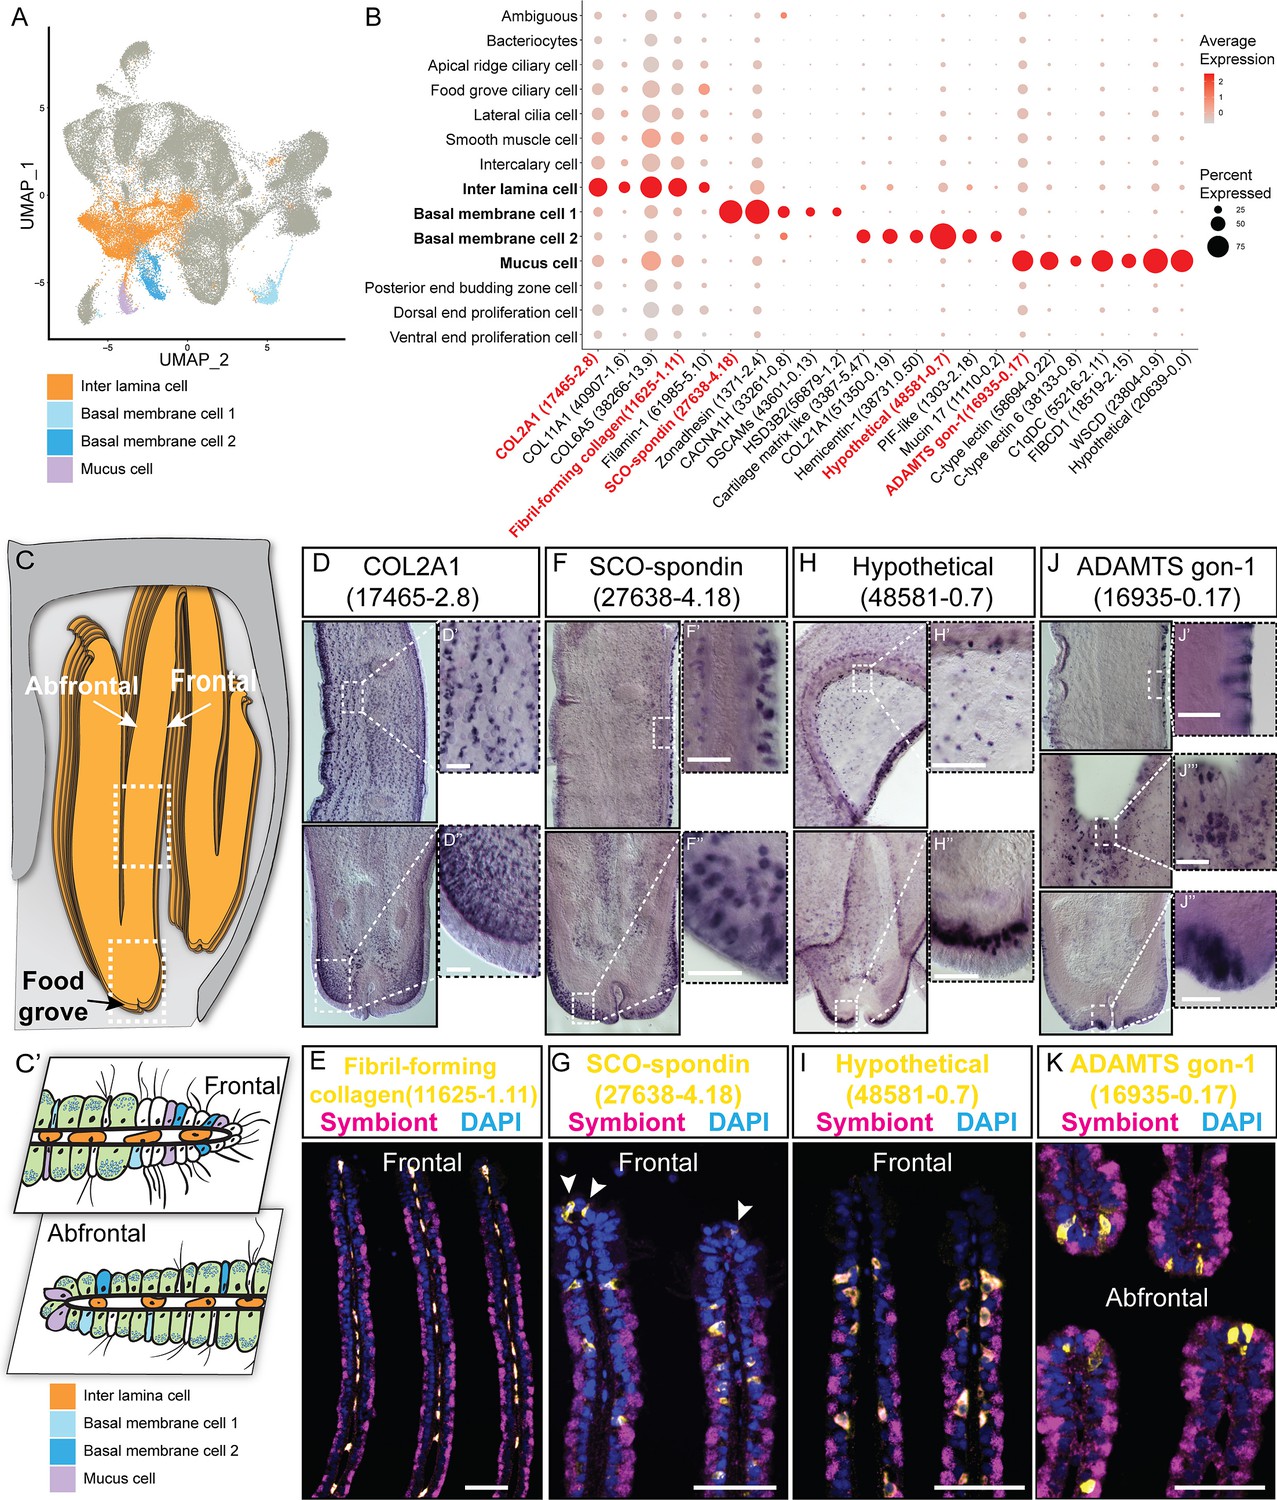
Supportive cell populations of G. platifrons gill.
(A) Uniform Manifold Approximation and Projection (UMAP) representation of the four supportive cell populations. (B) Expression profiles of the cell markers that are specific or enriched in the supportive cell populations. The sizes of the circles represent the percentages of cells in those clusters that expressed a specific gene. Genes shown in red were validated by whole-mount in situ hybridisation (WISH) or double fluorescent in situ hybridisation (FISH). (C, C') Schematics demonstrating the overall structural (C) and supportive cell distribution (C'). (D, F, H, J) WISH characterisation of the selected representative cell population markers. (E, G, I, K) Double FISH characterisation of the selected representative cell population markers. The white arrowheads in (G) indicate the BMC1 cells locates at the outer rim of gill slice. Scale bar: 50 µm.
Figure 2—figure supplement 1
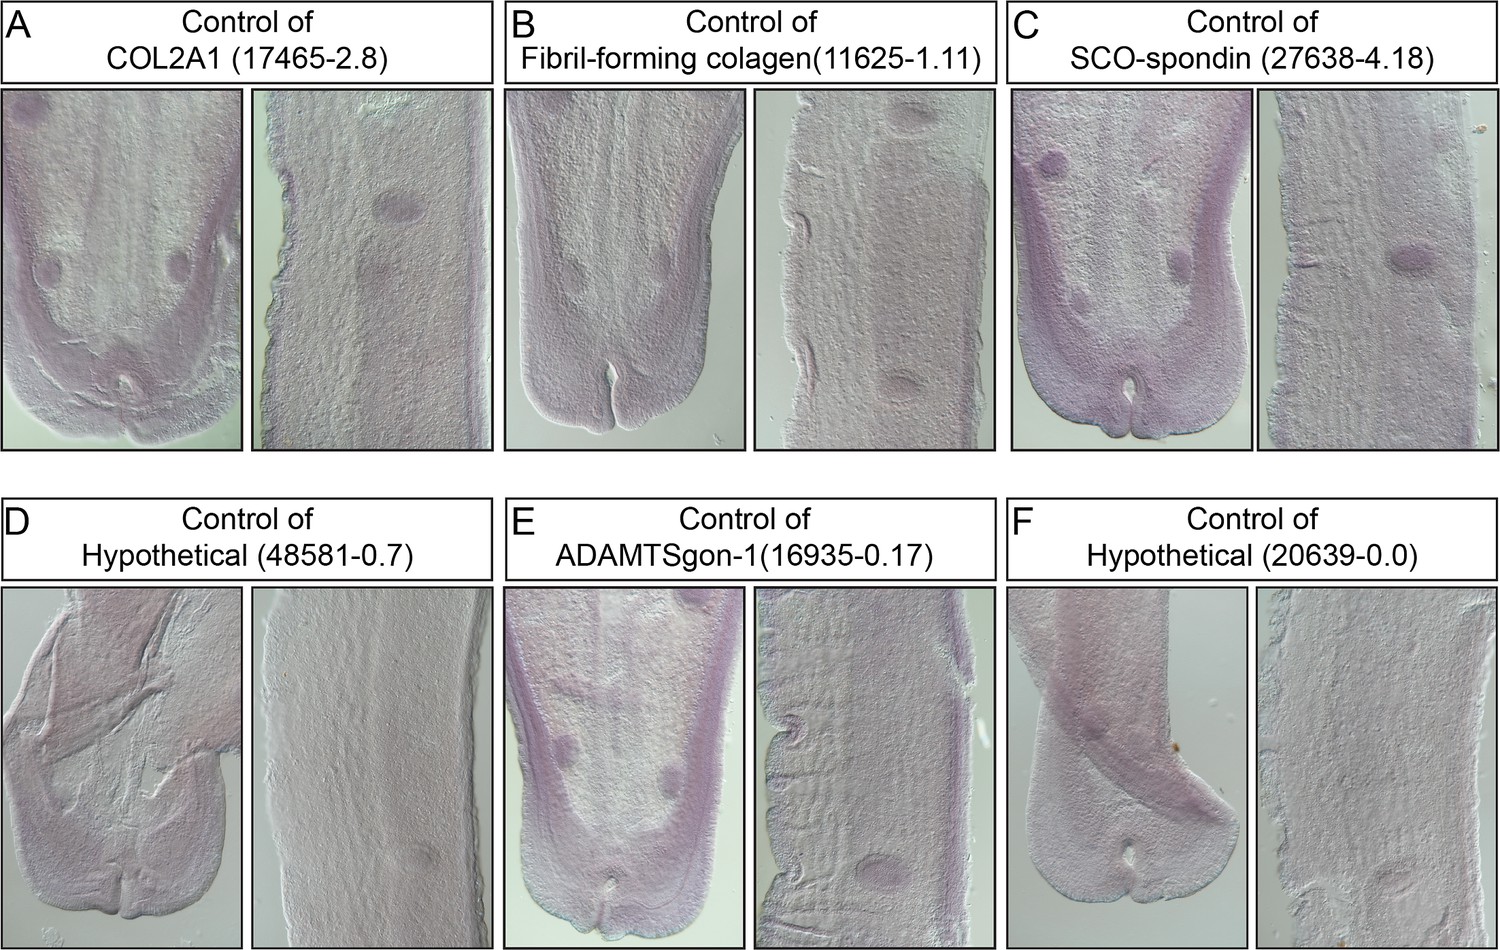
Control hybridisation of the supportive cell markers.
(A) The control hybridisaion of Bpl_scaf_17465-2.8 (COL21A). (B) The control hybridisation of Bpl_scaf_11625-1.11 (Fibril-forming colagen). (C) The control hybridisation of Bpl_scaf_27638-4.18 (SOC-spondin). (D) The control hybridisation Bpl_scaf_48581-0.7 (Hypothetical protein). (E) The control hybridisation of Bpl_scaf_16938-0.17 (ADAMTSgon-1). (F) The control hybrididisation of Bpl_scaf_206309-0.0 (Hypothetical protein). The left and right images of each panel are the tip and mid part of a gill slice, respectively.
Figure 3 with 4 supplements
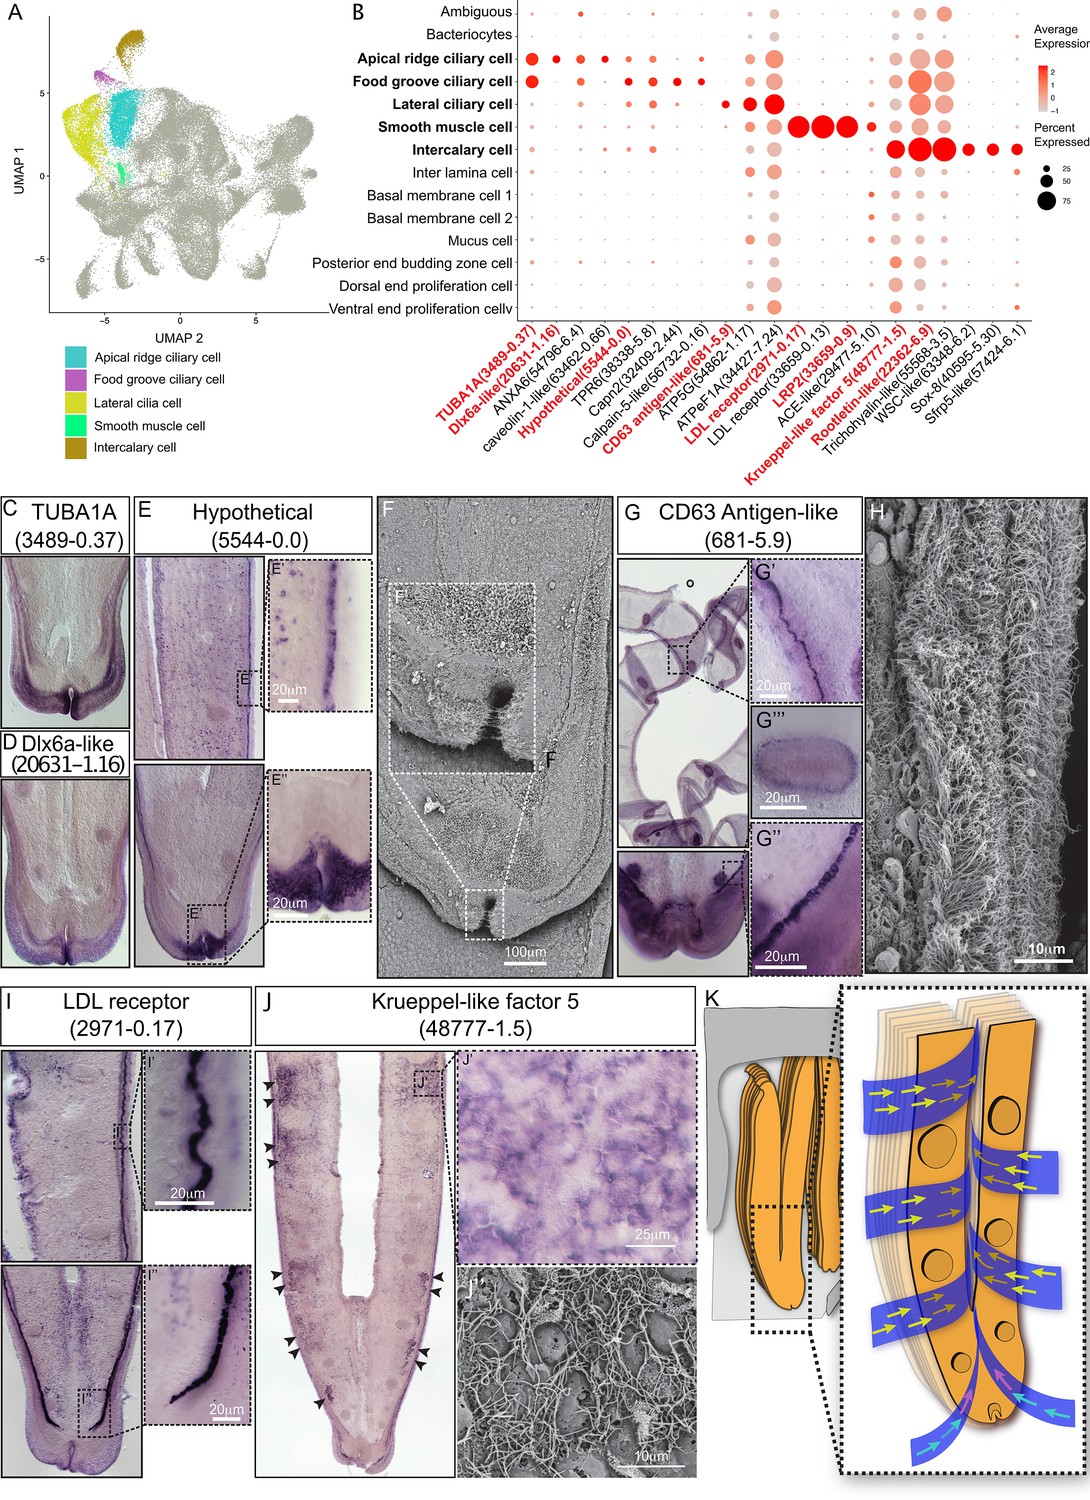
Ciliary cell populations of G. platifrons gill.
(A) Uniform Manifold Approximation and Projection (UMAP) representation of the four ciliary cell populations and potential smooth muscle cell population. (B) Expression profiles of the cell markers that are specific or enriched in the ciliary cell populations. The sizes of the circles represent the percentages of cells in those clusters that expressed a specific gene. The genes shown in red were validated by whole-mount in situ hybridisation (WISH) or double fluorescent in situ hybridisation (FISH). (C–E, G, I–J) WISH characterisation of the selected representative cell population markers. (F, H) Scanning electron microscopy (SEM) analysis of the ciliary cells of G. platifrons gill. (K) Schematic of the water flow agitated by different ciliary cell types. The colour of the arrowheads corresponds to water flow potentially influenced by specific types of cilia, as indicated by their colour code in (A).
Figure 3—figure supplement 1
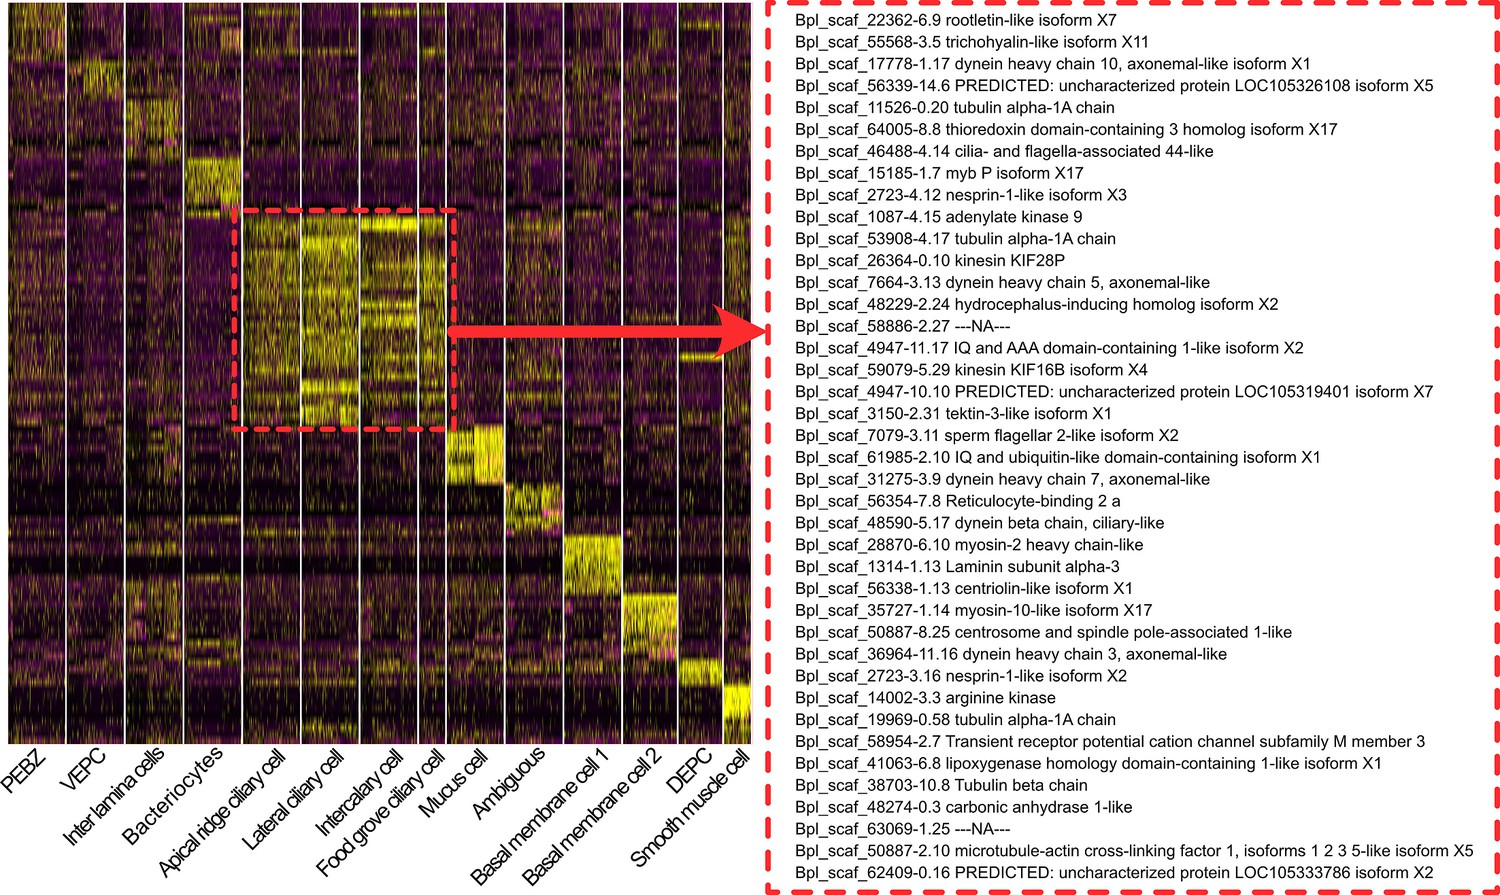
Heat map of the shared marker genes expressed in all the ciliary cells.
Figure 3—figure supplement 2
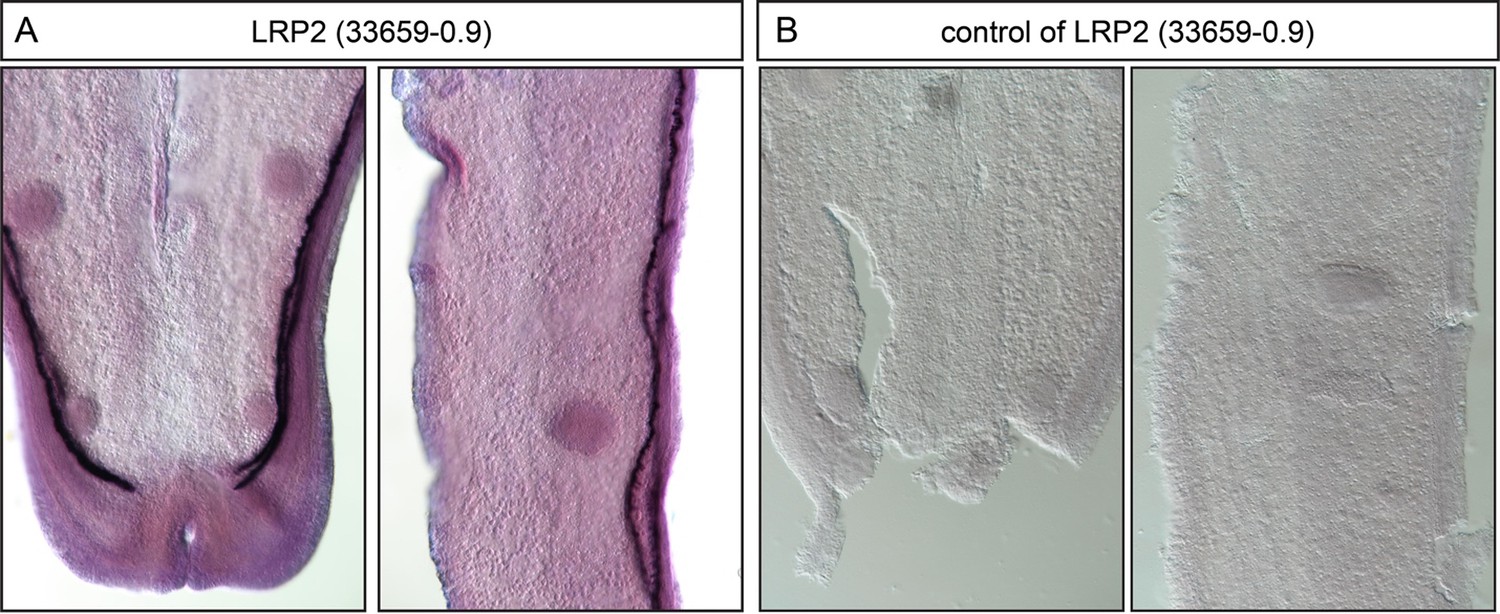
Whole-mount in situ hybridisation (WISH) characterisation of the gene Bpl_scaf_48274-0.3, LRR2.
(A) The WISH hybridisation of Bpl_scaf_48274-0.3 (LRR2). (B) The control hybridisation of Bpl_scaf_48274-0.3 (LRR2). The left and right images of each panel are the tip and mid part of a gill slice, respectively.
Figure 3—figure supplement 3
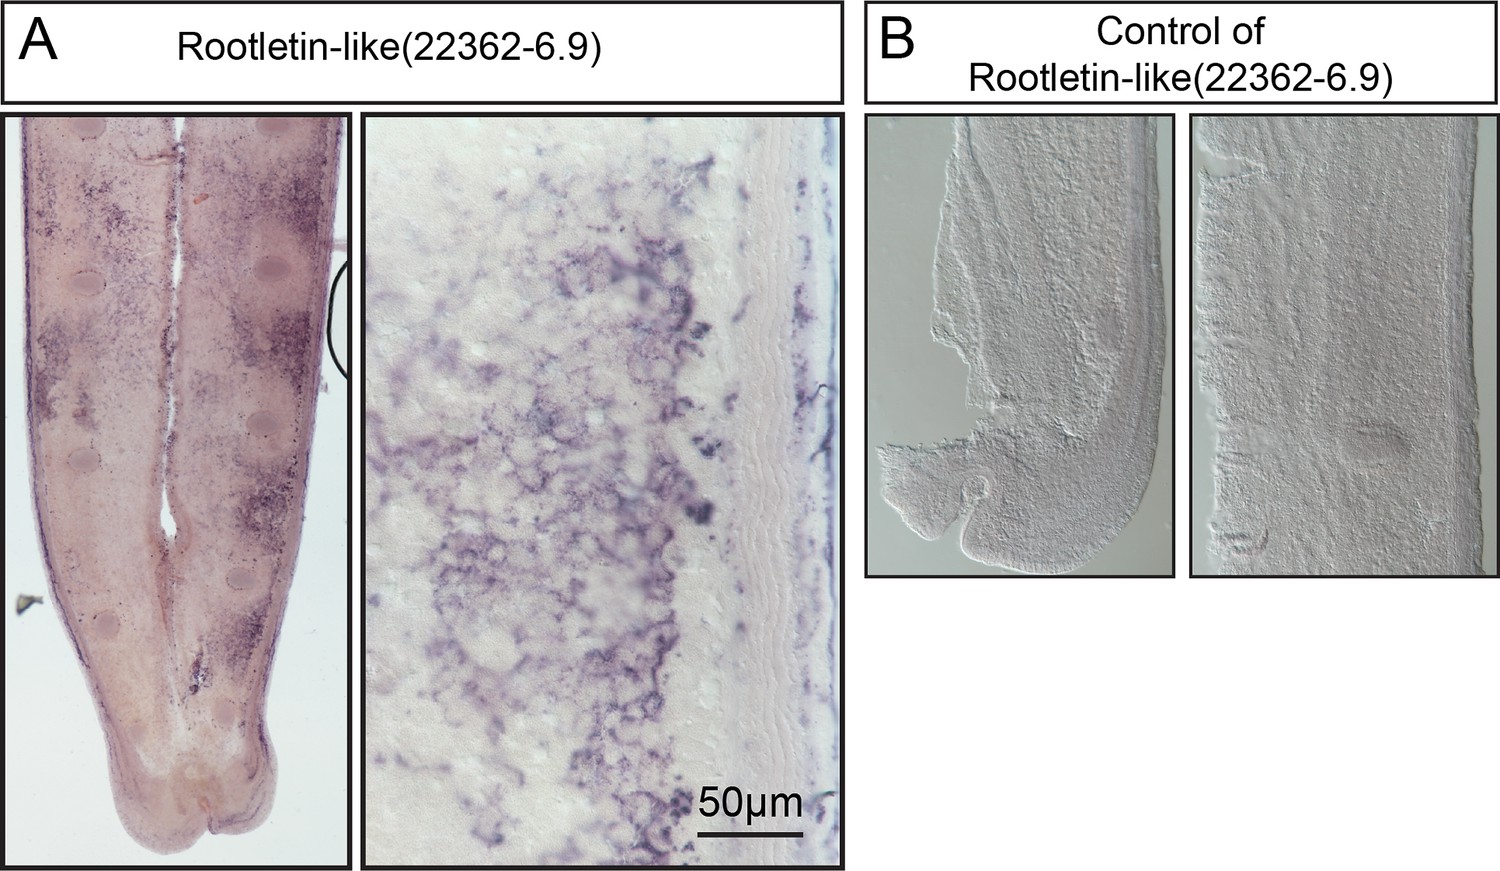
Whole-mount in situ hybridisation (WISH) characterisation of gene Bpl_scaf_22362-6.9, Rootletin-like.
(A) The WISH analysis of the Bpl_scaf_22362-6.9 (Rootletin-like). (B) The control hybridisation of Bpl_scaf_22362-6.9 (Rootletin-like). The left and right images of each panel are the tip and mid part of a gill slice, respectively.
Figure 3—figure supplement 4
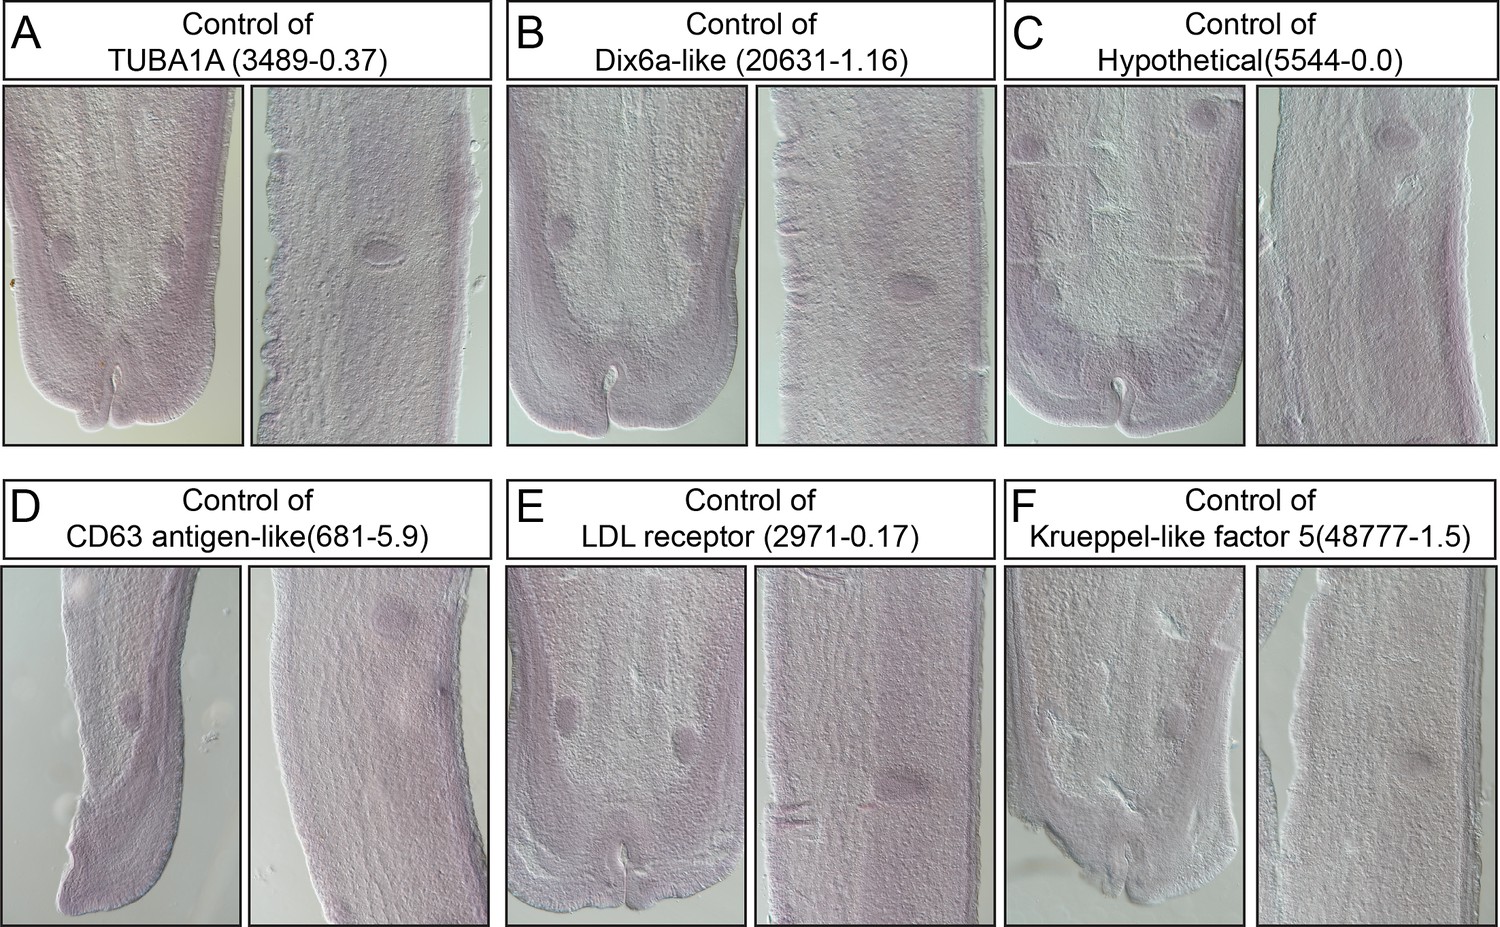
Control hybridisation of the ciliary cell markers.
(A) The control hybridisation of Bpl_scaf_3489-0.37 (TUBA1A). (B) The control hybridisation of Bpl_scaf_20631-1.16 (Dix6a-like). (C) The control hybridisation of Bpl_scaf_5544-0.0 (Hypothetical protein). (D) The control hybridisation of Bpl_scaf_681-5.9 (CD63 antigen-like). (E) The control hybridisation of Bpl_scaf_2971-0.17 (LDL receptor). (F) The control hybridisation of Bpl_scaf_48777-1.5 (Krueppel-like factor 5). The left and right images of each panel are the tip and mid part of a gill slice, respectively.
Figure 4 with 2 supplements
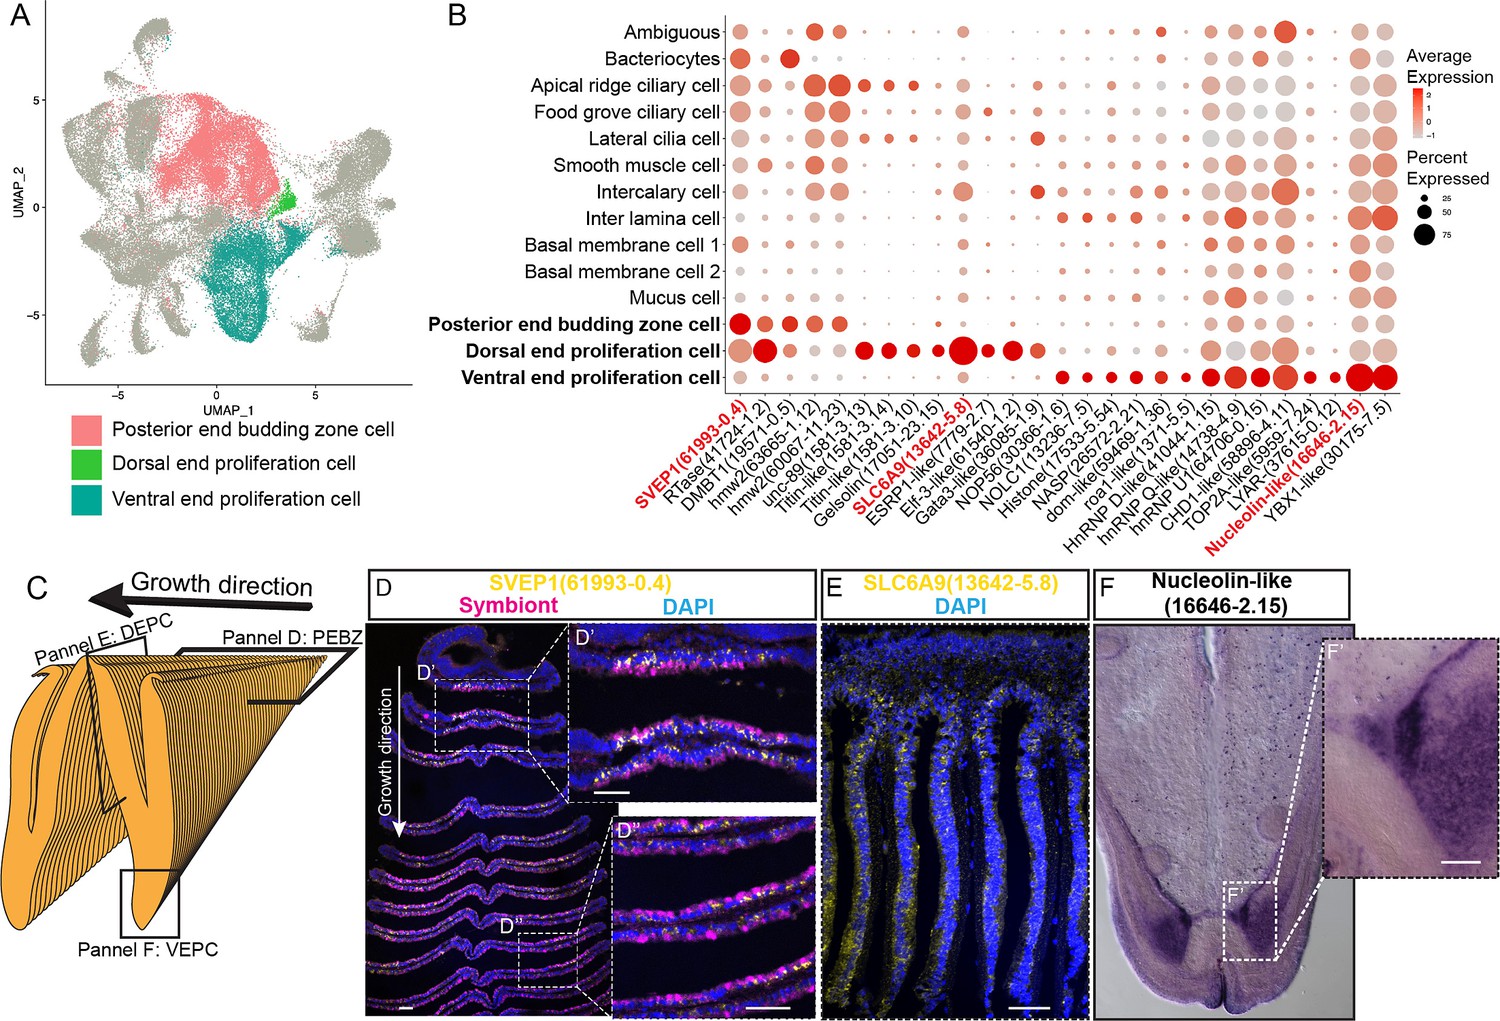
Proliferation cell populations of G. platifrons gill.
(A) Uniform Manifold Approximation and Projection (UMAP) representation of the three proliferation cell populations. (B) Expression profiles of the cell markers that are specific or enriched in the supportive cell populations. The sizes of the circles represent the percentages of cells in those clusters that expressed a specific gene. Genes shown in red were validated by whole-mount in situ hybridisation (WISH) or double fluorescent in situ hybridisation (FISH). (C) Schematic analyses of the spatial position of the three Proliferation cell populations. (D, E, F) FISH and WISH characterisation of the selected population markers. The marker genes confirmed by ISH or WISH in the current study are indicated in red. Scale bar: 50 µm.
Figure 4—figure supplement 1
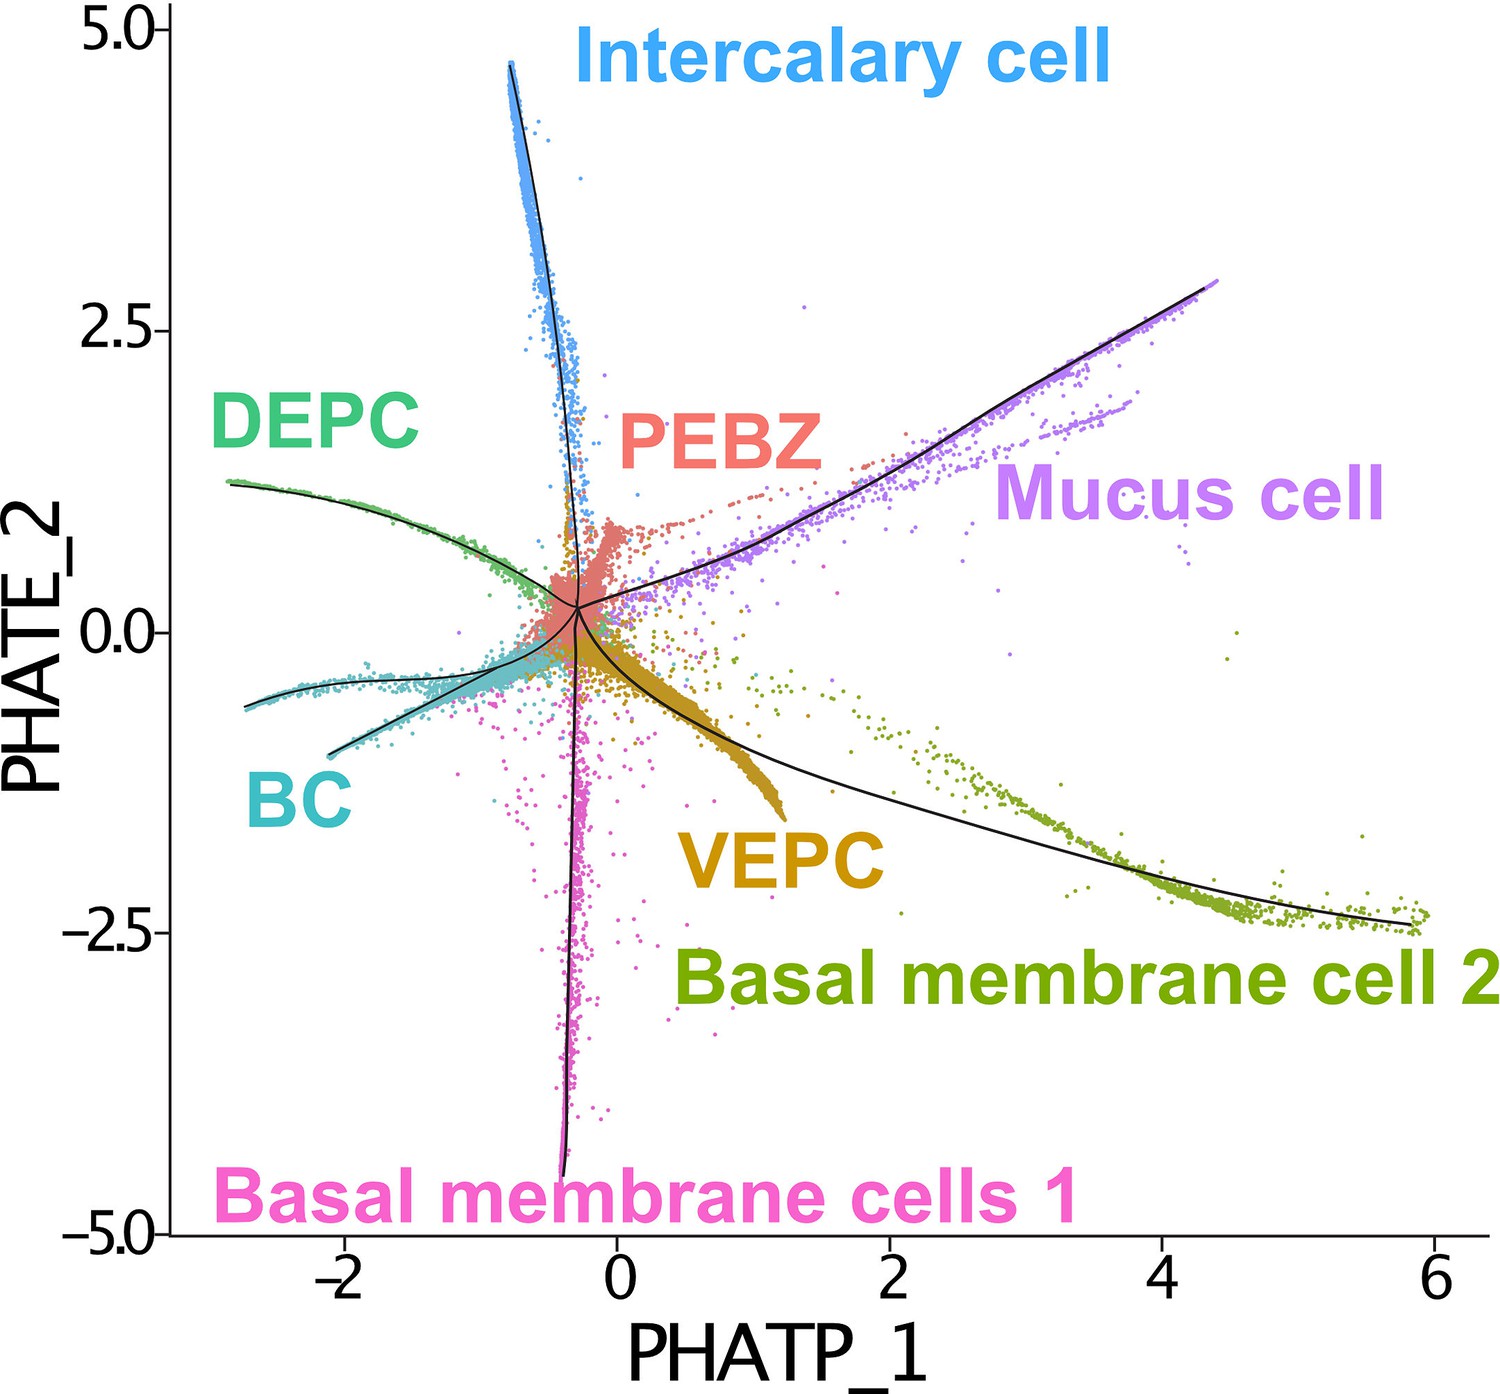
Slingshot trajectory of selected cell types (a dot represents a cell) identified by Slingshot and PHATE.
The selected cell types include ‘posterior end budding zone’, ‘intercalary cells’, ‘dosal end proliferation cells’, ‘vential end proliferation cells’, ‘mMucus cells’, ‘basal membrane cells 1’, ‘basal membrane cells 2’, and the ‘bacteriocytes’.
Figure 4—figure supplement 2
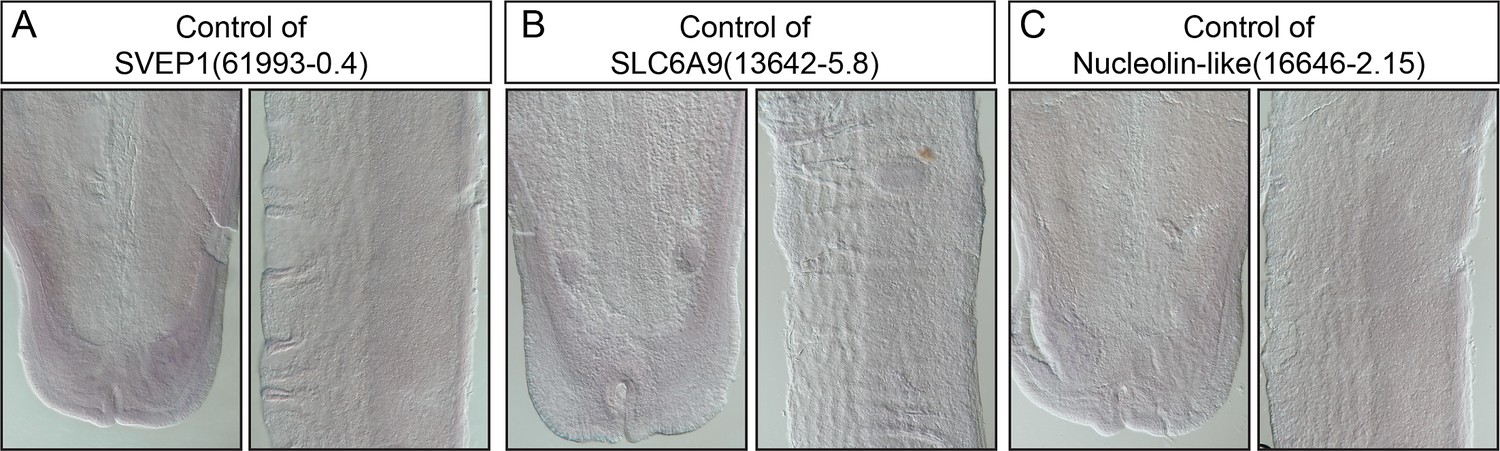
Control hybridisation of the proliferation cell markers.
(A) The control hybridisation of Bpl_scaf_61993-0.4 (SVEP1). (B) The control hybridisation of Bpl_scaf_13642-5.8 (SLC6A9). (C) The control hybridisation of Bpl_scaf_16646-2.15 (Nucleolin-like). The left and right images of each panel are the tip and mid part of a gill slice, respectively.
Figure 5 with 1 supplement
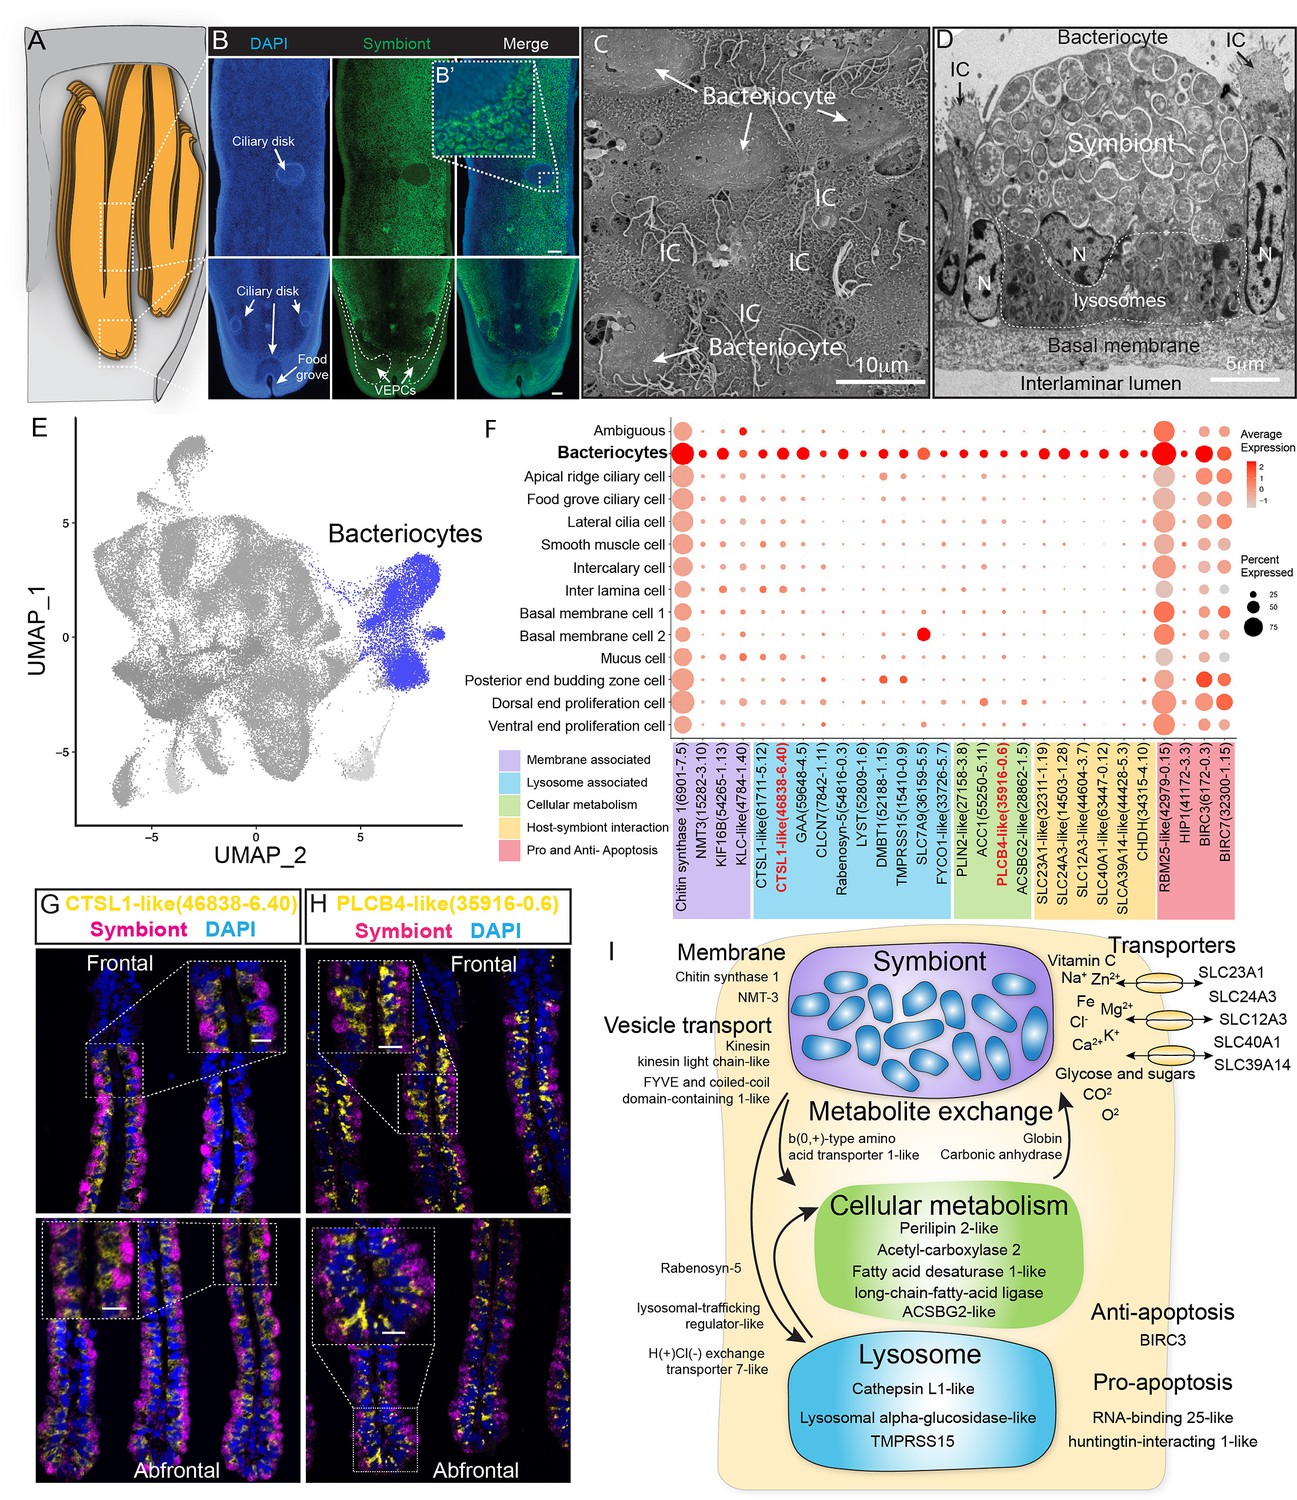
Characterisation of the bacteriocytes of G. platifrons.
(A) Schematic of the overall structure of G. platifrons gill filaments. (B) Whole-mount fluorescent in situ hybridisation (FISH) analyses of the overall distribution of bacteriocytes on the G. platifrons gill filament. (C) Scanning electron microscopy (SEM) analysis of the bacteriocytes. (D) Transmission electron microscopy (TEM) analysis of a bacteriocyte. (E) Uniform Manifold Approximation and Projection (UMAP) representation of G. platifrons bacteriocytes. (F) Expression profiles of the cell markers that are specific or enriched in the bacteriocytes. The sizes of the circles represent the percentages of cells in those clusters that expressed a specific gene. (G, H) Double FISH validated the genes shown in red. (I) Schematic of the host–symbiont interaction based on the single-cell transcriptome of G. platifrons bacteriocytes. The marker genes confirmed by ISH in the current study are indicated in red. Scale bar in panels 25 µm.
Figure 5—figure supplement 1
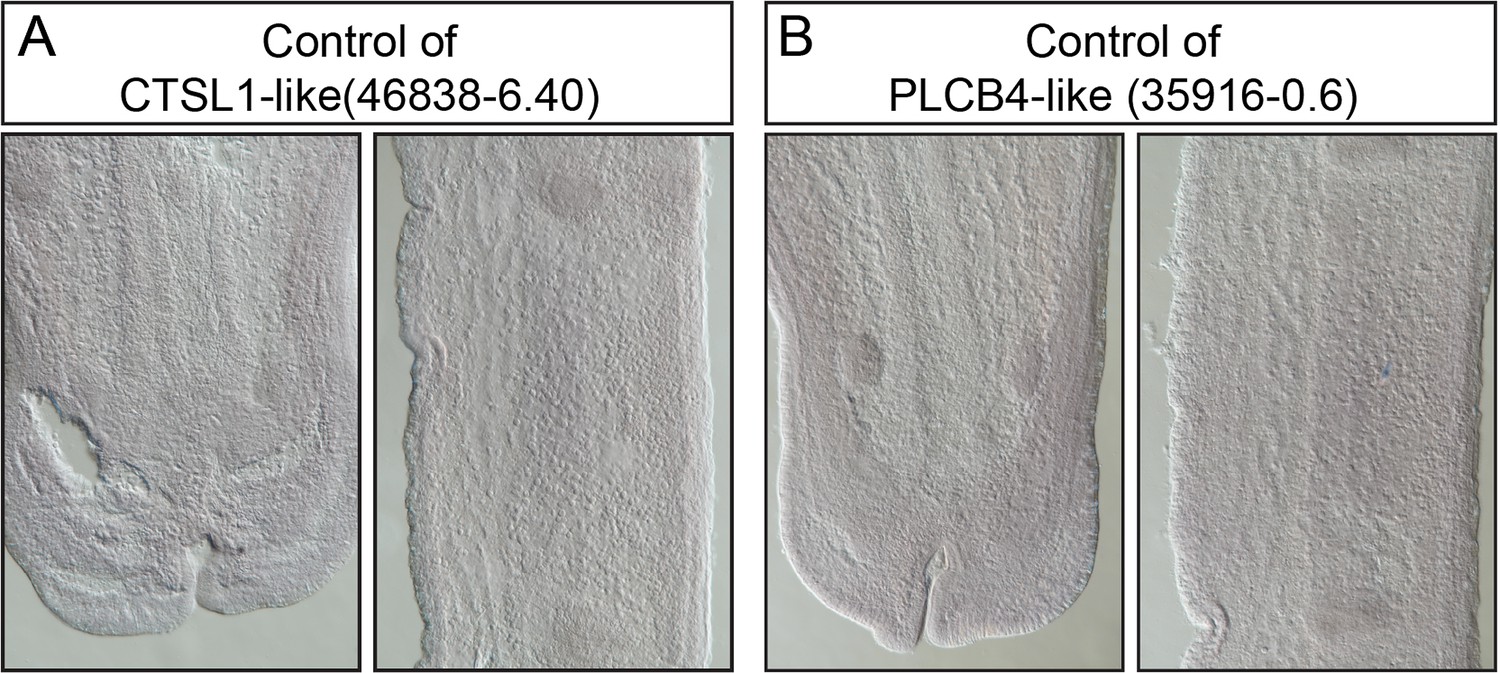
Control hybridisation of the bacteriocyte markers.
(A) The control hybridisation of Bpl_scaf_46838-6.40 (CTSL 1-like). (B) The control hybridisation of Bpl_scaf_35916-0.6 (PLCB4-like). The left and right images of each panel are the tip and mid part of a gill slice, respectively.
Figure 6 with 4 supplements
Analysis of cell population-specific differentially expressed genes (DEGs).
(A) Uniform Manifold Approximation and Projection (UMAP) representation of the impact of deep-sea in situ transplant treatments on the gene expression pattern of each cell population. The cells from different treatments are labelled with different colours. The dashed line encircled bacteriocyte populations have a considerably altered expression profile. (B) Histogram of cross-state distances between the centroids of the Fanmao, starvation, and reconstitution groups per cell type on UMAP. The black dashed lines indicate the bacteriocyte populations whose expression profile was remarkably altered. (C) Visualisation of bacteriocytes onto the pseudotime map using monocle. The black lines indicate the main path of the pseudotime ordering of the cells. (D) Bifurcation of selected gene expression along two branches in response to environmental perturbation. Genes are clustered hierarchically into two groups, illustrating up- (cluster 1) and down- (cluster2) regulated genes in the starvation state compared with Fanmao. Genes in red colour are discussed in the section ‘Cell-type-specific response to environmental stresses’. The heat map showing the gene expression profiles of all bacteriocytes' DEGs is shown in Figure 6—figure supplement 1. (E) Proposed model for the molecular mechanisms of host–symbiont interactions in response to environmental changes.
Figure 6—figure supplement 1
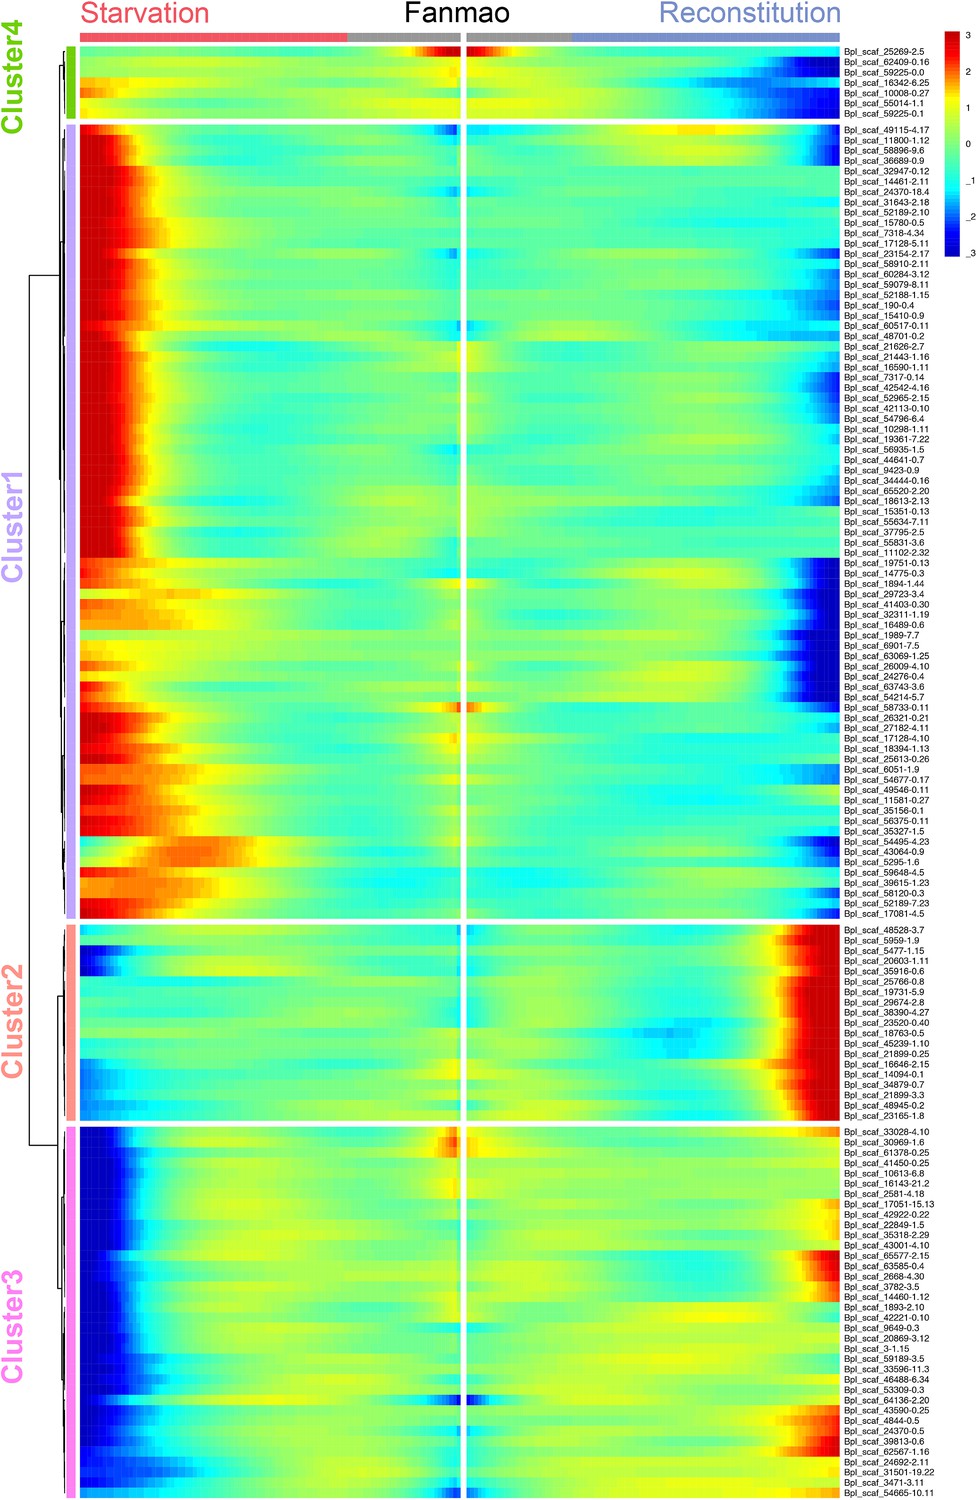
Heat map showing the gene expression profiles of all bacteriocytes' differentially expressed genes (DEGs).
Figure 6—figure supplement 2
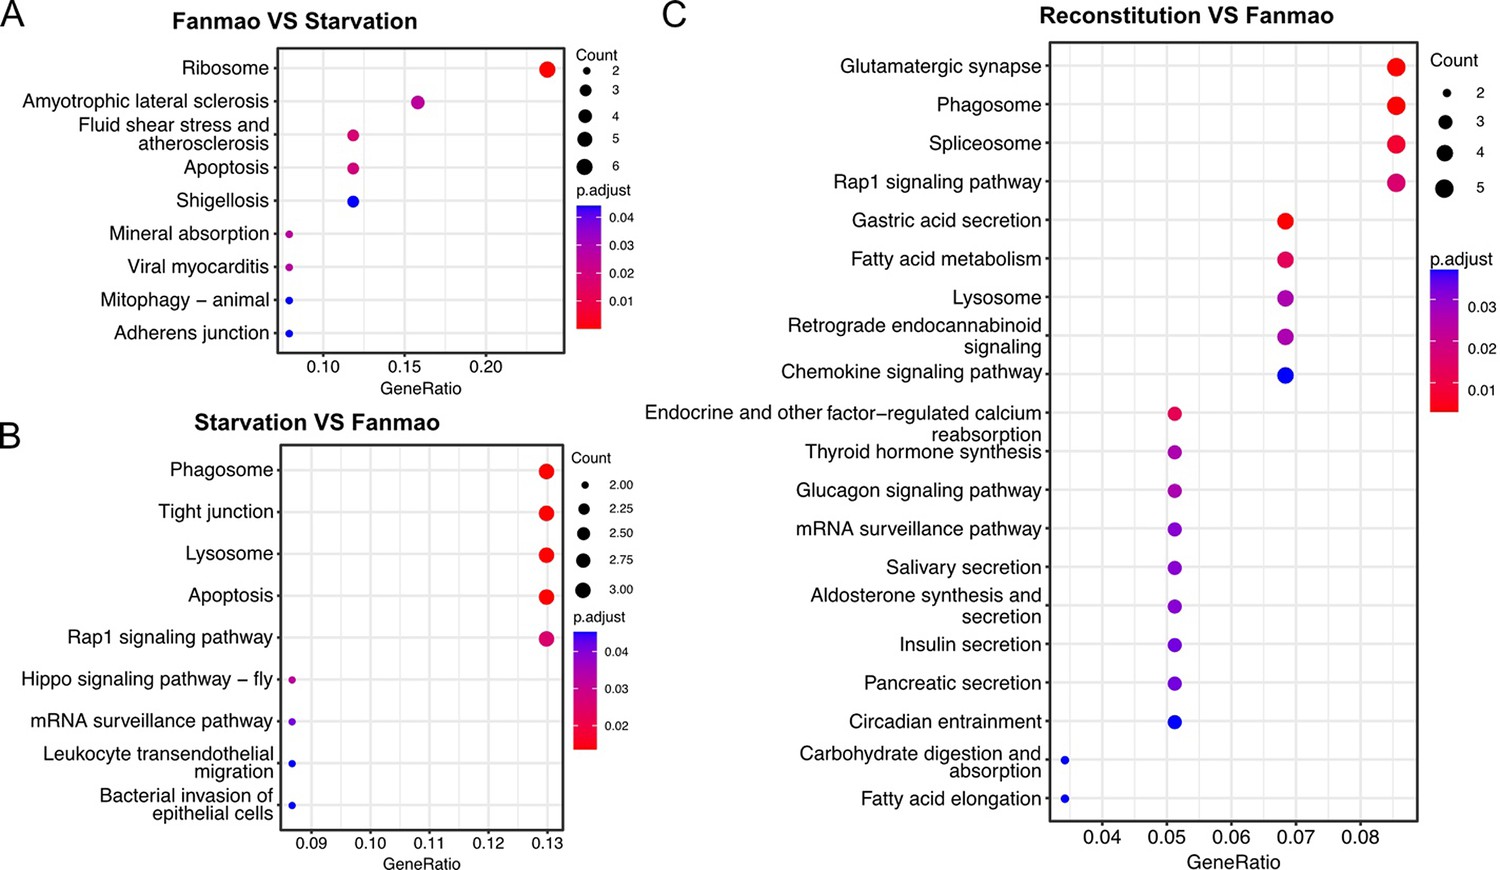
Kyoto Encyclopedia of Genes and Genomes (KEGG) enrichment analysis of the bacteriocytes’ differentially expressed genes (DEGs).
(A) The KEGG pathways enriched in Fanmao VS Starvation comparison. (B) The KEGG pathways enriched in Starvation VS Fanmao comparison. (C) The KEGG pathways enriched in Reconstitution VS Fanmao comparison.
Figure 6—figure supplement 3
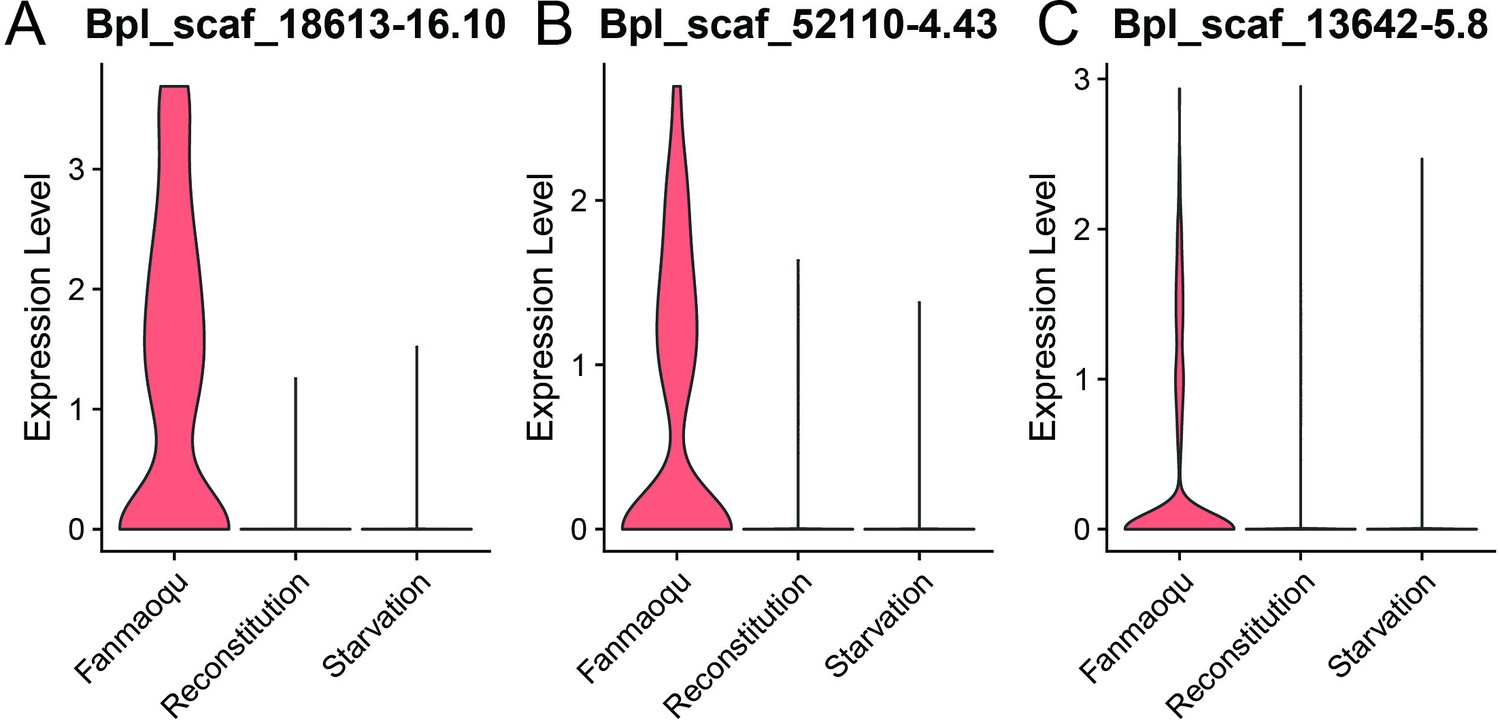
Gene expression-level analysis of selected genes.
(A) Bpl_Scaf_18613-16.10 (A BCB P-glycol); (B) Bpl_scaf_52110-4.43 (canalicular multispecific organic anion transporter 2); and (C) Bpl_scaf_13642-5.8 (sodium- and chloride-dependent glycine transporter 1-like protein).
Figure 6—figure supplement 4
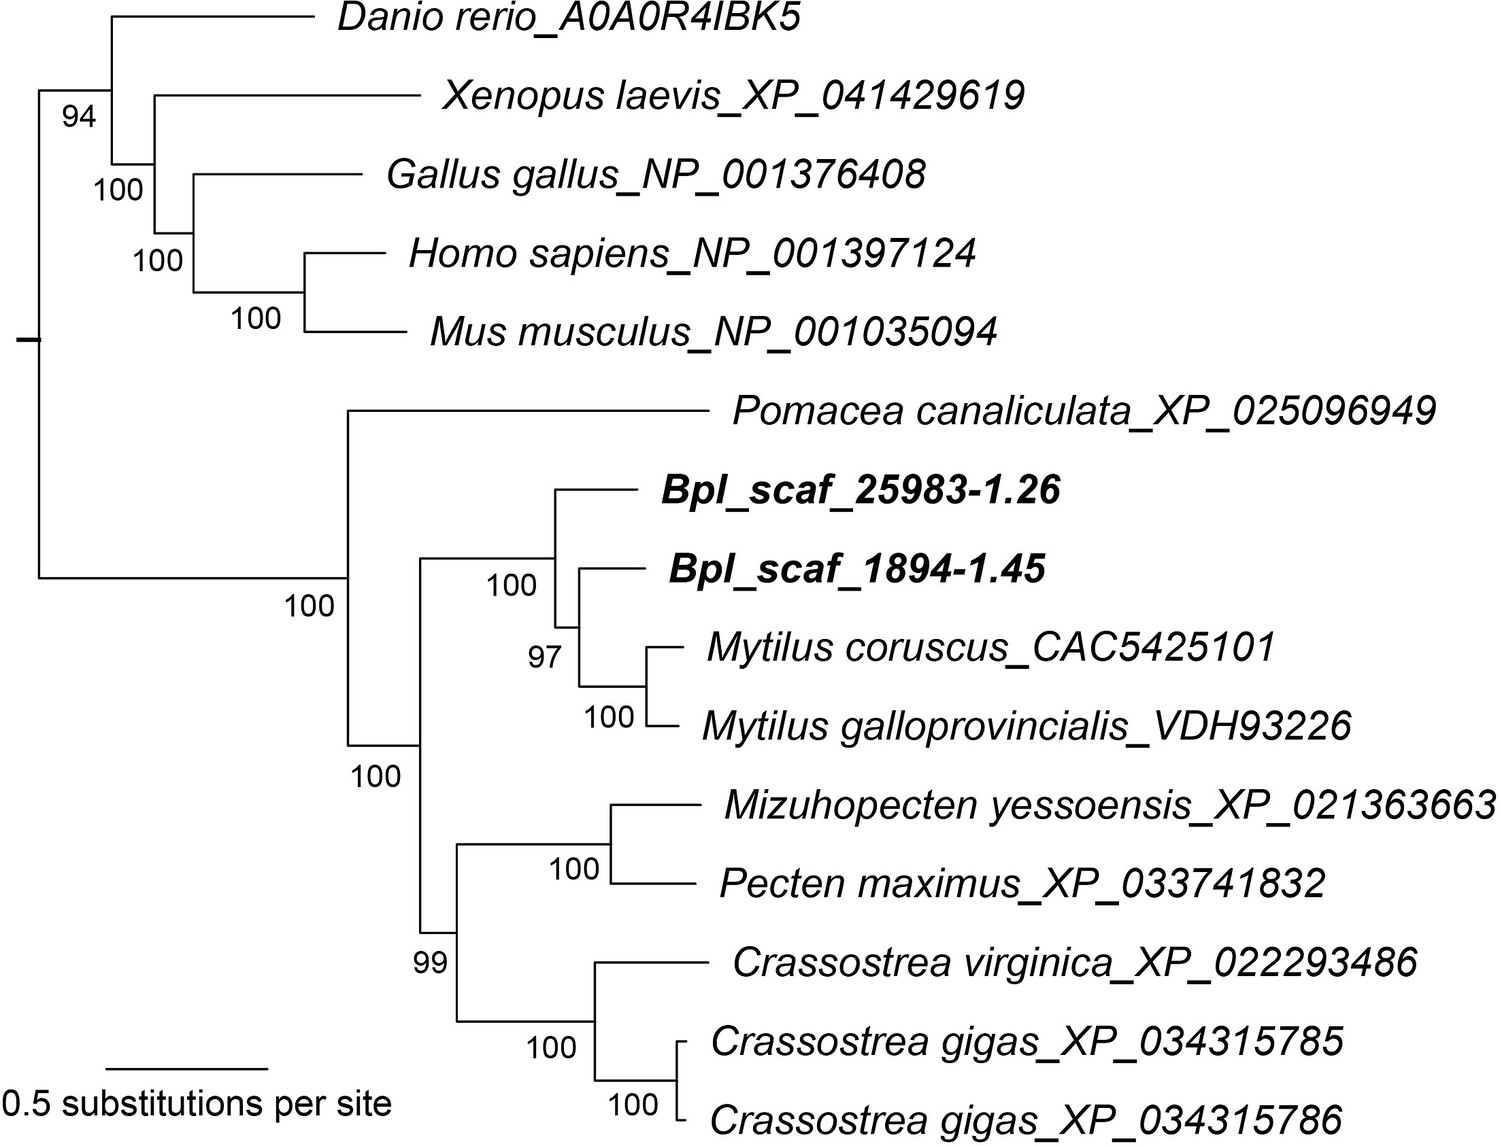
An RAxML phylogenetic tree estimated using E3 ubiquitin ligase RNF213.
Tips are species names and GenBank accession numbers. Node numbers are bootstrap support values.
Additional files
-
Supplementary file 1
The supplementary tables.
(a) Summary statistics of single-cell data information, including numbers and percentages of cells and numbers of available genes per cluster in each sample individually and in all three pieces combined. (b) Identified cell markers of the supportive cells, including the inter lamina cell, the basal membrane cell 1, the basal membrane cell 2, and the mucus cell. (c) Identified cell markers of the ciliary cells, including the apical ridge ciliary cell, the food grove ciliary cell, the lateral ciliary cell, the smooth muscle cell, and the intercalary cell. (d) Identified cell markers of the proliferation cells, including the posterior end budding zone, the dorsal end proliferation cell, and the ventral end proliferation cell. (e) Identified cell markers of the bacteriocyte. (f) Cell cluster-specific differentially expressed genes among the three deep-sea in situ treatments, the inter lamina cell. (g) Cell cluster-specific differentially expressed genes among the three deep-sea in situ treatments, the basal membrane cell 1. (h) Cell cluster-specific differentially expressed genes among the three deep-sea in situ treatments, the basal membrane cell 2. (i) Cell cluster-specific differentially expressed genes among the three deep-sea in situ treatments, the mucus cell. (j) Cell cluster-specific differentially expressed genes among the three deep-sea in situ treatments, the apical ridge ciliary cell. (k) Cell cluster-specific differentially expressed genes among the three deep-sea in situ treatments, the food grove ciliary cell. (l) Cell cluster-specific differentially expressed genes among the three deep-sea in situ treatments, the lateral ciliary cell. (m) Cell cluster-specific differentially expressed genes among the three deep-sea in situ treatments, the smooth muscle cell. (n) Cell cluster-specific differentially expressed genes among the three deep-sea in situ treatments, the intercalary cell. (o) Cell cluster-specific differentially expressed genes among the three deep-sea in situ treatments, the posterior end budding zone. (p) Cell cluster-specific differentially expressed genes among the three deep-sea in situ treatments, the dorsal end proliferation cell. (q) Cell cluster-specific differentially expressed genes among the three deep-sea in situ treatments, the ventral end proliferation cell. (r) Cell cluster-specific differentially expressed genes among the three deep-sea in situ treatments, the bacteriocytes. (s) Euclid distances between cell types in three different treatments.The distances were computed based on the centroid coordinates of each cell type in each condition and are shown in Figure 6B. (t) Quality control for each sample sequenced using the BD Rhapsody platform.
- https://cdn.elifesciences.org/articles/88294/elife-88294-supp1-v2.xlsx
-
Supplementary file 2
snRNA-seq expression counting matrix.
- https://cdn.elifesciences.org/articles/88294/elife-88294-supp2-v2.zip
-
Supplementary file 3
Average expression of each gene per cell type.
- https://cdn.elifesciences.org/articles/88294/elife-88294-supp3-v2.zip
-
Supplementary file 4
The sequences of targeted genes and gene-specific primers.
- https://cdn.elifesciences.org/articles/88294/elife-88294-supp4-v2.docx
-
MDAR checklist
- https://cdn.elifesciences.org/articles/88294/elife-88294-mdarchecklist1-v2.docx
Download links
A two-part list of links to download the article, or parts of the article, in various formats.
Downloads (link to download the article as PDF)
Open citations (links to open the citations from this article in various online reference manager services)
Cite this article (links to download the citations from this article in formats compatible with various reference manager tools)
Deciphering deep-sea chemosynthetic symbiosis by single-nucleus RNA-sequencing
eLife 12:RP88294.
https://doi.org/10.7554/eLife.88294.4


