Small deviations in kinematics and body form dictate muscle performances in the finely tuned avian downstroke
- Department of Mechanical Engineering, Stanford University, United States
- Department of Biological Sciences, California State University, United States
- Division of Biological Sciences, University of Montana, United States
- Faculty of Science and Engineering, University of Groningen, Netherlands
Figures
Figure 1 with 3 supplements
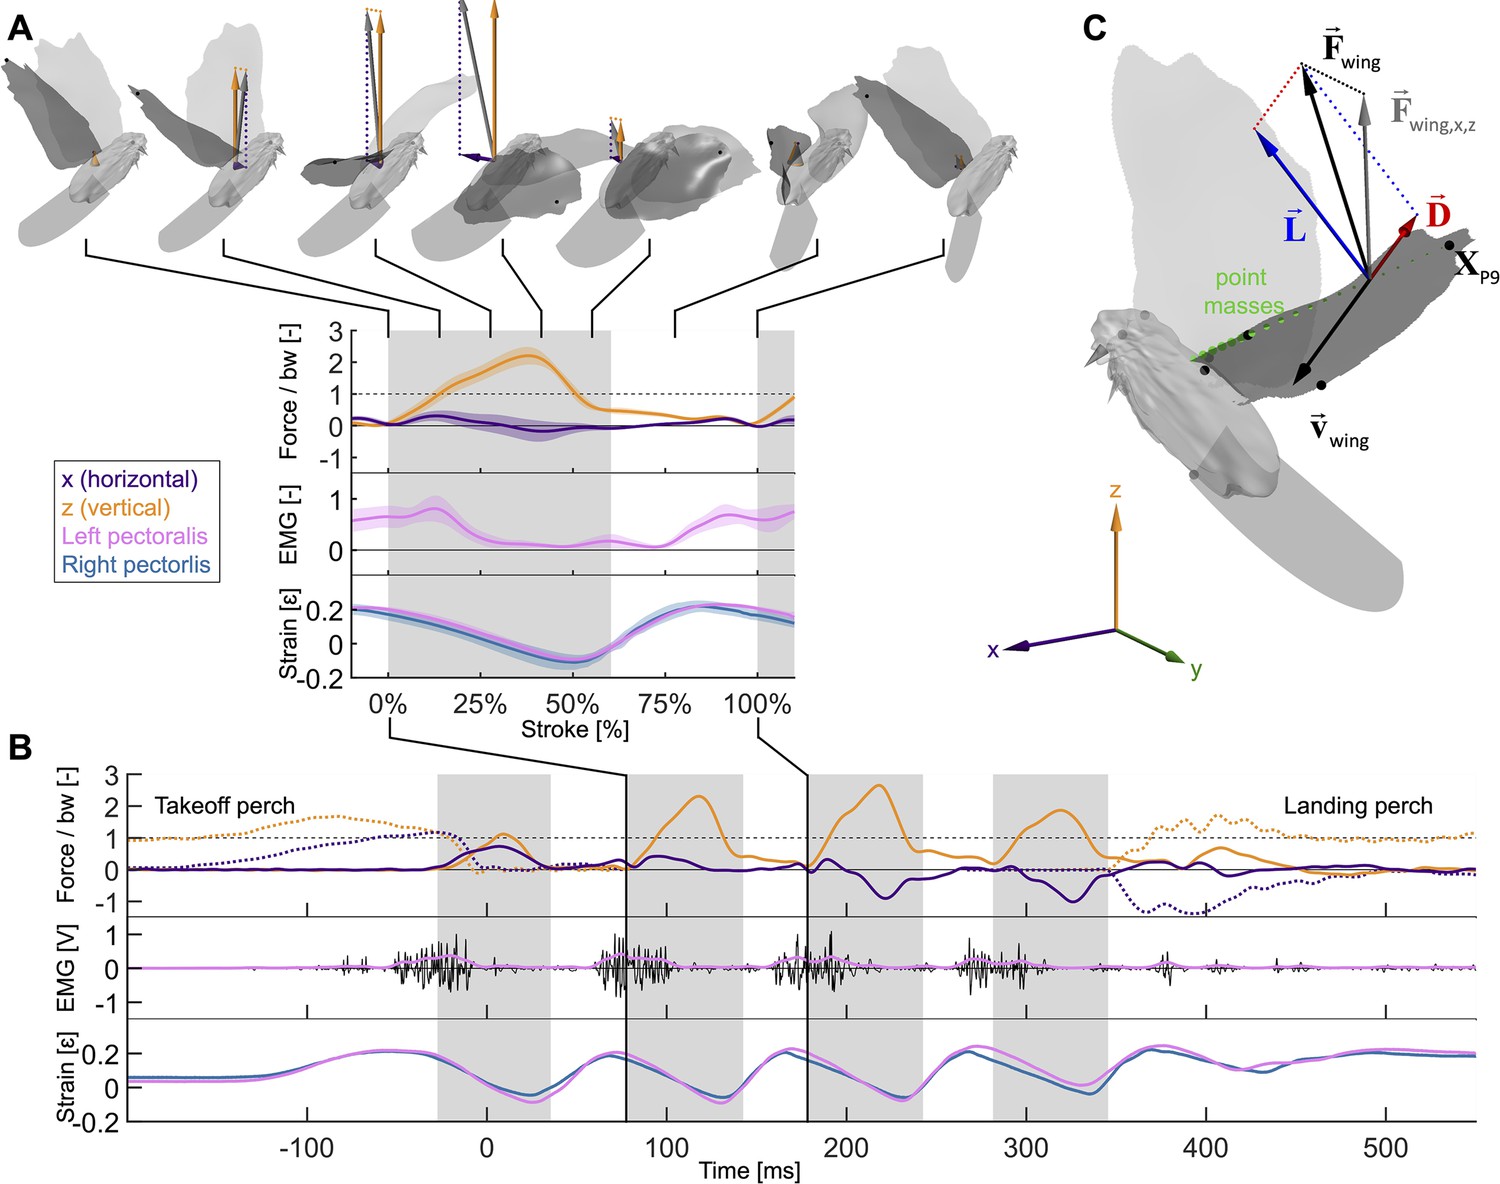
Wingbeat-resolved aerodynamic forces, pectoralis activation and contraction, and 3D surface reconstruction of four doves (N = 4) in slow hovering flight (n = 5).
(A) Inset showing the average second wingbeat (N × n = 20 flights total) net horizontal (x, purple) and vertical (z, orange) aerodynamic force, electrical activation (EMG, pink) of the left pectoralis (right pectoralis signal was unreliable), and strain of the left (pink) and right (blue) pectoralis. Gray region: downstroke; color shaded regions: standard deviation; force normalized by bodyweight: bw; statistics and plot definitions apply to all figures unless stated differently. At the top is shown a dove’s 3D reconstructed surface and recorded aerodynamic force during each stroke phase (flight direction mirrored to match temporal direction). (B) The same data from (A) are plotted for a single representative flight from takeoff to landing. The dotted lines represent horizontal and vertical perch forces during takeoff and landing. In addition to the lowpass filtered (pink) EMG signal, the raw signal is plotted in black. (C) The total 3D aerodynamic force (, black) is the sum of the measured horizontal (x) and vertical (z) components (, gray) combined with the computed lateral (y) component (dotted line connecting and ). Using the 3D surface model (depicted at 17% of the second wingbeat), we illustrate the reconstruction of drag (, red) and lift (, blue) based on drag pointing opposite to wing velocity (, black) and being perpendicular to lift. Drag and lift act perpendicular to the vector connecting the shoulder joint to the ninth primary wingtip (). Along this vector, the mass of the wing is discretized using 20 point masses (green spheres; volume proportional to mass). Twelve body landmarks were manually tracked; black dots: ninth primary wingtip (), seventh secondary feather, shoulder joint, wrist; gray dots: middle of the back (next to shoulder), left and right feet, left and right eyes, top of the head; gray cone: tip and base of the beak.
Figure 1—figure supplement 1
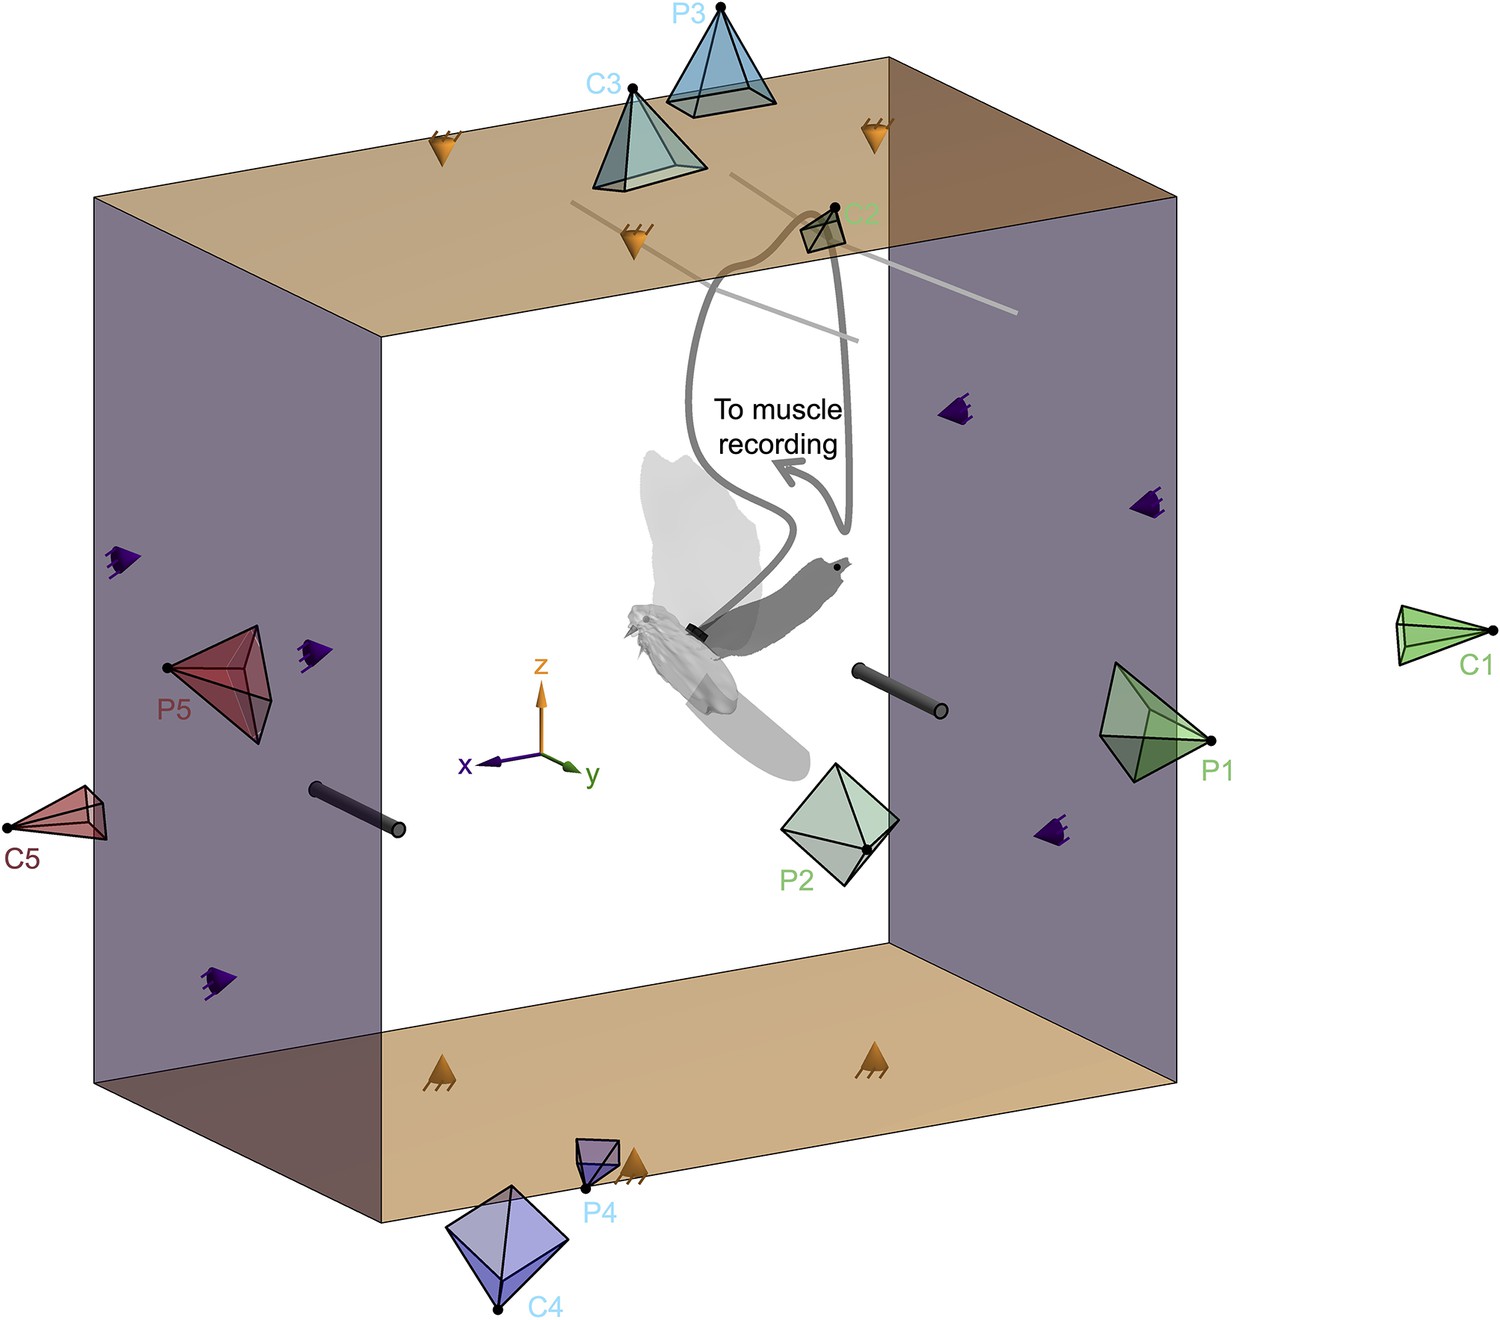
Experimental setup. Simultaneous measurement of the electrical activation and strain of the pectoralis muscle, the horizontal and vertical aerodynamic forces, and the 3D wing, body, and tail surface of doves in slow forward flight enabled us to reconstruct the aerodynamic work loop of the pectoralis.
The dove flew from the right perch to the left perch inside the 2D aerodynamic force platform (AFP) (Lentink et al., 2015; Chin and Lentink, 2019; Deetjen et al., 2020; Lentink, 2018; Chin and Lentink, 2020). Force panels above and below the dove (orange) measured the time-resolved vertical aerodynamic force, and panels behind and in front of the dove (purple) measured the time-resolved horizontal aerodynamic force generated by the dove to fly. Each of the four panels was connected in a statically determined manner to three force sensors (orange and purple cones). Five pairs of high-speed cameras (C1–C5; cameras further from the dove appear smaller) and projectors (P1–P5) imaged the body, tail, and left wing of the dove from different view angles during the second stroke after takeoff (Deetjen et al., 2017). We assumed bilateral symmetry for the right wing because we focused our cameras and projectors on the left wing, during the second stroke after takeoff, to optimally resolve the wing’s 3D surface during a full wingbeat. The wire (dark gray curving line) used to measure the electrical activation (electromyography) and strain (sonomicrometry) of the pectoralis muscle was attached to the back plug (black rectangle). The plug was secured to the back by suturing its base to intervertebral ligaments. This wire was loosely supported by strings mounted near the top of the AFP (two light gray lines), exiting the AFP through a small hole in the acrylic side panel (labeled ‘to muscle recording’).
Figure 1—figure supplement 2

Comparison of aerodynamic and perch forces prior to surgery and after surgery shows that the surgery substantially altered the flight performance.
Pre-surgery flights are plotted in green, post-surgery flights without the recoding cable connected to the dove are plotted in yellow, and post-surgery flights with the connected muscle recording cable (EMG and sonomicrometry) are plotted in red. For all three flight scenarios, we averaged five flights from dove 3. Plots show average and standard deviation across five flights; gray region indicates second downstroke after takeoff. (A) The aerodynamic and perch forces across the entire flight (similar to Figure 1B, Figure 1—figure supplement 3). (B) The aerodynamic forces generated by the second wingbeat (similar to Figure 1A) during which we 3D reconstructed the dove’s body surface in flight.
Figure 1—figure supplement 3

Measured data is plotted for each of the four doves individually, averaged over five flights per dove.
Shaded regions: standard deviation. The data plotted is similar to Figure 1B, where data from a single flight was plotted. For each dove, we plot the horizontal (x, purple) and vertical (z, orange) aerodynamic forces (solid lines), the horizontal and vertical takeoff and landing forces (dotted lines), the pectoralis electrical activation (pink: left pectoralis), and the pectoralis strain (pink: left pectoralis; blue: right pectoralis). Manual temporal alignment is based on the instant the dove takes off. All summary figures use data from the second wingbeat after takeoff (green shaded regions). (A) Five averaged flights by dove 1. (B) Five averaged flights by dove 2. (C) Five averaged flights by dove 3. (D) Five averaged flights by dove 4.
Figure 2 with 1 supplement
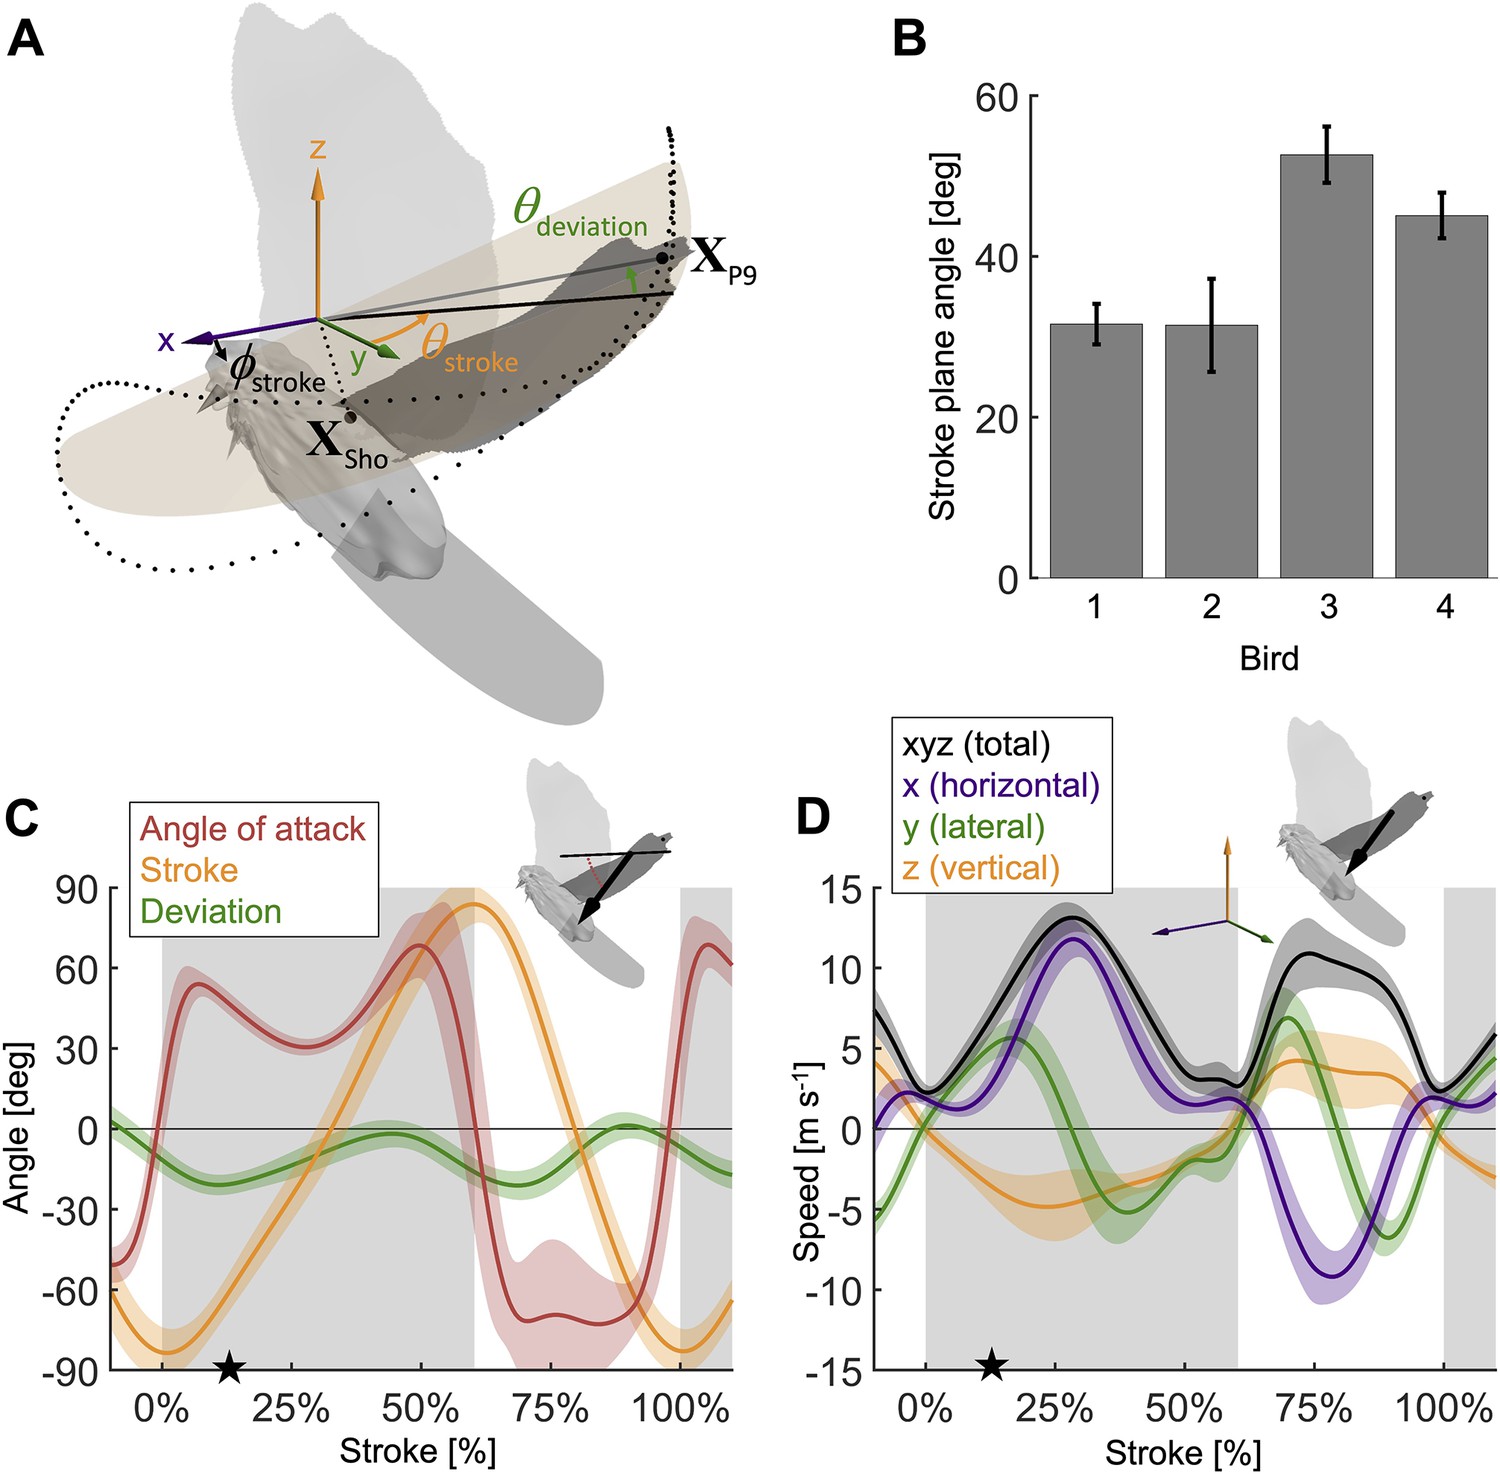
Measured wingbeat kinematics show wing area, extension, and speed are maximal mid-downstroke, while the wing angle of attack reaches a local minimum.
(A) The stroke plane (light orange) fits the path of the vector originating from the shoulder joint and extending to the ninth primary feather tip () during the wingbeat, which we use to define wing kinematics with three angles: (1) the stroke plane angle , (2) the wing stroke angle , and (3) the deviation of the stroke angle from the stroke plane . (B) The average stroke plane differs across the four doves while being consistent for each individual dove. (C) The wing stroke angle (orange), stroke deviation angle (green), and wing angle of attack (red) are consistent (low variance) across all flights and all four individuals. The only exception is the angle of attack during the upstroke. The avatar shows the angle of attack (red dotted arc), the angle between the wing chord (thin) and velocity vector (thick), at 17% of the second wingbeat (star in panels C and D). (D) The net wing speed (black) peaks mid-downstroke and mid-upstroke. The x-velocity component dominates net speed. The avatar shows the 3D wing velocity vector.
Figure 2—figure supplement 1
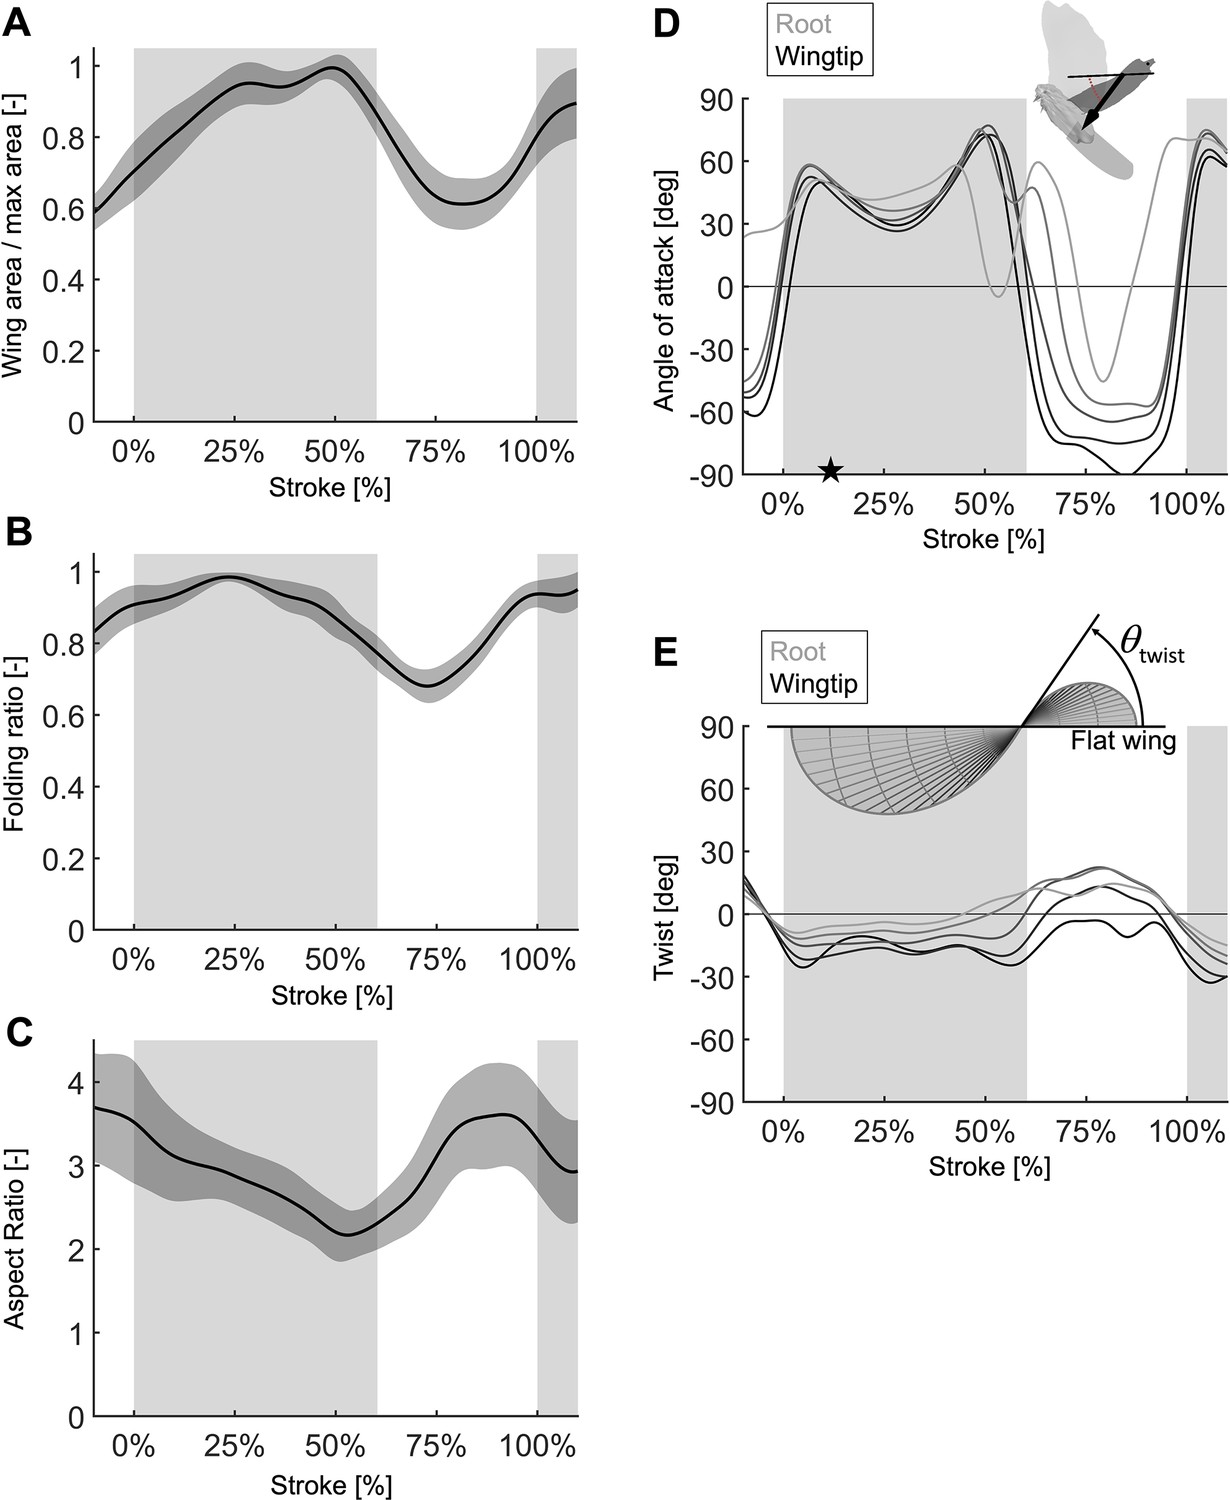
Stroke-resolved wing morphing parameters during the second wingbeat, measured using 3D wing surface reconstruction.
N = 4 doves; n = 5 flights each; gray region indicates second downstroke after takeoff. (A) The wing surface area normalized with the fully extended area reaches a plateau between mid-downstroke and the start of the upstroke. (B) The wing folding ratio shows wingspan reduction relative to the fully extended wing mid-downstroke. (C) The aspect ratio of the wing was computed using Equation S4 and quantifies the ratio of the wingspan squared and the wing surface area. Hence, the normalized aspect ratio is (B) squared divided by (A). The aspect ratio peak near the end of the upstroke corresponds to the dove beginning to re-extend its wing to prepare for the downstroke, even while its feathers are still splayed to maintain low-surface area. (D) The angle of attack induced by flapping motion varies through the stroke, and in a lesser degree, along the span. We computed the angle of attack for each blade element as the angle between the chordline of the blade element (avatar: thin black line) and the velocity vector (avatar: thick black line) and plot the results at 20% (labeled as root), 40%, 60%, 80%, and 100% (labeled as tip) of the wing radius. (E) Wing twist, the angle between the chord vector at the root and the chord vector along the span of the wing, is plotted at 20% (labeled as root), 40%, 60%, 80%, and 100% (labeled as tip) of the wing radius. The diagram shows a twisted elliptical wing viewed with the wingspan axis out of the page.
Figure 3 with 1 supplement
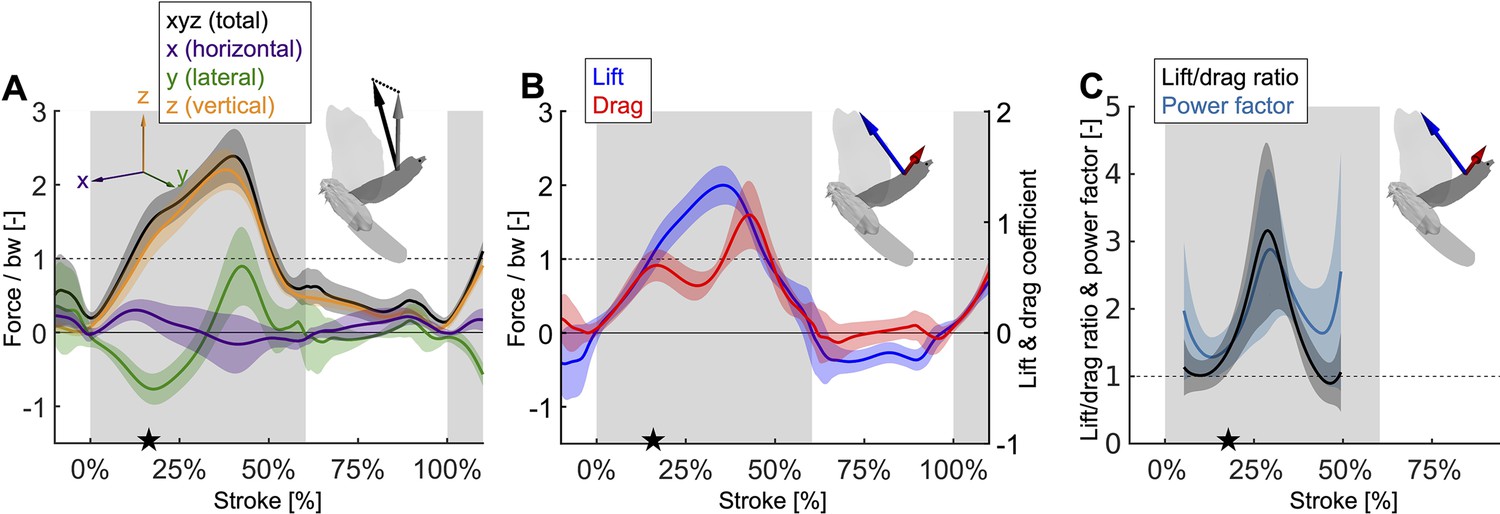
Mid-downstroke the lift peaks while drag reaches a local minimum, which coincides with a dip in the angle of attack (Figure 2C), causing the power factor (non-dimensional lift3/2/drag) to reach a local maximum while the wing attains peak speed (Figure 2D).
This reduces the aerodynamic power needed to generate peak lift during mid-downstroke and support bodyweight (bw; used to normalize force). (A) Net aerodynamic force magnitude (black) peaks mid-downstroke and is composed of the recorded large vertical (z) and small horizontal (x) force as well as the computed lateral (y) force. The avatar shows both the 2D measured aerodynamic force vector (; gray) and the net 3D vector (; black). (B) During mid-downstroke, the lift force (blue) peaks while the drag force (red) dips. Lift is defined positive with respect to the wing surface normal, hence negative lift opposes gravity during the upstroke because the wing is inverted. (C) The lift to drag ratio and power factor (non-dimensional lift3/2/drag) peak mid-downstroke when force and velocity peak. Both ratios are not well-defined during stroke reversal and upstroke because both force and velocity are small, so these portions of the plot have been removed.
Figure 3—figure supplement 1
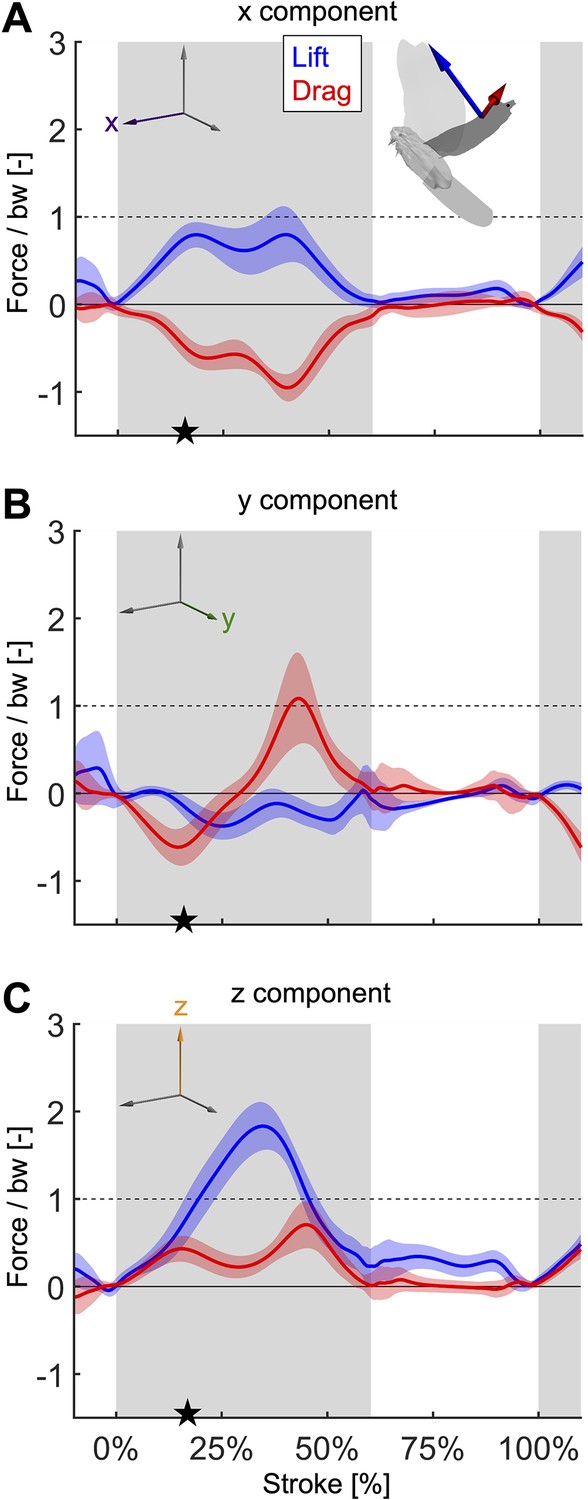
The components of lift and drag expand our understanding from Figure 3B.
(A) The horizontal component of lift points forward to overcome the horizontal component of drag throughout the stroke. (B) The lateral component of drag peaks near the end of downstroke, which together with the peak in the horizontal and vertical components contributes to slowing down the wing. (C) The vertical drag component contributes substantially, 22.1%, to weight support over the stroke. The stroke-averaged vertical force normalized by bodyweight is 87.3%, showing the second wingbeat does not fully support bodyweight. Bodyweight is supported for the entire flight using the combined work of the legs and wings. See Supplementary file 1d, e for a complete breakdown of stroke-averaged aerodynamic forces across all experiments.
Figure 4 with 1 supplement
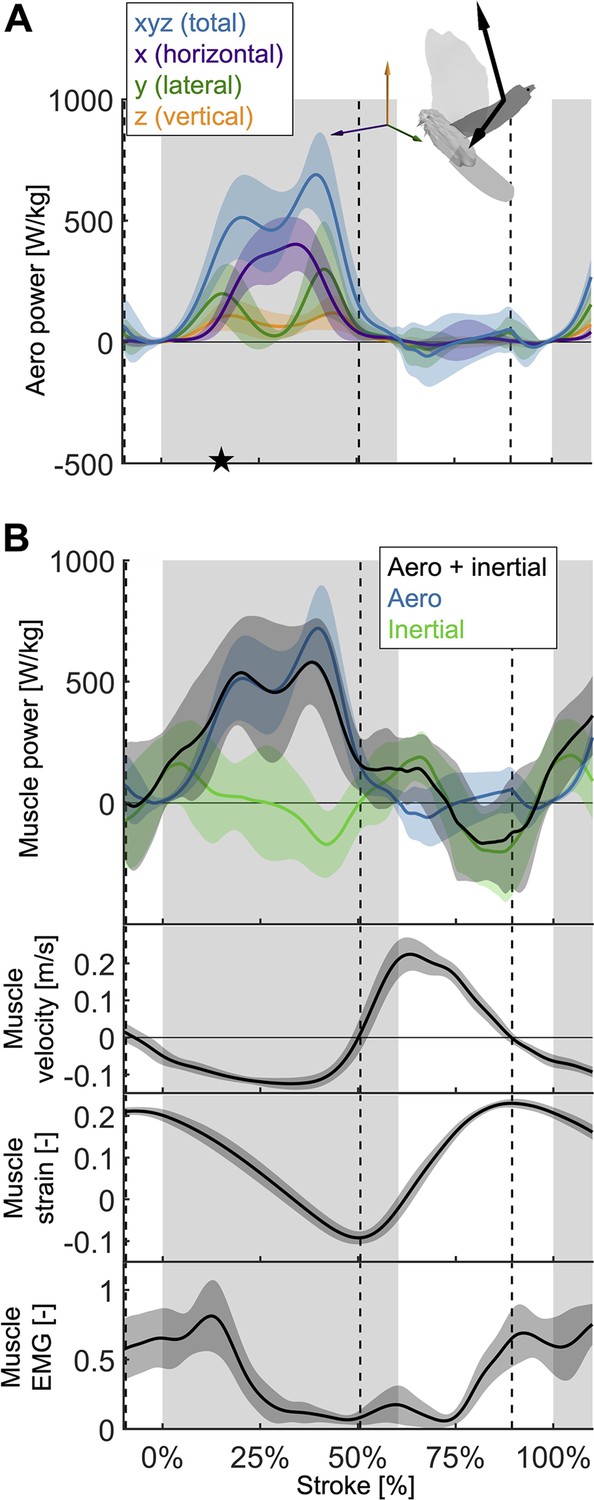
The total power (aerodynamic plus inertial) that the flight muscles need to generate dips midstroke.
(A) The primary source of aerodynamic power stems from the horizontal contribution of drag (x, purple) because the wing moves forward (Figure 2D) while generating a dominant opposing drag force (Figure 3—figure supplement 1A). Because lift dominates drag in the vertical direction (Figure 3—figure supplement 1C), and lift acts perpendicular to wing velocity (making the dot product zero), the vertical component of aerodynamic power (z, orange) is the smallest despite large vertical aerodynamic force (Figure 3A). The avatar illustrates the wing velocity and net aerodynamic force vectors. (B) The total power (black) the flight muscles need to generate is dominated by the aerodynamic power (blue line) during the downstroke, and by the inertial power (green line) during the upstroke. The onset of electrical activation of the pectoralis (muscle EMG) lines up with the onset of pectoralis shortening (decreasing muscle strain, negative muscle velocity), which starts mid-upstroke. Notably, pectoralis shortening velocity reaches zero (dashed vertical line; also in subsequent plots) right before the start of the upstroke, when the required muscle power is low (and plateaus), and the supracoracoideus is known to take over (Tobalske and Biewener, 2008).
Figure 4—figure supplement 1

The three components of inertial power are plotted.
The first component, gravitational power (green; negative gravitational power plotted), which accounts for the combined mass of the wings and body of the bird moving vertically, is comparatively small (11.6% ± 2.8% stroke-averaged magnitude compared to total inertial power). In contrast, the second component, the inertial power due to the acceleration of the wings (red) contributes substantially (48.5% ± 10.5% stroke-averaged magnitude compared to total inertial power). Muscle power to accelerate the wing at the beginning of downstroke and upstroke is positive, and negative when decelerating the wing at the end of the downstroke. The final component is the inertial power due to small accelerations of the body of the bird (blue). Because the mass of the body is high compared to the wing, and because the second derivative of position is highly sensitive, the standard deviation is high for this component of inertial power (the stroke-averaged standard deviation is 69.9% of the average magnitude). The effect of this final component is to shift the phase of the inertial power earlier in the stroke than if only the wings were considered (earlier by 10.5% ± 5.8% of the stroke). The result is that the zero-crossings of the inertial power are more closely aligned with the zero-crossings of the pectoralis muscle velocity (Figure 4B).
Figure 5 with 3 supplements
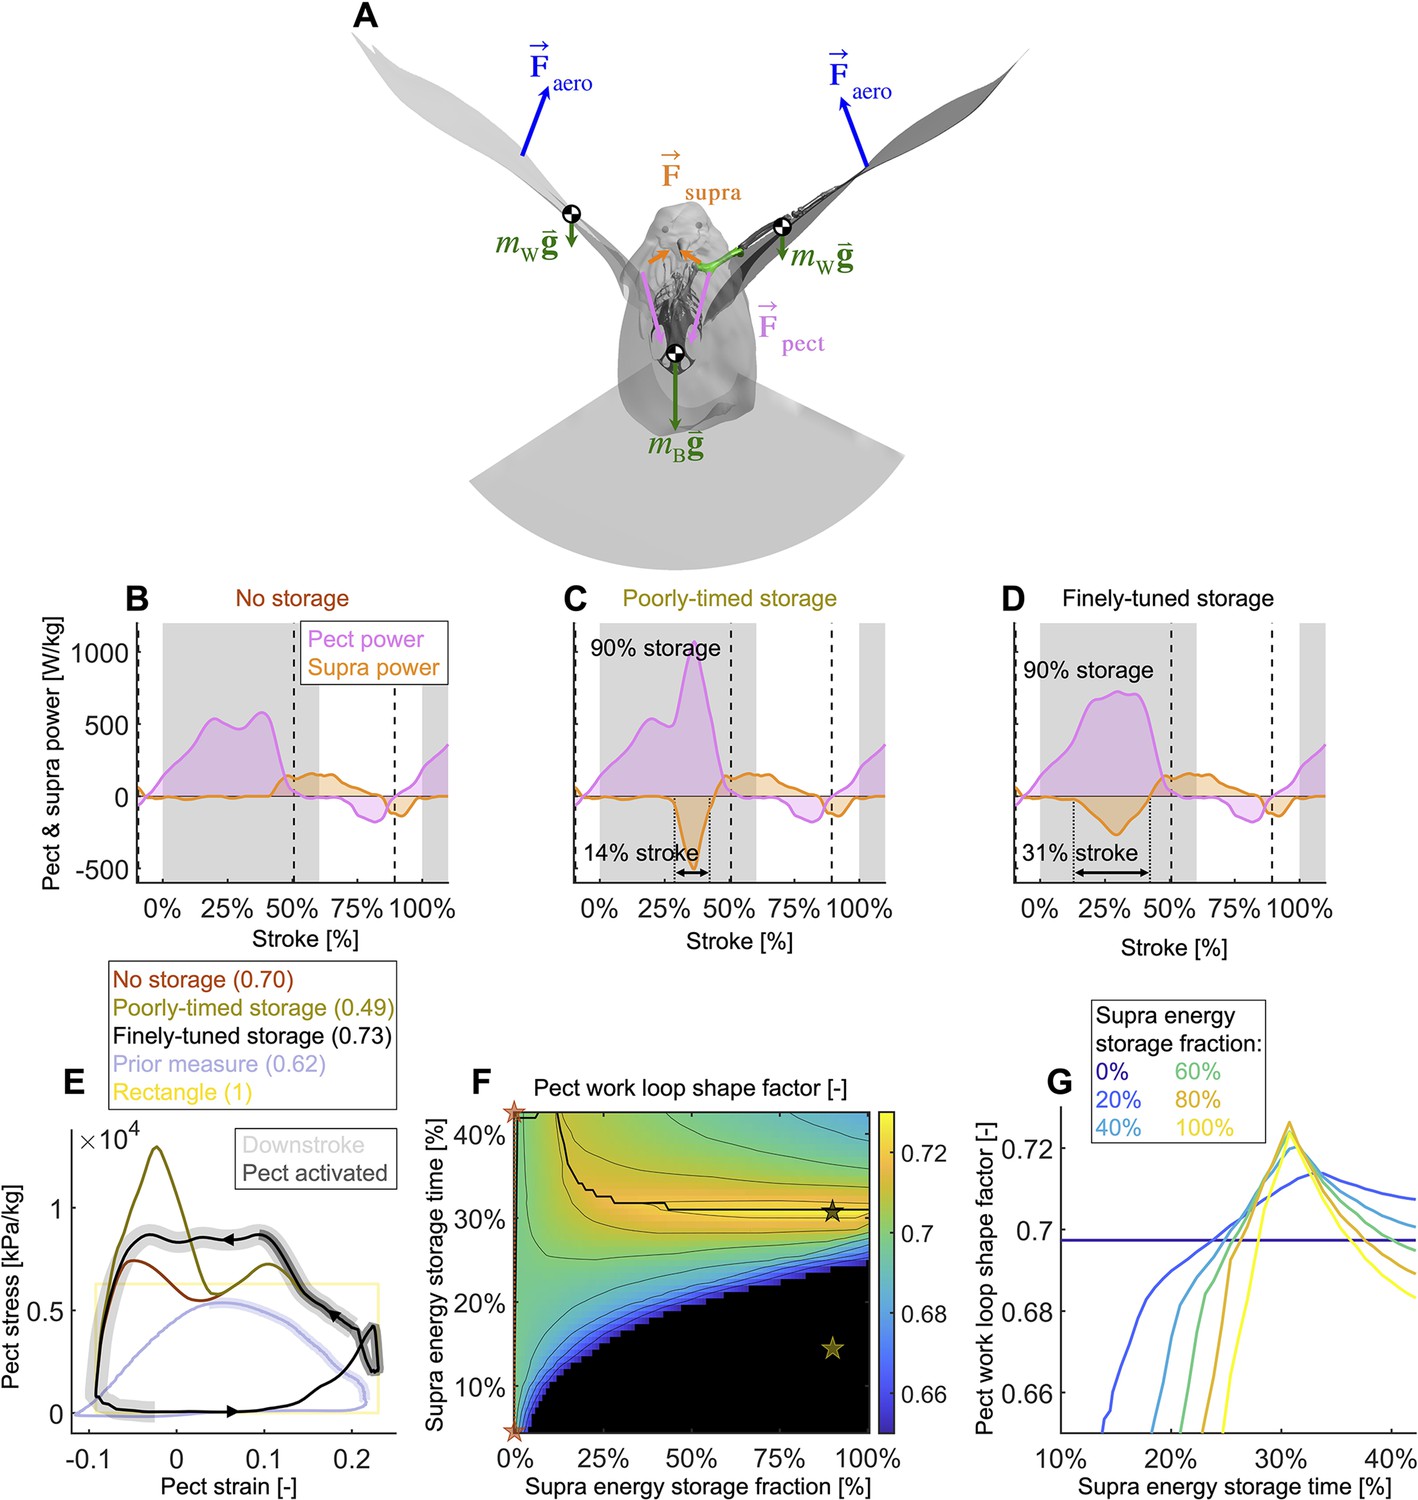
Finely tuned energy storage in the supracoracoideus tendon simplifies the function of both major flight muscles.
(A) Our power model was derived by combining the external and internal force balance shown with the associated kinematic velocities (not shown); see equations in Figure 7—figure supplement 1. Approximately all internal flight forces and associated power are produced by the two primary flight muscles, the pectoralis (pink; ) and the supracoracoideus (orange; ), which move the mass of the body (green; : modeled as a point mass) and wings (green; : modeled as 20 point masses displayed in Figure 1C) to generate the wings' aerodynamic forces (blue; ) and thus power to sustain flight. (B–D) The pectoralis (pink) generates positive power during the downstroke and acts like a brake to absorb negative power during the late-upstroke (power is normalized by pectoralis mass). The supracoracoideus (orange) generates and/or releases positive power during the upstroke. Any energy released by the supracoracoideus tendon during the upstroke must first be stored during the downstroke, which is plotted as negative power. (B) Without energy storage in the supracoracoideus tendon, there is an unfavorable mid-downstroke dip in the required pectoralis output power. (C) If energy storage is poorly timed during the downstroke, the required pectoralis output power unfavorably spikes. (D) If the timing and quantity of energy storage are finely tuned, the pectoralis work loop is more favorably shaped mid-downstroke as it more closely approximates the theoretically ideal rectangular work loop (yellow rectangle in [E]) (E) The finely tuned elastic storage shown in (D) corresponds with the black work loop and results in the highest pectoralis shape factor (0.73) for the range of elastic storage parameters we simulated in (F), with stars corresponding to the loops in (E). Numbers between parenthesis in [E]: shape factor; dark gray shading: electrical pectoralis activation; light gray shading: downstroke phase. The shape factors of both the no-storage (brown: [B]) and finely tuned storage (black: [D]) cases exceed prior experimental shape factor measurements, of doves flying similarly slow (Tobalske et al., 2003). (G) Work loop shape factor as a function of elastic energy storage timing and fraction (color codes energy storage fraction): see Figure 5—figure supplements 1–3 for a detailed overview.
Figure 5—figure supplement 1
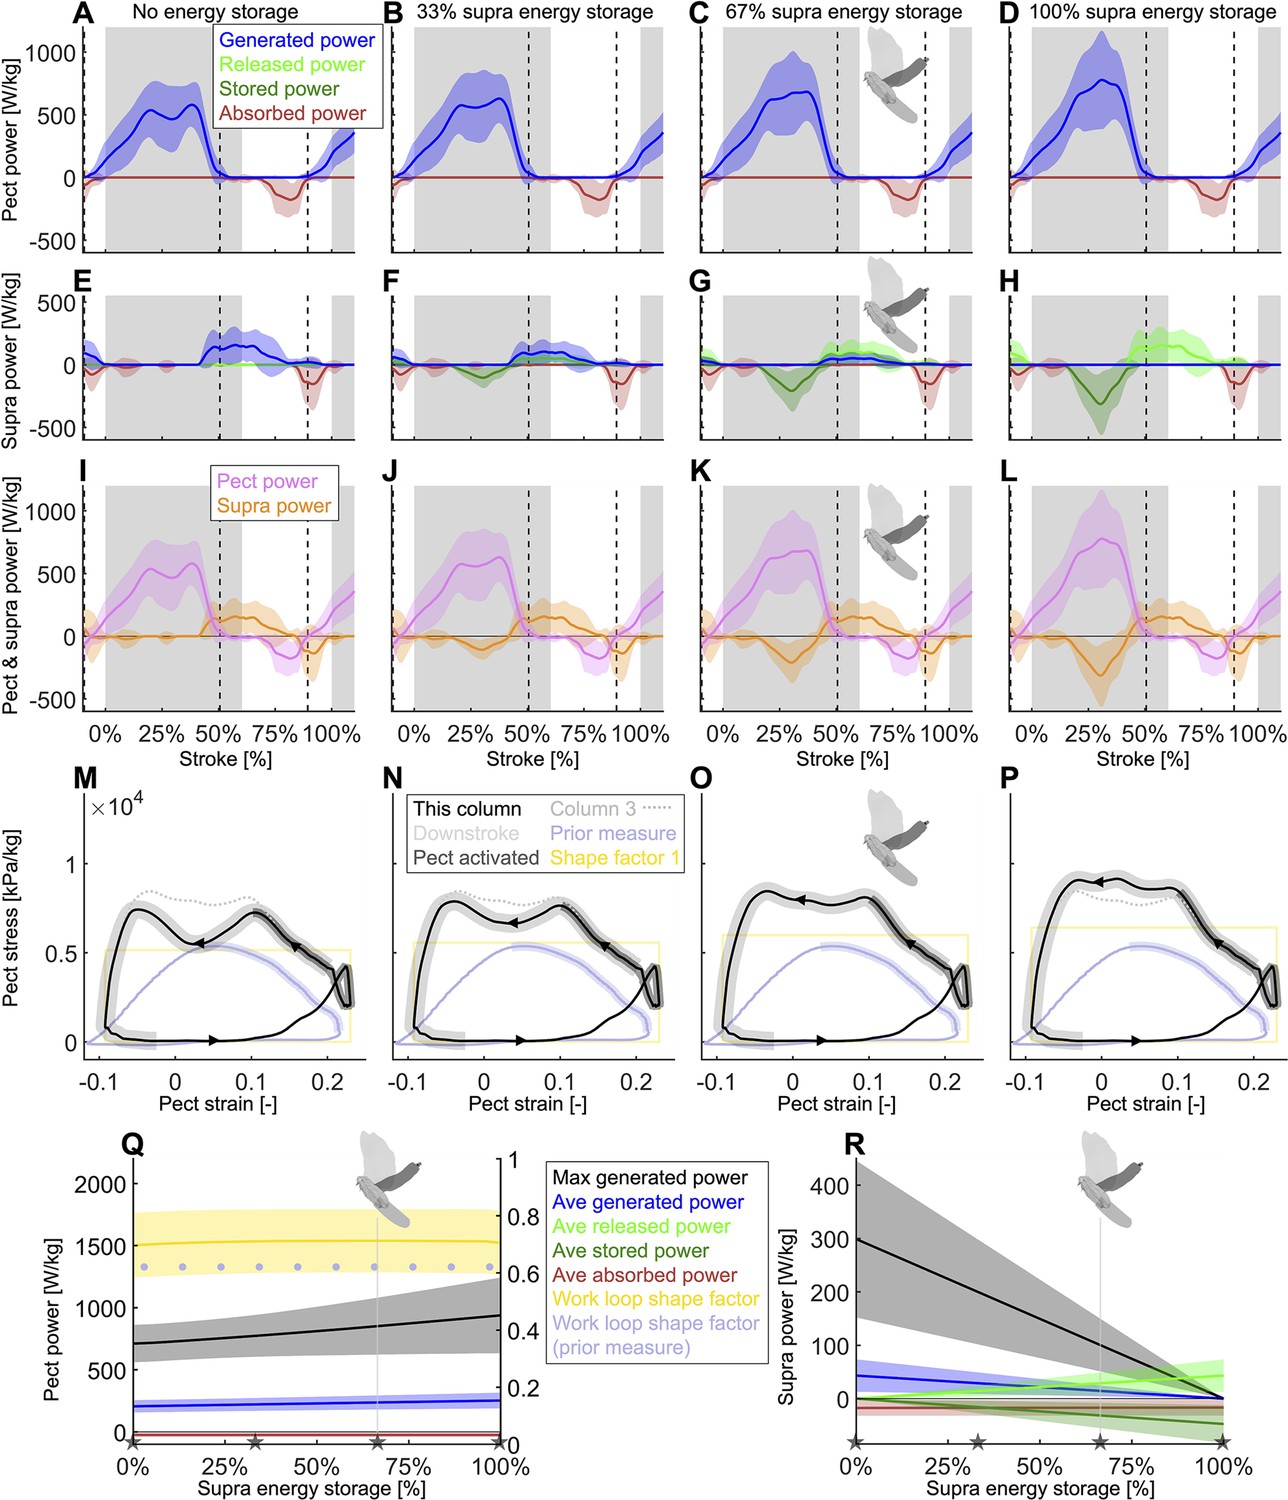
Using our energy storage model (Figure 5A), we analyze how differing amounts of energy storage in the supracoracoideus tendon would affect how the total time-resolved required muscle power (Figure 4B) is split between the pectoralis and supracoracoideus.
To isolate the effect of energy storage amount, which is an important question in the literature (Tobalske and Biewener, 2008), we set the timing of the energy storage constant for now. Specifically, we vary the prescribed fraction of power that the supracoracoideus tendon stores for release during the upstroke and model the pectoralis to produce and transfer this extra power into the supracoracoideus tendon during the mid-to-late downstroke. We find that a power increase of 24.9% ± 17.5% in the pectoralis muscle would enable it to fully power the upstroke by tensioning the supracoracoideus tendon during the downstroke. The color schemes for the two positive and two negative power modes are: blue for generated power (the muscle needs to fully produce this positive power), bright green for released power (the muscle has elastic energy stored up that it can release as positive power), dark green for stored power (the muscle elastically stores negative power), and red for dissipated power (the muscle absorbs this negative power, acting as a brake). N = 4 doves; n = 5 flights each; gray region indicates second downstroke after takeoff; all power scaled by pectoralis mass; vertical dashed lines indicate pectoralis strain rate equals zero. (A–D) The mid-downstroke dip in power generated by the pectoralis (pect) is flattened as extra power is generated and transferred to tension the supracoracoideus. (E–H) When the pectoralis tensions the supracoracoideus tendon during the downstroke, the supracoracoideus (supra) does not need to generate as much power during the upstroke. (I–L) Time-resolved pectoralis (pink) and supracoracoideus (orange) total power, each scaled by the pectoralis mass, are summarized from rows 1 and 2, respectively. Total power equals the summation of the power from the four power modes. By transferring pectoralis power into the supracoracoideus tendon and storing it as potential energy, the pectoralis power buildup does not have to dip midstroke. (M–P) The shape factor (ratio of the observed area to the area of a rectangle with the same range of stress and strain; yellow rectangle shows the work loop with a shape factor of one with the same range of strain) of the pectoralis work loop improves locally as the energy storage fraction increases and flattens the mid-downstroke dip in pectoralis power. The modeled work loop of the pectoralis (black) is compared to the work loop for 67% supracoracoideus energy storage (column 3, light gray; corresponds to the dove avatar in Q and R). The portions of the work loop corresponding to electrical activation of the pectoralis are shaded in dark gray, while the downstroke is shaded light gray. We also compare our derived pectoralis work loop to the work loop measured for doves in similar conditions using a strain gauge mounted on the deltopectoral crest (DPC) of the humerus to estimate pectoralis stress (light blue) (Tobalske et al., 2003). The present pectoralis work loop shape factor is 0.70 according to our baseline recordings (no elastic storage added), whereas the earlier value based on DPC strain gauge recordings was 0.62. The strain gauge-based recordings also underestimate the required stress level to sustain the external aerodynamic and inertial power in vivo (especially considering our analysis excludes minor additional internal musculoskeletal power transfer losses). (Q) As the fraction of elastically stored supracoracoideus power increases, the stroke-averaged absorbed pectoralis power remains constant, while the stroke-averaged generated power increases by up to 24.9% ± 17.5%. The maximum generated pectoralis power (black) increases even more (31.9%), based on the peak required to tension the supracoracoideus tendon during the late downstroke. Notably the pectoralis work loop shape factor remains relatively constant throughout because its value lower than 1 is primarily caused by the simultaneous pectoralis strain rate and power buildup around the start of the downstroke (5C). (R) As the fraction of elastically stored supracoracoideus power increases, the stroke-averaged released power increases linearly, allowing the stroke-averaged generated power and maximum generated power (black) to decrease linearly. The gray stars in (Q) and (R) correspond to the four storage cases in the associated columns (A–P).
Figure 5—figure supplement 2
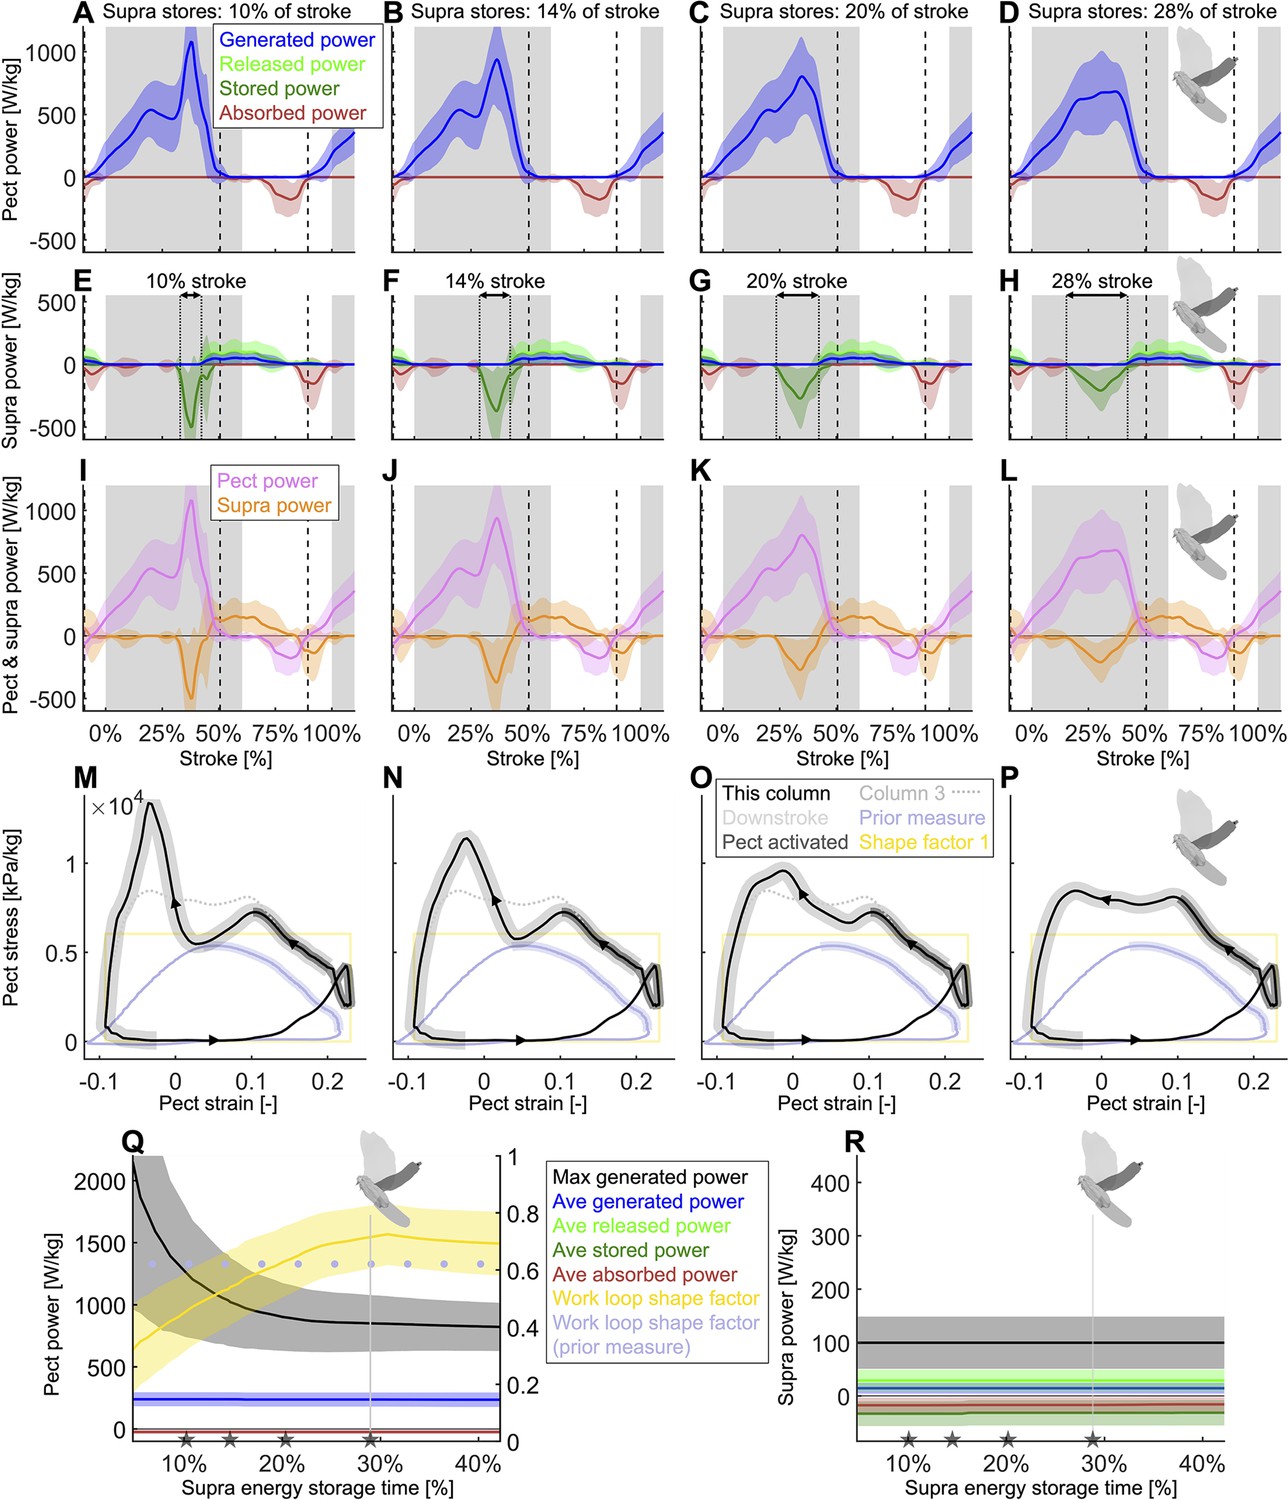
Using our energy storage model (Figure 5A), we find that spreading out the energy storage in the supracoracoideus tendon during the downstroke substantially improves the shape factor of the pectoralis muscle work loop by better flattening the mid-downstroke dip in required muscle power (Figure 4B), resulting in a peak shape factor of 0.73.
Whereas in Figure 5—figure supplement 1, we varied the energy storage fraction, now we hold energy storage constant at 67% (column 3 of Figure 5—figure supplement 1) and vary the less considered and more nuanced timing of the energy storage in the supracoracoideus tendon during the downstroke. The format of this figure is the same as Figure 5—figure supplement 1; column 4 of this figure is identical to column 3 of Figure 5—figure supplement 1: dove avatar in (Q) and (R) indicates identical parameters from column 3 of Figure 5—figure supplement 1. (E–H) Vertical dotted lines are added to highlight the varying timing of energy storage in the supracoracoideus tendon. (A, E, I, M) If the supracoracoideus tendon is tensioned rapidly (10% the length of the stroke; 17% the length of the downstroke), this causes a costly late-downstroke spike in pectoralis power generation. (B, F, J, N) If the supracoracoideus tendon is tensioned over a longer portion of the downstroke (14% the length of the stroke; 23% of the downstroke), late-downstroke spike in pectoralis power generation is lessened. (C, G, K, O) This trend continues as the supracoracoideus tensioning is spread out more (20% the length of the stroke; 33% of the downstroke). (D, H, L, P) If the supracoracoideus tendon is tensioned over 28% of the stroke (46% of the downstroke), the spike in pectoralis power needed for energy storage overlaps the mid-downstroke dip in required muscle power (Figure 4B). Hence, the mid-downstroke pectoralis power is smoother and more closely resembles direct pectoralis power measurements for other birds (Tobalske and Biewener, 2008). (Q, R) The stroke-averaged power remains constant when all that changes is the timing of the elastic storage. However, the peak generated pectoralis power is higher when the elastic storage region is short. (Q) The pectoralis work loop shape factor is maximized when the supracoracoideus storage time is more spread out over the downstroke. The gray stars in (Q) and (R) correspond to the four storage cases in the associated columns (A–P).
Figure 5—figure supplement 3
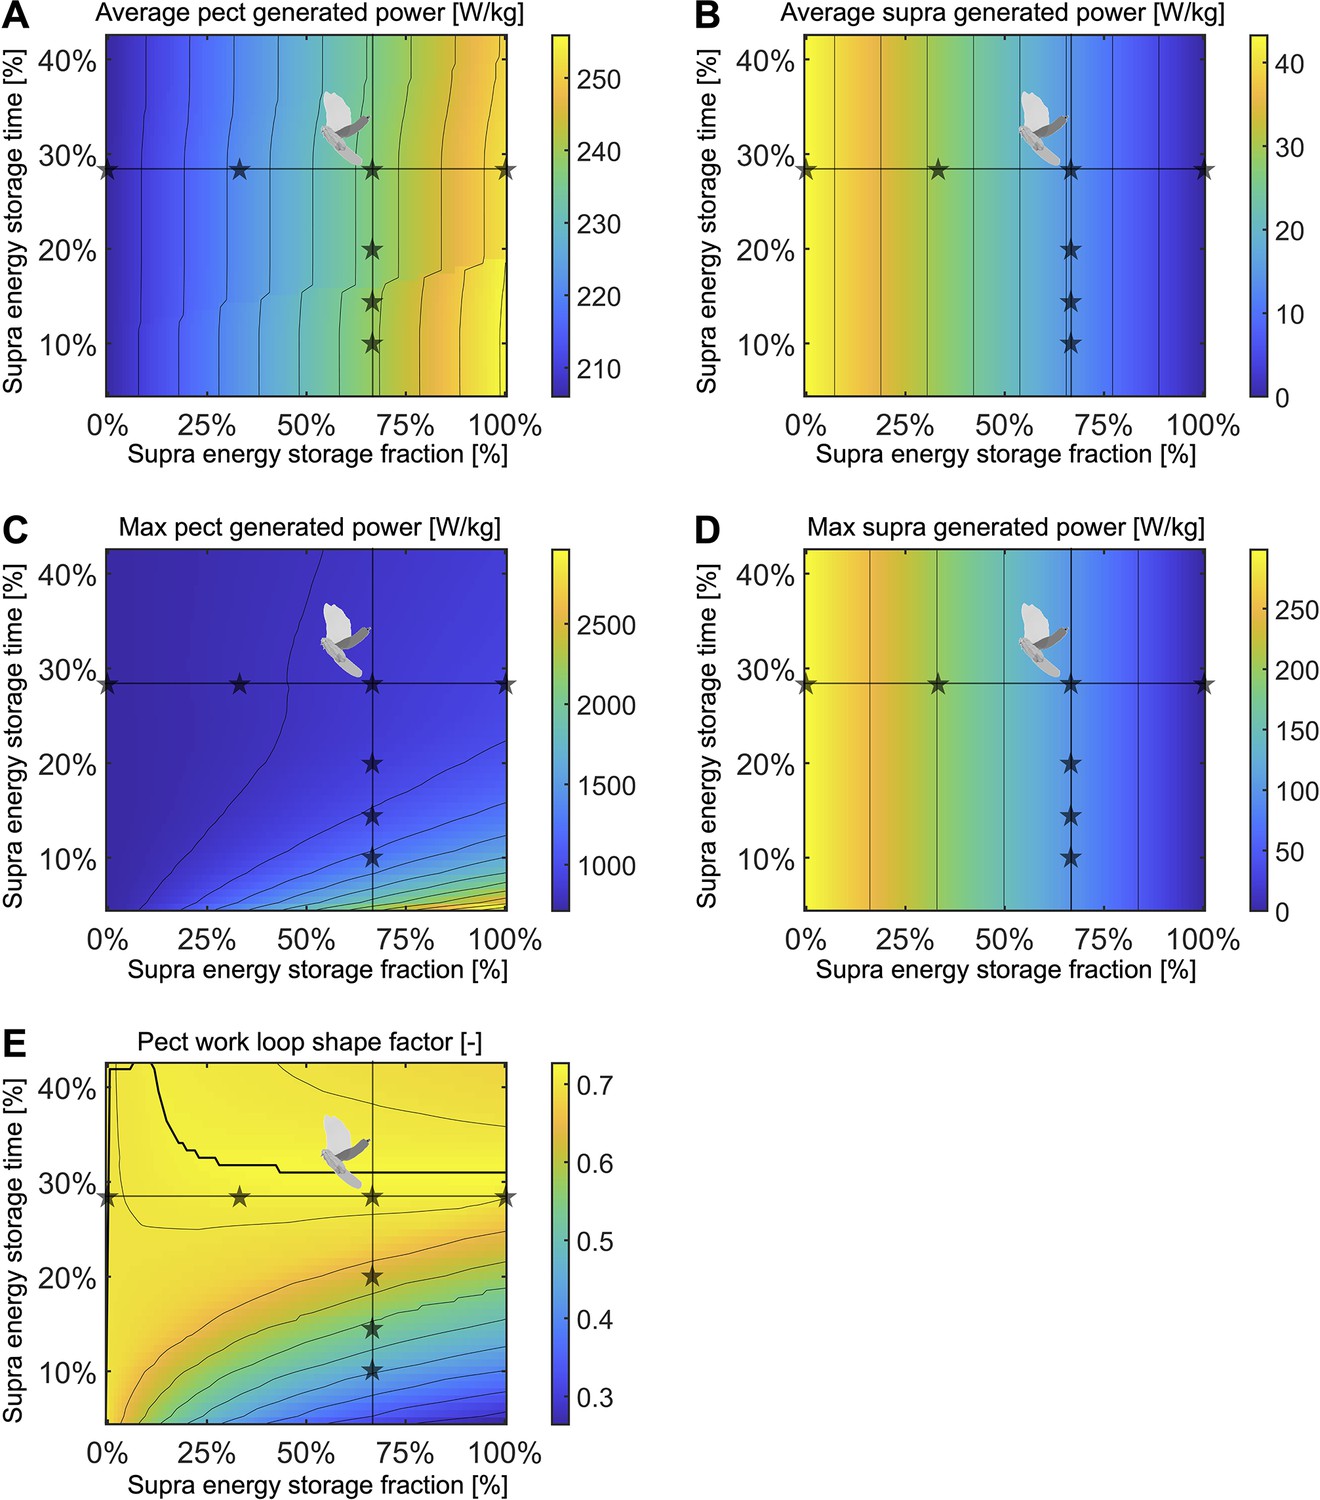
Using our energy storage model (Figure 5A), we find that for supracoracoideus energy storage fractions above 35%, a pectoralis work loop shape factor of over 0.72 can be achieved by spreading the storage time in the supracoracoideus tendon out over 31% of the stroke.
To gain insight into the tradeoffs between generated muscle power and elastic energy release, we vary two parameters in this model: the fraction of supracoracoideus power which is elastically stored and released (x-axis; columns in Figure 5—figure supplement 1 correspond to stars along the horizontal lines; 100 grid points), and the time period over which energy is stored in the supracoracoideus tendon (y-axis; columns in Figure 5—figure supplement 2 correspond to stars along the vertical lines; 51 grid points). (A) The stroke-averaged pectoralis-generated power is mostly a function of the energy storage fraction and increases gradually as energy storage is increased. (B) The stroke-averaged supracoracoideus-generated power is only a function of the energy storage fraction and decreases linearly as energy storage is increased. (C) The maximum pectoralis-generated power rapidly peaks when the energy storage fraction is high and the energy storage time period is short. (D) The maximum supracoracoideus-generated power is only a function of the energy storage fraction and decreases linearly as energy storage is increased. (E) Pectoralis work loop shape factors (ratio of the observed area to the area of a rectangle with the same range of stress and strain) near the maximum shape factor of 0.73 can be achieved at multiple different energy storage fractions. The maximum shape factor for each energy storage fraction is plotted as a thick black line.
Figure 6 with 1 supplement
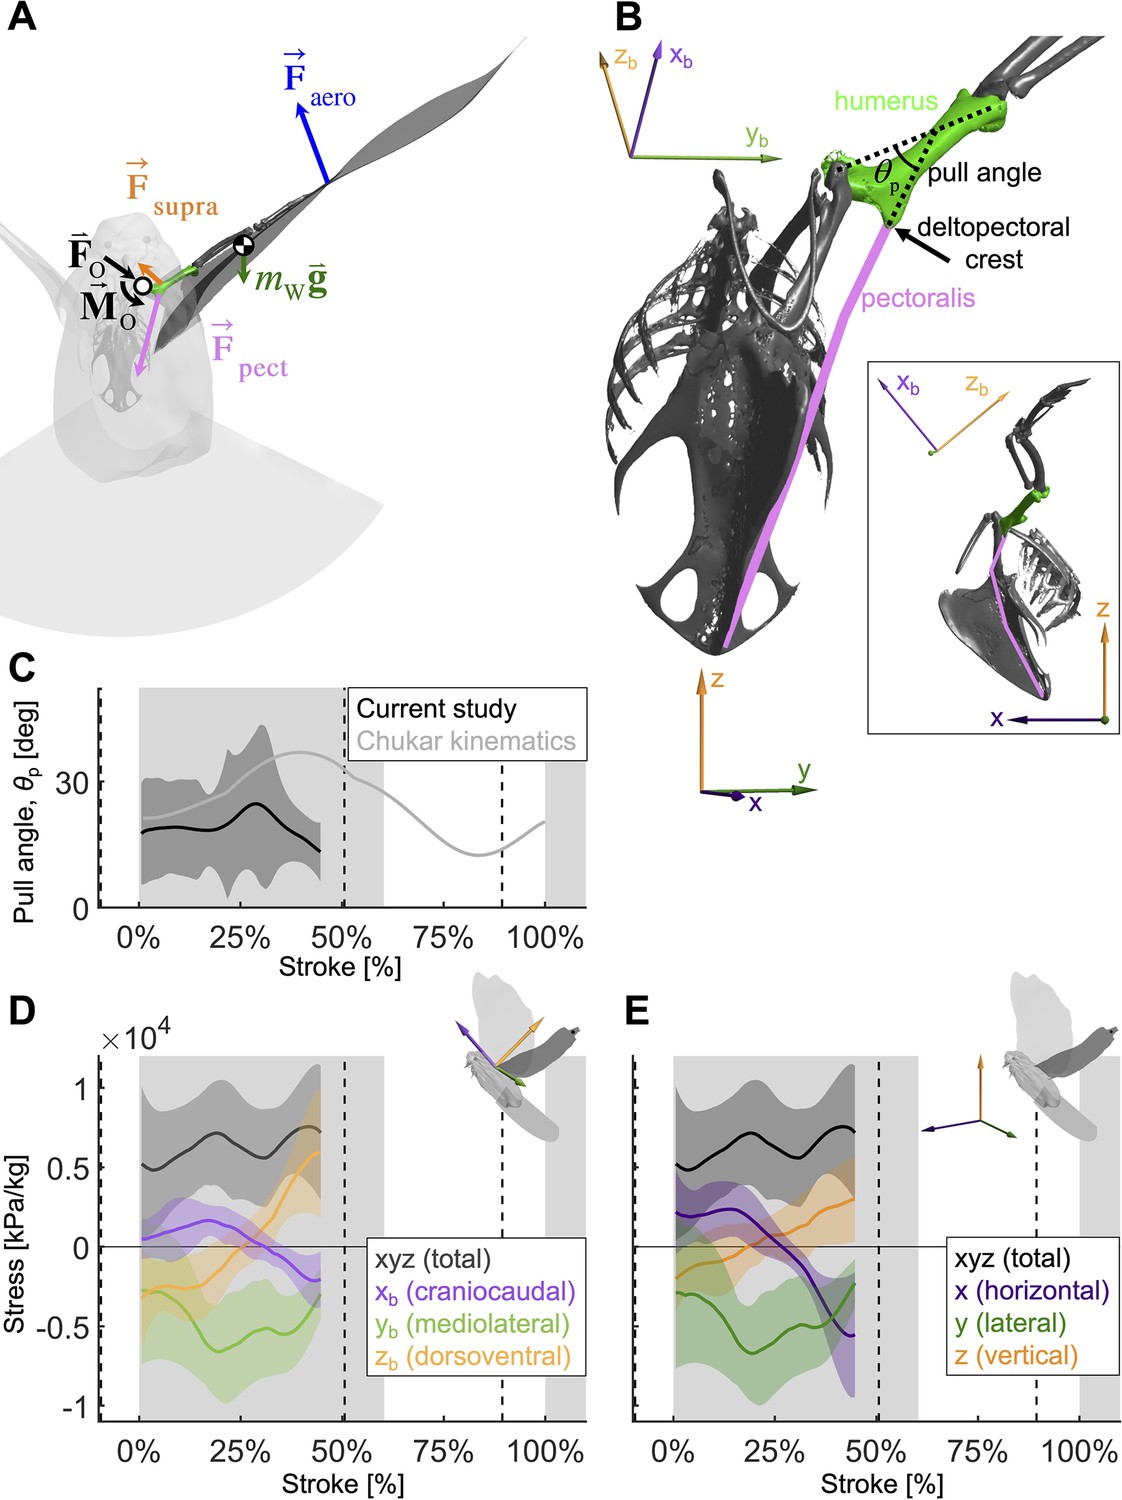
To quantify how the recruitment of the pectoralis muscle changes during the downstroke, we consider the balance of 3D angular momentum by calculating the associated torques.
(A) The forces are as in our 1D power balance (Figure 5A), but instead of considering the entire bird, we evaluate the balance around the left shoulder joint. Consequently, body mass becomes irrelevant, and instead a reaction force (; cancels out) and moment (; assumed small compared to other torques) at the shoulder joint appear. (B) The pull angle between the humerus and the pectoralis, , dictates how effectively the pectoralis exerts torque on the wing. The inset shows the corresponding lateral view with subscript ‘b’ referencing the body frame while no subscript indicates world frame. The pull angle depends both on the humerus orientation during the wingbeat and pectoralis muscle fiber recruitment. (C) During downstroke, the pull angle that we compute for the doves in slow flight (black line) is lower than chukars during wing-assisted incline running (Heers et al., 2016) (gray line). However, if pectoralis moment is used to tension the supracoracoideus tendon during the second half of the downstroke to more finely tune the wingbeat, the pull angle would necessarily increase to values higher than plotted here and shift the curve towards chukar values. (D, E) The 3D vector direction (purple: +xb: cranial, -xb: ventral; green: +yb: medial, -yb: lateral; orange: +zb: dorsal, -zb: ventral) and stress magnitude (black), associated with the pectoralis pull on the humerus, were computed using the pull angle and the modeled position of the humerus under the assumption that it is the only muscle generating a moment on the wing during the downstroke.
Figure 6—figure supplement 1
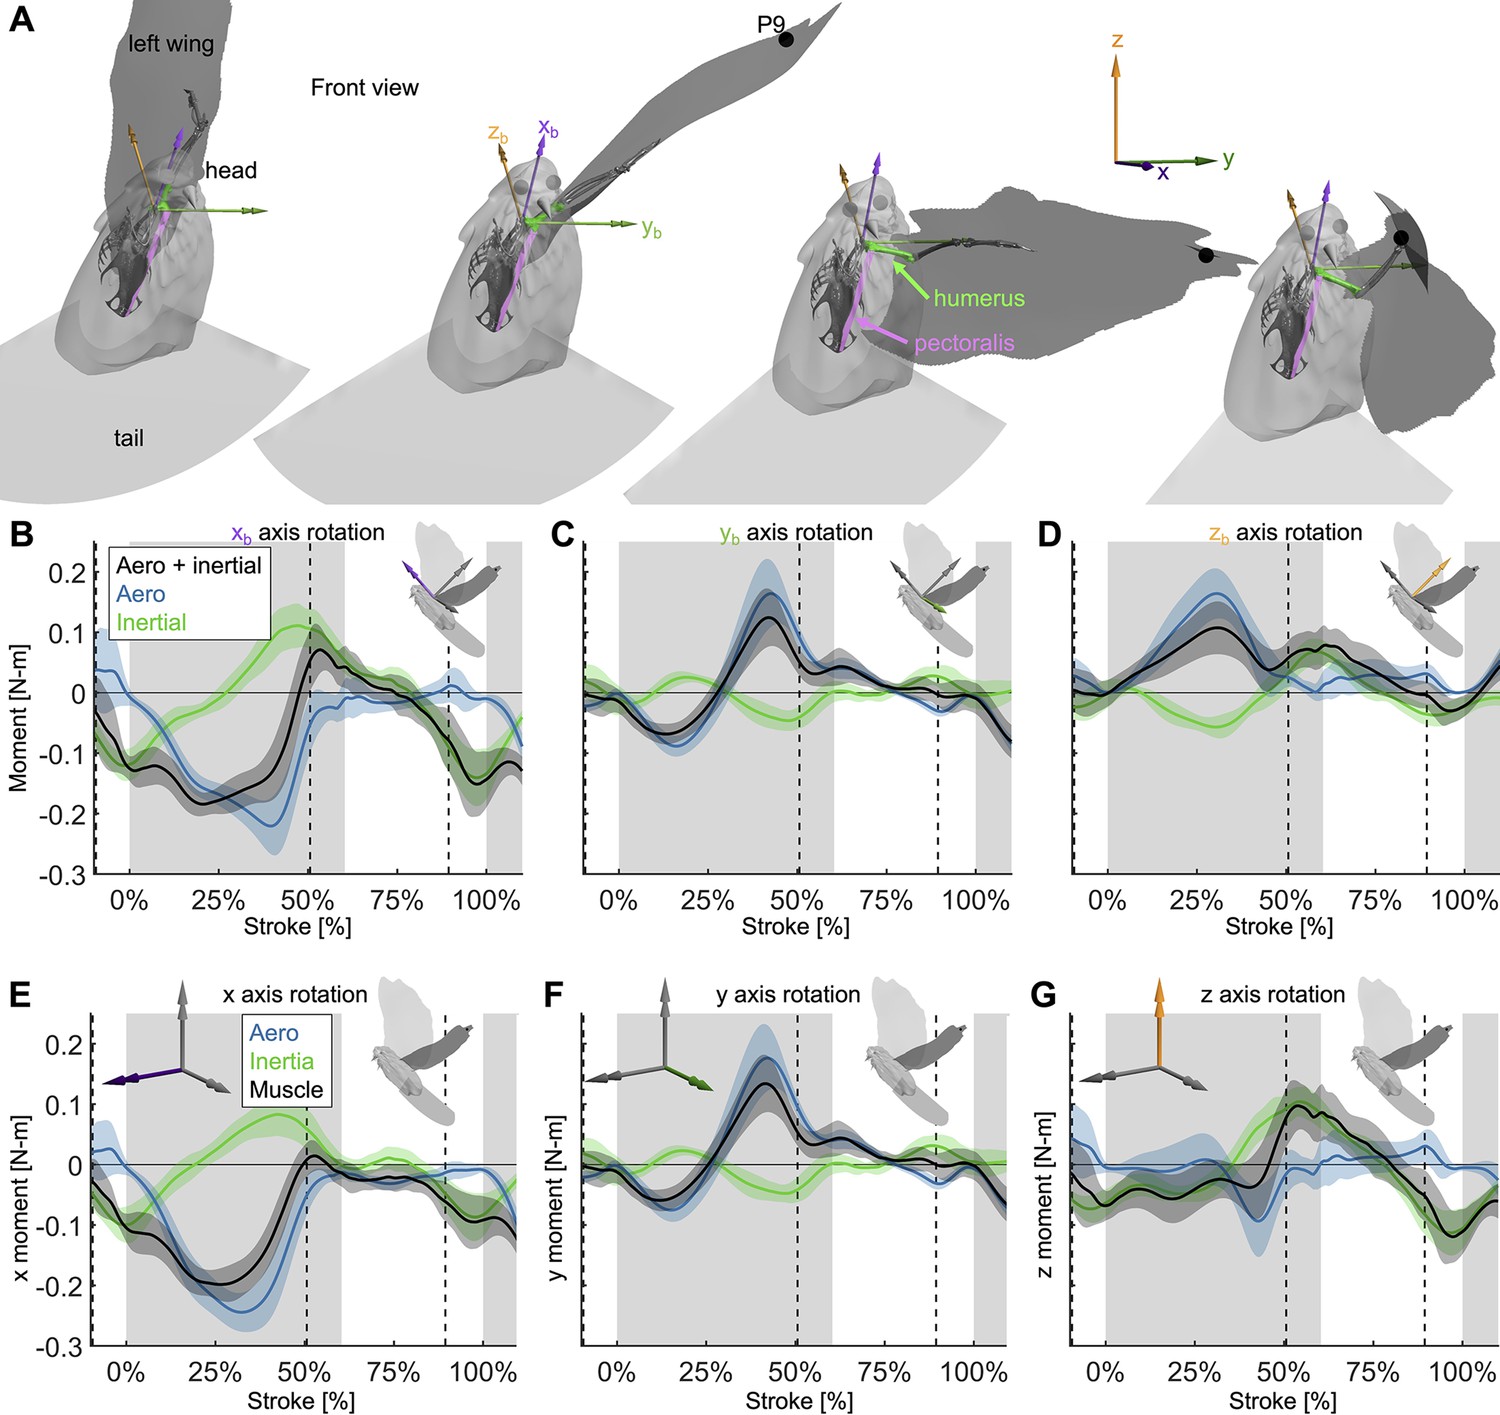
Extra details are added to Figure 6 to demonstrate how the 3D angular momentum balance works.
(A) The frontal view of the dove at 0, 33, 67, and 100% of the downstroke is shown with the right wing surface removed. The skeleton was positioned based on the shoulder joint and wing kinematics, with only the humerus (green), radius/ulna, and manus permitted to move relative to the body (radius/ulna and manus are used for visualization only). The skeleton was used to define a new ‘body’ reference frame, where the xb axis points in the cranial direction (aligned with the thoracic vertebrae of the dove), the yb axis points in the distal direction (aligned with the y direction in the Newtonian reference frame if the dove flies straight from the takeoff perch to the landing perch), and the zb axis points in the dorsal direction. For visualization, the pectoralis was modeled as a path along points that are rigidly attached to the skeletal body and humerus. (B–D) Similar to the 1D power balance (Figure 5), the 3D required muscle moment (black) is composed of the vector sum of the aerodynamic (blue) and inertial (green) 3D moments. (B) The flight muscles need to pull ventrally on the wing (negative moment in the cranial, xb, axis) during the downstroke, to oppose lift and drag, which point vertically up (Figure 3A, Figure 3—figure supplement 1C). During the upstroke, inertial effects dominate, such that the flight muscles pull dorsally during stroke reversal into the beginning of the upstroke and ventrally at the end of the upstroke. (C) In the lateral (yb) axis, the required muscle moment is primarily due to aerodynamics rather than inertia. At the beginning of the downstroke, the wing is toward the posterior of the dove, creating a positive yb aerodynamic torque, which is balanced by a muscle moment to supinate the wing. At the end of the downstroke, the wing is toward the anterior of the dove, so the opposite is true. (D) Because the dorsal (zb) axis of the dove is partially pointed horizontally backward, the lift and drag in the positive vertical direction (Figure 3—figure supplement 1C) generate a cranial moment during the downstroke. The flight muscles generate a caudal moment during the downstroke to oppose the aerodynamic moment. (E–G) The same 3D angular momentum balance data is shown as in (B–D), but in the familiar Newtonian reference frame shown in Figure 1C. (E) Moments in the x-axis. (F) Moments in the y-axis. (G) Moments in the z-axis.
Figure 7 with 4 supplements
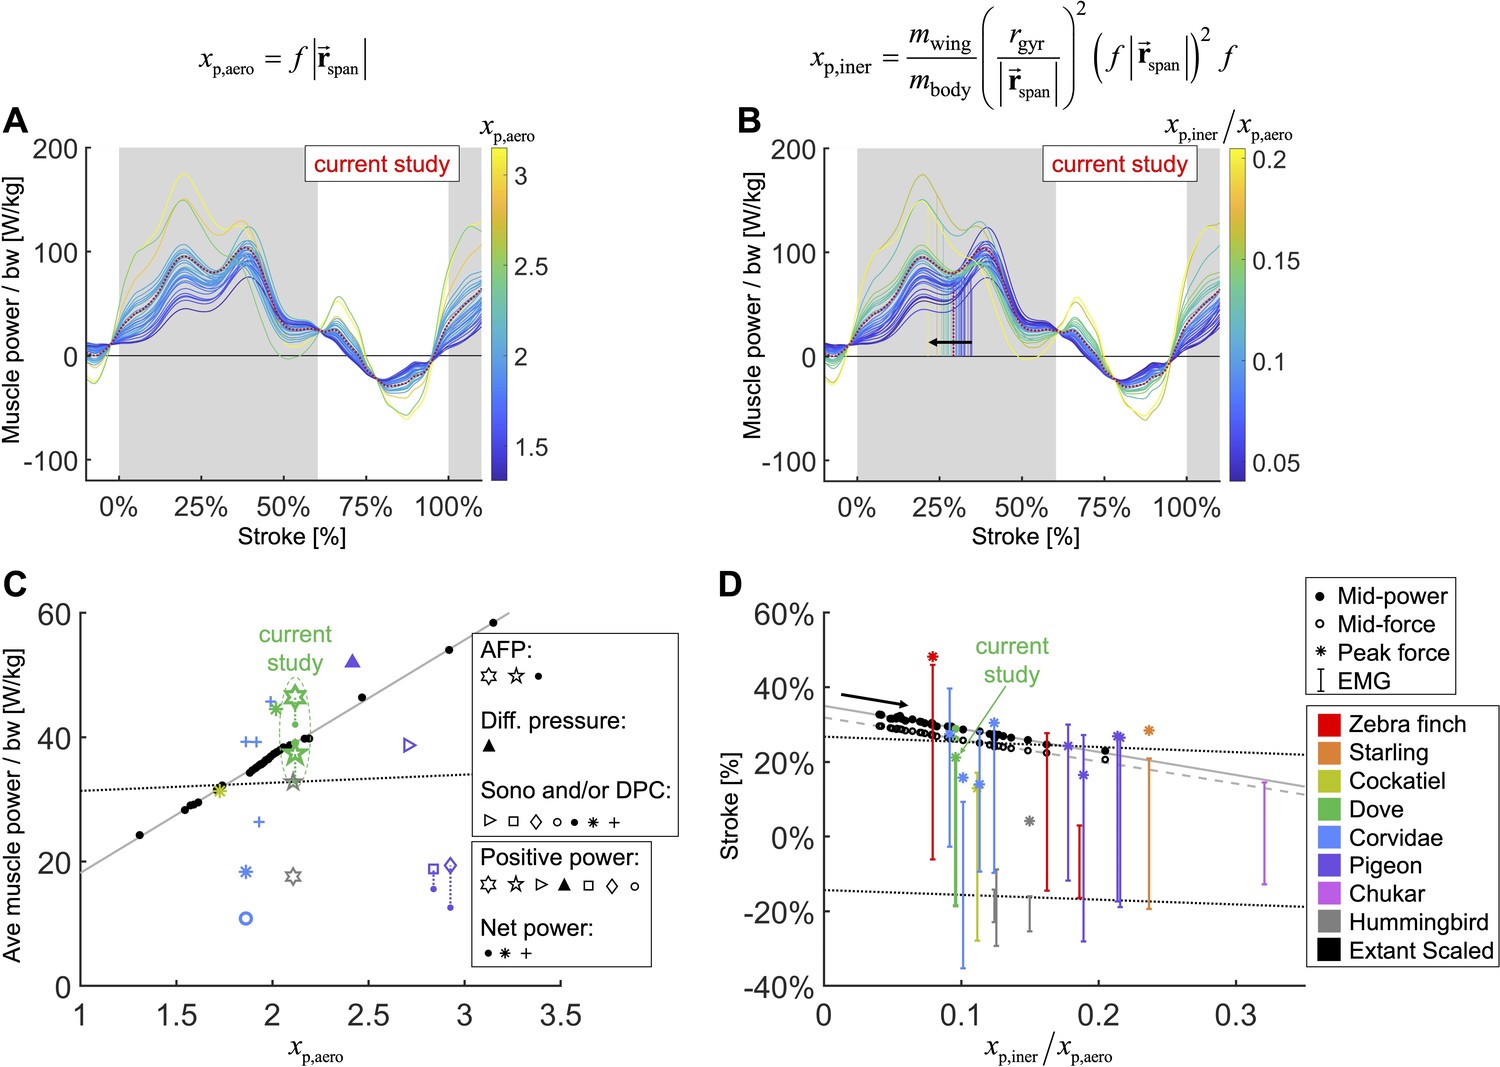
We integrate body morphological and kinematic scaling laws across extant birds with our aerodynamic, inertial, and muscle power measurement for doves to predict how average muscle power and timing should scale.
(A, B) Averaged data from the current study is plotted in red, which is scaled based on extant bird data (other colored lines; power scaled by bodyweight: bw). (C, D) Data from the current study is plotted in green, and scaled extant bird data is plotted in black. Data measured directly in other studies at similar flight speeds (1.23 m/s) are plotted in multiple colors and marker types, which correspond to and are explained in detail in the caption of Figure 7—figure supplement 3. (A, C) The stroke-averaged muscle power scaled by bodyweight is proportional to wingtip velocity and the aerodynamic power scaling parameter, . Stroke-averaged pectoralis power data from the literature (fitted with dotted black line) is too scattered to confirm the trendline from our scaling analysis (solid gray line). (B, D) Because wing inertia dominates aerodynamic scaling, the pectoralis needs to activate earlier at larger scale (and vice versa). Hence, the timing of power and force production within the stroke scale according to the ratio of the inertial and aerodynamic power scaling parameters, . The colored vertical lines in (B) are plotted at the midway point of pectoralis power exertion (Equation S75). This same midway point is plotted as filled dots in (D) with a solid gray linear-fit line. The midway point of pectoralis force exertion (Equation S76) is plotted as empty dots in (D) with a dashed gray linear-fit line. EMG timing data (colored solid lines with hashes at the start and end; starting points fitted with lower dotted black line) and corresponding peak pectoralis force data (asterisks; fitted with upper dotted black line) from the literature are too scattered to confirm the subtle trendlines from our scaling analysis.
Figure 7—figure supplement 1
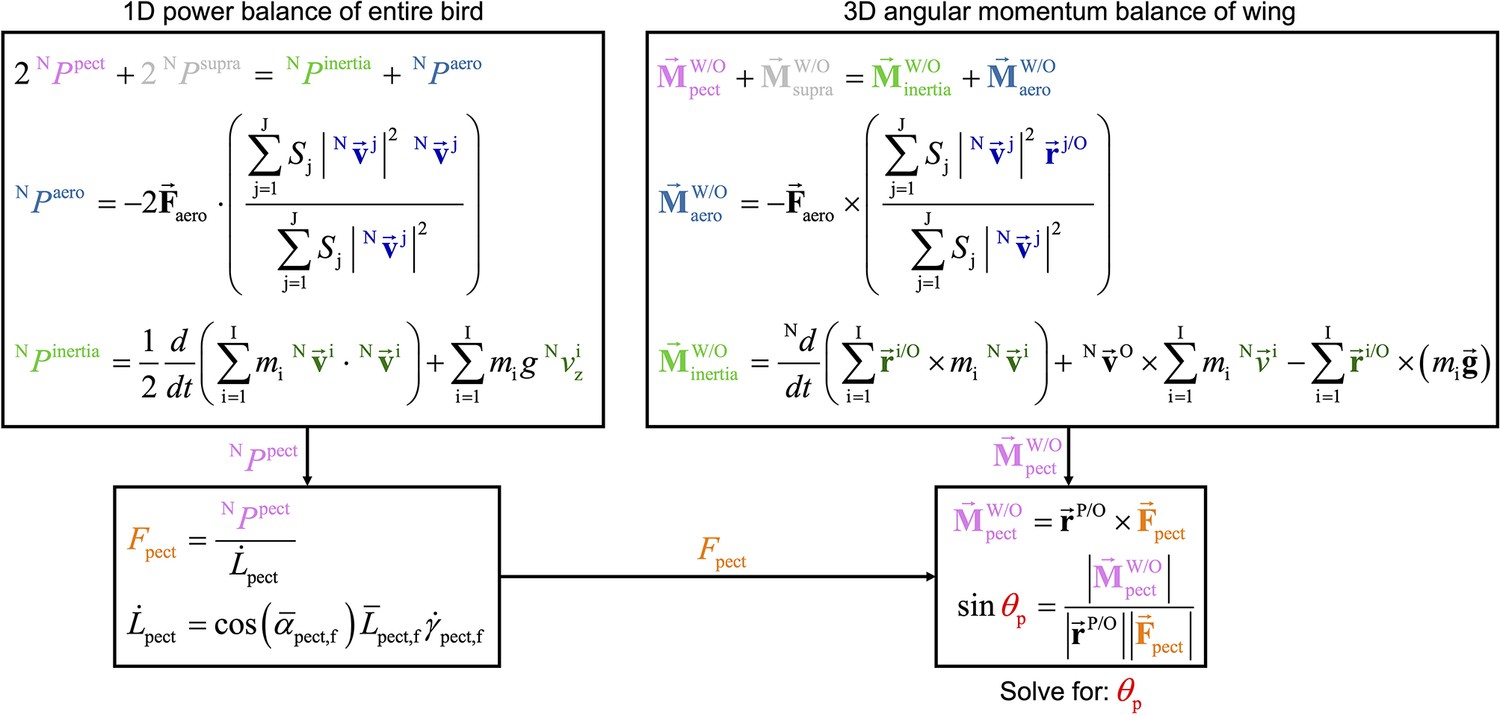
The two overarching dynamics balance methods that we use to analyze muscle behavior resolves different information, yet are related in their form and together provide insight into the pull angle of the pectoralis on the humerus.
While the 1D power balance method resolves required muscle power, the 3D angular momentum balance method resolves the 3D direction which the pectoralis pulls on the humerus. However, the two methods are similar in that in each method the muscle quantity (pink text) equals the sum of the aerodynamic quantity (blue text) plus the inertial quantity (green text). In this flow chart, the equations used in the main text to compute the total muscle power and moments are summarized, and their relationship is visualized, culminating in the computation of the pectoralis pull angle, (see Figure 6C). The top-left box summarizes the 1D power balance method which results in total muscle power. This can be used to solve for the pectoralis force magnitude, . The top-right box summarizes the 3D angular momentum balance which results in total muscle moment. Based on the measured distance between the shoulder joint and the deltopectoral crest (), we can compute the pectoralis pull angle on the humerus.
Figure 7—figure supplement 2

Extra detail is added to Figure 7.
(A) Aerodynamic power scaled by bodyweight scales linearly with . (B) Inertial power scaled by bodyweight scales linearly with .
Figure 7—figure supplement 3

We compare our computed stroke-averaged pectoralis power scaled by pectoralis mass with values measured in the literature using a variety of different methods, bird species, and flight speeds during level flight.
The data is scattered, and the current study fits within the range of previous measurements. The type of bird corresponds with the color as labeled in the legend and follows rainbow order from the lightest (red) to the heaviest (pink). Each study corresponds to a different marker type, which can be grouped in the following manner: (1) closed-border shapes (☆, ▷,▴,☐, ◇,◦) indicate that the study reported the average positive pectoralis power, while filled-in shapes (•, *, ×, +) indicate that the study reported the average net pectoralis power. Dotted lines connect studies which reported both net and positive average power, and solid lines connect data from the same study across different flight speeds. (2) Different methods were used to measure pectoralis power. Star shapes (☆, •) indicate that the aerodynamic force platform (AFP) was used to measure aerodynamic forces (includes the current study), which were used in combination with kinematics to compute muscle power. A filled-in triangle (▴) indicates that differential pressure sensors on the wings were used to compute muscle power. Other shapes (▷,☐, ◇,◦,•, *, ×, +) indicate that some combination of sonomicrometry (sono) to measure muscle length and a strain gauge (limited by high-variance calibrations of muscle stress; Jackson and Dial, 2011a) on the deltopectoral crest (DPC) of the humerus was used to measure muscle force. The plotted shapes refer to the following studies: (1) current study: AFP + kinematics (dove: green): • (net power), ☆ (5-sided-star; positive power; no energy storage), ☆ (6-sided-star; positive power; 100% energy storage). (2) Biewener et al., 1998: Sono + DPC (pigeon: purple): • (net power), ◇(positive power). (3) Tobalske and Biewener, 2008: Sono + DPC (pigeon purple): • (net power), ☐ (positive power). (4) Dial et al., 1997: Sono + kinematics (magpie: turquoise): o (positive power). (5) Tobalske et al., 2003: Sono + DPC with quasi-steady aerodynamics model for calibration (dove: green, cockatiel: yellow-green, magpie: turquoise): * (net power). (6) Soman et al., 2005: Sono + DPC (pigeon: purple): ▷ (positive power). (7) Usherwood et al., 2005: differential pressure sensors on wings (pigeon: purple): ▴ (positive power). (8) Ellerby and Askew, 2007: Sono in vivo + muscle force in vitro (zebra finch: red, budgerigar: orange): × (net power). (9) Jackson and Dial, 2011a: Sono + DPC (jay: gold, magpie: turquoise, crow: blue, raven: pink): + (net power). (10) Ingersoll and Lentink, 2018: AFP + kinematics (Anna’s hummingbird: gray): ☆ (net power; no energy storage), ☆ (6-sided-star; net power; perfect energy storage).
Figure 7—figure supplement 4
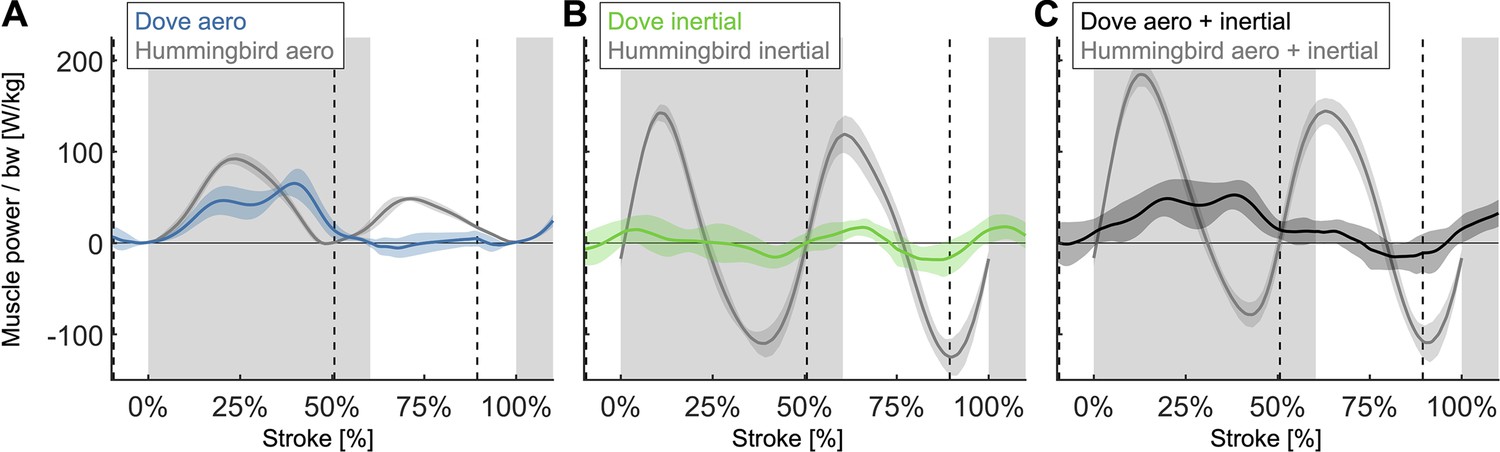
By comparing our computed time-resolved power for doves (Figure 4B) to hummingbirds also computed using the aerodynamic force platform in Ingersoll and Lentink, 2018, we find that the aerodynamic power during downstroke is similar, while the aerodynamic power during upstroke and the inertial power are very different.
N = 6 Anna’s hummingbirds, n = 5 wingbeats each, flapping frequency = 41 Hz, N = 4 doves, n = 5 flights each, flapping frequency = 9.8 Hz; second stroke after takeoff for doves and hovering flight for hummingbirds; gray region indicates downstroke for doves; power scaled by bodyweight: bw; vertical dashed lines indicate pectoralis strain rate equals zero for doves. (A) The aerodynamic power scaled by bodyweight is similar during upstroke and downstroke for hummingbirds (gray), whereas for doves (blue), the primary aerodynamic power is during downstroke. (B) The magnitude of the inertial power scaled by bodyweight is significantly larger for hummingbirds (gray) than for doves (green). (C) The required muscle power (aerodynamic + inertial power) scaled by bodyweight is larger for hummingbirds (gray) during the majority of the stroke than for doves (black).
Tables
Table 1
Morphological data for doves (N = 4 doves).
| Variable | Mean ± SD |
|---|---|
| Body mass (g) | 161.6 ± 11.4 |
| Wing span (tip to tip outstretched) (cm) | 50.03 ± 2.28 |
| Wing radius (tip to shoulder outstretched) (cm) | 22.58 ± 1.13 |
| Single wing area (outstretched) (cm2) | 182.6 ± 20.2 |
| Tail area (outstretched) (cm2) | 140.1 ± 17.8 |
| Aspect ratio (-) | 6.89 ± 0.48 |
| Single pectoralis mass (g) | 14.66 ± 1.97 |
| Pectoralis fascicle length (mm) | 17.12 ± 1.43 |
| Pectoralis fascicle angle (°) | 33.58 ± 2.85 |
| Pectoralis Physiological Cross-Sectional Area (PCSA) (mm2) | 690.1 ± 92.8 |
| Distance between pectoralis sonomicrometry crystals (mm) | 12.27 ± 1.70 |
| Single supracoracoideus mass (g) | 3.26 ± 0.57 |
Table 2
Measured kinematics and contractile properties for the second stroke after takeoff.
Positive yaw angle corresponds with the dove yawing to the left. The advance ratio is forward translational velocity divided by wingtip velocity as in Ellington, 1984 (N = 4 doves; n = 5 flights each).
| Variable | Mean ± SD |
|---|---|
| Flight speed (m/s) | 1.23 ± 0.13 |
| Downstroke length (ms) | 61.80 ± 4.73 |
| Upstroke length (ms) | 40.65 ± 3.88 |
| Flapping frequency (Hz) | 9.80 ± 0.62 |
| Yaw angle (°) | 1.62 ± 6.33 |
| Advance ratio (-) | 0.14 ± 0.01 |
| Max pectoralis strain (ε) | 0.23 ± 0.01 |
| Max pectoralis velocity (m/s) | 0.24 ± 0.04 |
Additional files
-
Supplementary file 1
Measured aerodynamic property tables.
(a) Air conditions across all 20 flights. N = 4 doves; n = 5 flights each. (b) Measured aerodynamic and leg impulses before surgery, after surgery, and after surgery with the suspended recording cable (for recording EMG and sonomicrometry). So that horizontal and vertical impulses can be compared, gravity has been subtracted from the vertical impulse, so that while at rest, the vertical impulse is zero (horizontal and vertical impulse scaled by bodyweight, bw and integration time; bodyweight is based on the average vertical force on the takeoff perch before takeoff). These definitions for impulse match Chin and Lentink, 2017 paper on directional impulse of birds (Chin and Lentink, 2017). (c) Measured aerodynamic and leg impulses among individual doves. The definition for impulse matches Supplementary file 1b. (d) Measured aerodynamic forces for the second stroke after takeoff (Figure 3). The weight of the dove is primarily supported during the downstroke. Drag partially contributes to weight support, while opposing forward aerodynamic force. The reported values are the stroke-averaged aerodynamic force measured by the aerodynamic force platform (AFP), normalized by bodyweight. We compute the time-resolved lift and drag using the measured horizontal and vertical aerodynamic forces together with the measured wing velocity. N = 4 doves; n = 5 flights each; mean ± standard deviation. (e) We compute aerodynamic, inertial, and required muscle power based on first principals (Figure 4) and model the effect of the amount of energy storage in the supracoracoideus (Figure 5). The primary component of stroke-averaged net muscle power is aerodynamic, whereas the positive and negative regions of inertial power cancel. Our energy storage model predicts that the pectoralis would need to generate 24.9% ± 17.5% more power to fully power the upstroke via energy storage in the supracoracoideus. N = 4 doves; n = 5 flights each; mean ± standard deviation.
- https://cdn.elifesciences.org/articles/89968/elife-89968-supp1-v1.pdf
-
Supplementary file 2
Scaling analysis (Figure 7) parameter summary.
- https://cdn.elifesciences.org/articles/89968/elife-89968-supp2-v1.pdf
-
Supplementary file 3
Detailed breakdown of data from extant birds used for the scaling analysis (Figure 7).
(a) Detailed breakdown of data from extant birds used for the scaling analysis (Figure 7). Some data was scaled isometrically by bodyweight based on matching the species of the bird (blue). Other data was found based on published scaling relationships (green). The references corresponding to the letter plus number keys (found in columns titled Src) are in Supplementary file 3c. To match some of the bird species, a close relative was used when data was missing for the original species: close relative of Parus ater used was Parus cristatus mitratus. Close relative of Perisoreus canadensis used was Xanthoura yncas. Close relative of Pica hudsonia used was Pica pica. Close relative of Corvus brachyrhynchos used was Corvus vorone. Close relative of Alectoris rufa used was Coturnix. Close relative of Corvus corax used was Corvus vornix. (b) Detailed breakdown of data from extant birds used for analyzing shifts in the timing of the pectoralis power distribution during the stoke for the scaling analysis (Figure 7D). The same color scheme is used as in Supplementary file 3a, and the close relative species used when data was missing for the original species are: close relative of Selasphorus rufus used was Calypte anna. Close relative of Perisoreus canadensis used was Xanthoura yncas. Close relative of Pica hudsonia used was Pica pica. Close relative of Corvus brachyrhynchos used was Corvus corone. Close relative of Alectoris chukar used was Caccabis rufa. Close relative of Corvus corax used was Corvus cornix. (c) Keys for references in Supplementary files 3a and b.
- https://cdn.elifesciences.org/articles/89968/elife-89968-supp3-v1.pdf
-
MDAR checklist
- https://cdn.elifesciences.org/articles/89968/elife-89968-mdarchecklist1-v1.docx
Download links
A two-part list of links to download the article, or parts of the article, in various formats.
Downloads (link to download the article as PDF)
Open citations (links to open the citations from this article in various online reference manager services)
Cite this article (links to download the citations from this article in formats compatible with various reference manager tools)
Small deviations in kinematics and body form dictate muscle performances in the finely tuned avian downstroke
eLife 12:RP89968.
https://doi.org/10.7554/eLife.89968.3


