Boosting biodiversity monitoring using smartphone-driven, rapidly accumulating community-sourced data
- Biome Inc, Japan
- Department of Ocean Science, Hong Kong University of Science and Technology, Hong Kong
- Hakubi Center, Kyoto University, Japan
- Center for Ecological Research, Kyoto University, Japan
- Toyohashi Museum of Natural History, Japan
Figures
Figure 1
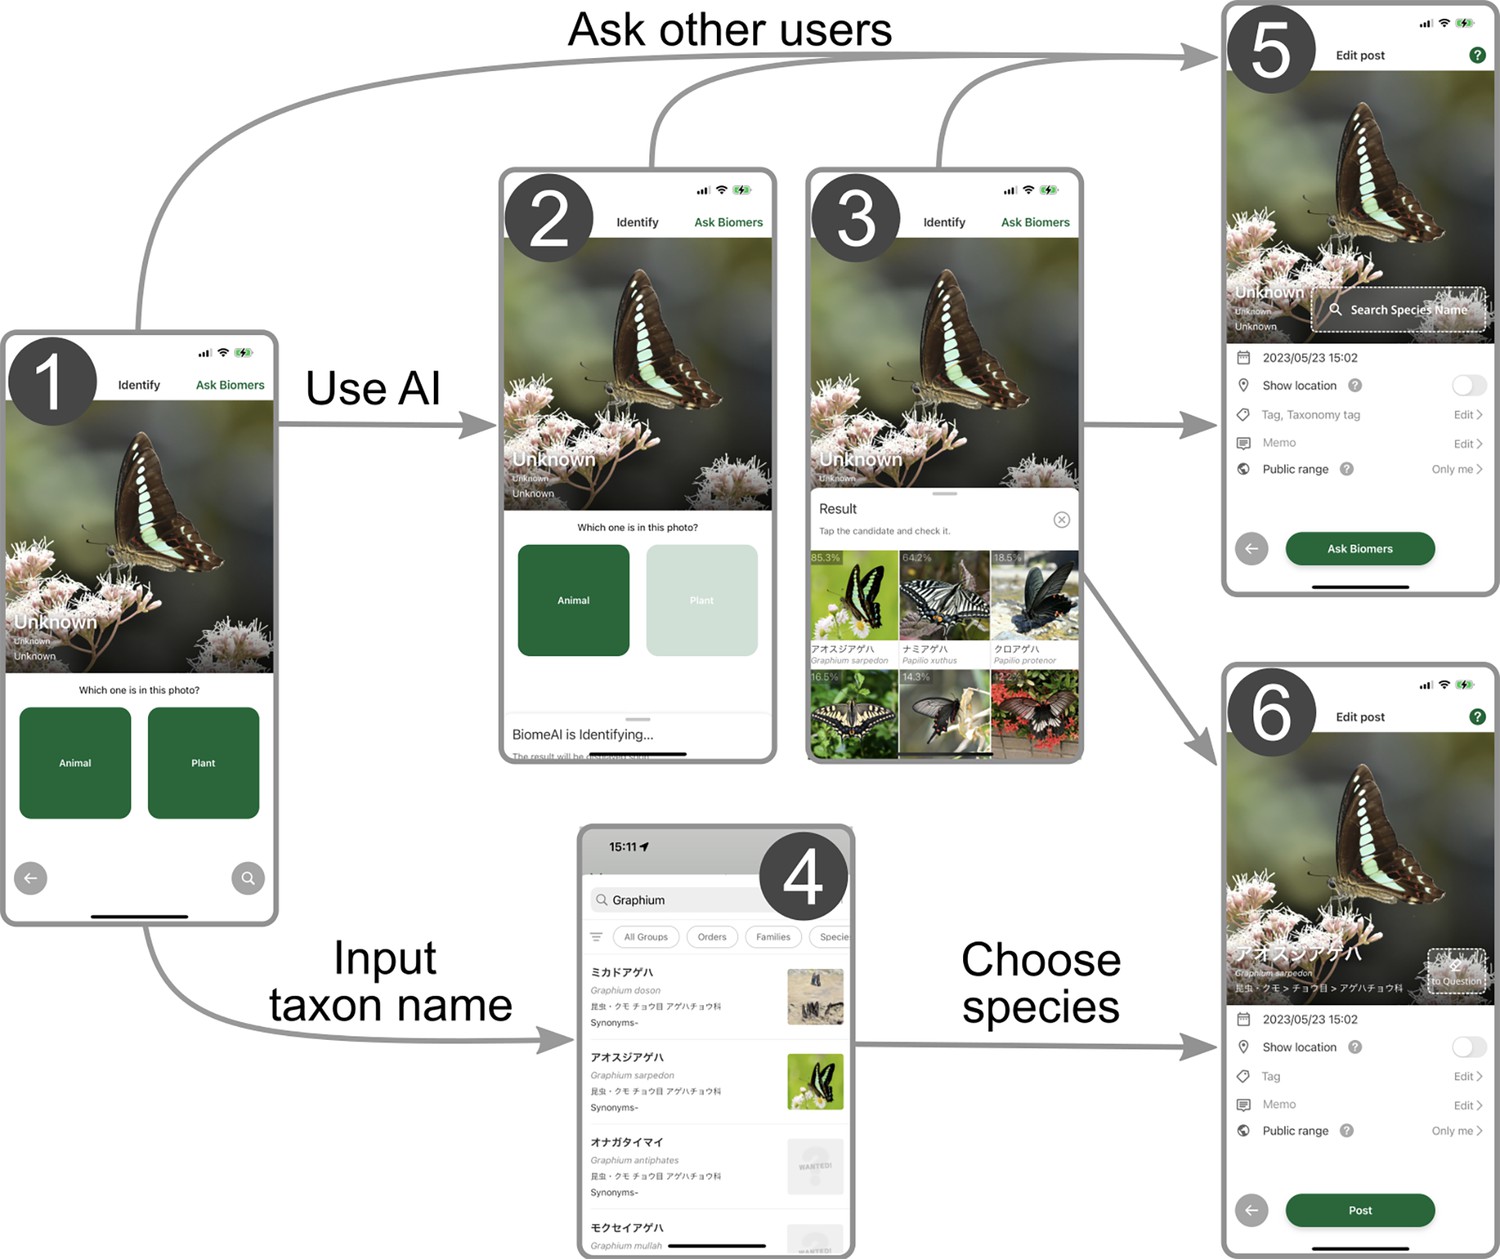
Workflow of submitting records to Biome.
(1) Users can upload images that were taken by the smartphone camera or import existing images from the storage, including those imported from external devices. (2) Users select whether the image is about animals or plants to activate the species identification artificial intelligence (AI). (3) The AI analyses the image and its metadata to generate a candidate species list. (4) Alternatively, users can input the taxon name manually and obtain a list of candidate species. To submit the occurrence record, users can either (5) seek identification assistance from other users through the ‘ask Biomers’ feature, or (6) identify the species from the list. To the records, users can add memos and tags indicating phenology, life stage, sex, and whether the individual is wild or captive.
Figure 2
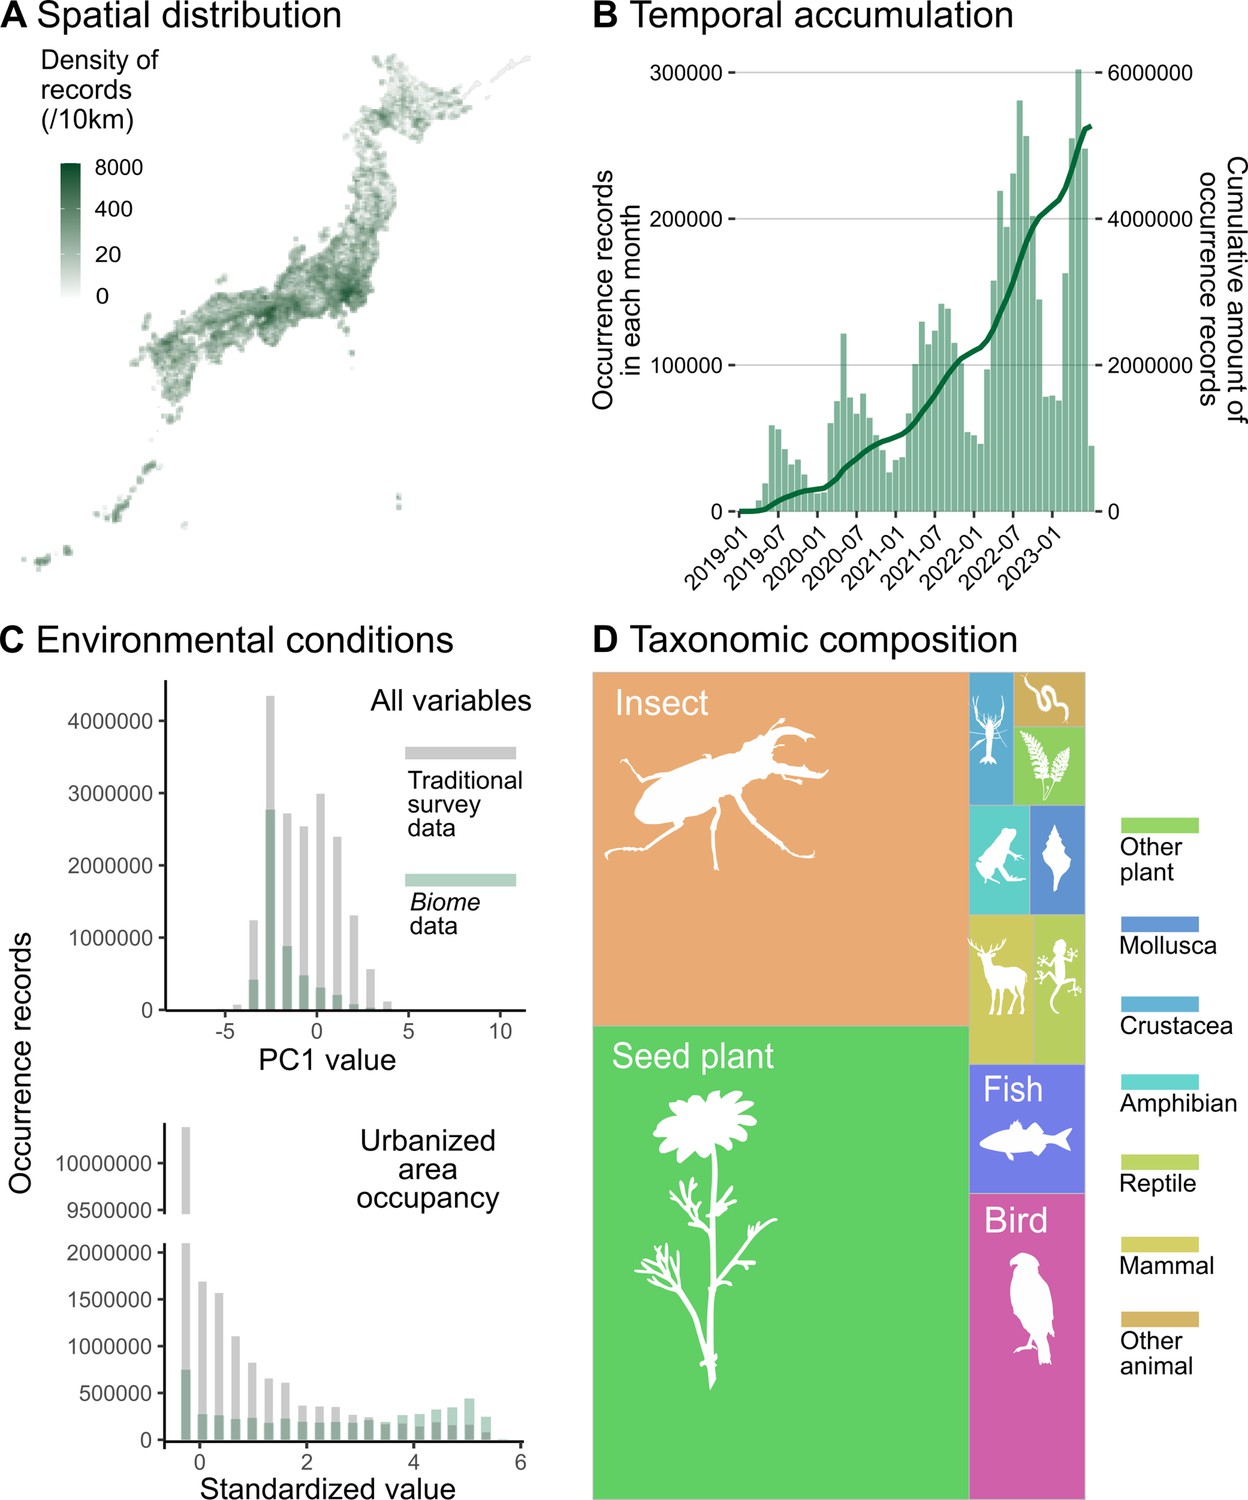
Description of data accumulated by Biome.
Data distributions are shown based on all records submitted to Biome by 7 July 2023 (N = 5,275,457). (A) Spatial distribution of records across Japan. (B) Accumulation of records through time. The barplot represents the number of records each month and the line shows the cumulative amount of records. (C) Distributions of records along with PC1 of all environmental variables and standardised area occupancy of urban-type land uses. Grey and green represent distributions of Traditional and Biome data, respectively. (D) Taxonomic composition of records is shown as the area sizes. ‘Other plant’ consists of non-seed terrestrial plants; ‘insects’ include Arachnids and Insects; ‘arthropods’ cover any Arthropod not included in insects; ‘other animals’ covers all invertebrates not included in the taxa above.
Figure 3 with 1 supplement
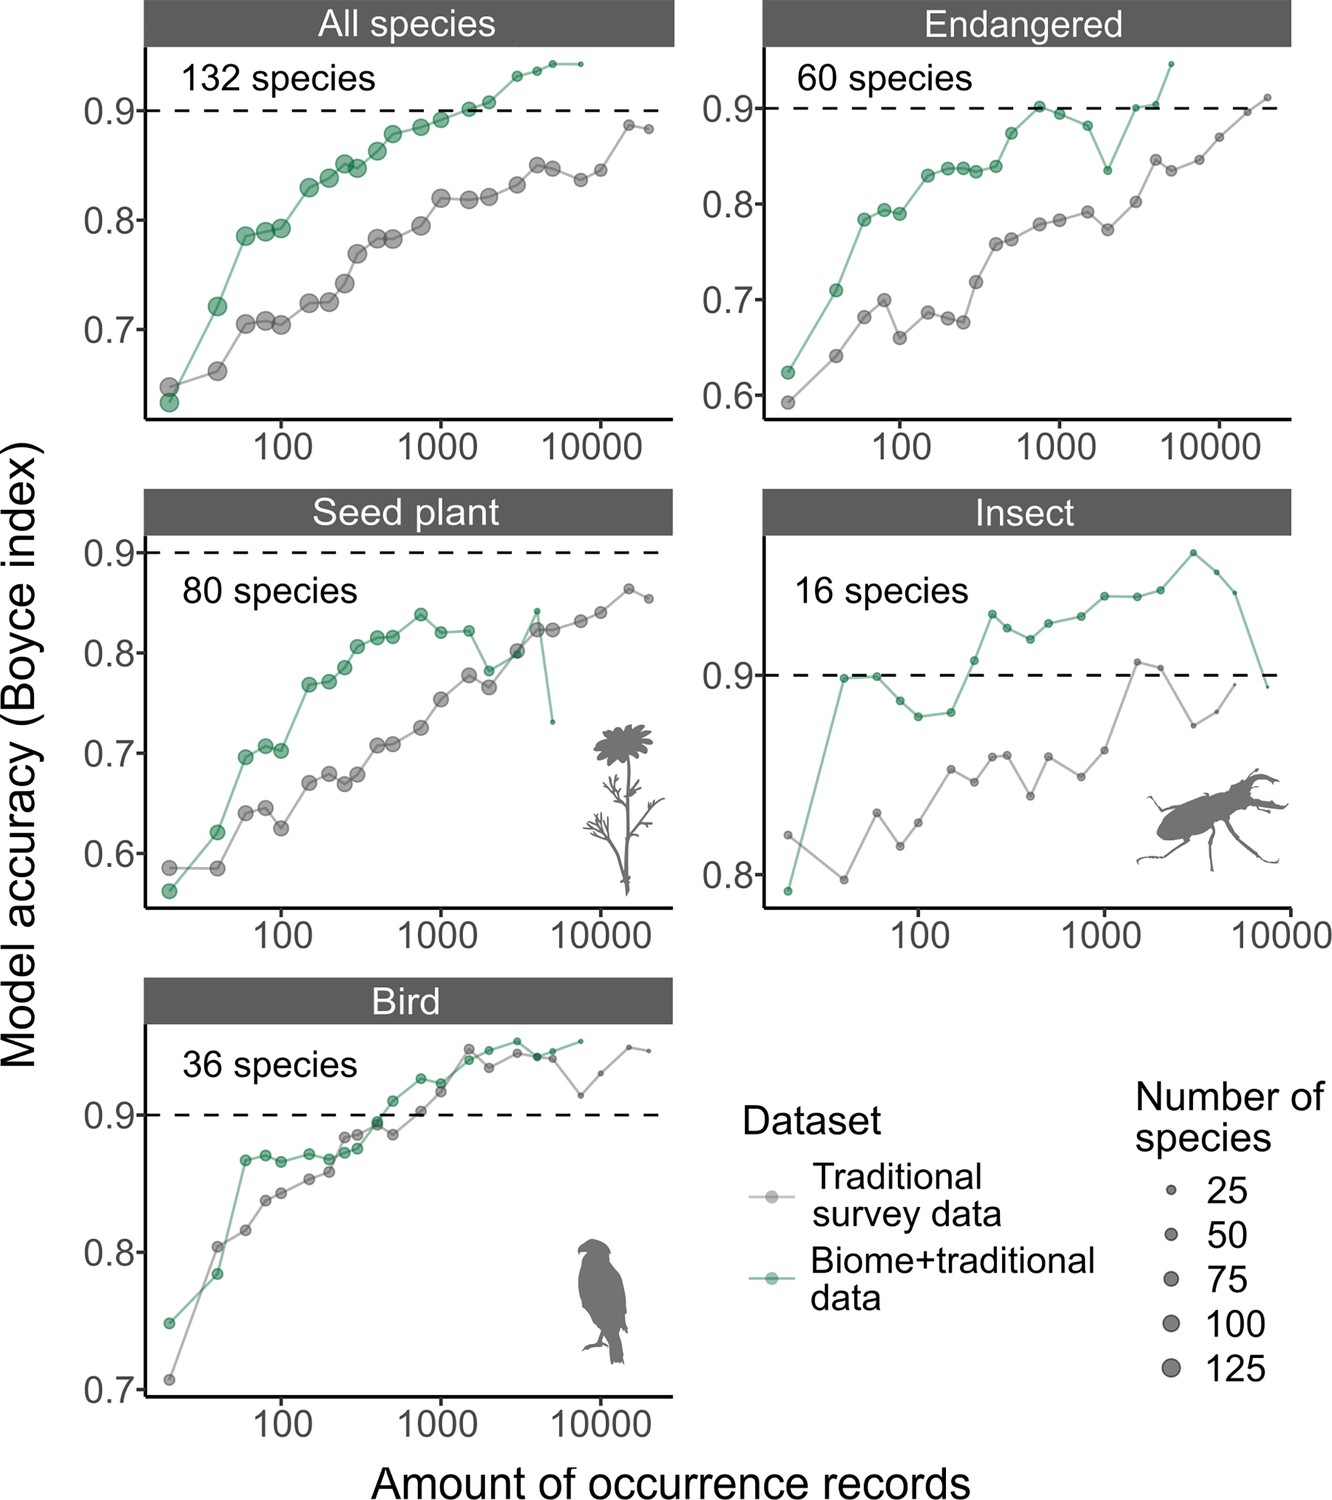
The accuracy of species distribution models.
Accuracy of species distribution models (SDMs) using Traditional survey data (grey dots and lines) and Biome + Traditional data (i.e. 50% of Biome data: green). Each SDM was performed with a specific dataset, species, and the amount of records. For each species and amount of records, we computed the average model accuracy (Boyce index) from three replicated runs. Subsequently, we calculated the median model accuracy across species for each amount of records. These medians were then illustrated for each taxon in the strip of each respective panel. The ‘Endangered’ category includes species that are listed as endangered on Japan’s national or prefectural red lists.
Figure 3—figure supplement 1
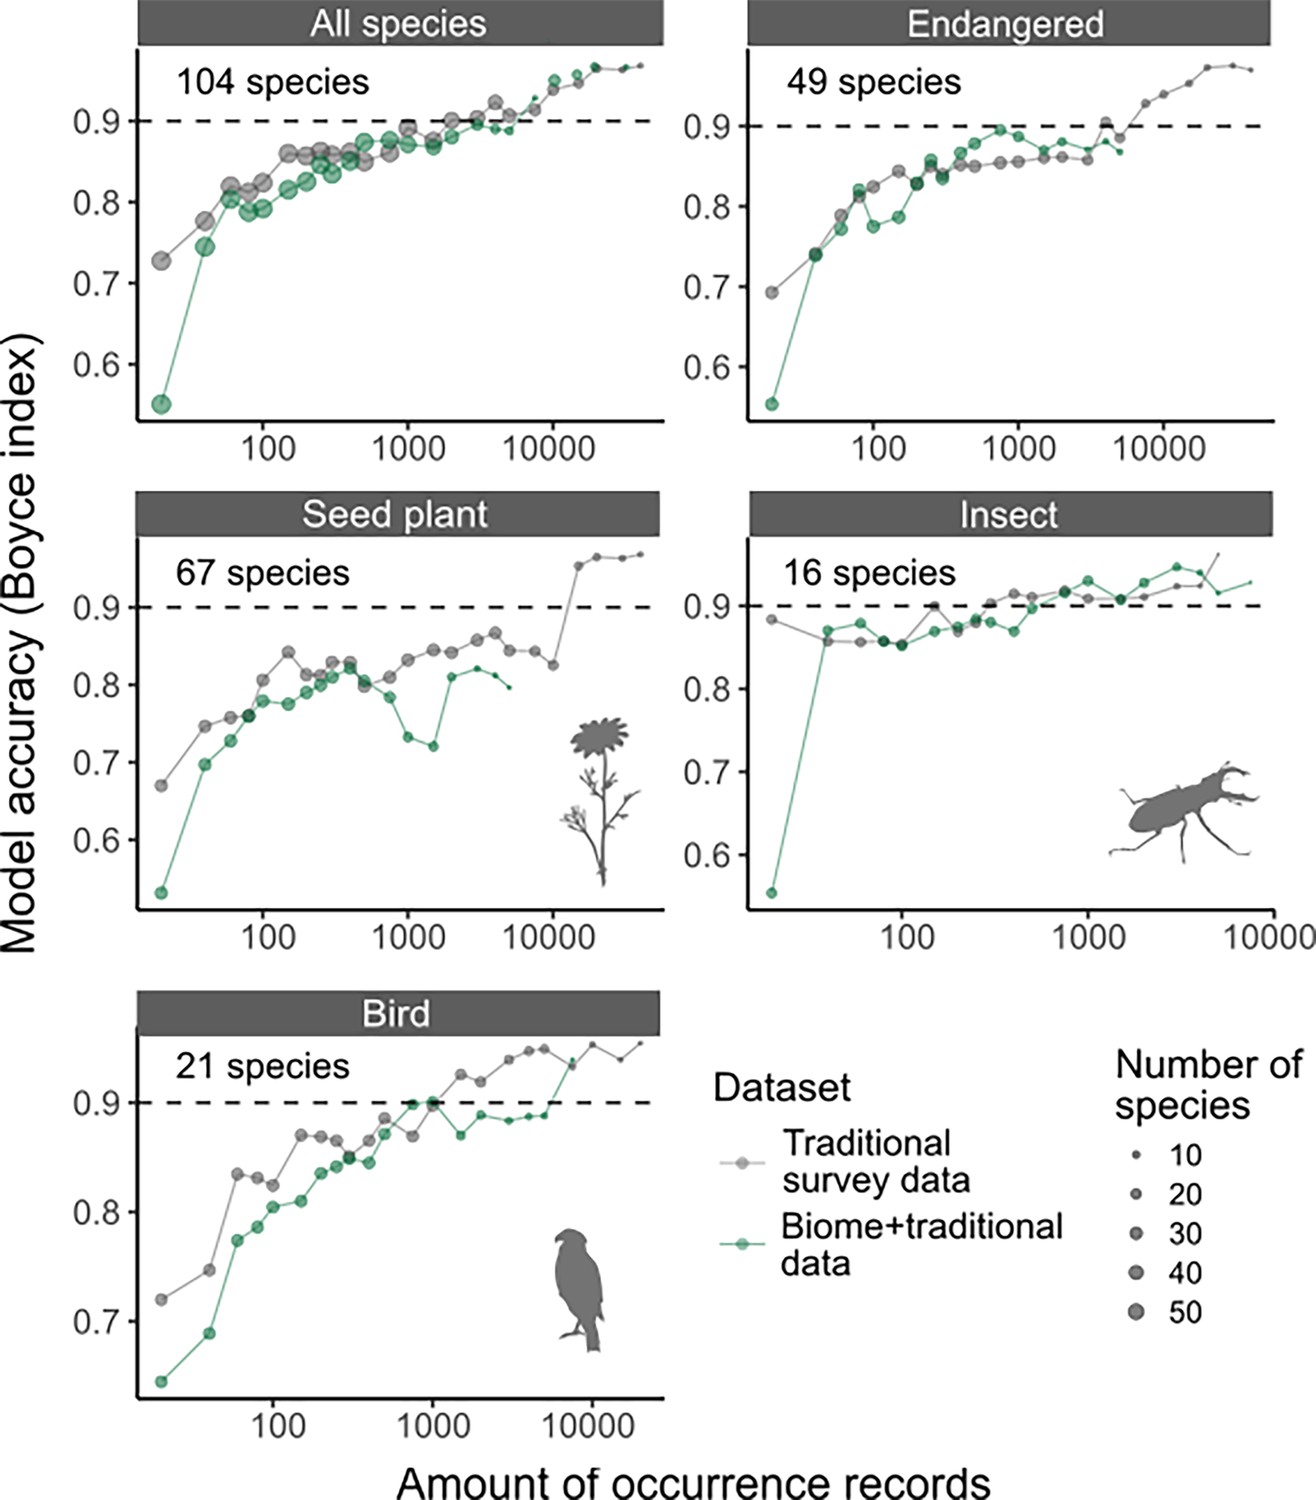
Accuracy of species distribution models (SDMs) using Traditional survey data (grey dots and lines) and Biome + Traditional data (i.e. 50% of Biome data: green), evaluated against test data only consisting of Traditional survey data.
Figure 4
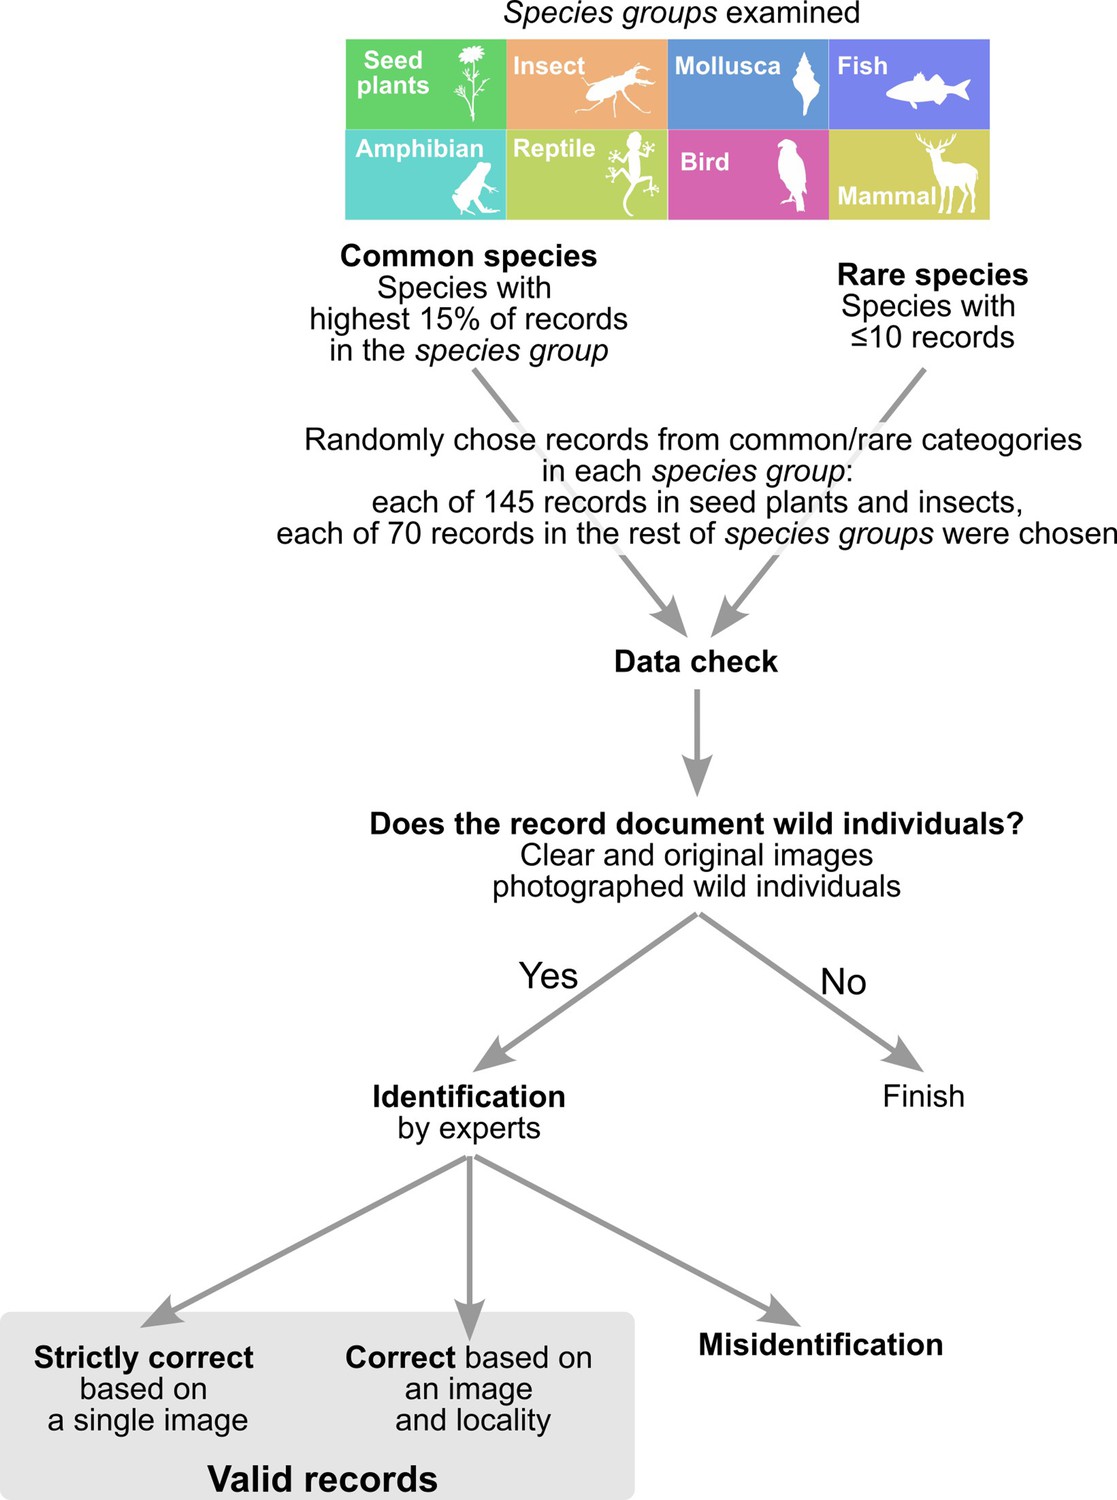
The workflow of checking accuracy of Biome data.
Figure 5
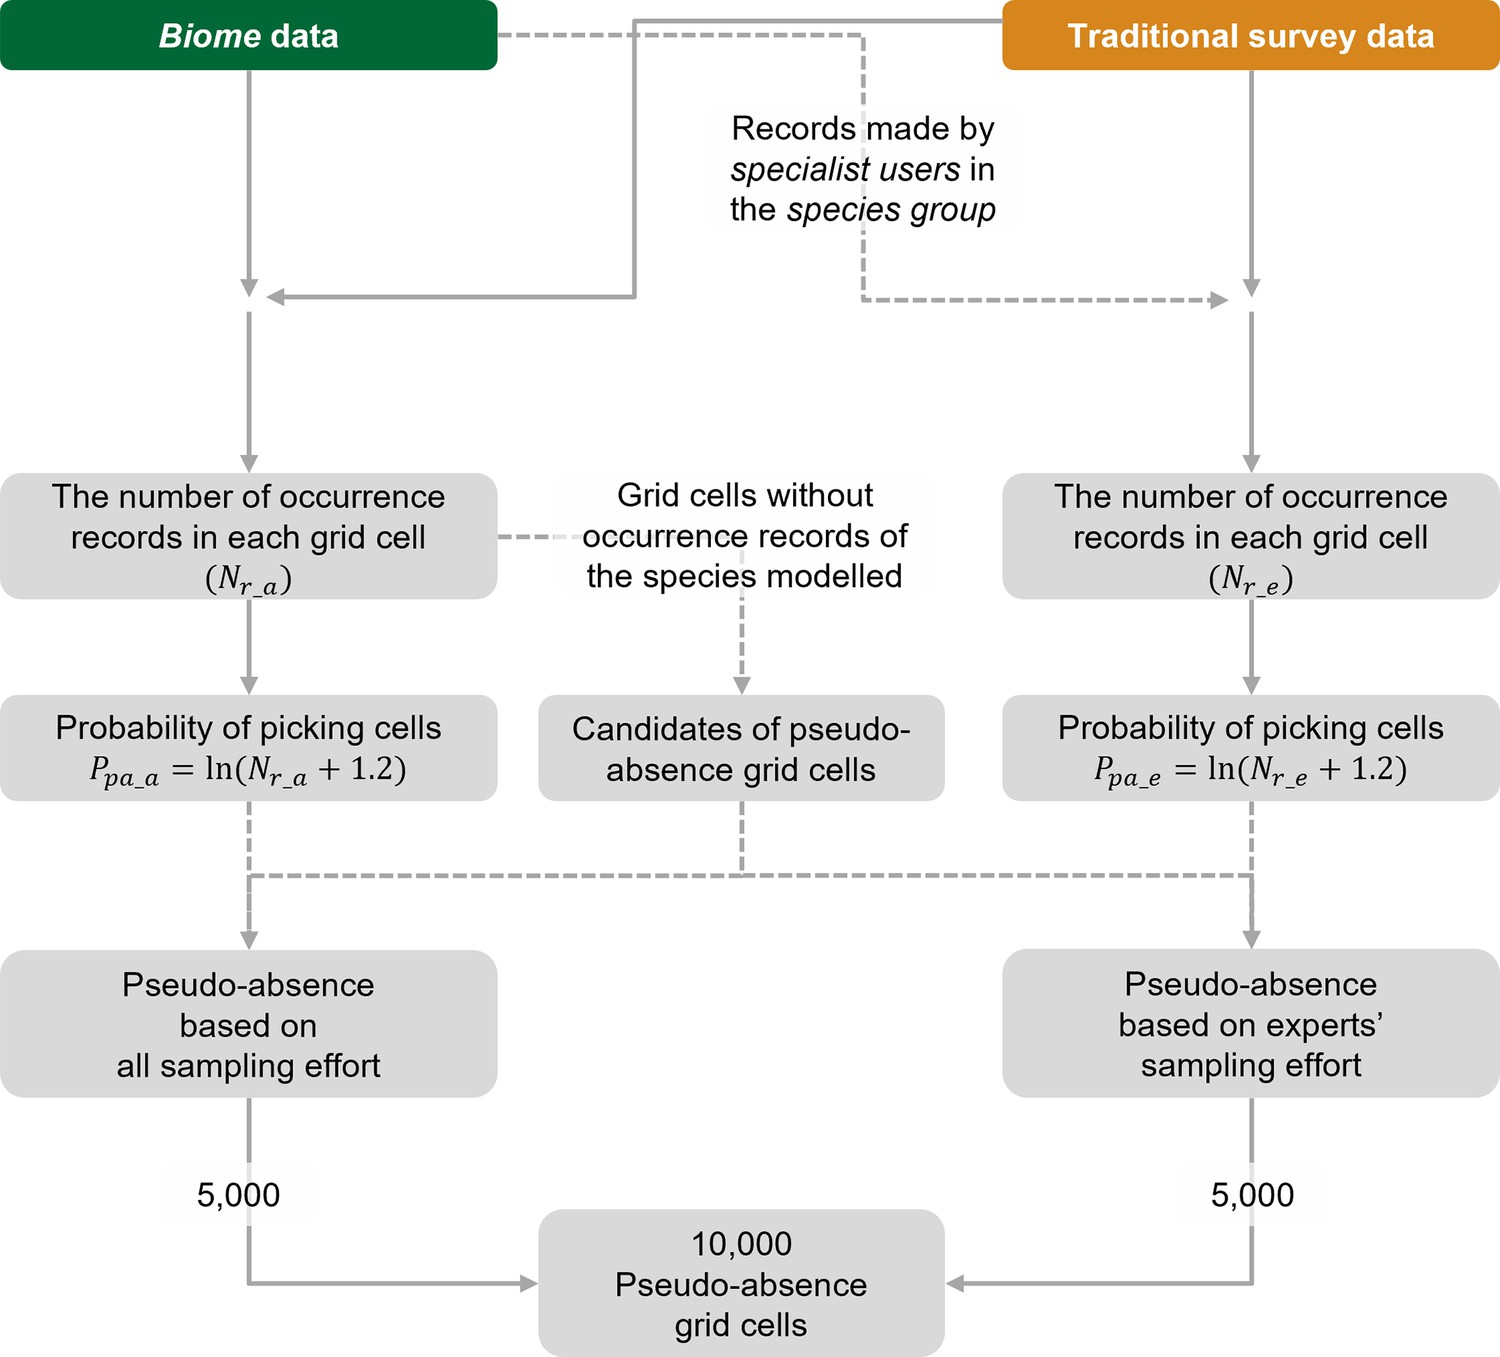
The workflow for selecting pseudo-absence (background) grid cells for species distribution models (SDMs) using the Biome-Traditional dataset.
In this process, both Biome data and Traditional dataset are utilised to determine the suitable locations for pseudo-absence grid cells. However, when constructing SDMs using the Traditional dataset exclusively, Biome data is not involved in the selection of pseudo-absence points.
Figure 6
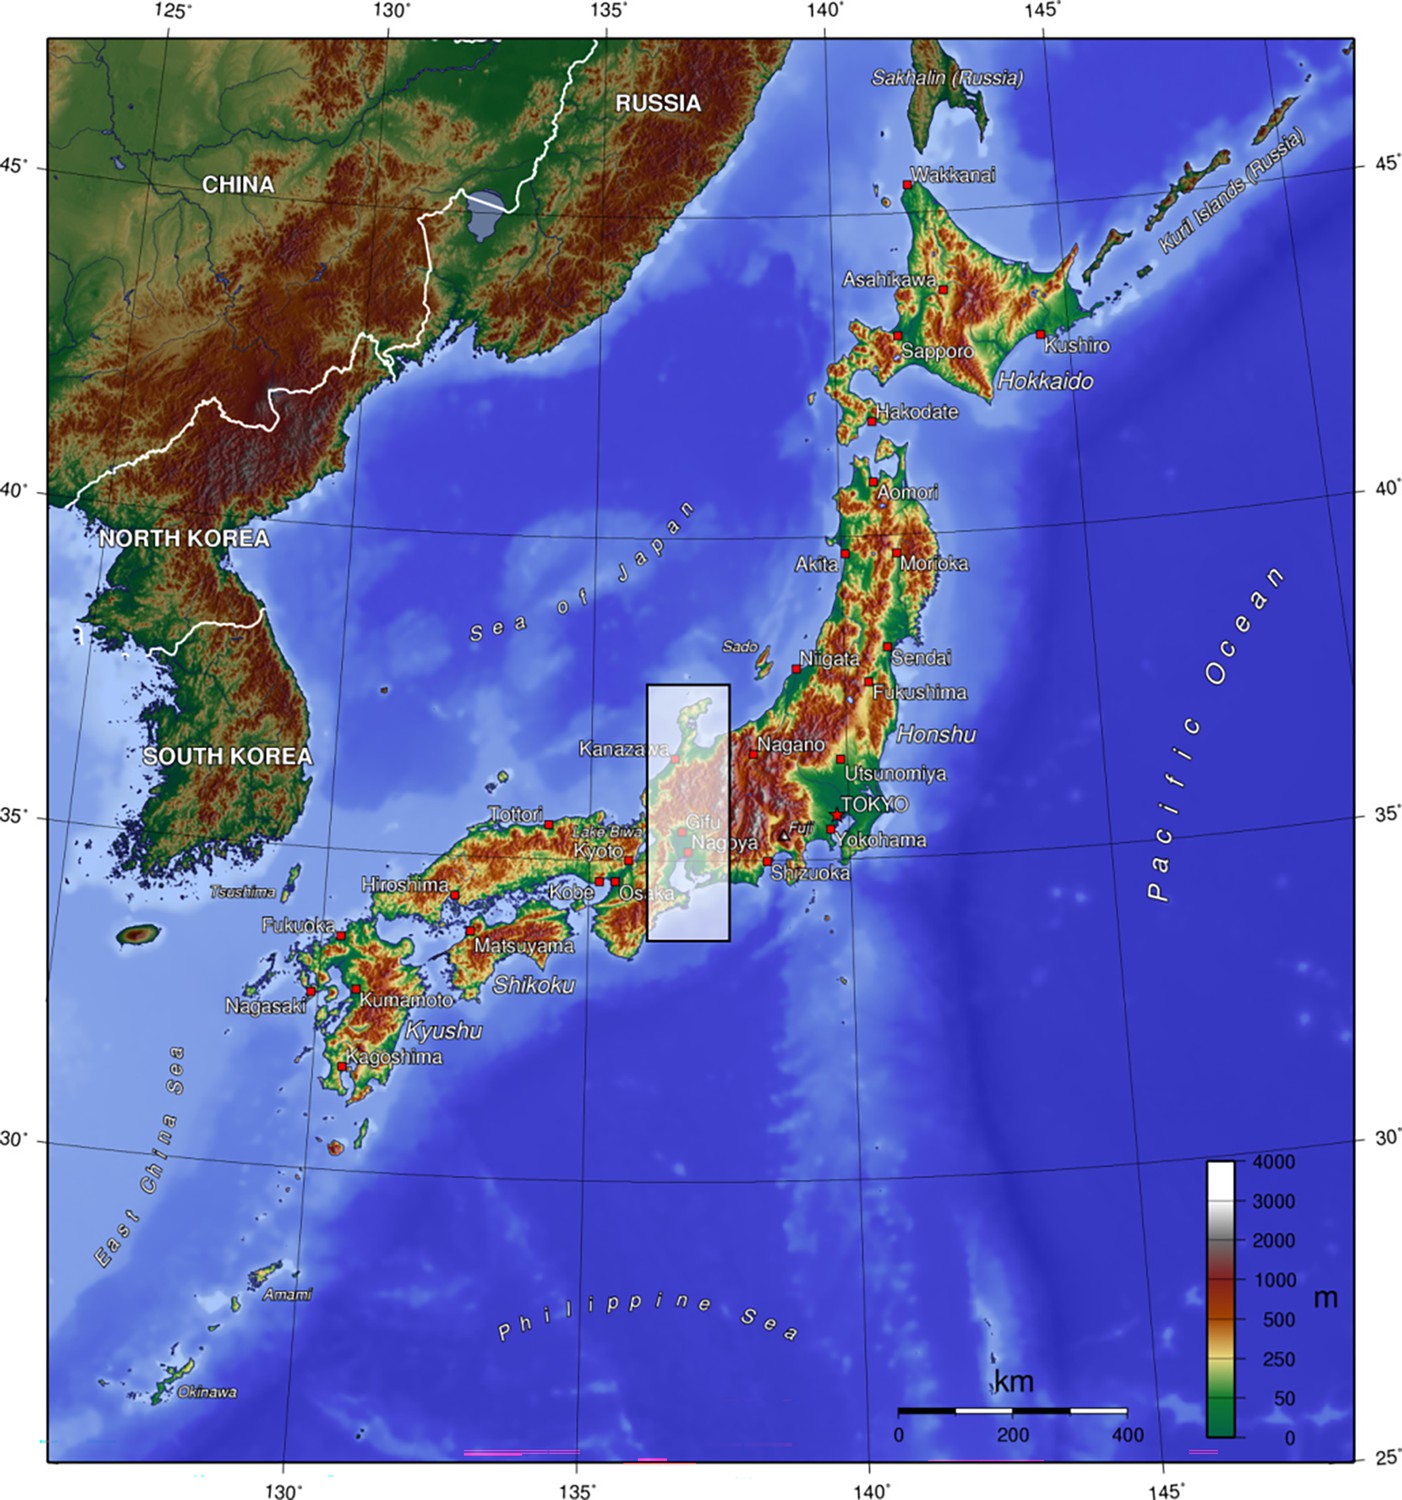
Japanese archipelago, coloured by altitude.
Shaded area shows spatial block of test data. Retrieved from Wikipedia (2023, May 30), licensed under Creative Commons Attribution-ShareAlike 3.0 Unported (CC BY-SA 3.0).
Appendix 1—figure 1
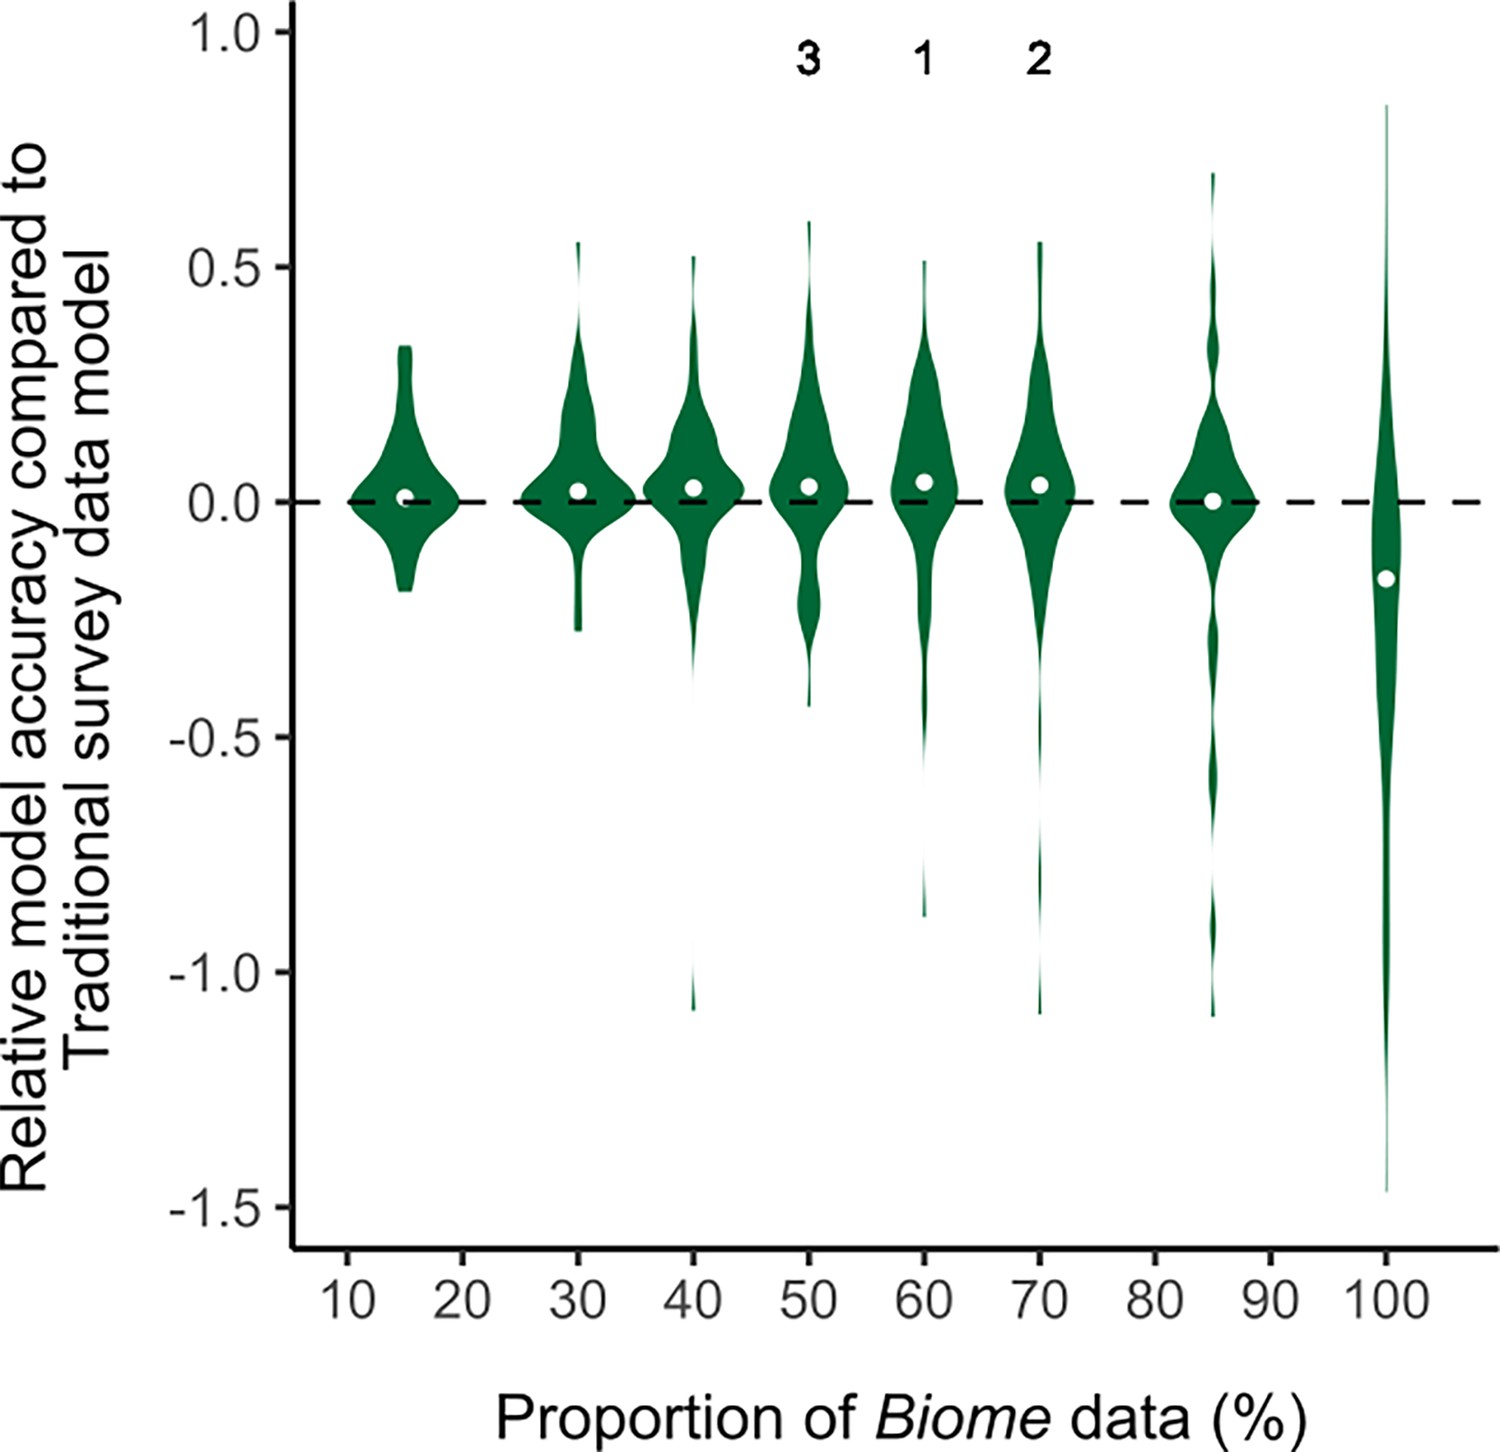
The violin plots of relative model accuracy between species distribution models (SDMs) using Biome-blended data and Traditional survey data.
The median values are shown as grey dots. The positive relative model accuracy indicates that SDMs that used Biome data outperformed models that used Traditional survey data.
Tables
Table 1
Data quality of Biome.
The fraction of records documenting wild individuals, and identification accuracy at species, genus, and family levels among the records documenting wild individuals are shown. Species were identified only for records documenting wild individuals.
| Species group | Species rarity | N | Wild/total (%) | Species correct/wild (%) | Genus correct/wild (%) | Family correct/wild (%) |
|---|---|---|---|---|---|---|
| Total | Total | 1420 | 81.6 | 91 | 93.6 | 96.9 |
| Seed plant | Total | 290 | 86.2 | 89.6 | 94.4 | 97.2 |
| Mollusca | Total | 140 | 87.9 | 90.2 | 91.1 | 96.7 |
| Insect | Total | 290 | 100 | 83.4 | 86.9 | 94.1 |
| Fish | Total | 140 | 73.6 | 87.4 | 93.2 | 96.1 |
| Amphibian | Total | 140 | 93.6 | 96.2 | 96.2 | 98.5 |
| Reptile | Total | 140 | 91.4 | 97.7 | 100 | 100 |
| Bird | Total | 140 | 98.6 | 98.6 | 99.3 | 99.3 |
| Mammal | Total | 140 | 80.7 | 95.6 | 95.6 | 96.5 |
| Total | Rare | 710 | 88.7 | 87 | 91 | 95.6 |
| Total | Common | 710 | 91 | 95 | 96.3 | 98.3 |
| Seed plant | Rare | 145 | 80.7 | 82.9 | 91.5 | 94.9 |
| Seed plant | Common | 145 | 91.7 | 95.5 | 97 | 99.2 |
| Mollusca | Rare | 70 | 82.9 | 86.2 | 87.9 | 96.6 |
| Mollusca | Common | 70 | 92.9 | 93.8 | 93.8 | 96.9 |
| Insect | Rare | 145 | 100 | 75.2 | 80 | 91.7 |
| Insect | Common | 145 | 100 | 91.7 | 93.8 | 96.6 |
| Fish | Rare | 70 | 74.3 | 88.5 | 94.2 | 94.2 |
| Fish | Common | 70 | 72.9 | 86.3 | 92.2 | 98 |
| Amphibian | Rare | 70 | 95.7 | 95.5 | 95.5 | 98.5 |
| Amphibian | Common | 70 | 91.4 | 96.9 | 96.9 | 98.4 |
| Reptile | Rare | 70 | 94.3 | 95.5 | 100 | 100 |
| Reptile | Common | 70 | 88.6 | 100 | 100 | 100 |
| Bird | Rare | 70 | 97.1 | 98.5 | 100 | 100 |
| Bird | Common | 70 | 100 | 98.6 | 98.6 | 98.6 |
| Mammal | Rare | 70 | 81.4 | 91.2 | 91.2 | 93 |
| Mammal | Common | 70 | 80 | 100 | 100 | 100 |
Key resources table
| Reagent type (species) or resource | Designation | Source or reference | Identifiers | Additional information |
|---|---|---|---|---|
| Software, algorithm | R 4.1.3; MaxEnt (using ENMeval 2.0 package on R) | R 4.1.3 (R Core Team, 2021); MaxEnt (Phillips et al., 2006; Phillips and Dudík, 2008); ENMeval 2.0 package (Kass et al., 2021) | ||
| Other | Species occurrence data | Biome app, GBIF and others (see ‘Methods’) | For DOIs of GBIF data, see Supplementary file 2 | For details, see section ‘Occurrence data’ |
Table 2
List of species occurrence datasets used for constructing species distribution models (SDMs).
To compare Biome dataset with the other datasets, iNaturalist and eBird data based on community science were classified as ‘Traditional survey’ data.
| Original dataset | Occurrence records of modelled species | Species coverage among modelled species | Survey method | Data group in SDM | Down load date | Availability | |
|---|---|---|---|---|---|---|---|
| N | Occu pancy | ||||||
| Biome (filtering applied) | 201,114 | 8.6 | 132/132 | Citizen science through smartphone app | Biome | 7 July 2023 | https://biome.co.jp/ |
| National Census on River and Dam Environments (NCRE) | 1,413,541 | 60.2 | 126/132 | Traditional survey on freshwater and its adjacent ecosystems | Traditional survey | 10 January 2023 | http://www.nilim.go.jp/lab/fbg/ksnkankyo/ |
| Institute records registered at GBIF | 530,952 | 22.6 | 116/132 | Traditional survey and museum specimens | Traditional survey | 7 July 2023 | GBIF* |
| iNaturalist and eBird | 118,050 | 5 | 110/132 | Citizen science through smartphone app and web service | Traditional survey* | 7 July 2023 | GBIF* |
| Forest Ecosystem Diversity Basic Survey | 80,929 | 3.4 | 42/132 | Traditional survey on forest trees | Traditional survey | 30 March 2023 | http://forestbio.jp/ |
| Literature | 3293 | 0.1 | 130/132 | Traditional survey | Traditional survey | 31 March 2023 | Refs* |
-
*
For the list of GBIF download doi and literature, see Supplementary file 2.
Table 3
Environmental data used for constructing species distribution models (SDMs).
Years indicate the data collection period. Usage in the SDM shows how the variables were converted before using in the species distribution modelling.
| Data | Variables | Year | Usage in the SDM | Available at |
|---|---|---|---|---|
| Land use | The area sizes of forests, rice fields, farms, wastelands, inland waters, beaches, ocean, golf courses, urbanised areas, and others | 2016 | Extracted six principal components (PCA) explained ≧ 80% of total variation. PCs were converted into linear, quadratic and hinge terms. | The Ministry of Land, Infrastructure, Transport and Tourism of Japan (MLIT) (https://nlftp.mlit.go.jp/ksj/gml/datalist/KsjTmplt-L03-a.html) |
| Forest type | Forest type (planted and natural) | 1998 | Converted into linear, quadratic, and hinge terms. | The Biodiversity Centre of Japan (http://gis.biodic.go.jp/webgis/index.html) |
| Climate | Monthly average, minimum and maximum temperature and precipitation | 11981–2010 | Transformed into 19 bioclimatic variables (Booth et al., 2014), then extracted three PCs explained ≧ 80% of total variation. Converted into linear, quadratic, and hinge terms. | MLIT (https://nlftp.mlit.go.jp/ksj/gml/datalist/KsjTmplt-G02-v3_0.html) |
| Elevation-al range | Differences between maximum and minimum elevation, and maximum slope | 1981 | Converted into linear, quadratic, and hinge terms. | MLIT (https://nlftp.mlit.go.jp/ksj/jpgis/datalist/KsjTmplt-G04-a.html) |
| Vegetation | The area sizes | 1998 | Transformed into 37 PCs of which total variation explained was more than 80%. Converted into linear, quadratic and hinge terms. | MOE (http://gis.biodic.go.jp/webgis/index.html) |
| Geology | The area sizes of limestone and serpentinite | 2022 | Converted into linear, quadratic and hinge terms | The Research Institute of Geology and Geoinformation (https://gbank.gsj.jp/seamless/use.html) |
| Geohistory | Blakiston’s Line (Dobson, 1994; Saitoh et al., 2015), oceanic islands (Wepfer et al., 2016; Yamasaki, 2017) | Categorical variables |
Additional files
-
Supplementary file 1
Distributions of occurrence records along with environmental variables.
- https://cdn.elifesciences.org/articles/93694/elife-93694-supp1-v1.zip
-
Supplementary file 2
List of GBIF data doi and literature compiled in occurrence data.
- https://cdn.elifesciences.org/articles/93694/elife-93694-supp2-v1.docx
-
Supplementary file 3
List of species for constructed species distribution models.
- https://cdn.elifesciences.org/articles/93694/elife-93694-supp3-v1.xlsx
-
MDAR checklist
- https://cdn.elifesciences.org/articles/93694/elife-93694-mdarchecklist1-v1.docx
Download links
A two-part list of links to download the article, or parts of the article, in various formats.
Downloads (link to download the article as PDF)
Open citations (links to open the citations from this article in various online reference manager services)
Cite this article (links to download the citations from this article in formats compatible with various reference manager tools)
Boosting biodiversity monitoring using smartphone-driven, rapidly accumulating community-sourced data
eLife 13:RP93694.
https://doi.org/10.7554/eLife.93694.3


