Equity, Diversity and Inclusion: Demystifying the ‘hidden curriculum’ for minoritized graduate students
- Department of Biological Chemistry, Johns Hopkins School of Medicine, United States
- Department of Physiology, Johns Hopkins School of Medicine, United States
- Department of Cell Biology, Johns Hopkins School of Medicine, United States
- Department of Psychiatry and Behavioral Sciences, Johns Hopkins School of Medicine, United States
- Department of Mental Health, Johns Hopkins Bloomberg School of Public Health, United States
Figures
Figure 1
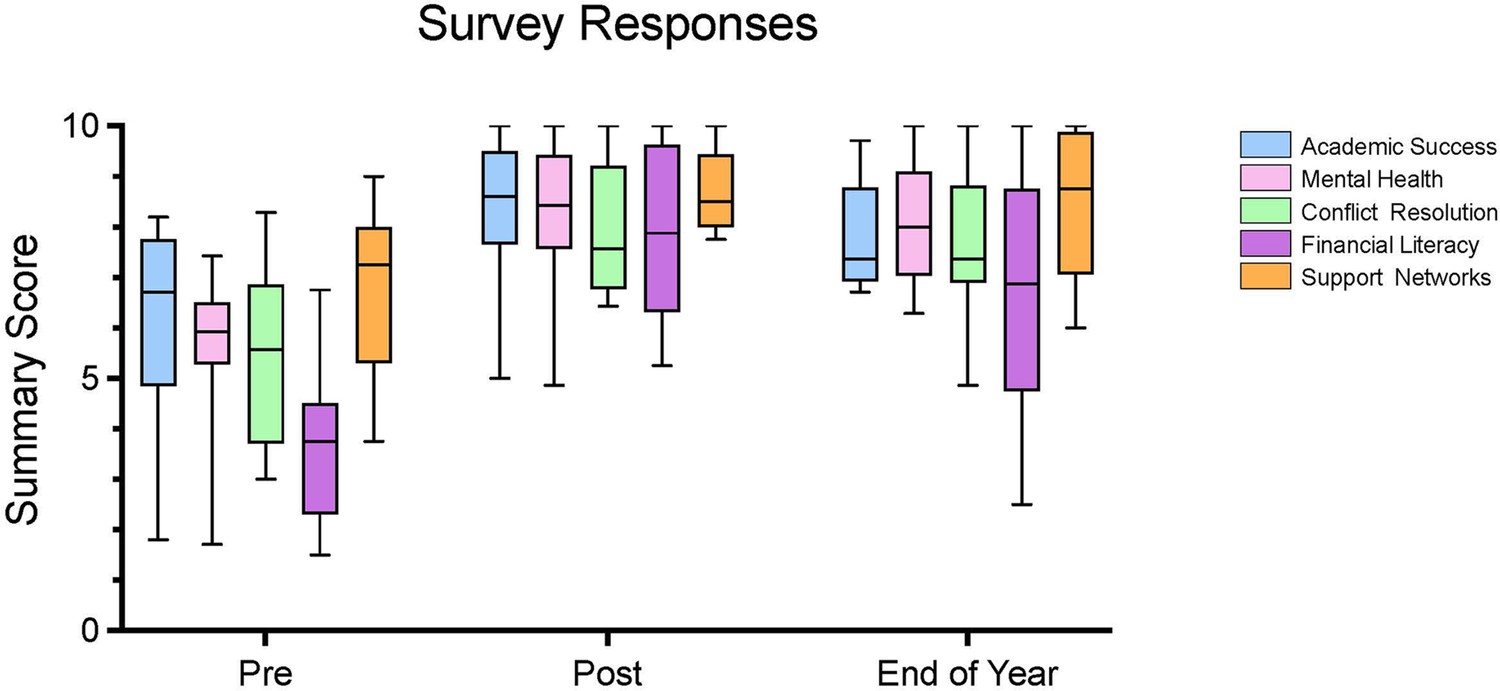
Assessing the impact of the first Hidden Curriculum Symposium over time.
The 12 students who attended the first symposium were surveyed seven days before the symposium (Pre; left), immediately after the symposium (Post; middle), and at the end of the first year of graduate school (End of Year; right). The surveys contained questions to determine (on a scale of 1–10; vertical axis) how prepared the students were in five areas: academic success, mental health, conflict resolution, financial literacy, and support networks. See Methods for more information. The summary scores for all five areas were higher after the symposium than they were before, and these increases were statistically significant. The summary scores were lower at the end of the year than they were after the symposium, but only the decrease for financial literacy was statistically significant. Moreover, the summary scores for all five areas at the end of the year were much higher than the scores before the symposium, which suggested the symposium’s impacts were sustained until the end of the year. We also explored if enrolling in graduate school immediately after completing an undergraduate degree (as opposed to, for example, completing a master’s degree) or attending a Minority Serving Institution (MSI) influenced the results, but we did not find any evidence for this (see Table S4 in Supplementary file 1). Each ‘box‘ in these plots indicates the interquartile range (25th to 75th percentile), while the horizontal line running through the box is the 50th percentile (median); the lines extending from each box indicate the full range of the summary scores for that topic.
Figure 2
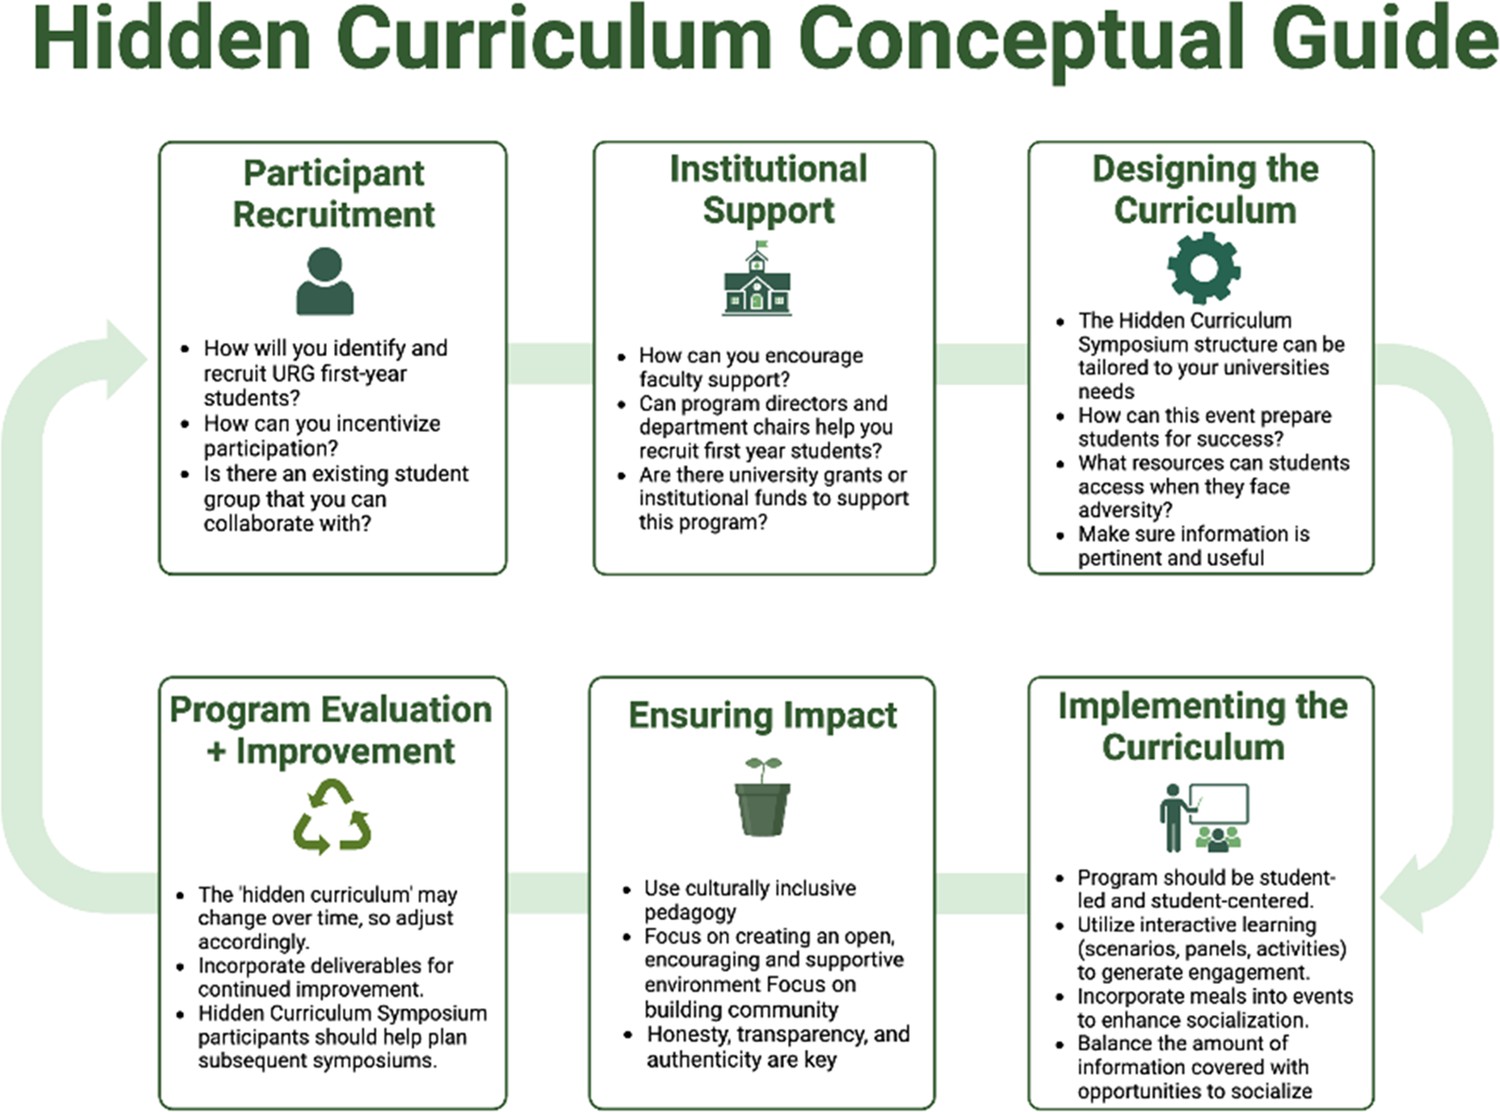
A framework for organizing a symposium on the Hidden Curriculum.
The resources created for the 2022 and 2023 Hidden Curriculum symposia at Johns Hopkins are publicly available via Dropbox.
Tables
Table 1
Characteristics of the students who attended the first Hidden Curriculum Symposium.
Note: One student who completed the pre-symposium survey did not attend the symposium and was not included in subsequent analyses.
| Variables | Pre-symposium survey | Post-symposium survey | End-of-year survey |
|---|---|---|---|
| Demographics | |||
| Total number of respondents | 13 | 12 | 12 |
| Age (years; mean ±SD) | 23.9±1.33 | 23.7±1.44 | 23.7±1.44 |
| Race: n (%) | |||
| Black/African American | 9 (69.2) | 9 (75) | 9 (75) |
| Latinx/Hispanic | 2 (15.4) | 2 (16.7) | 2 (16.7) |
| Indigenous/Native American | 1 (7.7) | 1 (8.3) | 1 (8.3) |
| Asian/ Pacific Islander | 1 (7.7) | 0 (0) | 0 (0) |
| Not Reported | 0 (0) | 0 (0) | 0 (0) |
| Gender: n (%) | |||
| Female | 6 (46) | 6 (50) | 6 (50) |
| Male | 7 (54) | 6 (50) | 6 (50) |
| Education: n (%) | |||
| Bachelor’s | 8 (61.6) | 7 (58.4) | 7 (58.4) |
| Master’s | 1 (7.6) | 1 (8.3) | 1 (8.3) |
| Not Reported | 4 (30.8) | 4 (33.3) | 4 (33.3) |
| Attended HBCU or MSI: n (%) | |||
| Yes | 9 (69.2) | 9 (75) | 9 (75) |
| No | 4 (30.8) | 3 (25) | 3 (25) |
Additional files
Download links
A two-part list of links to download the article, or parts of the article, in various formats.
Downloads (link to download the article as PDF)
Open citations (links to open the citations from this article in various online reference manager services)
Cite this article (links to download the citations from this article in formats compatible with various reference manager tools)
Equity, Diversity and Inclusion: Demystifying the ‘hidden curriculum’ for minoritized graduate students
eLife 13:e94422.
https://doi.org/10.7554/eLife.94422


