Fine-scale tracking reveals visual field use for predator detection and escape in collective foraging of pigeon flocks
- Centre for the Advanced Study of Collective Behaviour, University of Konstanz, Germany
- Max Planck Institute of Animal Behavior, Germany
- International Max Planck Research School for Quantitative Behavior, Ecology and Evolution, Germany
Figures
Figure 1 with 1 supplement
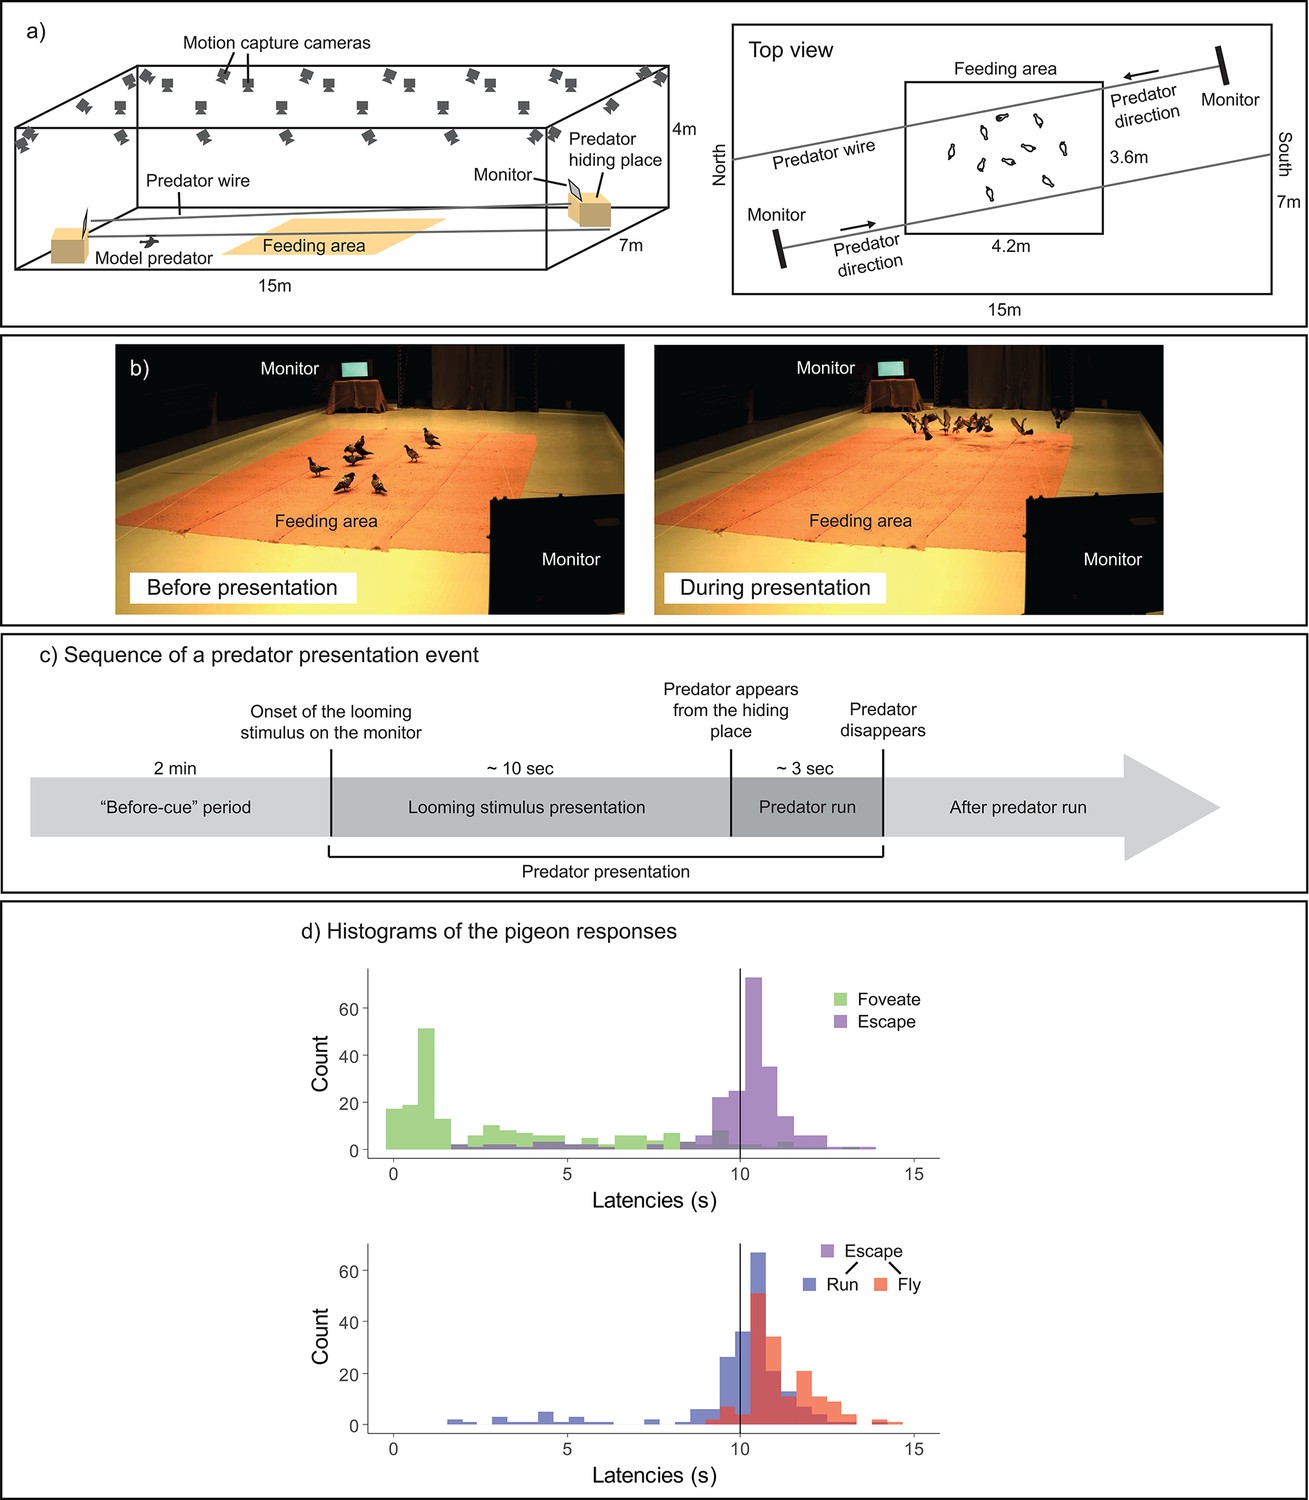
Experimental design.
(a) Experimental setup. In a large-scale motion-capture system (SMART-BARN), the feeding area, the monitors, and the predator running wire were installed (a three-dimensional [3D] view on the left, and a top view on the right). (b) Still frames captured from the periods before (top) and during (bottom) the predator presentation, respectively. (c) Sequence of an event presenting a model predator. Each predator presentation event started with the presentation of a looming stimulus (predator silhouette), which lasted for approximately 10 s, on either of the two monitors, followed by the model predator running on the wire across the room (lasting for approximately 3 s). The ‘before-cue’ period is defined as the 2 min directly preceding the onset of the looming stimulus. (d) Histograms of the pigeons’ responses. Top: latency to foveate (green) and latency to escape—either running or flying (purple); bottom: latency to run (blue) and latency to fly (red) separately. The vertical line shows the looming stimulus offset.
-
Figure 1—source data 1
Number of individuals foveating, escaping and flying for each event.
- https://cdn.elifesciences.org/articles/95549/elife-95549-fig1-data1-v1.xlsx
Figure 1—figure supplement 1
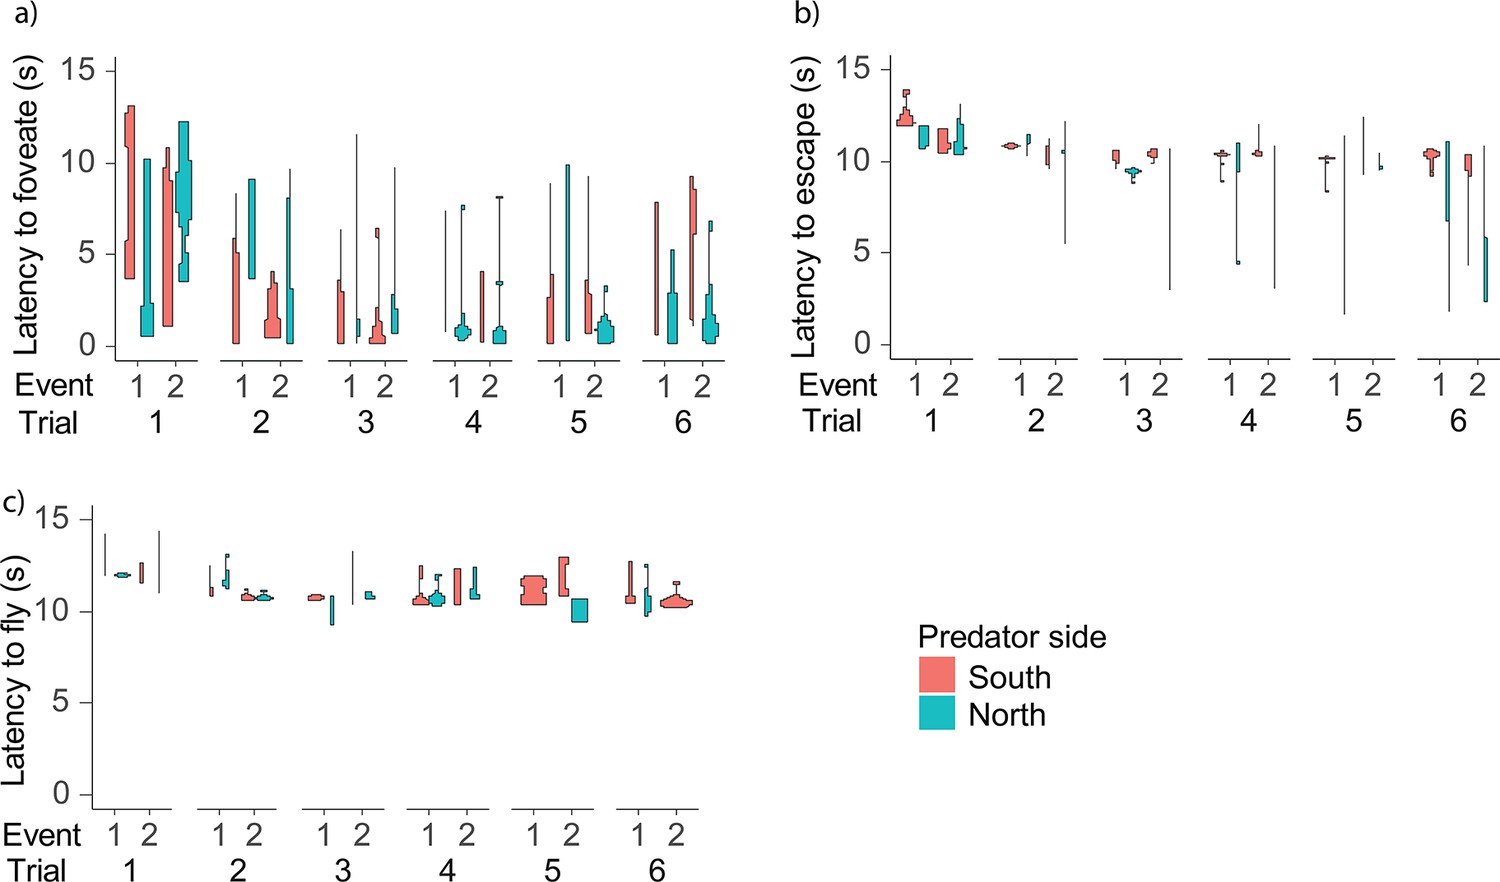
Latencies to respond to each predator event.
Response variables as a function of the trials and events. (a) Latency to foveate; (b) latency to escape; (c) latency to fly. The distribution of the data is displayed as violin plots and the color represents the side of the predator event.
Figure 2 with 1 supplement
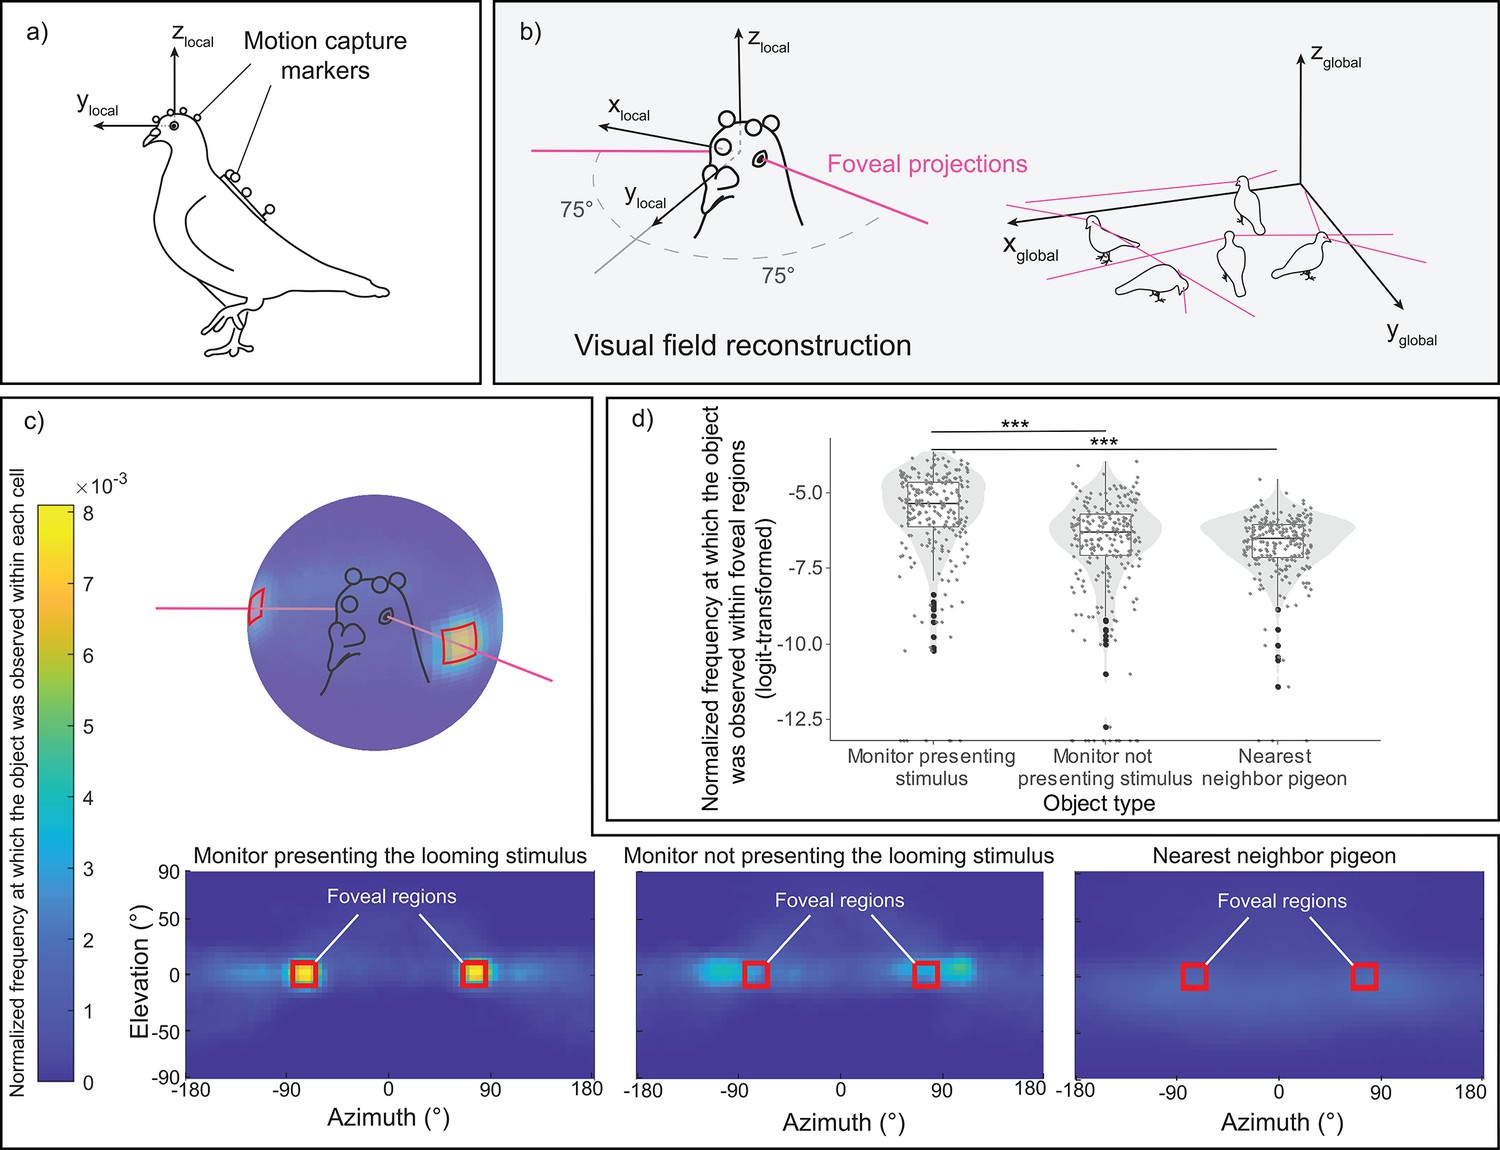
Reprojection of the pigeon's visual perspective.
(a) A pigeon equipped with motion-capture markers on its head and back. (b) Reconstruction of estimated foveal projections in the local coordinate system of the head (left) and in the global (motion-capture) coordinate system (right). (c) Reprojection of each object of interest—the monitor presenting the looming stimulus, the monitor without the cue acting as a control, and the nearest conspecific—within the visual field of all pigeons across all trials. The red squares denote the designated region of estimated foveal projections in the visual field, defined as 75 ± 10° in azimuth and 0 ± 10° in elevation. The color scale illustrates the normalized frequency (normalized to a unit sum) at which each object of interest was observed within each 5 × 5° cell of the heatmap. (d) Normalized frequency (normalized to unit sum then logit-transformed) at which each object of interest was observed within the defined foveal regions on the heatmap. The dots represent single observations (jittered horizontally for visualization), the gray shade represents the violin plot of the distributions, and the boxplot’s boxes represent the 0.25 and 0.75 quartiles (with the median represented as a line inside the box) and the whiskers the minimum and maximum values within the lower/upper quartile ±1.5 times the interquartile range. *** represent a significant difference with p < 0.001.
Figure 2—figure supplement 1

Spherical representation of a pigeon.
Illustration of the defined spherical representations for the pigeon's head and body. We approximated objects of interest (monitors, hiding places, and other pigeons) as 3D volumes, defining them as spheres or combinations of spheres. The monitors were represented as a single sphere. The sphere's center was the monitor's centroid, and its diameter was set at 86.13 cm, which is the monitor's diagonal length of 71.77 cm plus a 20% margin. The predator hiding place was also defined as a single sphere, with its center located below the monitor's centroid at a height of 38 cm above the ground (along the z-axis of the global coordinate system, corresponding to half the height of the hiding place). Its diameter was 158.47 cm, based on the hiding place's diagonal length of 132.06 cm, plus a 20% margin. The pigeons were represented by two spheres, denoting the head and the body. The head sphere's centroid was the midpoint between the eyes, with a diameter of 12 cm (calculated from the distance from the beak tip to the midpoint of the eyes, approximately 4 cm, plus a 2 cm margin for the radius). The body sphere's centroid was set 6 cm below the center point of the backpack markers (along the Z-axis of the global coordinate system, approximately at the body's midpoint directly above the pigeon’s paws), and its diameter was 24 cm (considering the centroid was usually around 10 cm above the ground, with an added 20% margin for the radius).
Figure 3 with 3 supplements
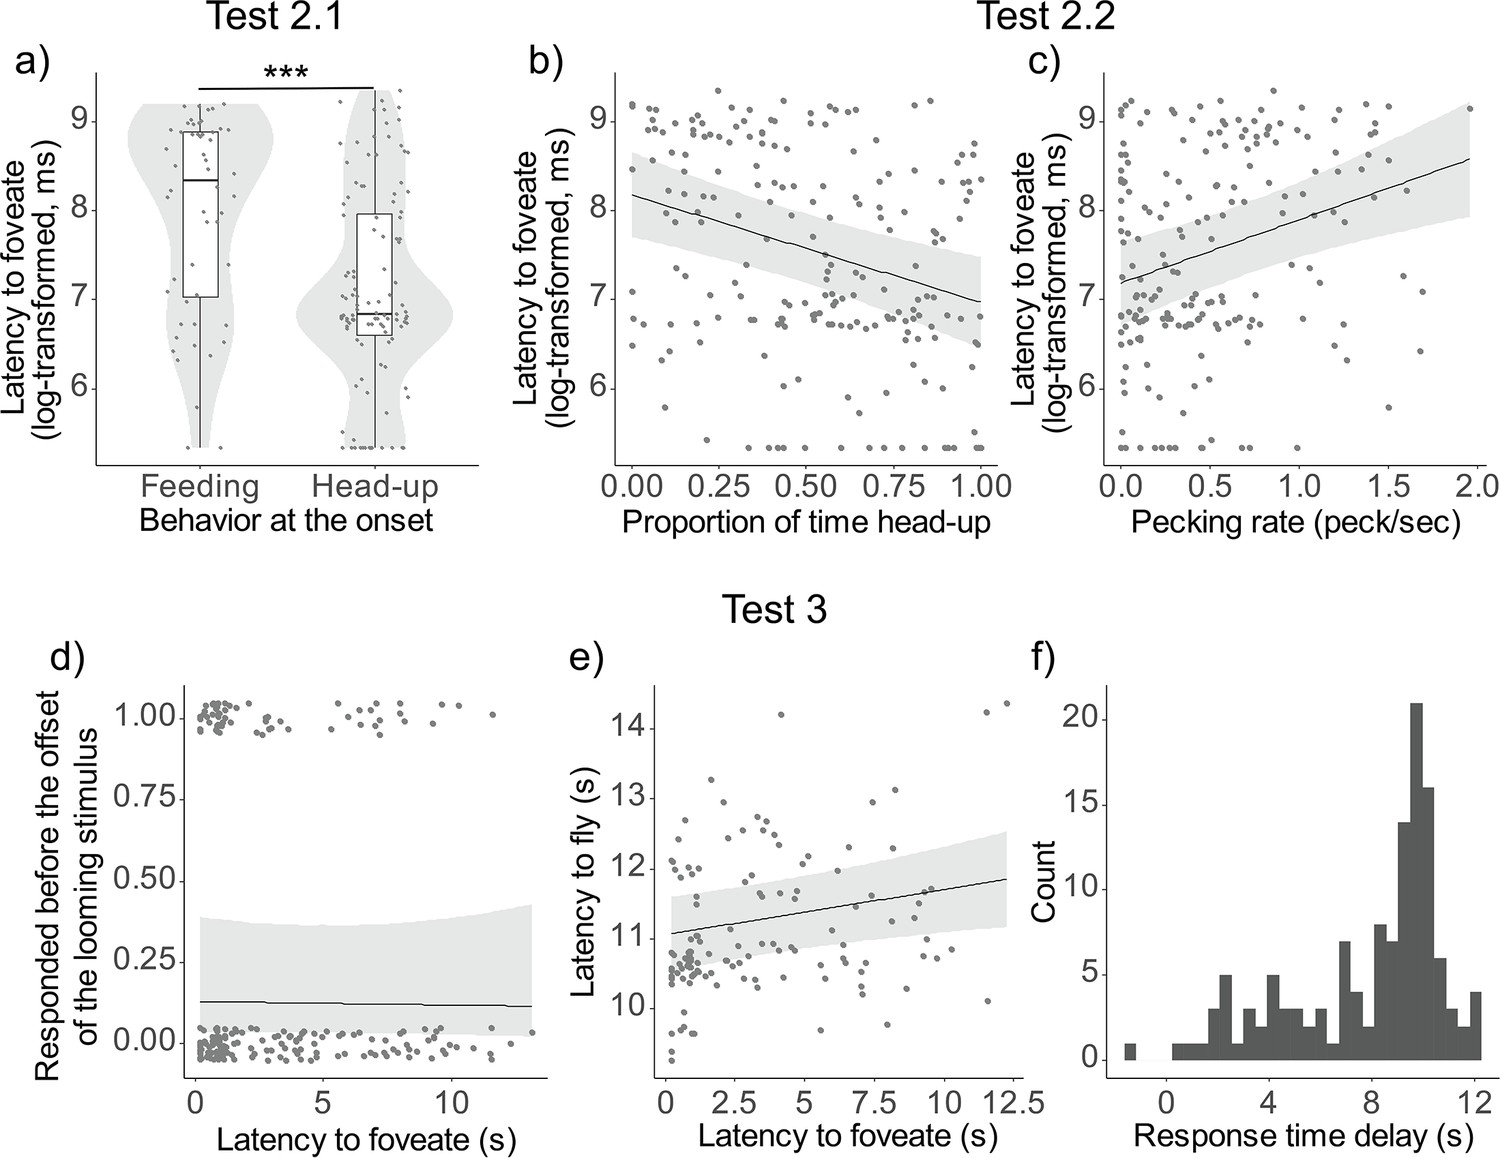
Testing assumptions of vigilance, detection and escape.
Results of the models from Tests 2 and 3. (a) Latency to foveate on the predator cue (log-transformed) as a function of behavioral state (feeding or head-up) at the onset of the looming stimulus. The dots represent single observations (jittered horizontally for visualization), the gray shade represents the violin plot of the distributions, and the boxplot’s boxes represent the 0.25 and 0.75 quartiles (with the median represented as a line inside the box) and the whiskers the minimum and maximum values within the lower/upper quartile ±1.5 times the interquartile range. Latency to foveate on the predator cue as a function of the proportion of time spent being head-up during the ‘before-cue’ period (b) and as a function of the pecking rate during the same period (c). The graphs for the three other variables can be found in Figure 3—figure supplement 1. Probability of escaping before the looming stimulus offset (d), and latency to fly (e) as a function of the latency to foveate. (f) Histogram of the distribution of the response delay (time between the latency to foveate and the latency to fly). For all depicted results, regression lines were determined with other variables held constant, set to their mean values. A comprehensive table detailing the outcomes of the models can be found in Table 1—source data 3. *** represent a significant difference with p < 0.001.
-
Figure 3—source data 1
Detailed results of the models comparing the behavior of the pigeons before and after an event.
- https://cdn.elifesciences.org/articles/95549/elife-95549-fig3-data1-v1.xlsx
Figure 3—figure supplement 1
Testing assumptions of vigilance: supplementary plots.
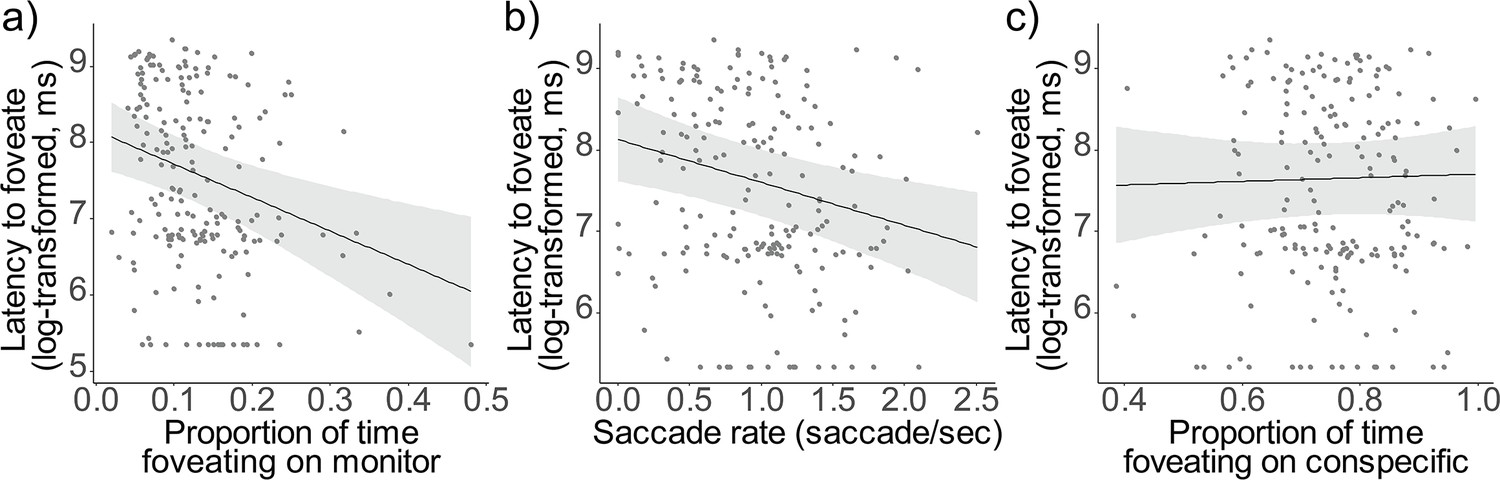
Results of the models from Test 2.2: Latency to foveate on the predator cue as a function of the proportion of time foveating on the monitor during the “before-cue” period (a), as a function of the saccade rate during the same period (b) and the proportion of time foveating on any conspecific during the same period (c). The regression lines were determined with other variables held constant, set to their mean values. A comprehensive table detailing the outcomes of the models can be found in Table 1—source data 3 .
Figure 3—figure supplement 2
Behavior of the pigeons before each event.
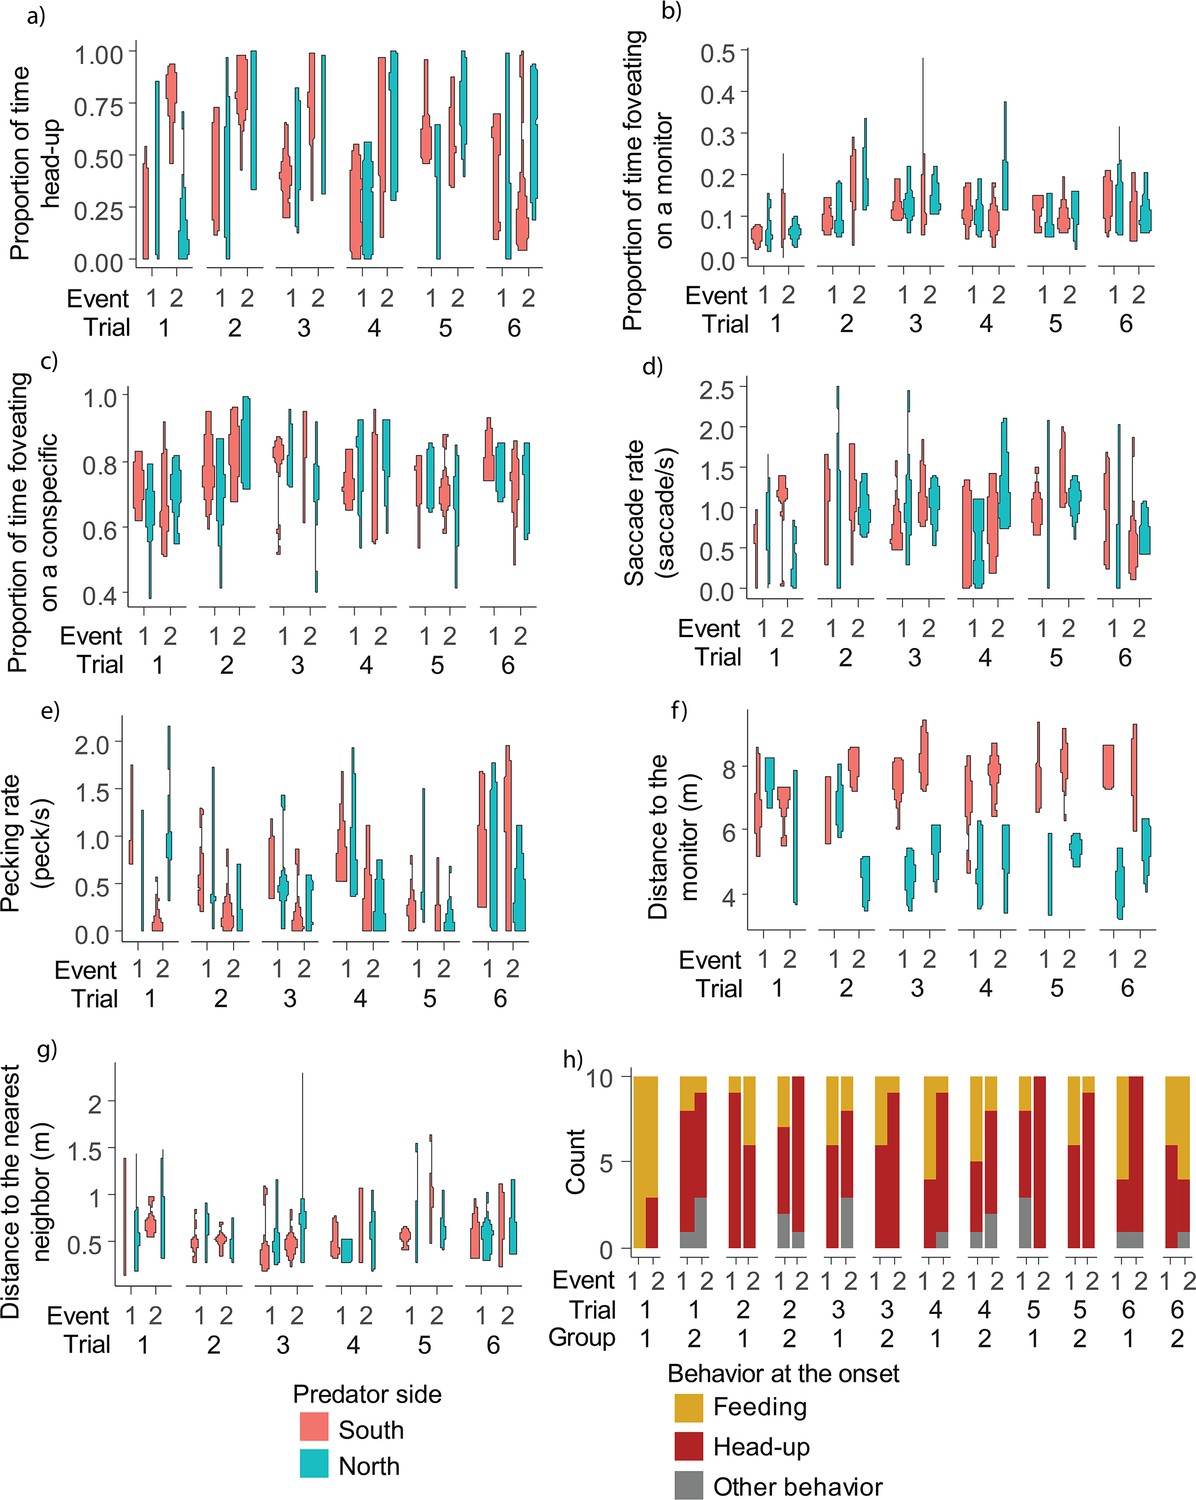
Predictor variables as a function of the trials and events. The distributions of the different variables are displayed as violin plots and the color represents the side of the predator event. (a-e) Behavior during the “before cue” period (2 min period straight before the onset of the looming stimulus) as a function of the trial and event: proportion of time head-up (a), proportion of time foveating on either of the monitors (b), proportion of time foveating on one of the conspecifics (c), saccade rate (d), pecking rate (e). (f-h) Behavioral and spatial state measures at the onset of the looming stimulus as a function of the trial and event: distance to the monitor (f), distance to the nearest neighbor pigeon (g), the number of individuals within a flock exhibiting respective behaviors (feeding, head-up or other behavior) exhibited at the onset on the looming stimulus (h).
Figure 3—figure supplement 3
Comparison of the behavior of the pigeons before and after an event.
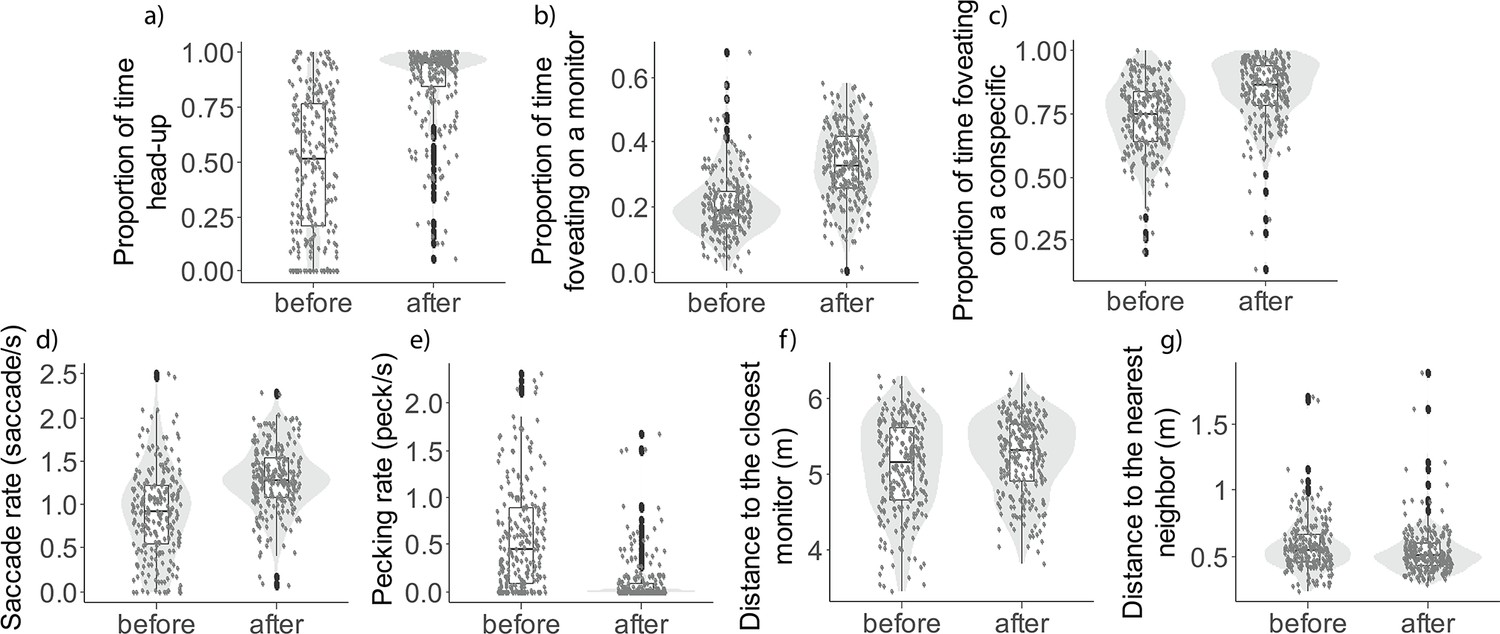
Behavioral changes between the 1 min period before the onset of the looming stimulus and the 1 min period after the disappearance of the predator: proportion of time spent being head-up (a), proportion of time spent foveating on one of the monitors (b), proportion of time spent foveating on one of the conspecifics (c), saccade rate (d), pecking rate (e), distance to the closest monitor (f), distance to the nearest neighbor (g). The dots represent single observations (jittered horizontally for visualization), the grey shade represents the violin plot of the distributions, and the boxplot’s boxes represent the 0.25 and 0.75 quartiles (with the median represented as a line inside the box) and the whiskers the minimum and maximum values within the lower/upper quartile ± 1.5 times the interquartile range. We collected data for all measures over a one-minute period immediately preceding the onset of the looming stimulus and following the predator's disappearance (averaging the distances over the same period). Linear Mixed Models (LMMs) were used, with the behavior/distance as the response variable. The time period (before vs. after the event) served as the test variable, while event type, predator side, and sex were control variables. Pigeon ID and trial were included as random effects. For all tested behaviors, measurements taken after the predation event showed significant differences compared to those before (p < 0.001). The distances also exhibited significant changes (distance from the closest monitor: p = 0.0034; distance from the nearest neighbor: p = 0.0043; see Figure 3—source data 1 for detailed model results).
Figure 4
Results of Test 4.
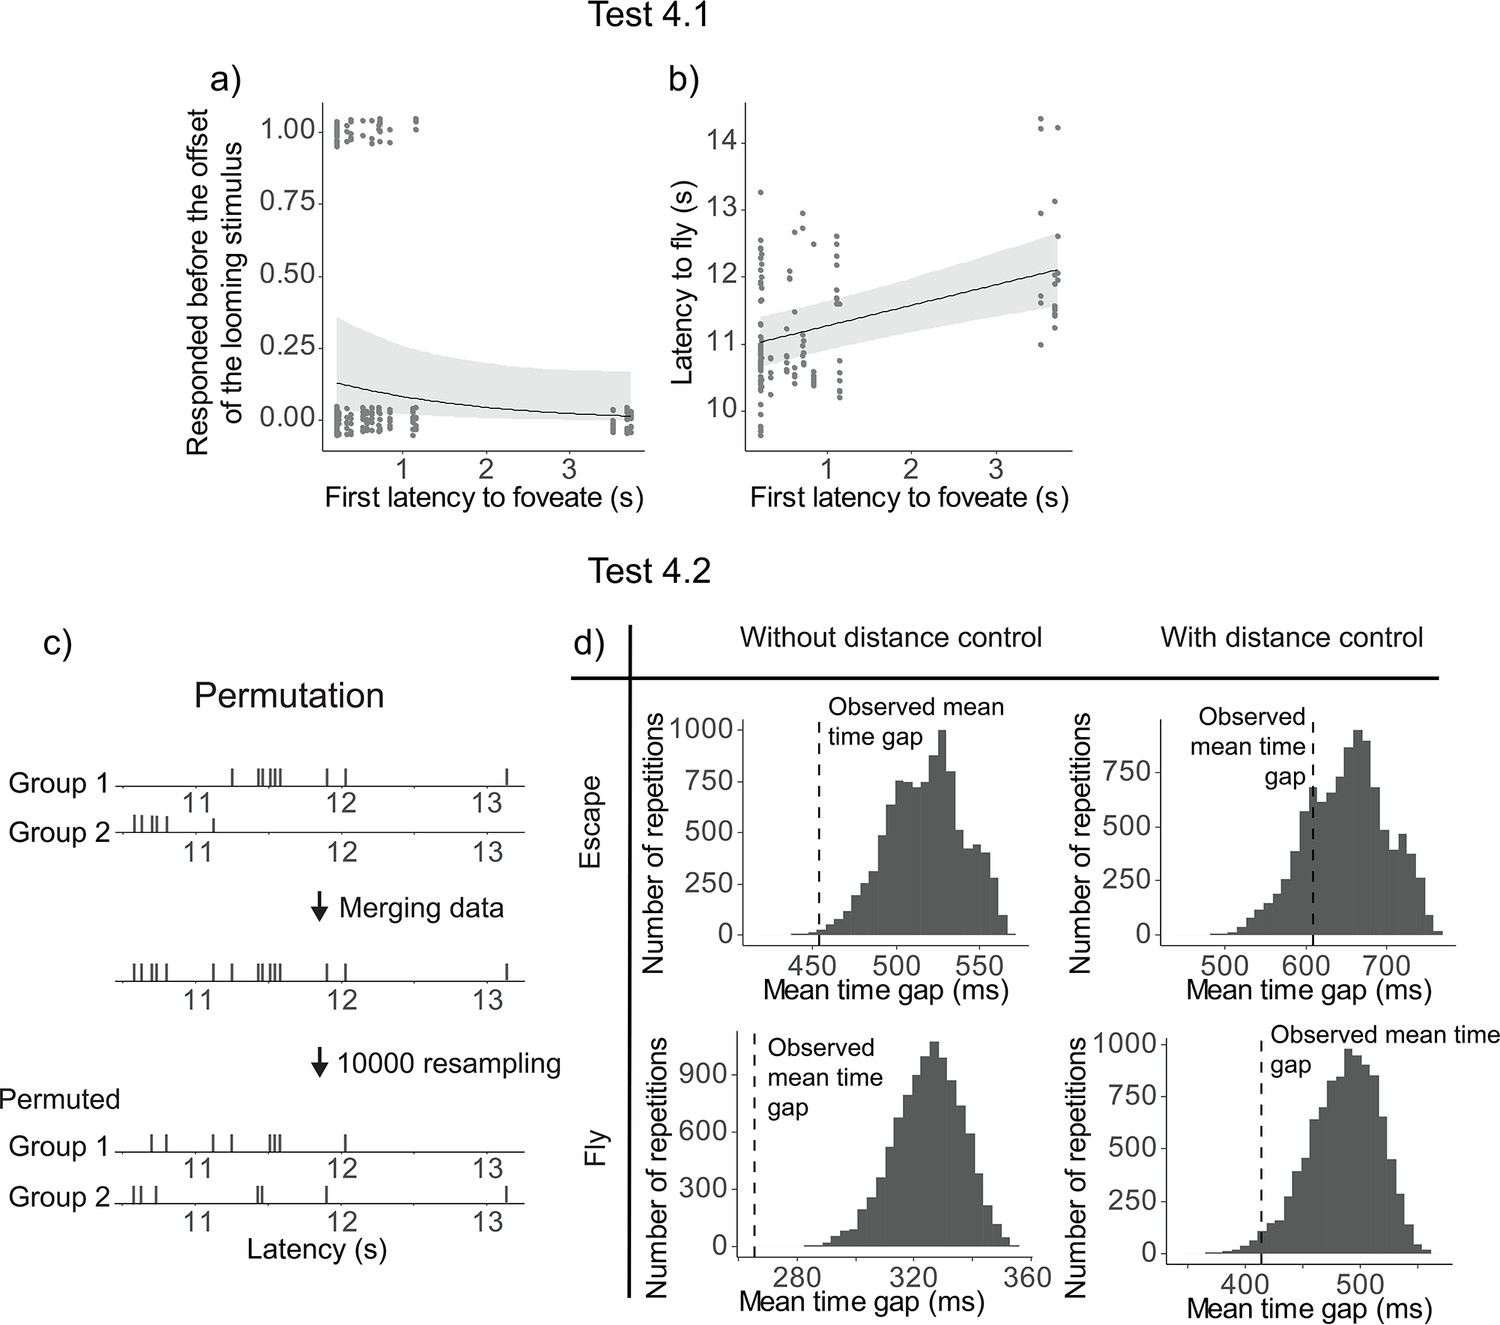
Latency to foveate of the first individual foveating on the monitor as a function of the other individuals’ probability of escape before the cue offset (a) and the other individuals’ latency to fly (b). All the regression lines were calculated with other variables constant and equal to their mean value. A detailed table of the models’ results is available in Table 1—source data 3. (c) An overview of the permutation test procedure. (d) Results of the permutation test. Histograms denote the distributions of the average time gap in permutated data. The vertical dashed line indicates the mean time gap from the observed data. The proportion of permutated data less than the observed data (on the left of the dashed line) gives the p-value; escaping (top) and flying (bottom); without (left) or with (right) distance control.
Tables
Table 1
A set of hypotheses testing the assumptions about vigilance.
| Hypothesis | Test | Response | Description of the test | |
|---|---|---|---|---|
| 1 | Pigeons foveate on the predator cue (monitor or predator hiding table) during the 10 s presentation period of the looming stimulus. | Linear mixed model (LMM) | Proportion of time foveating on the objects of interest. | Testing the effect of: Object type (the monitor presenting the looming stimulus, the monitor that did not present the looming stimulus, and the nearest neighbor pigeon). |
| 2.1 | Pigeons that are head-up (while not grooming nor courting or courted) foveate on the predator cue earlier than those that are feeding at the onset of the looming stimulus. | LMM | Latency to foveate on the predator cue. | Testing the effects of: Behavior exhibited at the onset of the looming stimulus (head-up/feeding), distance from the monitor presenting the looming stimulus, and distance from the nearest neighbor conspecific. |
| 2.2 | Pigeons’ vigilance/feeding-related behaviors during the 2 min ‘before-cue’ period predict their earlier foveation on the predator cue. | LMM | Latency to foveate on the predator cue. | Testing the effects of: Vigilance/feeding-related behaviors (proportion of time spent head-up, saccade rate, pecking rate, proportion of time foveating on any monitor, proportion of time foveating on any conspecifics). |
| 3 | Pigeons’ first foveation on the predator cue predicts their escape. | LMM and generalized linear mixed model (GLMM) | Probability of evasion before the offset of the looming stimulus, latency to fly. | Testing the effect of: Latency to foveate on the predator cue. |
| 4.1 | The first pigeon foveating on the predator (looming) within a flock facilitates the escape behaviors of the other members. | LMM and GLMM | Probability of escape before the offset of the looming stimulus and latency to fly in the other members (excluding the first pigeon). | Testing the effect of: Latency to foveate on the predator cue by the first pigeon. |
| 4.2 | Escape responses within a predator presentation event are more clustered than expected by chance. | Permutation test | Time interval between the successive escape (or flying) responses of pigeons within a given predator presentation event. | Comparing the mean interval observed in the data with the mean intervals expected by chance in a control event created by shuffling the latencies between event ID. |
-
Table 1—source data 1
Description of the used variables and responses.
- https://cdn.elifesciences.org/articles/95549/elife-95549-table1-data1-v1.xlsx
-
Table 1—source data 2
R formulas used for the different models.
- https://cdn.elifesciences.org/articles/95549/elife-95549-table1-data2-v1.xlsx
-
Table 1—source data 3
Detailed model results.
- https://cdn.elifesciences.org/articles/95549/elife-95549-table1-data3-v1.xlsx
-
Table 1—source data 4
Repeatability of the used variables.
- https://cdn.elifesciences.org/articles/95549/elife-95549-table1-data4-v1.xlsx
Table 2
Description of the behavior classification definitions.
| Behavior | Category | Definition |
|---|---|---|
| Head-down | State | The centroid of the head (middle point between the eyes) is lower than the centroid of the body (6 cm below the backpack markers center point) along the z axis of the global coordinate system (=vertically). |
| Head-up | State | The pigeon is not head-down and not exhibiting another behavior (feeding, grooming, or courting). |
| Pecking | Event | The beak tip is closer than 4 cm from the ground and is not oriented toward the body (pitch >−100° from horizon). The pecking event is defined as the frame where the beak tip is the closest from the ground. |
| Feeding | State | Any time between two pecks spaced no more than 6 s apart. |
| Grooming | State | Preening the back feathers: This occurs when the head is pointing backward (defined as when the head direction vector and the body–head vector form an angle larger than 60°) and the beak tip is close to the body center (less than 10 cm) OR when the head is pointing backward (defined as when the head direction vector and body–head vector form an angle larger than 40°) and the beak tip is close to the body centroid (less than 10 cm), and the head centroid is above the body centroid. Preening the breast feathers: This behavior occurs when the head is strongly pointing down (pitch <−100°) OR when the head is pointing down (pitch <−80°) and the head direction vector and the body–head vector form an angle larger than 60°. Scratching the head with the paw: This behavior is exhibited when the roll of the head is large (>50°) and the head is low (less than 3 cm above the body center). |
| Courting | State | The pigeon is bowing its head, which is a typical head movement in pigeon courtship, at a rate of at least two bows within an 8-s period, while being within a proximity of less than 60 cm and oriented toward another pigeon within an angle of less than 120°. We filtered out any instances shorter than 1 s for robust detection. |
| Running away from the monitor | State | When the body centroid of the pigeon moves at a speed faster than 0.6 m/s, and the pigeon is not classified as courting or being courted, while also increasing its distance from the monitor at a speed of 0.2 m/s, we filter out any events shorter than 70 ms for robust detection. |
| Flying | State | When the body centroid of the pigeon moves at a speed greater than 2 m/s, we filter out any events shorter than 70 ms for robust detection. |
-
Table 2—source data 1
Histogram of the pigeon's speed over the course of the trials (vertical line representing the running speed threshold).
- https://cdn.elifesciences.org/articles/95549/elife-95549-table2-data1-v1.zip
-
Table 2—source data 2
Inter-rater reliablity scores for the automated classification of behaviors.
- https://cdn.elifesciences.org/articles/95549/elife-95549-table2-data2-v1.xlsx
Additional files
Download links
A two-part list of links to download the article, or parts of the article, in various formats.
Downloads (link to download the article as PDF)
Open citations (links to open the citations from this article in various online reference manager services)
Cite this article (links to download the citations from this article in formats compatible with various reference manager tools)
Fine-scale tracking reveals visual field use for predator detection and escape in collective foraging of pigeon flocks
eLife 13:RP95549.
https://doi.org/10.7554/eLife.95549.3


