Does bumblebee preference of continuous over interrupted strings in string-pulling tasks indicate means-end comprehension?
- School of Grassland Science, Beijing Forestry University, China
- Biological and Experimental Psychology, School of Biological and Behavioural Sciences, Queen Mary University of London, United Kingdom
- Department of Psychology, School of Public Health, Southern Medical University, China
- Guangdong-Hong Kong-Macao Greater Bay Area Center for Brain Science and Brain-Inspired Intelligence, Southern Medical University, China
- Beijing Key Laboratory for Forest Pest Control, Beijing Forestry University, China
- College of Forestry and Landscape Architecture, South China Agricultural University, China
Figures
Figure 1
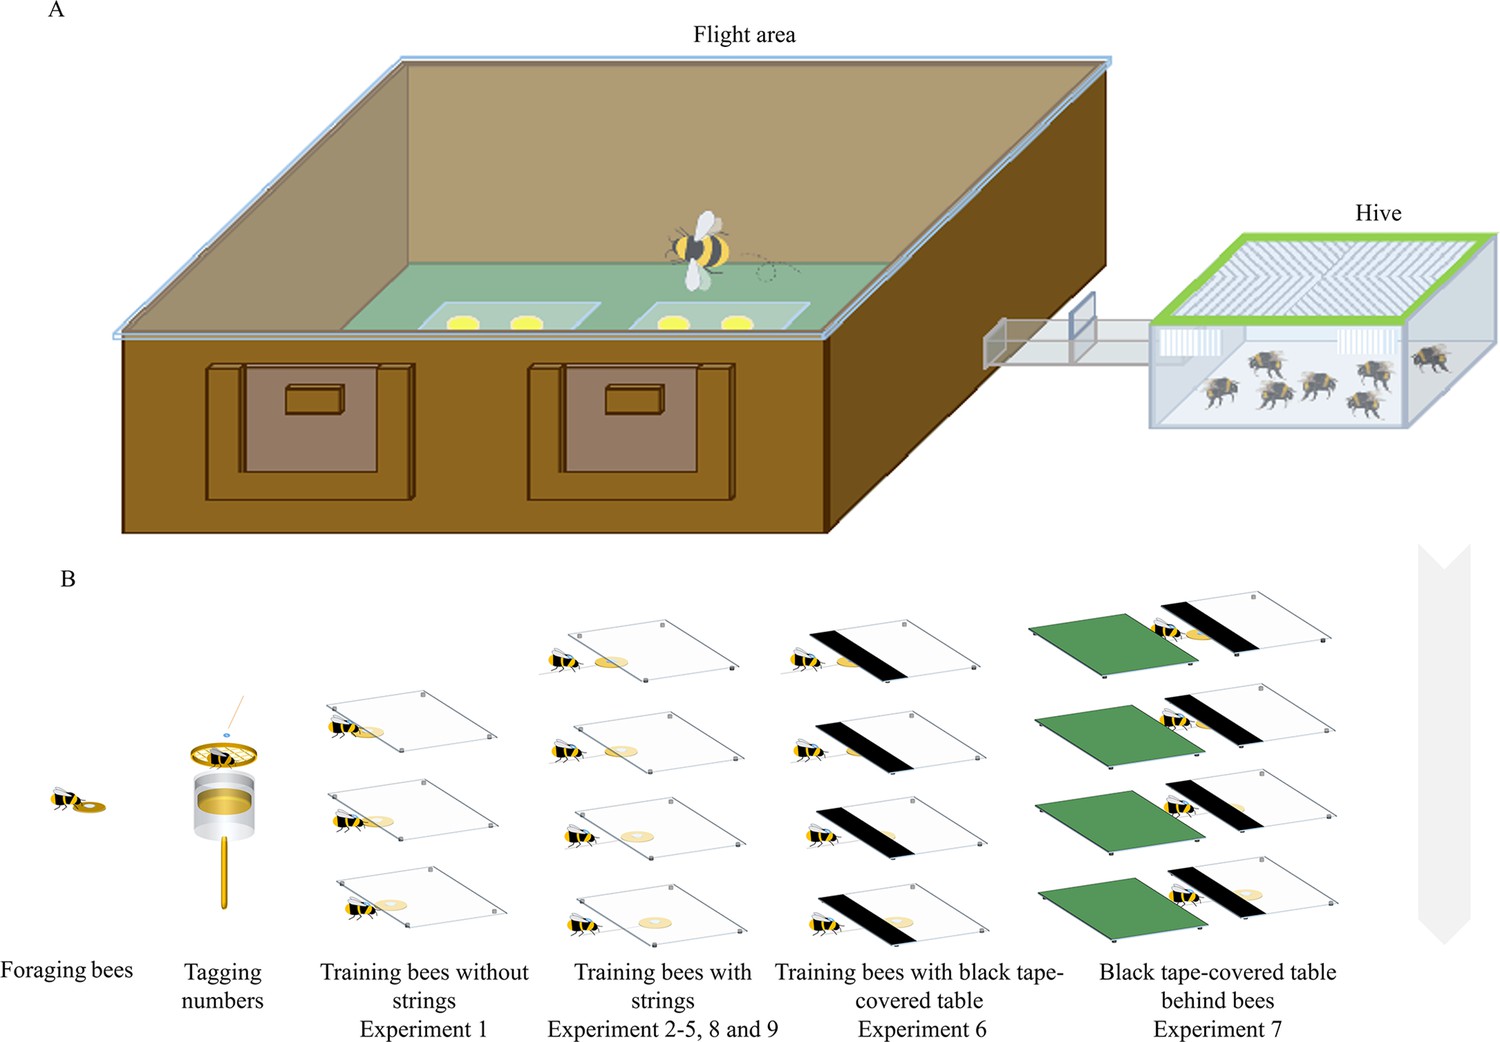
Experimental apparatus and summary of training in different experiments.
(A) The experimental setup consisted of a flight arena connected to a hive via a Perspex corridor. (B) Foraging bumblebees were number-tagged, and the marked bees were trained in a stepwise manner.
Figure 2
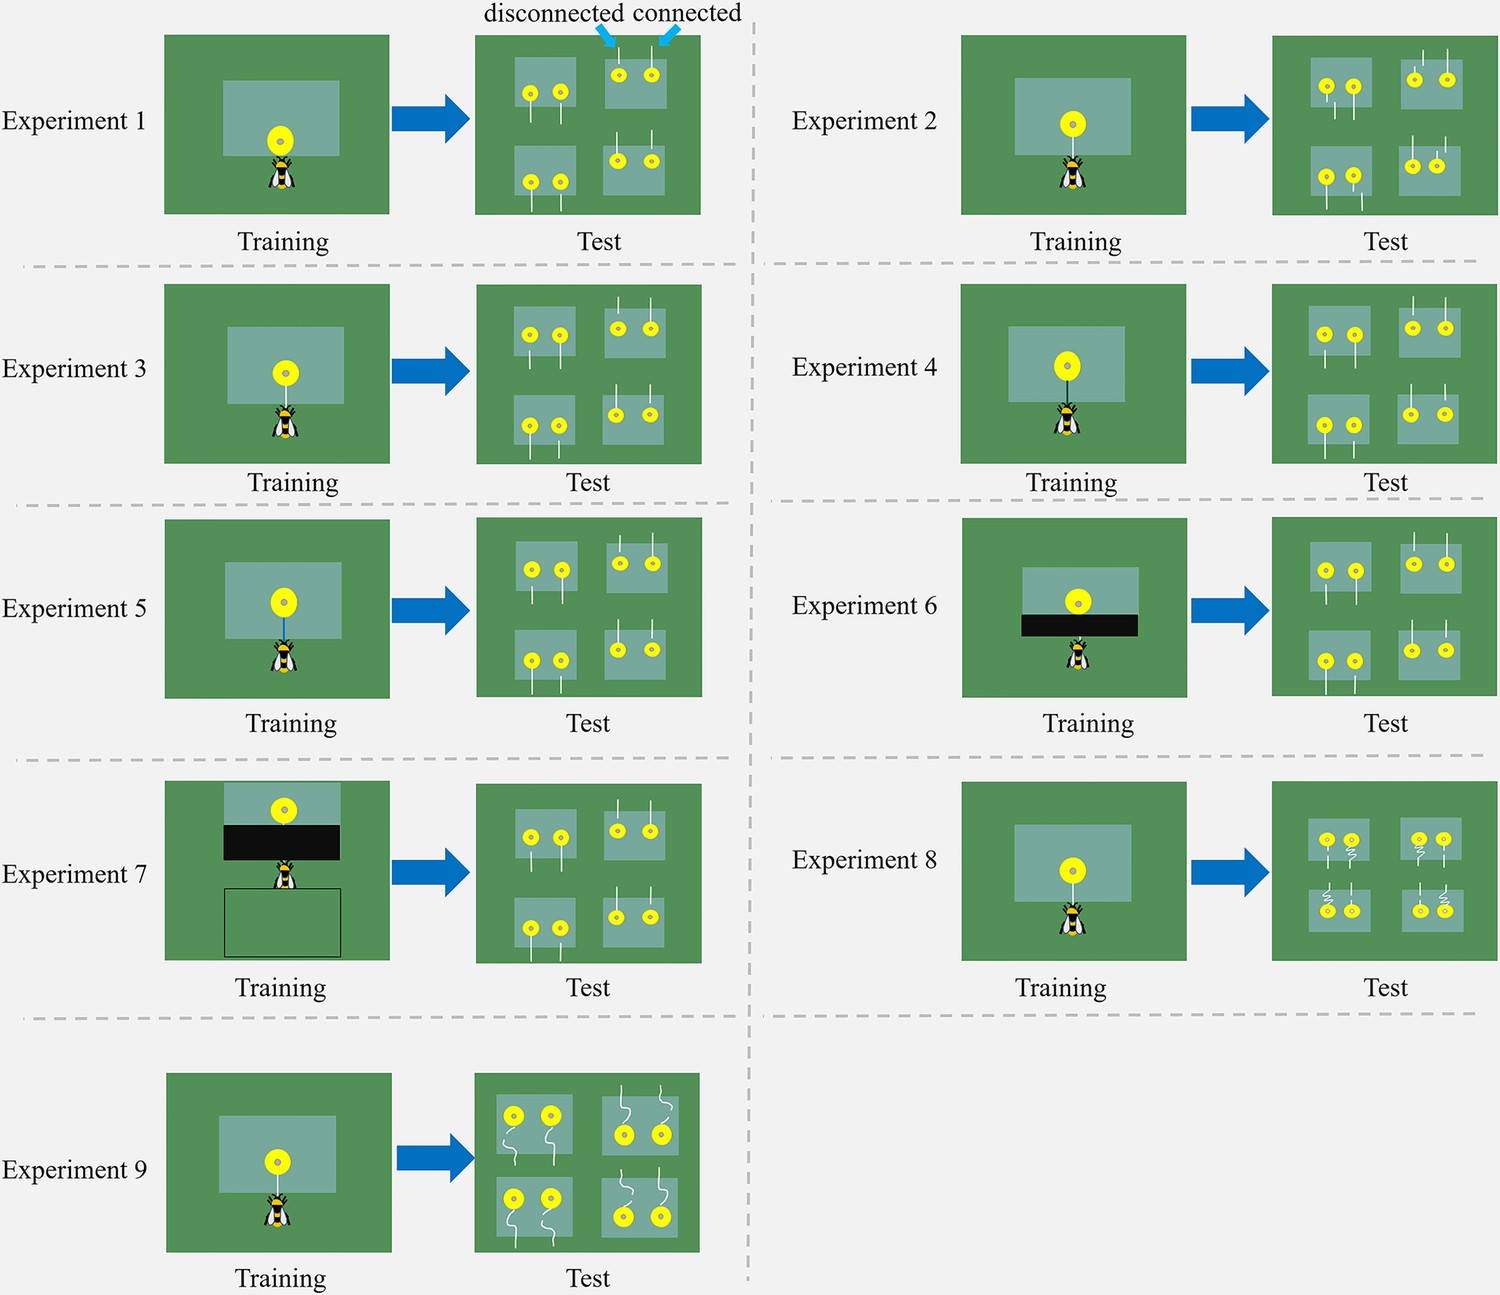
Schemes of nine string-pulling experiments.
Bumblebees were trained and tested in different situations. Two flowers were placed under each transparent table in the test, with one string connected to a flower and another was detached. For further details and descriptions of each experiment, see the text.
Figure 3
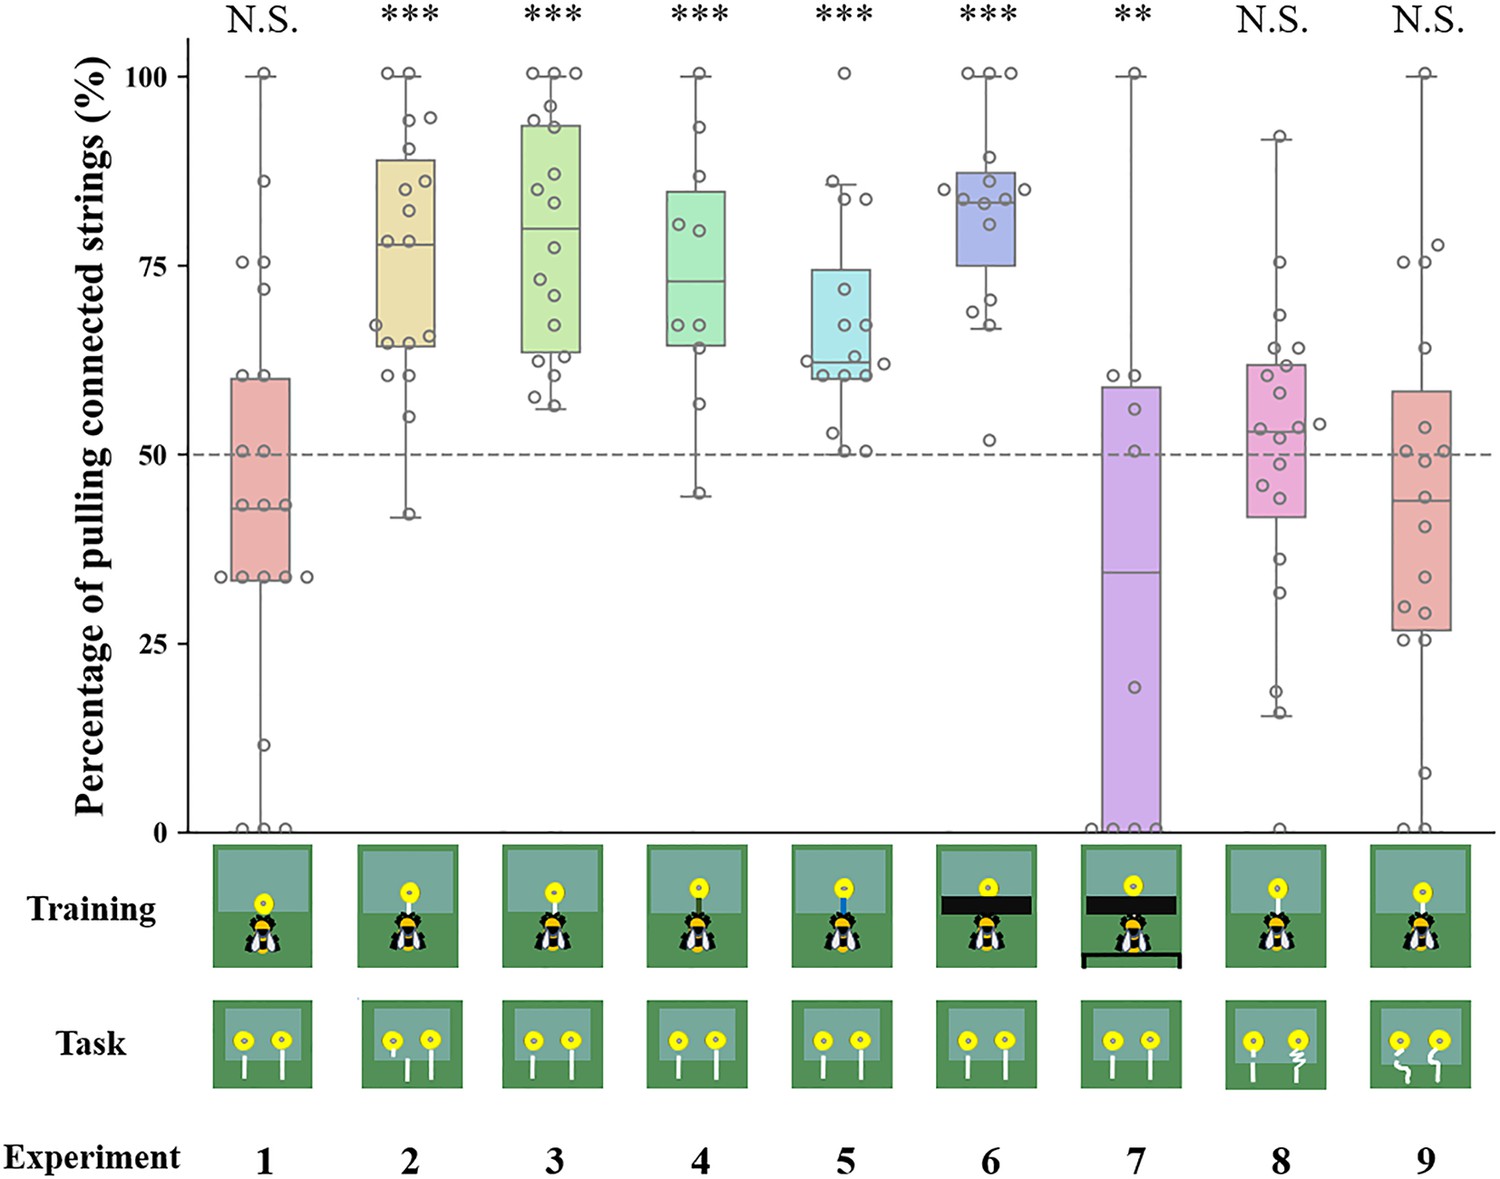
Bumblebee preferences for continuous strings over the entire duration of the test in different string-pulling experiments.
Percentage of pulling connected strings compared with chance level (50%). Data are presented as mean ± SE. Boxes show the 25th percentile, 50th percentile (median), 75th percentile. The dashed line represents chance level (50%) and the circles indicate individual bees’ data points. *** p<0.001; ** p<0.01; N.S. p>0.05.
Figure 4
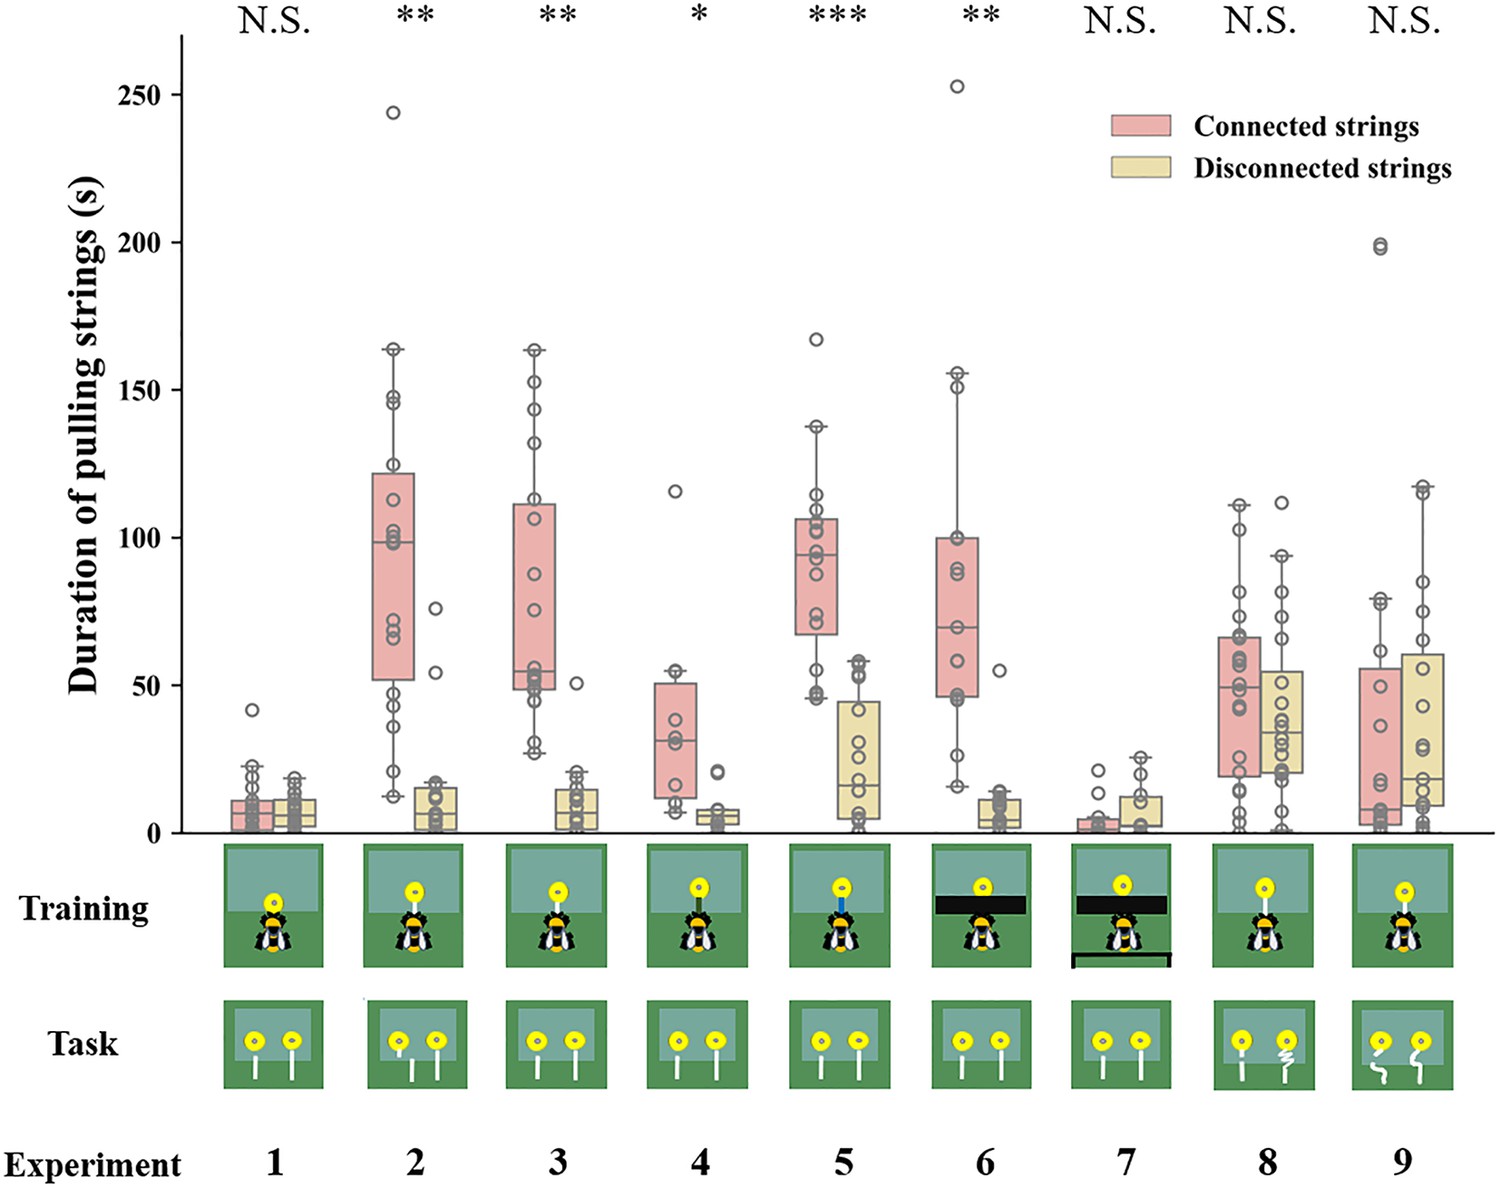
Duration of bumblebees attempting to pull the strings over the entire duration of the test across experiments.
Median, interquartile range and range are given. Boxes show the 25th percentile, 50th percentile (median), 75th percentile. Circles indicate individual bees’ data points. *** p<0.001; ** p<0.01; * p<0.05; N.S. p>0.05.
Figure 5
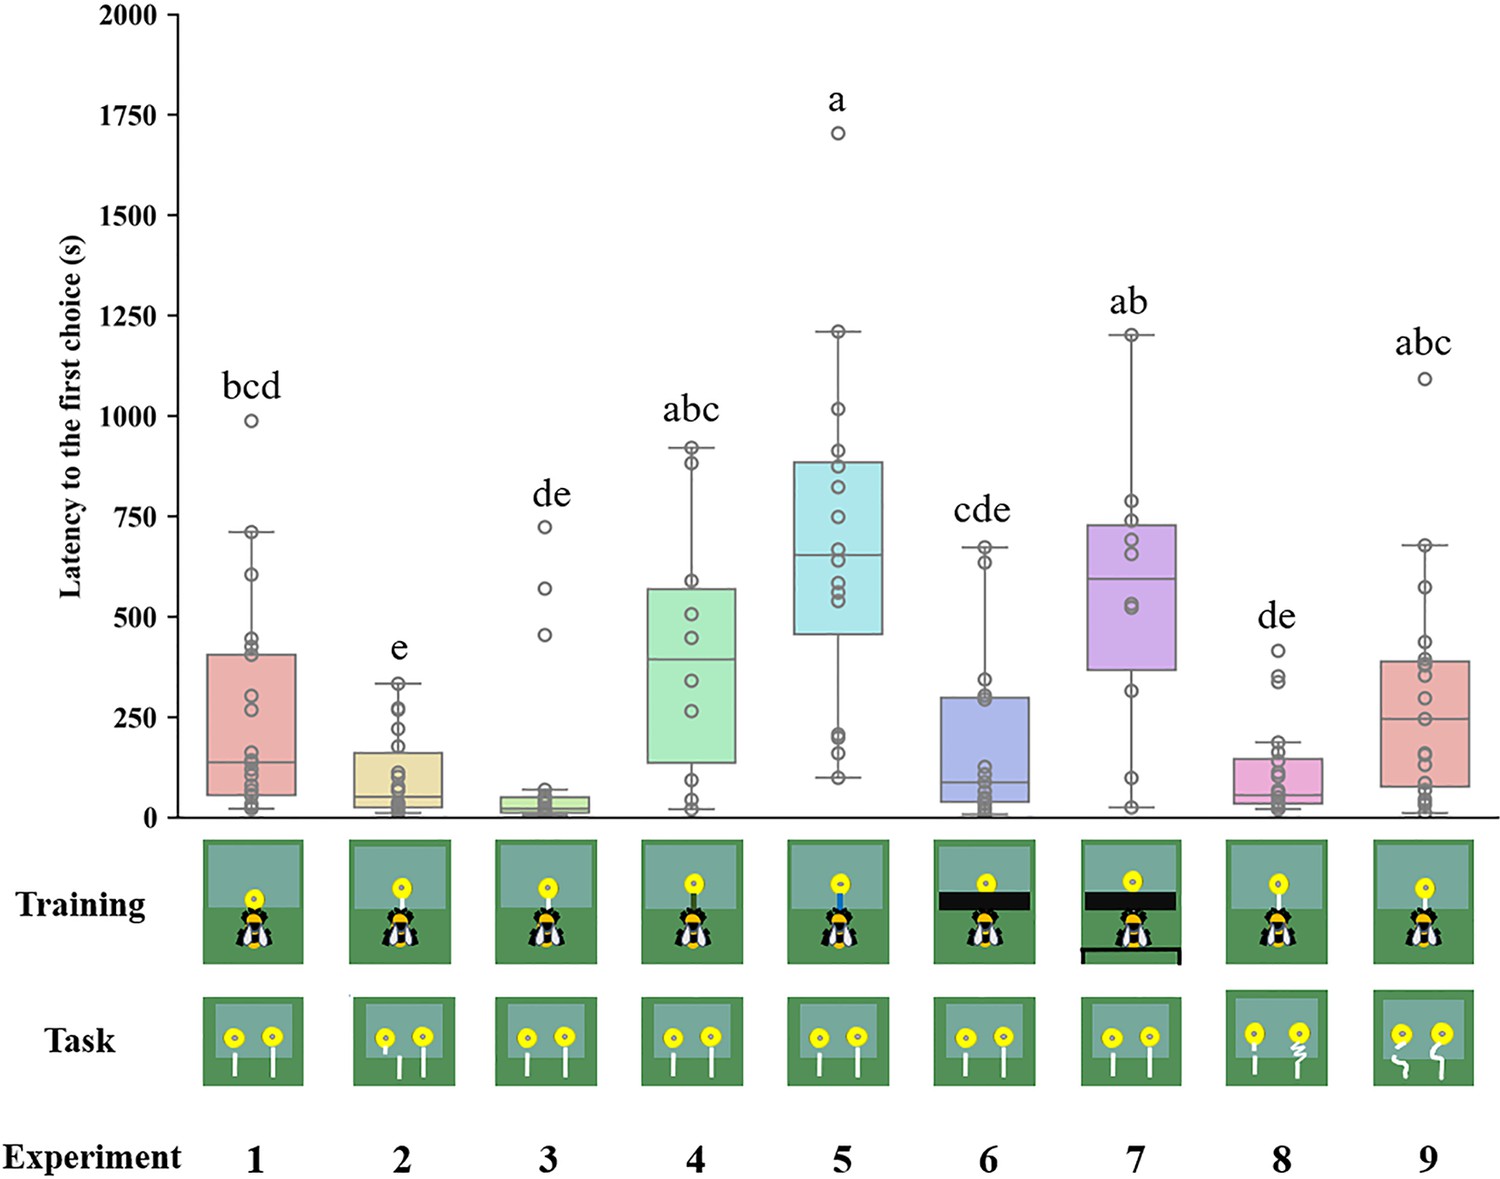
Latency to the first choice in different experiments.
Median, interquartile range and range are given. Boxes show the 25th percentile, 50th percentile (median), 75th percentile. Circles indicate individual bees’ data points. Different letters indicate significant differences (p<0.05).
Videos
Video 1
Training the bumblebees without string.
Bees were trained to retrieve a yellow flower (without a string) containing sugar water from under a transparent table.
Video 2
Training the bumblebees with a white string.
Bees were trained to retrieve yellow flowers from under a transparent table by pulling an attached white string.
Video 3
String-pulling test of bumblebee in Experiment 2; the footage shows a bee attempting to pull the connected strings rather than the disconnected strings.
Video 4
String-pulling test of bumblebee in Experiment 3; the footage shows a bee attempting to pull the connected strings rather than the disconnected strings.
Video 5
Training bumblebees with a green string.
Bees were trained to retrieve yellow flowers from under a transparent table by pulling an attached green string, to test whether bees could generalize from the string color used during training.
Video 6
Training bumblebees with a blue string.
Bees were trained to retrieve yellow flowers from under a transparent table by pulling an attached blue string, to test whether bees could generalize from the string color used during training.
Video 7
Training bumblebees with a black tape-covered table.
Bees were trained to retrieve yellow flowers from under a transparent table covered by black tape, hypothesizing that bees were not able see the movement of the string above the table.
Video 8
Training the bee with a black tape-covered table, and a green table behind the bee, hypothesizing that bees were not able to see the image during the first step of training, and the string disappeared from the bees’ view when the flower was pulled out from under the table.
Tables
Table 1
The number of total choices and bees that chose connected strings at first choice.
| Training | 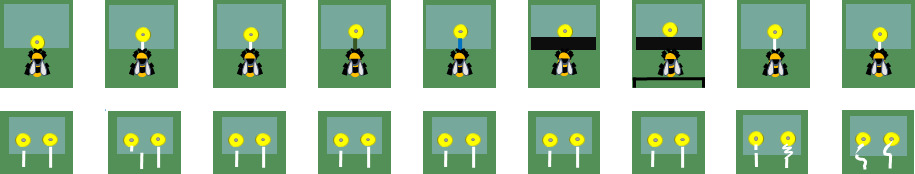 | ||||||||
|---|---|---|---|---|---|---|---|---|---|
| Task | |||||||||
| Experiment | 1 | 2 | 3 | 4 | 5 | 6 | 7 | 8 | 9 |
| Number of choices (mean ±SE) | 5.10±0.54 | 15.00±1.53 | 15.56±2.16 | 12.10±2.19 | 11.63±1.66 | 15.87±2.05 | 5.60±1.55 | 20.60±1.80 | 14.37±2.82 |
| Number of bees choosing connected strings at first choice/N | 10/21 (N.S.) | 13/18 (N.S.) | 17/18 (***) | 7/10 (N.S.) | 14/16 (*) | 10/15 (N.S.) | 5/10 (N.S.) | 11/20 (N.S.) | 10/19 (N.S.) |
| Chi-square result | χ2=0.05 P=0.83 | χ2=3.56 P=0.06 | χ2=14.22 P<0.001 | χ2=1.60 P=0.21 | χ2=9.00 P<0.05 | χ2=1.67 P=0.20 | χ2=0.00 P=1.00 | χ2=0.20 P=0.65 | χ2=0.05 P=0.82 |
-
The numbers before the slash are the numbers of bumblebees pulling connected strings on the first choice, and the numbers after the slash are the total number of tested bumblebees. N is the total number of the bees. *** p<0.001; * p<0.05; N.S. p>0.05.
Additional files
-
Supplementary file 1
The choices of each bee in different experiments.
- https://cdn.elifesciences.org/articles/97018/elife-97018-supp1-v1.xlsx
-
Supplementary file 2
The analysis results of bumblebee’s preferences for continuous strings in different string-pulling experiments.
- https://cdn.elifesciences.org/articles/97018/elife-97018-supp2-v1.xlsx
-
Supplementary file 3
The analysis results of bumblebee’s duration for continuous strings in different string-pulling experiments.
- https://cdn.elifesciences.org/articles/97018/elife-97018-supp3-v1.xlsx
-
Supplementary file 4
The analysis results of latency to the first choice in different experiments.
- https://cdn.elifesciences.org/articles/97018/elife-97018-supp4-v1.xlsx
-
MDAR checklist
- https://cdn.elifesciences.org/articles/97018/elife-97018-mdarchecklist1-v1.docx
Download links
A two-part list of links to download the article, or parts of the article, in various formats.
Downloads (link to download the article as PDF)
Open citations (links to open the citations from this article in various online reference manager services)
Cite this article (links to download the citations from this article in formats compatible with various reference manager tools)
Does bumblebee preference of continuous over interrupted strings in string-pulling tasks indicate means-end comprehension?
eLife 13:RP97018.
https://doi.org/10.7554/eLife.97018.3


