Last year eLife introduced a peer-review trial in which authors could opt in to a process in which they had greater control over the ultimate decision to publish. In brief, once an editor had invited a paper for peer review, eLife was then committed to publishing the work, along with the peer review assessments, unless the authors decided to withdraw (see Peer review: eLife trials a new approach for further details). The authors of 313 submissions between June 26 and August 8, 2018 elected to participate.
In January, we described some initial results (see Peer review: First results from a trial at eLife). Of the 313 submissions, 70 (22.4%) were encouraged for in-depth peer review. We noted that this “encouragement rate” was higher for late-career researchers compared to their early- and mid-career colleagues. We also observed that encouragement rates were similar for male and female last authors in the trial process.
We will now summarise some re-analysis of the initial decision step, and the results of the peer-review process itself for the 70 trial papers sent for in-depth review and for 162 papers that went through the regular review process during the same period. We are planning to present the final outcomes of the trial at a later date.
Re-analysis of initial decision outcomes by career stage
In response to the first set of results, we are taking steps to explore the apparent disparity in encouragement rates for authors at different career stages. For example, we have realised since the original analysis that the encouragement rate in the regular review process had been inflated because it included papers that had been previously submitted to eLife but rejected, often after peer review: submissions of this nature have a higher-than-average chance of being encouraged for full submission because the authors have had a chance to respond to the previous concerns. These papers were excluded from the trial process. Our original sample of 665 regular submissions contained 49 such submissions: with hindsight we should also have excluded these submissions from our original analysis, and we now update our results accordingly.
In Figure 1A we include the original analysis of encouragement rates by career stage (see Figure 5B in the previous blogpost), together with an updated version (Figure 1B) that excludes the papers that had been submitted to eLife previously. When we exclude papers that had been rejected before (Figure 1B), there is very little difference in encouragement rates for early- and late-career researchers (23% and 33% of papers encouraged in the regular process, respectively, compared to 25% and 35% in the trial process). However, there remains a striking difference in encouragement rates for mid-career researchers (32% encouraged in the regular process versus 21% in the trial process) and, in both the regular and trial processes, early-career researchers do not fare as well as their late-career colleagues. Excluding previously rejected manuscripts has altered the way in which we interpret some of the results, so we will be excluding those papers from all further analyses.
In addition to this, we contacted the authors whose career-stage data were missing to ask for the year in which they became independent researchers. Figure 1C includes these data (and excludes the papers in the regular process that had been previously considered by eLife). The inclusion of these additional data does not alter the conclusions from Figure 1B and we will use the more complete career-stage data moving forward.

Figure 1. Percentage of initial submissions that were encouraged to full submission (encouragement rate) by the career stage of the last author. (A) For regular submissions this includes initial submissions that were new versions of articles that had been previously submitted to eLife and rejected. (B) For regular submissions this excludes initial submissions that were new versions of articles that had been previously submitted to eLife and rejected. (C) This includes additional career-stage information as provided by the authors. The white (or blue) text at the base of each bar indicates the number of initial submissions that were encouraged for peer review by career stage and submission type, while the black text at the base of each bar indicates the total number of initial submissions by career stage and submission type.
Peer-review decision outcomes

Figure 2. Decision outcomes for regular and trial submissions, before and after peer review. The text within each section of the bar indicates the number of submissions receiving a decision for each submission type. Note, in the regular process, one paper was accepted after peer review (without asking for revisions), and one paper was withdrawn, depicted by the green and pink bars respectively.
Now we move on to focus on the peer-review process itself, based on the 70 papers sent for in-depth peer review in the trial and 162 in the regular process. Figure 2 shows the decision outcomes before and after peer review for regular and trial submissions. In the regular process, 58% of full submissions (94/162) were invited for revisions, while one paper was accepted outright. In the trial process, as we would expect, all 70 ended with revise decisions.
Figure 2 also suggests that the estimated acceptance rate for papers in the trial process is 22.4% (70/313), which is noticeably higher than the estimated acceptance rate of 15.3% (94/616) for regular submissions. This difference is likely to become less pronounced when we take into account two trial manuscripts that have already been withdrawn. In addition, the outcome of appeals might slightly reduce the overall rejection rate in the regular process.
Appeals
Figure 3 provides an overview of decisions that were appealed: it should be noted that papers in the trial cannot be rejected after peer review, so there were no appeals after peer review (although authors can choose to withdraw their manuscripts). However, Figure 3 does suggest that the trial process results in a slightly higher proportion of appeals after the initial evaluation, with 5.6% of initial submission rejection decisions appealed, compared with 4.4% of rejection decisions in the regular process (both before and after peer review).

Figure 3. Percentage of rejection decisions that were appealed, including appeals before and after review in the regular process. White numbers in the bars depict the number of initial submission appeals received for each submission type; the yellow number depicts the number of full submission appeals received (regular submissions only); black numbers within each bar indicate the number of rejected submissions for each submission type (includes rejection decisions before and after review for regular submissions).
Gender and career stage
As we did in the previous blogpost, we can take a closer look at the proportion of submissions that were peer reviewed by gender of the last author. Figure 4A shows that 78.2% of reviewed submissions in the regular process had a male last author and 21.8% had a female last author. In the trial process, 78.6% of papers had a male last author and 21.4% had a female last author. For papers in the regular process, Figure 4B shows the proportion with male last authors that were invited for revisions (“revise rate”) was 53.2% (67/126), compared with 74.3% for female last authors (26/35), although it is important to be aware of the small sample size for papers with a female last author in the regular review process. Figure 4B also shows the decision outcomes (for both the initial and full submission stages) by gender of the last author for papers in the trial process.

Figure 4. (A) Percentage of peer-reviewed submissions in the regular and trial processes by gender of the last author. (B) Decision outcomes for all submissions by gender of the last author. The numbers within the bars indicate the number of decisions within that category. Note, for male authors in the regular process, one paper was accepted after peer review (without asking for revisions), and one paper was withdrawn.
Figure 5A shows the proportion of early-, mid- and late-career last authors within the review process, as well as submissions that are missing data about the career stage of the last author. There are similar proportions of mid- and late-career submissions in the regular and trial processes, but there is a higher proportion of early-career submissions in the trial process (24.3%) compared with the regular process (13.5%). This is the result of a higher proportion of early-career authors opting into the trial process (see Figure 5A in Peer review: First results from a trial at eLife). Figure 5B shows the decision outcomes by career stage, including decisions at the initial submission stage. Early-career researchers appear to do less well than late-career researchers (in both processes) as a result of the initial decision outcomes, but the revise rate in the regular process is highest for papers with early-career last authors (Table 1), although the numbers of manuscripts involved is again relatively small. In the next blogpost, we will consider the overall acceptance rates for the regular and trial processes by career stage.
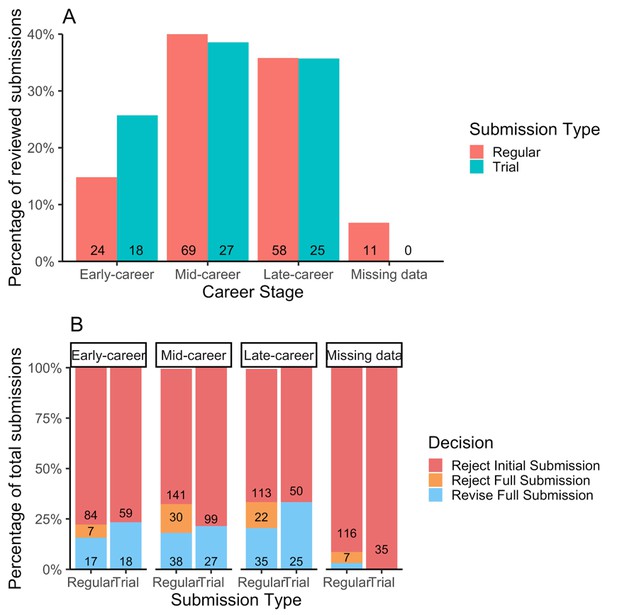
Figure 5. (A) The proportion of peer-reviewed submissions by career stage of the last author. (B) Decision outcomes for all submissions by career stage of the last author. As in the original blogpost, we are describing an early-career submission as one where the last author had been independent for five years or less, a mid-career submission as one where the last author had been independent for six–15 years, and a late-career submission as one where the last author had been independent for more than 15 years. Note, in the regular process, one paper with a late-career last author was accepted after peer review (without asking for revisions), one paper with a mid-career stage last author was withdrawn and four papers that were missing career stage data received a “Revise Full Submission” decision.
| Submission type | Career stage | Encouragement rate (%) | Revise rate (%) |
|---|---|---|---|
| Regular | Early | 22.2 | 70.8 |
| " | Mid | 32.9 | 55.1 |
| " | Late | 33.9 | 60.3 |
| " | Missing data | 8.7 | 36.4 |
| Trial | Early | 23.4 | 100 |
| " | Mid | 21.4 | 100 |
| " | Late | 33.3 | 100 |
| " | Missing data | 0 | N/A |
Table 1. A comparison of the percentage of papers encouraged for full review (encouragement rate) and percentage of reviewed papers receiving a revise decision (revise rate) for the regular and trial processes for each career stage. Note, in the regular process, one paper with a late-career-stage last author was accepted after peer review (without asking for revisions), and one paper with a mid-career-stage last author was withdrawn.
Time to decision after review
In the previous blogpost, we reported that the median time to first decision for trial submissions was six days (IQR = 3–12 days) and four days (IQR = 2–8 days) for regular submissions. The median time to decision after peer review (that is, the time between full submission and a decision being sent to the author) was also slightly longer in the trial process. Figure 6 shows that the median time to the decision after peer review was 42 days (IQR = 30–53 days) in the trial process, compared with 39 days (IQR = 29–48 days) in the regular process. However, if we focus on revise decisions only, the median time to a revise decision in the regular process was 41 days (IQR = 31–51 days). The review process took longer than usual (see Journal Metrics) in both processes, possibly because the review process was started in July and August for many submissions. The trial process was also less familiar to editors, which could have affected the review times.
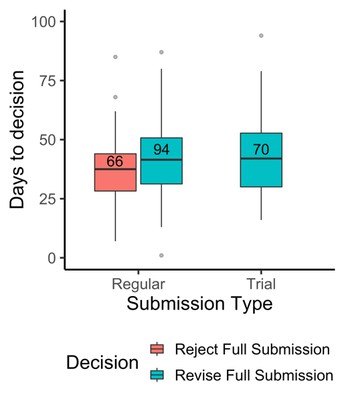
Figure 6. Decision times after peer review for submissions in the regular and trial review processes. Single data points representing the paper accepted after the first round of peer review and the paper withdrawn from the regular process have been excluded from this analysis. Numbers within the bars indicate the number of decisions.
Other characteristics of the review process
In addition to the decision outcomes and times to decision before and after peer review, we were interested to learn whether there were any other consequences of the trial process on important elements of the review process. In terms of the likelihood that an invited reviewer would agree and then submit a review, this was 46.2% in the regular process (47.9% for rejected papers and 45% for papers with revise decisions) and 44.9% in the trial process. We see a bigger difference in terms of the likelihood that reviewers were willing to share their names with the authors: in the regular process, this was 36.8% compared with 42.3% in the trial process. However, this difference is reduced when we consider the decision outcome: in the regular process, 39.8% of reviewers shared their name with the authors for revise decisions, which is close to what we observed in the trial process, whereas only 32.8% of reviewers revealed their name to the authors for papers that were rejected after review in the regular process.
Table 2 summarises results showing only small differences in terms of the number of reviewers contacted per paper, the number of reviews submitted per paper, the number of reviewers named per paper, and the average number of reviewer consultation comments.
| Submission type | Decision type | Reviewers contacted per paper | Reviews submitted per paper | Reviewers named per paper | Reviewer consultation comments per paper |
|---|---|---|---|---|---|
| Regular | Reject full submission | 6.08 (2.96) | 2.91 (0.38) | 0.95 (0.83) | 6.23 (4.20) |
| " | Revise full submission | 6.12 (3.00) | 2.76 (0.54) | 1.10 (0.87) | 6.34 (4.73) |
| " | Reject and revise decisions combined | 6.10 (2.97) | 2.82 (0.49) | 1.04 (0.85) | 6.29 (4.50) |
| Trial | Revise full submission | 6.24 (3.21) | 2.80 (0.47) | 1.19 (0.98) | 5.9 (5.55) |
Table 2. Summary information about reviewers for the regular and trial review processes, by decision. Table shows mean (and standard deviation).
Summary
We have now reported results from the initial decision before peer review and, in this blogpost, the outcomes of the review process. There are indications that the regular review process results in a lower proportion of appeals than the trial process, in which authors know that if they can pass the initial evaluation, they can then control the decision to publish. The median times to decision after review took slightly longer in the trial process, but there are elements of the review process (such as the number of reviewers who were contacted, who agreed, and who shared their names with the authors) for which there was very little difference between the two processes.
In our analysis of the outcomes after peer review in the regular process, we see evidence of increased revise rates for manuscripts with female last authors (relative to those with male last authors). However, this contrasts with the findings of Murray et al. (bioRxiv), which were based on a much larger study and found a small decrease in revise rates after peer review for articles with female last authors. When we look at the career stage of the last authors, we find evidence of increased revise rates for manuscripts with early-career researchers as the final author, relative to those of mid- and late-career stage authors. Again, we should be cautious because the numbers of manuscripts are relatively small, but this observation might indicate that the reduced encouragement rate of early-career authors at the initial decision stage (for trial and regular submissions) is to some extent counteracted at the peer-review stage when a more in-depth assessment of the article is conducted.
Regardless of the apparent increased success of early-career authors during peer review, several initiatives are being planned to respond to the decreased encouragement rate of early-career authors at the initial decision stage. For example, we will be recruiting more early- and mid-career researchers onto the Board of Reviewing Editors. We would also like to begin asking authors for information about the career stage of the last author during submission so we can monitor decision outcomes over a longer period of time. Finally, we are exploring the feasibility of a trial in which author names are not made available to the editors during the initial evaluation process.
In a subsequent blogpost, we will report on the proportion of trial papers that are published, the proportion of trial papers that address all the concerns of the reviewers, and the proportion of published papers in the trial that end up with minor or major concerns unresolved. We will also explore the time to acceptance overall, comment on next steps, and discuss areas in which we would like to experiment further.
#
Questions and comments are welcome. Please annotate publicly on the article or contact us at hello [at] elifesciences [dot] org.
For the latest updates on editorial policy and other news from eLife, sign up to receive our bi-monthly newsletter. You can also follow @eLife on Twitter.


