By Alessio Caciagli
Peer review is integral to the publication process of scholarly articles, and performs a vital quality control function over the work undertaken by the article’s authors. This is a crucial step given the far-reaching implications for society that scientific discoveries often have. Albeit necessary, the peer-review process is far from perfect and suffers quite some criticism within the scientific community.
In an effort to address some of this criticism, eLife operates a more transparent form of peer review in which the assessments are published together with the work. This practice has met generally positive feedback from authors and reviewers alike.
In their current state, however, published peer reviews are in essence a page-long technical report for the benefit of the paper’s authors. While they could also be used to highlight relevant content to interested researchers, or to provide indicators about the value of work that could be useful for hiring and funding decisions, published reviews are often not easy to “digest” without a thorough understanding of the original paper. How can we then distill the key information from peer-review reports and maximise their value to the scientific community?
We would like to find a way to effectively summarise peer reviews in order to make them more accessible to the wider community and have a positive impact on research culture. Considering the volume of peer reviews, we would like to make use of machine learning algorithms to automate this task. But in order to summarise a peer review, we first have to understand its key components, and break them down in a digestible form. But just what are the fundamental components of peer reviews? Are there any, for a start? If yes, can we use natural language processing (NLP) to tease them out? That’s what the PeerTax experiment aimed to find out.
Setting the scene
What are the fundamental components of peer reviews? Are there any, for a start?
The following is going to get a bit technical, but should be of interest to anyone with a passing affinity to NLP and related techniques. For those who would like to skip to the results of the experiment, I recommend jumping to the Conclusions section.
To begin, I decided to apply a machine learning method known as “topic analysis”, which aims to automatically extract meaning from texts by identifying recurrent themes or topics. To be more specific, I employed Latent Dirichlet Allocation (LDA) [1], which is known to be amongst the best performing topic analysis methods and to provide interpretable topics. I used the implementation offered by the Gensim package [2].
While the method is particularly suitable for the problem at hand, it suffers from a common problem in data science: you need lots of data! The dataset at my disposal contained approximately 35,000 peer reviews from eLife’s launch in 2012 to the present day. Although it may seem like a large number (and, if you think about a single person having to read all these reviews, it definitely is), it is barely enough for topic analysis to shine.
We decided to include all the peer reviews in the dataset, not differentiating between initial decisions and reviews on submissions after revision (which roughly amount to 20% of the total number of reviews). While considering only the former would be preferable, we reasoned that the average length of peer reviews after revision is much shorter. As such, they have less impact on the analysis than initial decisions. Furthermore, they may provide valuable comments (for example, on the impact or novelty of the work) which are likely to be important for the analysis at hand.
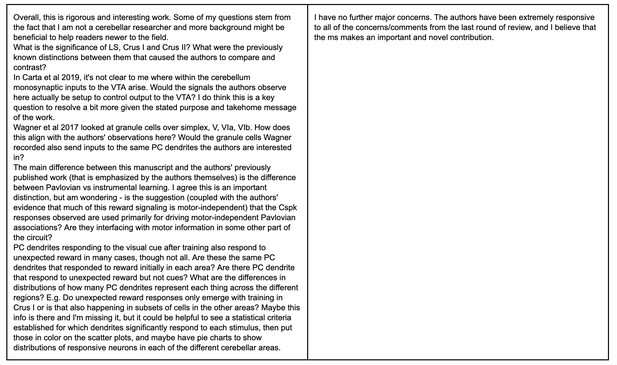
Left: example of an initial submission review. Right: example of a review after revision. The review after revision is clearly shorter and does not impact the analysis as much as the initial submission one, while containing valuable information for the model.
Unfortunately, the problem is far from solved. A preliminary analysis of the peer reviews revealed that themes we may consider meaningful (such as comments on impact/novelty or mentions of issues/concerns) are often overshadowed by the sheer technical content of the review. A naive LDA run on the texts found some “clusters”, but these clusters ultimately reflect the particular subject of the paper (such as neuroscience or biochemistry) and say very little of what we are ultimately interested in. Hence, they are essentially “noise” for our analysis.
The curse of noise
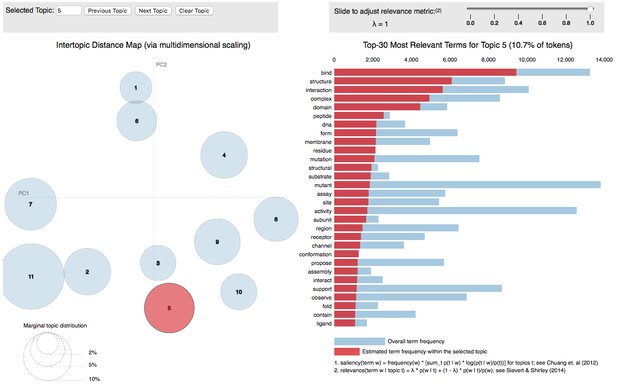
LDA topic analysis of peer reviews (graphical representation via the pyLDAvis Python library [3]). The analysis revealed the presence of 11 latent topics. Unfortunately, most of the topics identified (e.g. Topic 5 in the Figure) are subject-specific and hence constitute noise for our analysis.
LDA, like all topic analysis methods, depends on the choice of your text “unit”, i.e. what the algorithm counts as a single piece of text. This can be a mere sentence, a document section or even an entire book. But what is the best text unit for our problem?
If we were interested in grouping peer reviews by paper’s topic, a text unit would of course be the entire peer review. However, since we would like to find the themes inside a peer review, we figured that the text unit of choice should be a subsection, such as a paragraph or a sentence. By experimenting with both choices, we decided to use sentences as our text units. This resulted in a dramatic increase in our sample size (from 35,000 peer reviews to 700,000 sentences) and hence a corresponding increase in the performance of LDA. In addition, sentences which contain a large percentage of subject-specific words are now clustered in specific groups, allowing more nuanced groups (such as sentences concerning non-textual elements like figures or tables) to emerge.
An iterative, human-supervised process
This is a good step forward, but a major problem remains: groups with subject-specific sentences are still the vast majority. The best course of action is to filter them out. This is now possible because we have managed to distinguish the “noisy” content in the previous step.
The filtering is essentially done manually in an iterative manner:
- Run LDA on the collection of sentences
- Identify the relevant clusters and label the sentences accordingly
- Analyse which keywords best define each cluster, thus giving each cluster a “context”
- If the context is subject-specific (such as gene-regulation or protein-folding), discard all the sentences in that cluster
- Repeat steps 1–4 with the filtered sentences
The process is continued until no subject-specific groups are left. In our case, we needed to repeat it five times. The process resulted in a much smaller dataset: we are left with around 250,000 sentences in the last iteration. However, these sentences now carry a specific taxonomy from which we can learn.
The filtering is still a manual process, but it could be possible to automate the recognition of the subject-specific groups by constructing subject vocabularies, which can then be associated with the groups in a 1:1 relationship.
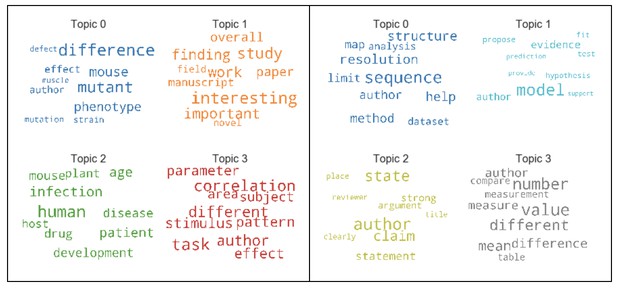
Left: keywords of sample topics from Iteration 1 in the filtering process. All the original sentences are considered. Many of the topics are still “noisy”: keywords are still subject-specific. Right: keywords of sample topics from Iteration 2 in the filtering process. Only sentences filtered from Iteration 1 are considered. The topics look much clearer now, with a lot less subject-specific keywords.
The final clustering
At this point, we are almost done. We managed to filter the noise and only retain meaningful sentences. Furthermore, LDA has identified and clustered the sentences into appropriate groups. In particular, LDA outputs the probability that a certain sentence falls into one of these groups. By analysing the keywords that define each group, we can understand the “context”. This answers exactly our initial question because it effectively finds the main “components” of a peer review. Why are we then only almost done?
The “context” of some of the final groups from LDA is not easy to interpret, since they look very similar to the human eye but are considered different by the algorithm.
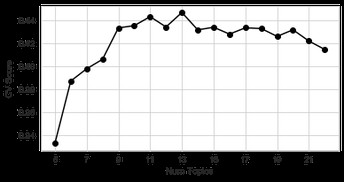
Plot of the convergence curve for the number of topics in the final iteration of LDA. The chosen metric is the “Coherence Value” (CV) score [4], which quantifies the coherence of the various topics by measuring keyword co-occurrences. The optimal number of topics is chosen as the maximum of the CV score, which is 13 in the plot. While this is optimal in a numerical sense, it might not be optimal for human understanding of the topics
One of LDA’s input parameters is the number of clusters you are expecting. By running LDA with different inputs, it is possible to construct a convergence curve to identify the “optimal” number of clusters. And here lies the problem: this number is “optimal” for LDA, but it might not be optimal for a human.
In particular, the “context” of some of the final groups from LDA is not easy to interpret, since they look very similar to the human eye but are considered different by the algorithm.
The final step is to apply another clustering technique on the LDA output to find out how many clusters the data naturally falls into. In particular, I used an algorithm called Hierarchical Density-Based Spatial Clustering of Applications with Noise (HDBSCAN) [5]. This algorithm groups sentences by finding which of their probability vectors are densely packed, and separates clusters if there is an area of low density between them. This allows us to overcome the interpretation problem: since the sentences in the difficult LDA groups share similar probability vectors, three or four groups can be recognised as one big single cluster by HDBSCAN.
HDBSCAN successfully identified eight clusters, which are reduced to six after human examination. Accordingly, sentences in peer review can be categorised into:
- Figures/Non-textual content
- Stats/Analysis/Techniques
- Impact/Novelty
- Text/Exposition clarity
- Previous literature
- Main discussion
This finally allows us to answer the initial question, and this time we really are done. These six categories are the common themes reviewers discuss during their assessments: the main “components” of a peer review.
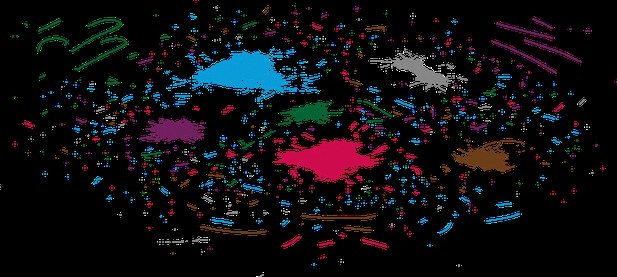
Final clustering step using HDBSCAN [5]. The six clusters are labelled with different colours. Some of the custers present sub-clusters (as in the case of the cyan, pink and grey clusters). These are the residuals of the initial 13 clusters from the final iteration of LDA, which HDBSCAN was able to further group into macro-clusters.
Testing the model
How can we be sure the model is correct? In practice, how can we test the categories found by the model?
To test the robustness of the model, we can use new data that it has never seen before [6]. This new test set needs to be labelled, as the labels serve as the ground truth upon which the model’s performance is assessed. In our specific case, the labelling is performed by human respondents.
We have tested our model on the peer-review corpus of Wellcome Open Research, an open-access publishing platform. The corpus consists of around 1,000 peer reviews in the field of life sciences. Manual labelling is performed on 200 sentences randomly sampled from the corpus. If a sentence cannot be classified into one of the six categories outlined above, it is assigned to an additional group, “0”. Each sentence is labelled by two respondents, in order to assess human misclassification. This amounts to two human-labelled sets and one model-labelled set.
| Topic | Misclassified (percentage) |
|---|---|
| 1: Figures/Non-textual content | 19% |
| 2: Stats/Analysis/Techniques | 30% |
| 3: Impact/Novelty | 38% |
| 4: Text/Exposition clarity | 32% |
| 5: Previous literature | 31% |
| 6: Main discussion | 35% |
The above table shows the percentage of sentences to which the two human respondents assigned different topics. The total number of sentences per topic is calculated as the number of sentences that at least one respondent assigned to that particular topic.
Human labelling proved quite challenging. Besides Topic 1 (Figures/Non-textual content), the two labelled set differ more than 30% for all the other Topics. Topic 3 (Impact/Novelty) and Topic 6 (Main discussion) have the highest misclassification percentages (38% and 35% respectively). We stress that neither label is wrong: it simply proved difficult for the respondents to assign a unique category. A necessary future step is to better define the scope and definition of the categories in order to reduce the misclassification percentage.
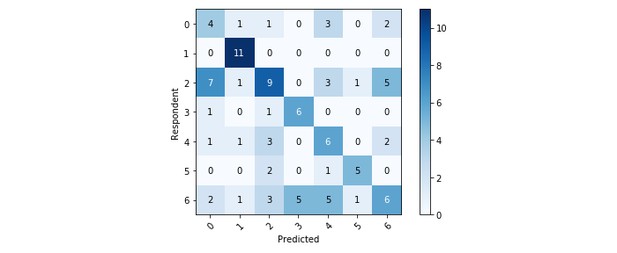
The accuracy of our model is first estimated on sentences that have received the same label by both respondents and thus constitute a more robust testing set (100 sentences). Performance is estimated by three common metrics in classification: precision, recall and F1-score [7]. Precision measures the ratio of correctly predicted positive observations to the total predicted positive observations for a certain class. Recall measures the ratio of correctly predicted positive observations to all observations in actual class. F1-score is the weighted average of precision and recall. While all three are insightful, the relative importance of a metric depends on the task at hand (in our case, recall is perhaps the most important).
The model shows a remarkably different performance on the various topics. Topic 1 (Figures/Non-textual content) has the highest scores on both recall and F1-score, while Topic 6 (Main discussion) has the lowest scores overall. This is expected on the basis of the human misclassification percentages outlined earlier. Topic 2 (Stats/Analysis/Techniques) and 4 (Text/Exposition clarity) also have low scores; Topic 3 (Impact/Novelty), on the other hand, is relatively well-classified by the model despite having a high misclassification percentage. In general the model accuracy, measured as the ratio of correctly predicted observations to the total observations, is low (47%): this is mostly due to the incorrect classification of Topics 2 and 6 as well as Label “0” (no group). This highlights the need to better address these categories.
| Precision | Recall | F1-score | |
|---|---|---|---|
| 0: No group | 0.27 | 0.36 | 0.31 |
| 1: Figures | 0.73 | 1.00 | 0.85 |
| 2: Methods | 0.47 | 0.35 | 0.40 |
| 3: Impact | 0.55 | 0.75 | 0.63 |
| 4: Clarity | 0.33 | 0.46 | 0.39 |
| 5: Literature | 0.71 | 0.62 | 0.67 |
| 6: Discussion | 0.40 | 0.26 | 0.32 |
| Accuracy | 0.47 | ||
| Macro-average | 0.50 | 0.54 | 0.51 |
| Weighted Average | 0.47 | 0.47 | 0.46 |
The above table shows the model performance on sentences equally labelled by both human respondents. Topic 1 has the highest partial performance while Topic 6 has the lowest. Overall accuracy is 47%.
Final clustering step using HDBSCAN [5]. The six clusters are labelled with different colours. Some of the custers present sub-clusters (as in the case of the cyan, pink and grey clusters). These are the residuals of the initial 13 clusters from the final iteration of LDA, which HDBSCAN was able to further group into macro-clusters.
Conclusions
The results presented are the outcome of a short data-science project aimed at discovering the main “component” of a peer review. We started with very few clues and a bunch of texts (a pretty bad starting point!) and ended up finding six categories into which sentences in peer reviews can be classified. On top of that, we cooked up a first model that classifies peer-review sentences into these categories. The overall model’s performance on a new corpus (the Wellcome Open Research peer reviews) is not exalting, but the model actually works quite well for some of the categories.
The inclusion of open-access peer reviews from other sources into the training process will most likely provide the first improvement at virtually no cost.
I personally think it has been a good first experiment. The problem of finding a certain “order” in peer reviews has in fact been tackled successfully and the latent topics found by the model are plausible and easily interpretable from a human perspective, which is a major result. The classification problem is not completely solved and the model needs some major improvements to be able to satisfactorily tackle the task, but it also sets a solid foundation to work on. Firstly, the model is probably too geared on the eLife peer-review corpus it has been trained on (also known as “overfitting”). The inclusion of open-access peer reviews from other sources into the training process will most likely provide the first improvement at virtually no cost. Secondly, as shown by the conflicting labels given by human respondents on the same sentences, some of the categories need to be reworked. The task requires a better domain knowledge than the one I might have, but it should provide a second major improvement. Lastly, the model should be evaluated for what it represents: a first dive into the ambitious task of classifying peer reviews. This first attempt gave us the definition of the cardinal points (the categories) together with some precious labels obtained with minimal human-associated effort. We can add more human-labelled sentences to the model-labelled ones and, more importantly, we could now make use of supervised classification methods since we have a labelled dataset. In my view, this constitutes the second step in tackling the task at hand, one that can go a long way into delivering a robust peer-review summarisation and classification model. Of course this would not be possible without the first step, which I have shown you in this blog post. And, as they say, the first step is half the journey!
The code for PeerTax is available at https://github.com/elifesciences/data-science-peertax.
References
[1] Blei, David M., Andrew Y. Ng, and Michael I. Jordan. "Latent dirichlet allocation." Journal of machine Learning research 3.Jan (2003): 993-1022.
[2] Rehurek, Radim, and Petr Sojka. "Software framework for topic modelling with large corpora." In Proceedings of the LREC 2010 Workshop on New Challenges for NLP Frameworks. 2010.
[3] Sievert, Carson, and Kenneth Shirley. "LDAvis: A method for visualizing and interpreting topics." Proceedings of the workshop on interactive language learning, visualization, and interfaces. 2014.
[4] Newman, David, et al. "Automatic evaluation of topic coherence." Human Language Technologies: The 2010 Annual Conference of the North American Chapter of the Association for Computational Linguistics. Association for Computational Linguistics, 2010.
[5] Campello, Ricardo JGB, Davoud Moulavi, and Jörg Sander. "Density-based clustering based on hierarchical density estimates." Pacific-Asia conference on knowledge discovery and data mining. Springer, Berlin, Heidelberg, 2013.
[6] Provost, Foster, and R. Kohavi. "Glossary of terms." Journal of Machine Learning 30.2-3 (1998): 271-274.
[7] Sokolova, Marina, and Guy Lapalme. "A systematic analysis of performance measures for classification tasks." Information processing & management 45.4 (2009): 427-437.
#
We welcome comments, questions and feedback. Please annotate publicly on the article or contact us at innovation [at] elifesciences [dot] org.
Do you have an idea or innovation to share? Send a short outline for a Labs blogpost to innovation [at] elifesciences [dot] org.
For the latest in innovation, eLife Labs and new open-source tools, sign up for our technology and innovation newsletter. You can also follow @eLifeInnovation on Twitter.


