By Shyam Saladi, California Institute of Technology, and eLife Early-Career Advisory Group member
Figures are the crux of every science story.
Data, the collections of numbers and facts at the centre of most research, need to be analysed and visualised to be understood. Human beings are visual creatures: our eyes are attracted to colours, and we have evolved to easily spot trends and patterns. By turning data into graphs and charts, visualisation tools and techniques help scientists develop intuition for and draw conclusions about the system at study.
To see numerical relationships, we rely on colour maps to transform variation in numbers to variation in colours. Constructing a colour map is hard since our eyes and visual systems perform complex, non-linear operations (e.g. we are more sensitive to contrasts in the orange-red part of the light). Jet is a colour map that spans the rainbow by linearly interpolating red, green and blue. Despite its popularity, Jet introduces well-established visual artefacts and produces figures inaccessible to our colleagues with colourblindness (for an overview, see Borland & Taylor, 2007). Regardless of its obvious downsides, Jet is the most widely used colour map in the sciences.
Arising out of a friendly challenge to email every author that has published a paper with a figure using Jet, JetFighter is a proof-of-concept app to enable the community to improve visualisation.
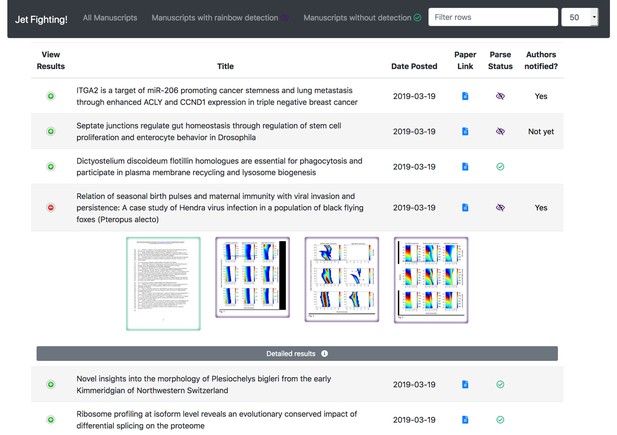
JetFighter shows the detection statuses of recent articles in a paginated table with per-page thumbnails expandable into view.
JetFighter screens each manuscript posted on bioRxiv to infer which, if any, colour maps were used in creating the image(s) on each page of the document. If a rainbow colour map is detected, potentially problematic pages of the manuscript are flagged in a message sent to the authors, suggesting improvements to their work.
Technically, new manuscripts are identified by monitoring the bioRxiv Twitter feed (tweepy; code) on a daily basis. Initially, finding a way to keep up with new preprints was a challenge: parsing the bioRxiv Twitter feed proves simpler than monitoring the bioRxiv RSS feed, as the Twitter feed has a longer accessible history and a simpler, pre-built Python interface.
After the manuscript PDF is downloaded, each page is converted into an image. This was initially done on the fly (poppler; code), but it saddled the web server with a considerable workload. Paul Shannon, eLife’s Head of Technology, suggested the International Image Interoperability Framework, which eLife uses to serve images and decouples image handling from the rest of the web application. JetFighter uses Cantaloupe, which handles PDF sources out-of-the-box and has multiple levels of caching to reduce server load.
Next, the image is read and an array of RGB values for each pixel is generated (scikit-image; code). It is transformed into a perceptually uniform colour space (colorspacious; code), and then compared in composition to a set of colour maps by generating k-d trees (matplotlib and scikit-learn; code). The per cent coverage of problematic rainbow colour maps like Jet is recorded in the database flagging certain manuscripts (code). This process takes seconds per page in a compute queue (redis, python-rq; code). Continuous integration (Travis CI: not open-source; code) helps to avoid inadvertently introducing bugs in continued development.
A web frontend shows the screening status of each manuscript (flask ecosystem, jquery, datatables) and, via an authenticated interface, allows the results of detections to be confirmed before an email is sent to the manuscript authors (template, sendgrid: not open-source). This avoids bothering authors with false positive detections and allows me to gather a feel for the types of figures being detected.
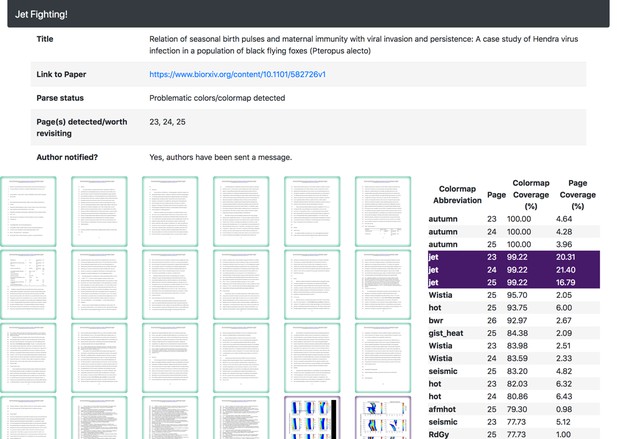
The colour maps inferred for the manuscript help highlight if/why a rainbow colour map was detected.
In retrospect, strictly false positive detections are rare (less than 1%), but some categories of images would be better served by a more customised email message. For example, fluorescence images that often use the red and green channels (of RGB images) to show opposing fluorophores (e.g. GFP and RFP) are also flagged by JetFighter. These images are inaccessible to readers with red-green colourblindness. A tailored message suggesting the best practice of magenta instead of red would be more helpful to the authors.
So far, around 15,000 manuscripts have been screened, and 1,900 manuscripts with rainbow colour maps or red-green inaccessible images were detected. In the last month alone, 142 emails have been sent out to authors concerning their colour-map usage, to positive responses.
Thank you for creating this system of automatic detection in preprints! I wasn't aware of the disadvantages of the jet colour map. I have changed my figure with the parula colour map before re-submitting the article.
– A preprint author
A call for contribution
In the short term, extending JetFighter’s capabilities to screen preprints from other platforms and to send more tailored messages would be wonderful. More broadly, I hope that others will be inspired by the concept of screening literature to help authors improve their work. Remarkably, the JetFighter experiment suggests that emails to authors don’t go ignored. Future tools can explore other feedback channels, from public communication – including posting a comment or responding to a tweet – to more refined messages and directly interfacing with manuscript-management platforms.
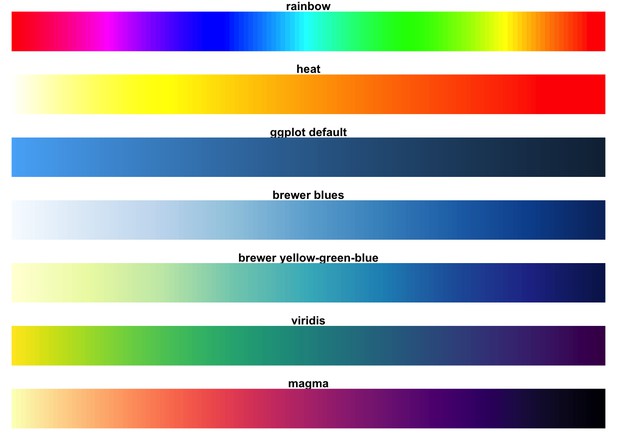
Amongst various popular colour maps, Viridis and Magma do the best at perceptual uniformity and are robust to colourblindness (image source).
With beautiful alternative colour maps like Viridis, I urge scientists to rethink the way they portray their data. Those passionate about this issue could work with experts to compose editorials to suggest changing the standard for common field-specific visualisations, such as flow cytometry scatter plots and brain imaging. Until then, JetFighter will continue to send messages and push for change.
#
We welcome comments, questions and feedback. Please annotate publicly on the article or contact us at innovation [at] elifesciences [dot] org.
Are you interested in contributing to open-source projects like JetFighter to drive forward open science? Register your interest for the eLife Innovation Sprint in September 2019.
Do you have an idea or innovation to share? Send a short outline for a Labs blogpost to innovation [at] elifesciences [dot] org.
For the latest in innovation, eLife Labs and new open-source tools, sign up for our technology and innovation newsletter. You can also follow @eLifeInnovation on Twitter.


