Motor control of Drosophila feeding behavior
- Friedrich Miescher Institute for Biomedical Research, Switzerland
- Biozentrum University of Basel, Switzerland
- Technical University Kaiserslautern, Germany
- National Centre for Biological Sciences, Tata Institute for Fundamental Research, India
Figures
Figure 1
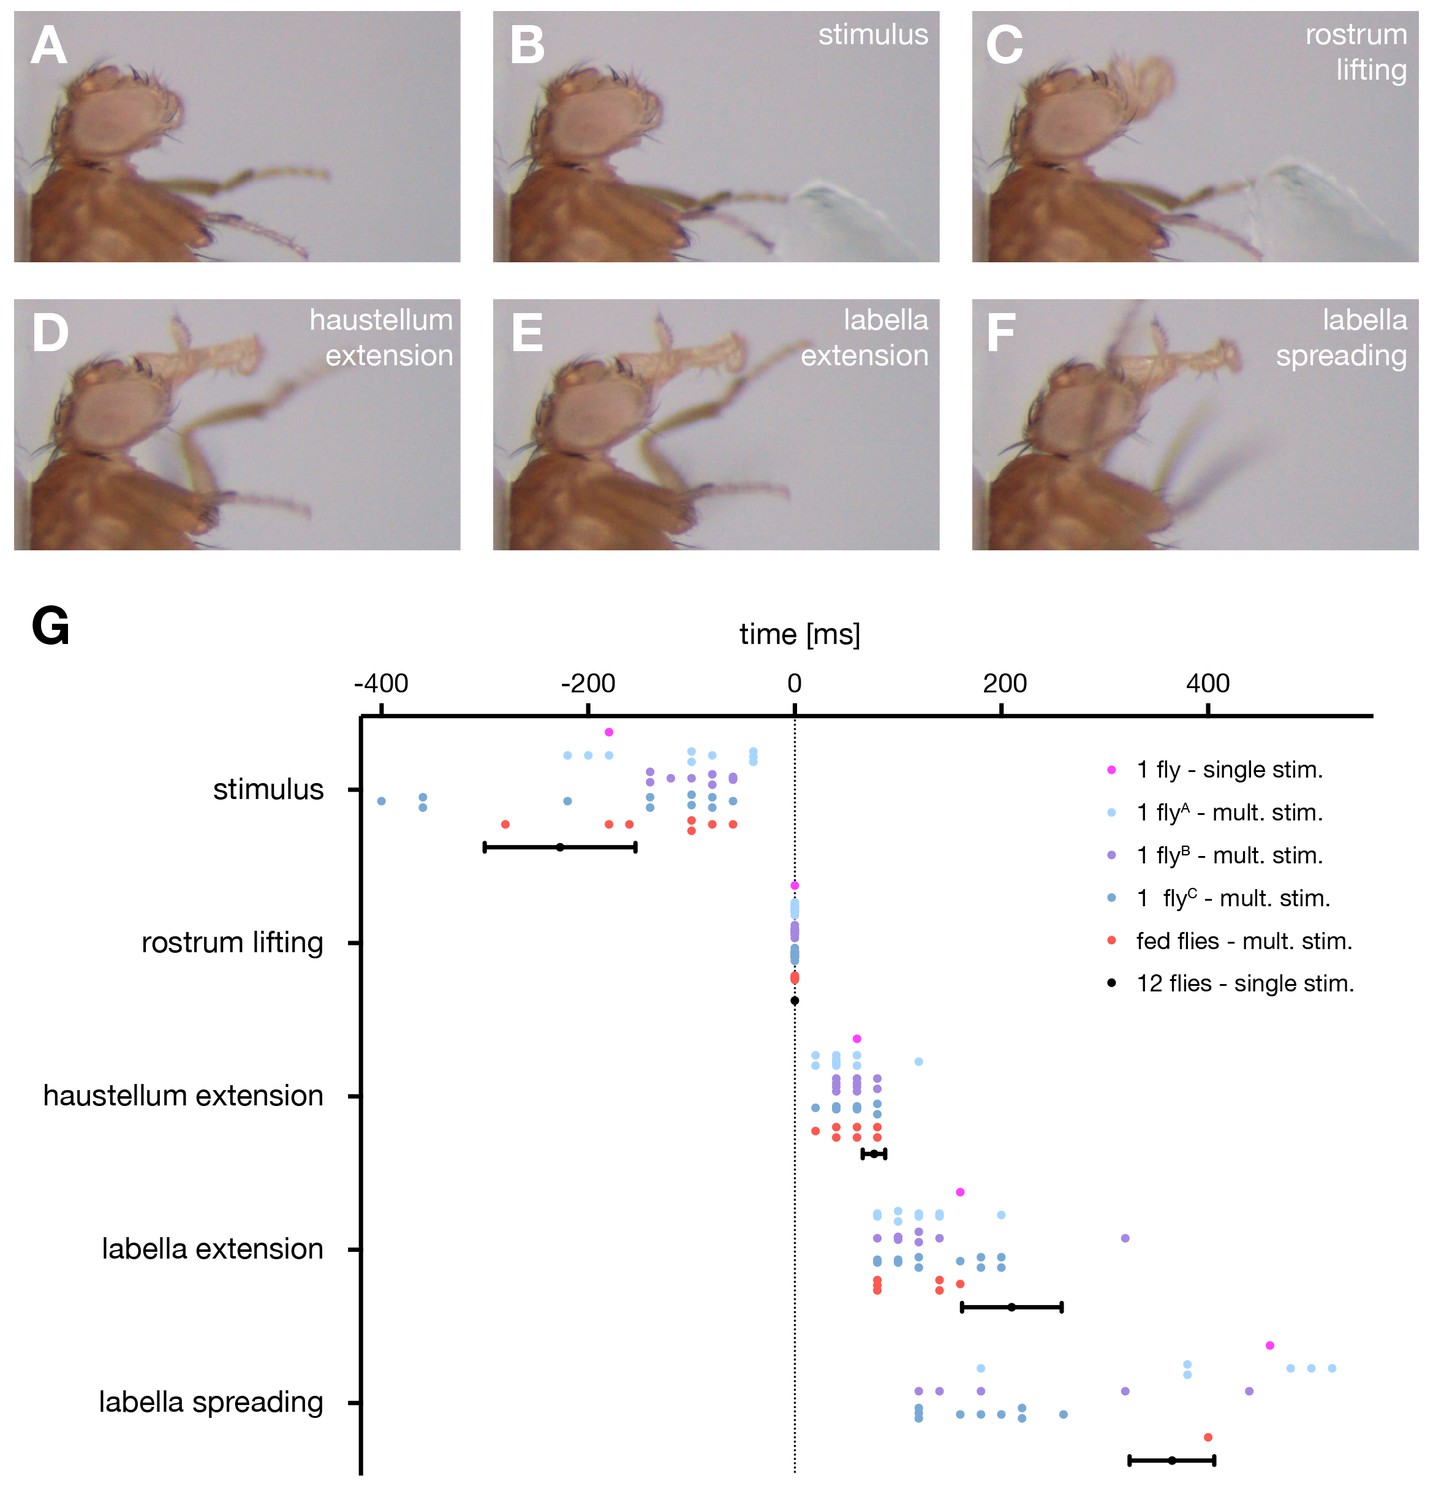
The motor sequence of the proboscis extension response.
(A–E) In response to sucrose stimulation to the leg the proboscis is extended in a stereotypic motion pattern: (A) fly before stimulus, (B) sucrose stimulation, (C) rostrum lifting, (D) haustellum extension, (E) labella extension, (F) labella spreading. (G) Temporal quantification of proboscis extensions. The initiation time point of each step was determined in the video sequence and plotted with rostrum lifting set to zero. Data are shown for: single fly (magenta), multiple stimulations of three individual flies (A n = 13, B n = 10, C n = 13 stimulations), fed flies (red, n = 4 animals, 7 stimulations), mean ± SEM of the second stimulation of 12 individual flies (black). The following data points are not displayed on the graph: FlyA, stimulus (−28), labella spreading (+35); flyB, stimulus (−31, –54); flyC: labella spreading (32, 46). Statistical comparison of flies A–C (Mann-Whitney U test) revealed small significant differences for the following data points: A vs C, labella extension – labella spreading, p=0.0006; B vs C, stimulus – rostrum lifting, p=0.0304). No significant differences were detected when comparing fed flies to individual flies or to the 12 control flies. However, these flies failed to spread the labella in response to leg stimulation but not when stimulated at the labella. See also Video 1.
Figure 2
Muscles and motoneurons of the Drosophila proboscis.
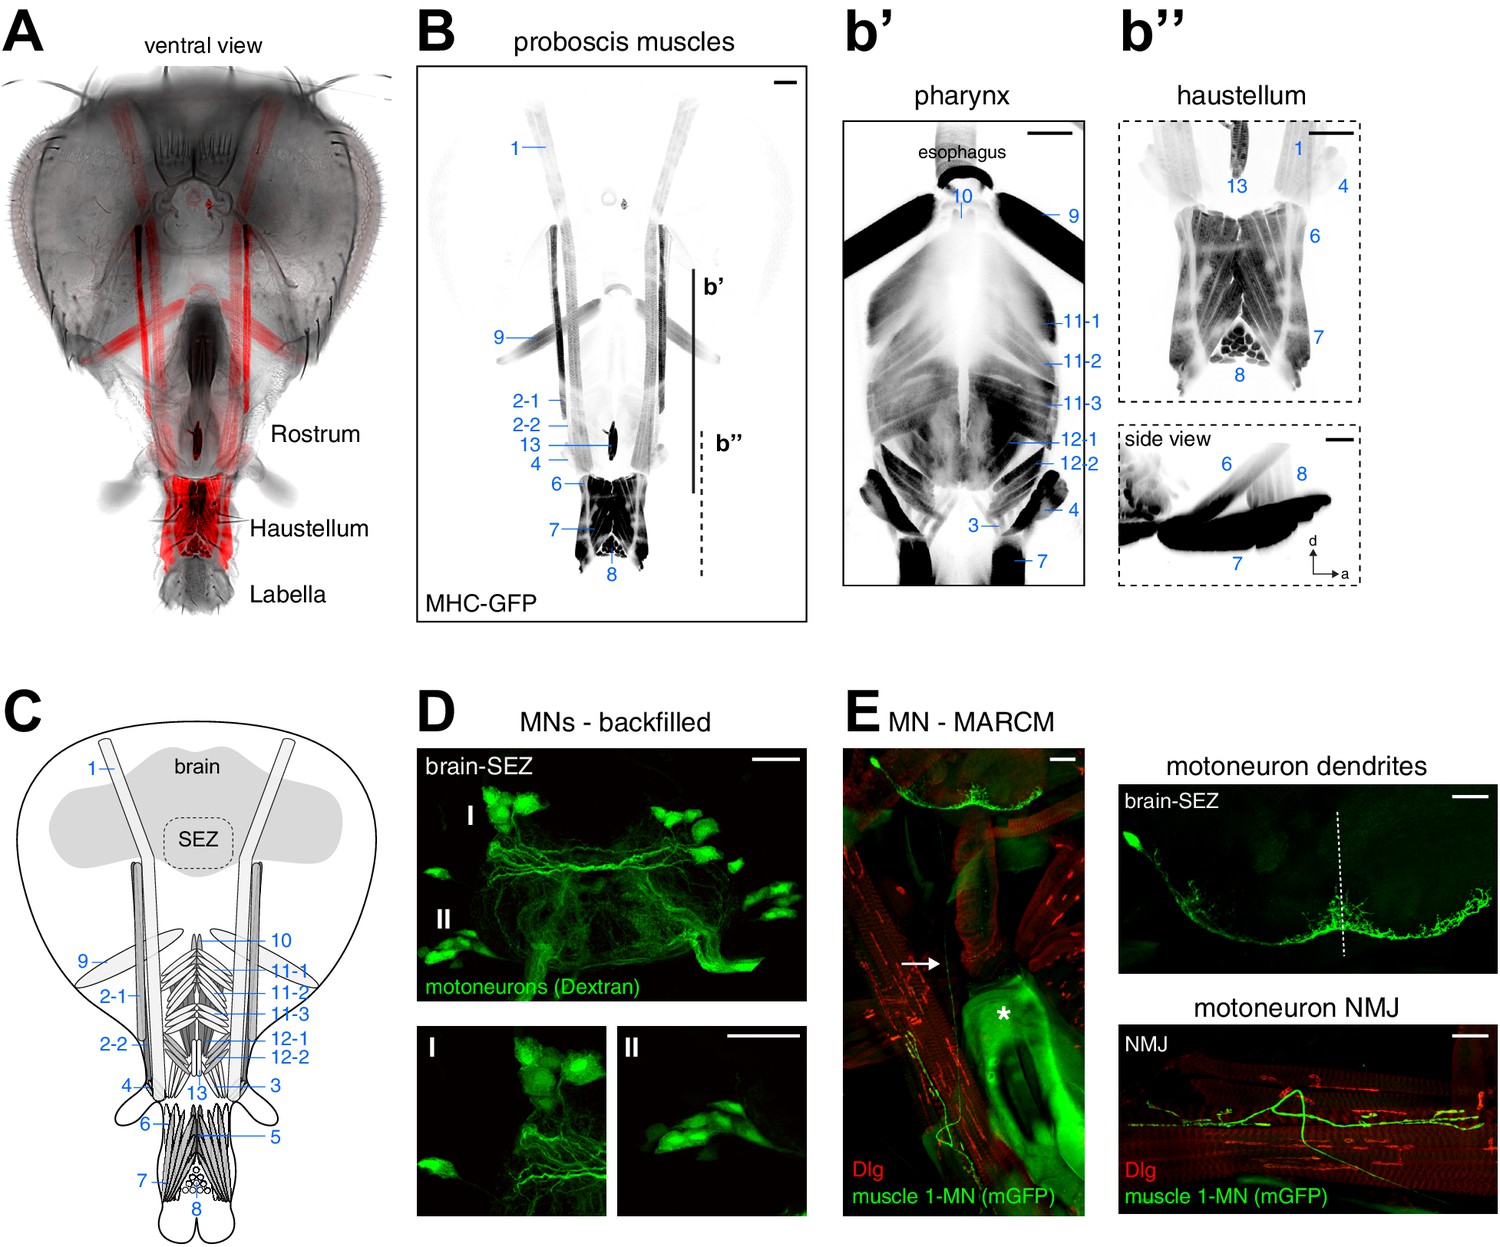
(A) Whole mount preparation of a Drosophila head. Muscle-specific expression of GFP (MHC-GFP) reveals the position of all proboscis muscles (red) in the head (bright field image). (B) Same head as in (A) with muscles displayed in black (inverted). Pharynx and haustellum muscles are shown with adjusted settings and individually in b’ and b’’. Blue numbers indicate individual muscle groups. Scale bars, 50 µm. (C) Schematic drawing of head muscles. (D) Proboscis MNs. Upper panel, backfilling of all MN axons innervating the proboscis musculature reveals MN cell bodies within the SEZ. Two clusters of MN cell bodies (DMA, dorsal medial anterior; VLP, ventral lateral posterior) are present on both sides of the midline. Lower panel, enlargements of the DMA (I) and VLP (II) clusters. Scale bars, 20 µm. (E) Single cell MARCM clone of a proboscis MN innervating muscle 1. Left, overview showing MN cell body and dendritic arborization in the brain that is connected by a single axon (arrow) to the NMJ on muscle 1. The asterisk indicates the pharyngeal plate. Right, enlargements of the SEZ (top) and NMJ (bottom). In all panels, the MN is marked by the expression of mCD8-GFP (green) and postsynaptic sites are labeled using anti-Discs large (Dlg, red). Scale bars, 20 µm.
Figure 3

Morphology of MNs contributing to proboscis motion.
Single cell MARCM clones of MNs innervating muscle 3 (A), muscle 4 (B), muscle 9 (C), muscle 6 (D), muscle 7 (E), and muscle 8 (F) are shown. For each MN type, brain localization (middle panels) and muscle innervation (lower panels) are shown. In all panels, MNs are marked by the expression of mCD8-GFP (green), the neuropil is visualized using an anti-Neurotactin antibody (Nrt, red, middle panels), and muscles are labeled using rhodamine-conjugated phalloidin (red, bottom row). A digital reconstruction of each MN is shown (top panel, dotted line indicates midline). Cell bodies are artificially colored in green and neurites in magenta. Scale bars, 20 µm.
Figure 4
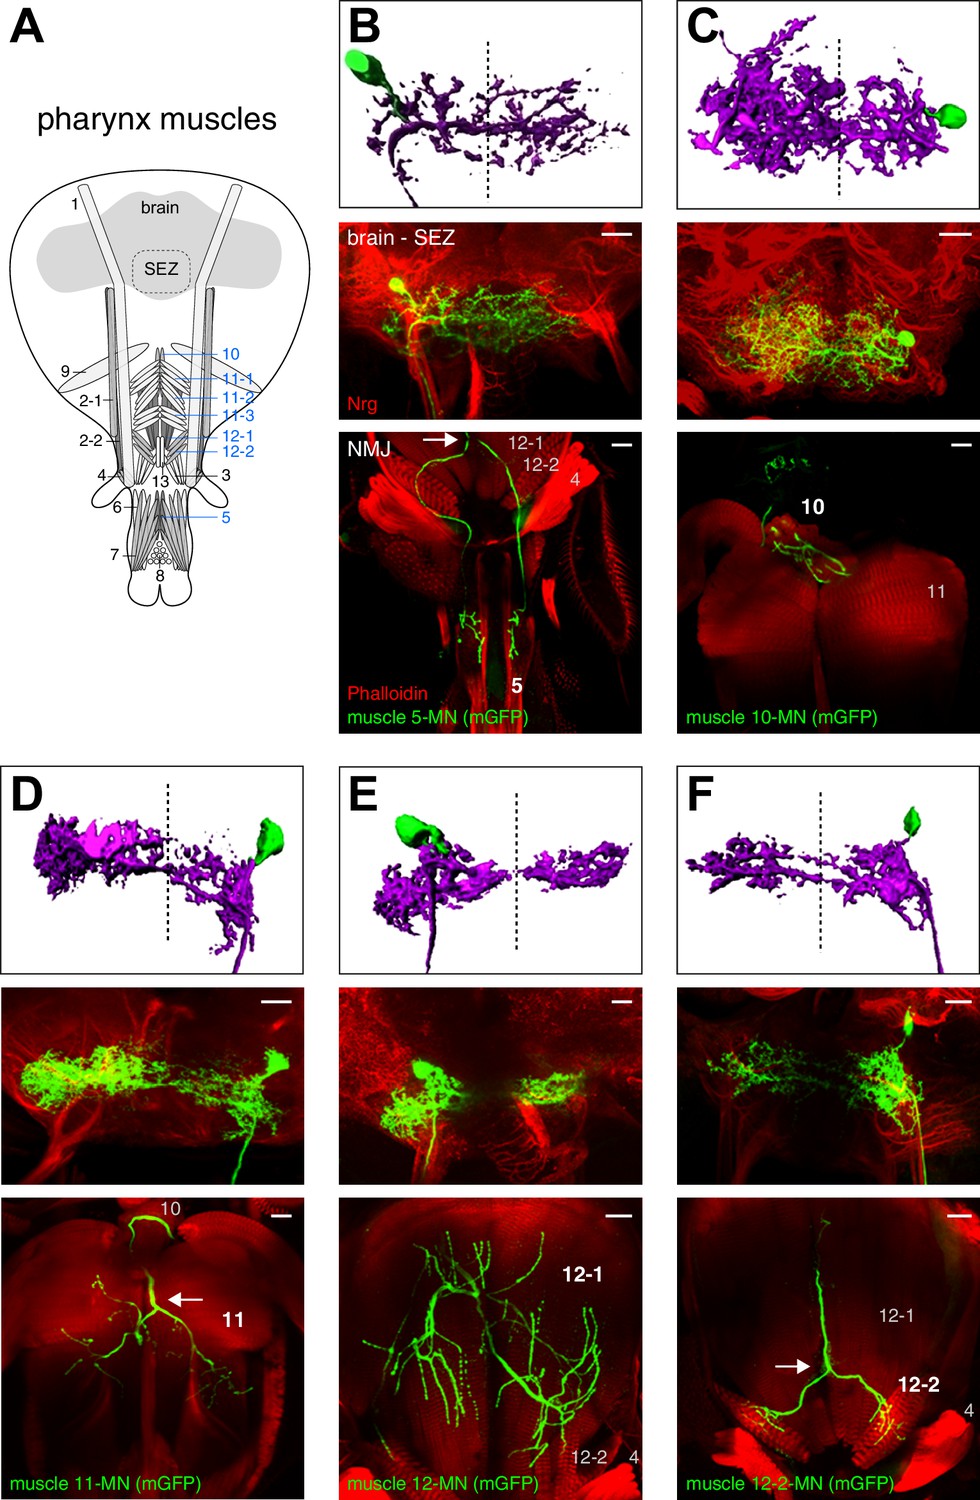
Morphology of MNs contributing to food ingestion.
(A) Schematic drawing of the muscles in the fly head. Muscles implicated in food ingestion are marked in blue. Single cell MARCM clones of MNs innervating muscle 5 (B), muscle 10 (C), muscle 11 (D), muscle 12 (E), and muscle 12–2 (F) are shown. For each MN type (B–F), brain localization (middle panels) and muscle innervation (bottom panels) are shown. In all panels, MNs are marked by the expression of mCD8-GFP (green), the neuropil is visualized using Nrt (red, middle row), and muscles are labeled using rhodamine-conjugated phalloidin (red, bottom row). A digital reconstruction of each MN is shown (top panel, dotted line indicates midline). Cell bodies are artificially colored in green and neurites in magenta. Scale bars, 20 µm.
Figure 5 with 1 supplement
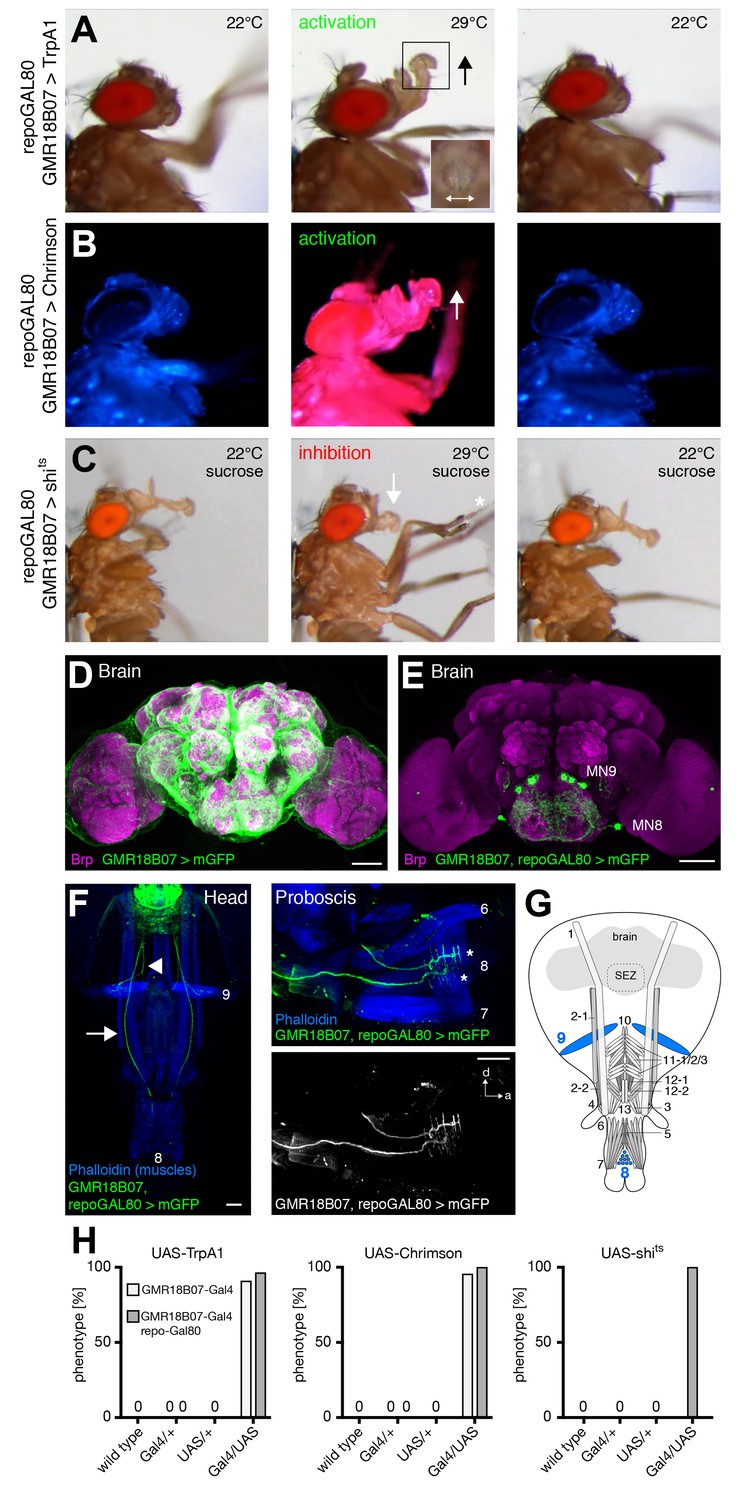
GMR18B07 neurons control rostrum lifting and labella spreading.
(A) Artificial activation of GMR18B07, repoGal80 neurons using TrpA1. Heat induced activation elicits rostrum lifting (middle panel, arrow) and labella spreading (double arrow). The inset shows a top view of the spread labella. At the control temperature before (left panel) and after (right panel) activation the proboscis is retracted. (B) Artificial activation of GMR18B07, repoGal80 neurons using Chrimson. Red light induced activation (middle panel) elicits rostrum lifting (arrow) and labella spreading. At blue light before (left panel) and after (right panel) activation the proboscis is retracted. (C) Heat induced silencing of GMR18B07, repoGal80 neurons using shibirets. Flies at the permissive temperature show full PER upon 200 mM sucrose stimulation (left and right panel). At the restrictive temperature, these flies fail to lift the rostrum (middle panel, arrow) upon 200 mM sucrose stimulation (asterisk) but still extend the haustellum. (D) Expression pattern of GMR18B07 in the adult central brain. Cells are marked by the expression of mCD8-GFP (green) and the neuropil is visualized using the presynaptic active zone marker Bruchpilot (Brp, magenta). (E) Suppression of glia cell expression using repo-Gal80 reveals four pairs of bilateral neurons in the SEZ. (F) Whole head preparation of GMR18B07, repoGal80 > mCD8-GFP animals (left panel) reveals expression in two bilateral pairs of MNs (green) with one pair innervating muscle 9 (axon marked by arrowhead) and one muscle 8 (axon marked by arrow). Side view of the proboscis (right panels) shows innervation of muscle 8 (asterisks). Muscles are marked by phalloidin (blue). (G) Schematic drawing of the head muscles with innervated muscles highlighted in blue. Scale bars, 50 µm. (H) Quantification of the behavioral phenotypes in control and experimental animals. Numbers and significances are listed in Supplementary file 1. See also Figure 5—figure supplement 1 and Videos 3, 4 and 5.
Figure 5—figure supplement 1
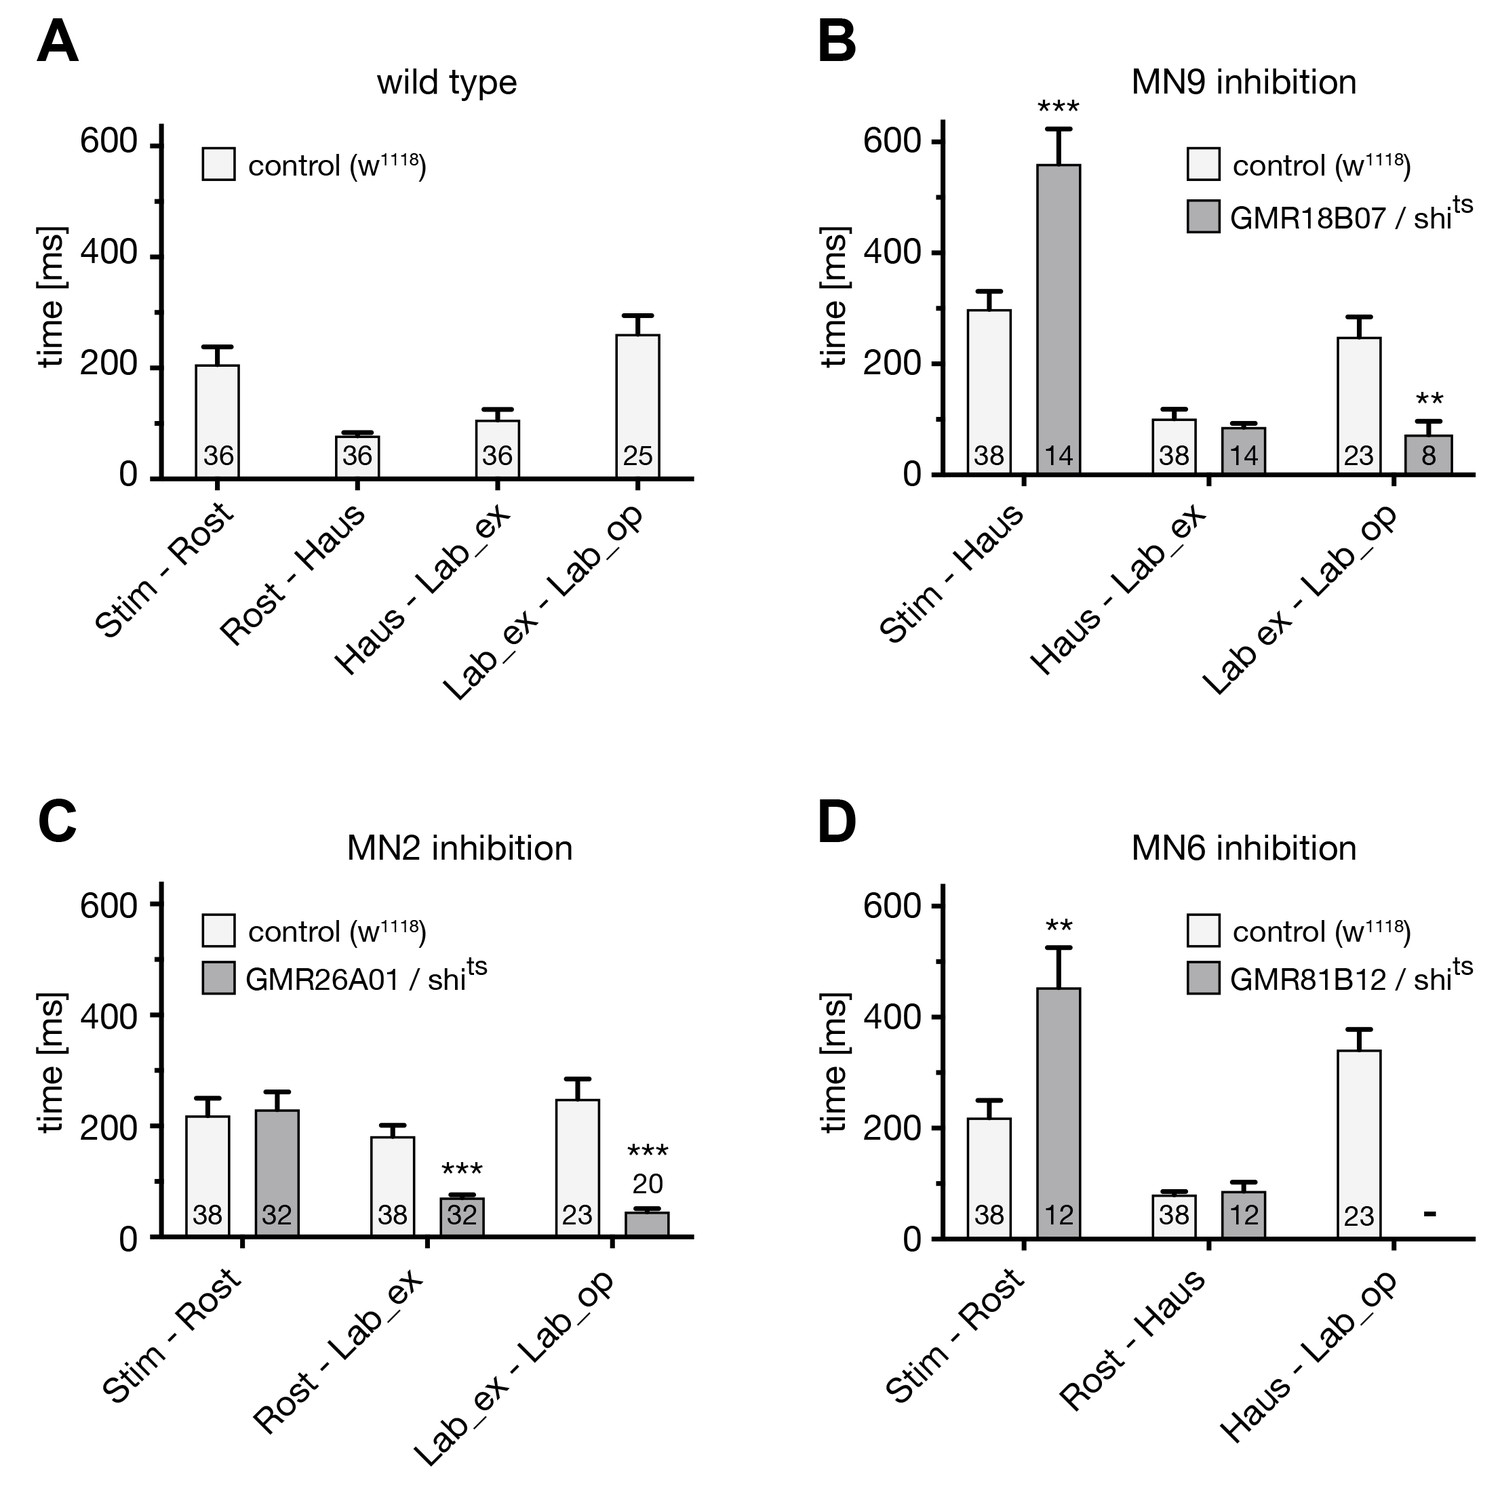
Analysis of the PER sequence during MN silencing.
(A–D) Analysis of the temporal profile of the PER sequence in (A) wildtype (w1118) flies, and in comparison to flies in which selective MNs were silenced by inducing shibirets expression and a temperature shift to 29°C. The first three proboscis extensions were used for the quantifications. (A) w1118: 36 stimulations, 12 flies; (B–D) w1118: 38 stimulations, 14 flies; (B) GMR18B07, repoGal80 > shibirets MN9: 14 stimulations, 5 flies; (C) GMR26A01 > shibirets MN2: 32 stimulations, 13 flies; GMR81B12 > shibirets MN6: 12 stimulations, 5 flies. Data are presented as mean ± SEM. For statistical analysis: See Materials and methods.
Figure 6 with 1 supplement
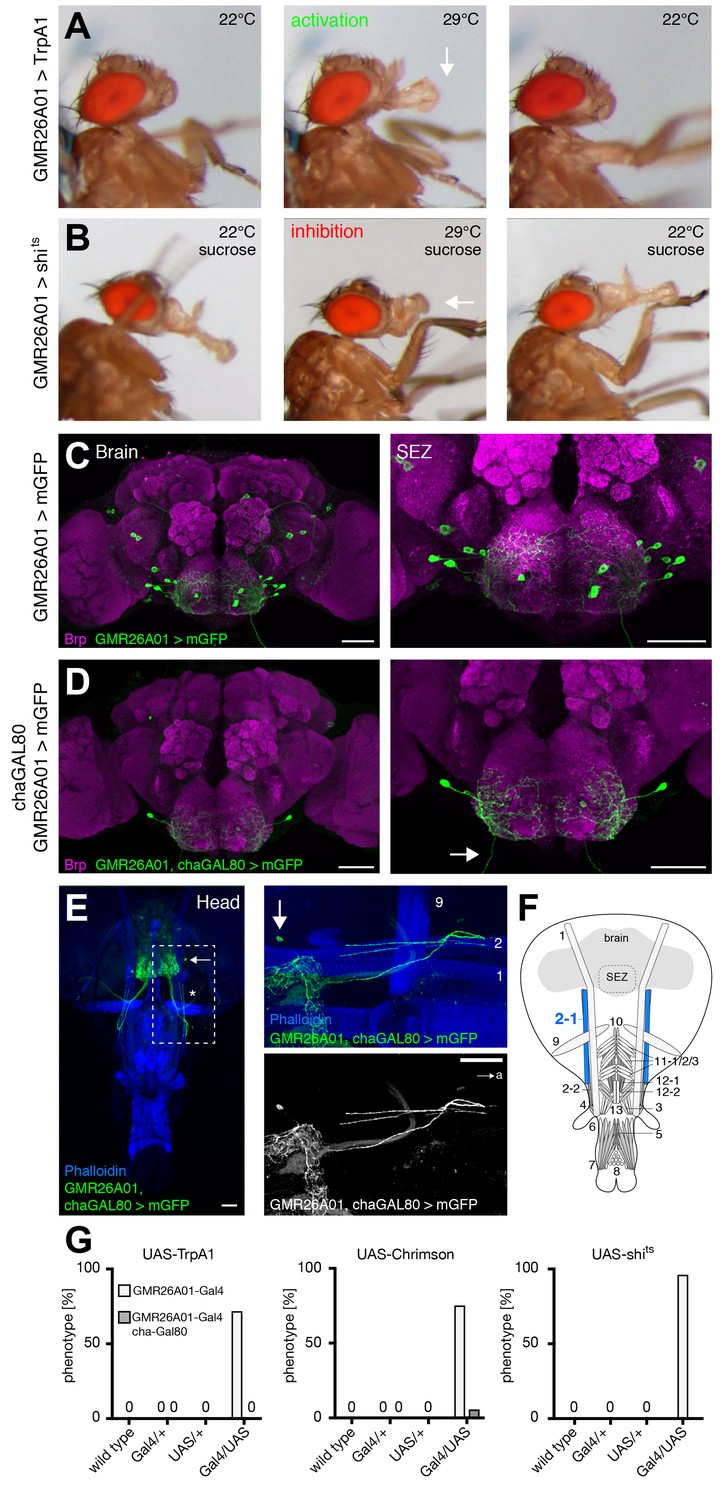
GMR26A01 neurons are sufficient and required for haustellum extension.
(A) Artificial activation of GMR26A01 neurons using TrpA1. Heat induced activation elicits haustellum extension (middle panel, arrow). At the control temperature before (left panel) and after (right panel) activation the proboscis is retracted. (B) Heat induced silencing of GMR26A01 neurons using shibirets. Flies at the permissive temperature show full PER upon 200 mM sucrose stimulation (left and right panel). At the restrictive temperature, these flies fail to extend the haustellum (middle panel, arrow). (C) Expression pattern of GMR26A01 (mCD8-GFP, green) in the adult central brain (Brp, magenta). (D) Suppression of cholinergic expression using cha-Gal80. This intersectional strategy restricts expression to a single bilateral pair of MNs (arrow points to the axon). (E) Whole head preparation of GMR26A01, chaGal80 > mCD8-GFP demonstrates innervation of muscle 2 (asterisk). The boxed region is magnified in the right panels. Muscles are visualized by the F-actin marker phalloidin (blue). (F) Schematic drawing of the head muscles with innervated muscles highlighted in blue. Scale bars, 50 µm. (G) Quantification of the behavioral phenotypes in control and experimental animals. Numbers and significances are listed in Supplementary file 1. See also Figure 5—figure supplement 1, Figure 6—figure supplement 1 and Videos 6, 7, 8, 9 and 10.
Figure 6—figure supplement 1

Unilateral proboscis MN activation induces asymmetric proboscis movement.
Artificial activation of a GMR26A01, chaGal80 > Chrimson fly using red light (633 nm) induces an asymmetric extension of the haustellum to the left side. (A) side view, (B) top view. (C) Dissection of the brain of the stimulated fly reveals Chrimson-mVenus (GFP, green) expression almost exclusively in the MN2 located on the left side of the SEZ. Brain structure visualized using Brp (magenta). See also Video 10.
Figure 7
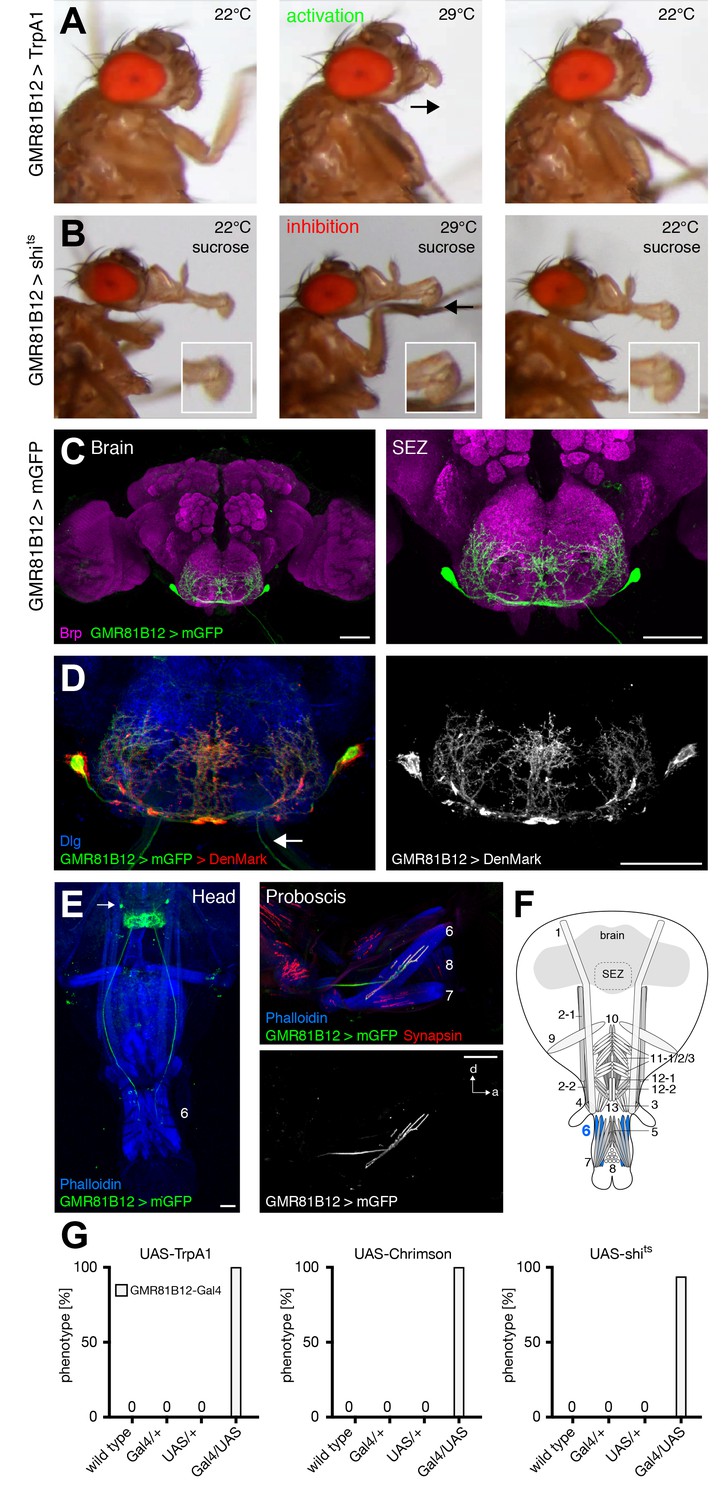
GMR81B12 neurons are sufficient and required for labella extension.
(A) Artificial activation of GMR81B12 neurons using TrpA1. Heat induced activation elicits labella extension (middle panel, arrow). At the control temperature before (left panel) and after (right panel) activation the proboscis is retracted. (B) Heat induced silencing of GMR81B12 neurons using shibirets. Flies at the permissive temperature show full PER upon 200 mM sucrose stimulation (left and right panel). At the restrictive temperature, these flies fail to extend the labella (middle panel, arrow). Insets show magnifications of the labella. (C) Expression of GMR81B12 (mCD8-GFP, green) in the adult central brain reveals a single MN in each brain hemisphere. (D) Analysis of dendritic versus axonal arborization. The mCherry-tagged dendritic marker DenMark (red, left panel; white, right panel) co-localizes with the general membrane marker mCD8-GFP (green) in the SEZ but not in the MN-axons projecting out of the brain (arrow). The neuropil is marked by Dlg (blue). (E) Whole head and proboscis preparation of GMR81B12 > mCD8-GFP flies reveals that the MNs (green, arrow indicates MN cell body) innervate muscle 6. Muscles are visualized by the F-actin marker phalloidin (blue) and NMJs are labeled using the presynaptic vesicle marker Synapsin (red). (F) Schematic drawing of the head muscles with innervated muscles highlighted in blue. Scale bars, 50 µm. (G) Quantification of the behavioral phenotypes in control and experimental animals. Numbers and significances are listed in Supplementary file 1. See also Figure 5—figure supplement 1 and Videos 11 , 12 and 13.
Figure 8 with 1 supplement
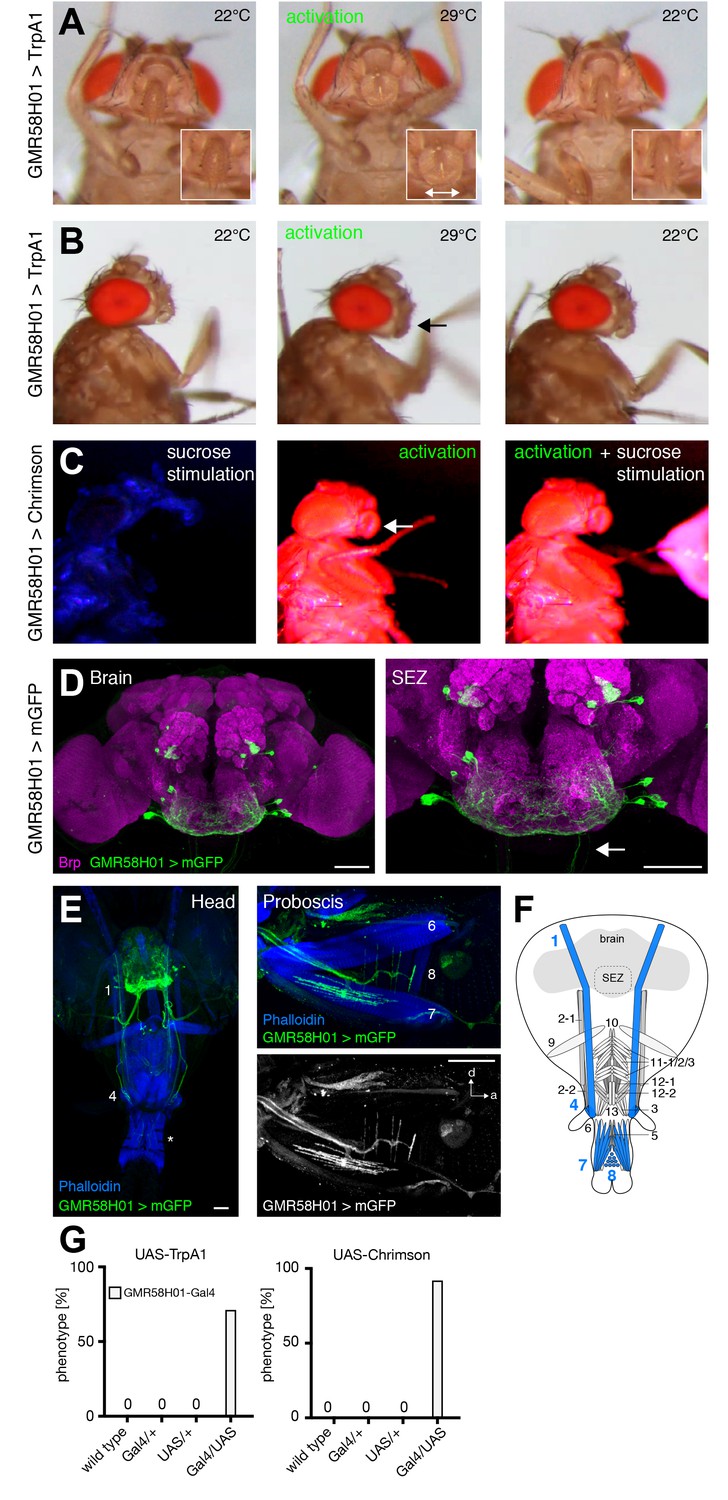
GMR58H01 neurons elicit labella spreading and proboscis retraction.
(A,B) Artificial activation of GMR58H01 neurons using TrpA1. Heat induced activation elicits labella spreading (middle panel (A)) and leads to the retraction of the proboscis (middle panel (B), arrow). At the control temperature before (left panels) and after (right panels) activation the proboscis is retracted. Insets in (A) show magnifications of the labella and the double arrow indicates the spreading of the labella. (C) Artificially activation of GMR58H01 neurons using Chrimson while evoking sucrose induced proboscis extension. At blue light (control), flies show full PER upon 200 mM sucrose stimulation (left panel). Red light activation results in labella spreading and proboscis extension (middle panel). Red light activation during 200 mM sucrose stimulation prevents proboscis extension (right panel). (D) Expression pattern of GMR58H01 in the adult central brain. Arrow points to the axons that are leaving the brain. (E) Whole head preparation of GMR58H01>mCD8-GFP flies (left panel) reveals that the identified MNs (green) innervate muscle 1, 4, and haustellum muscles (asterisk). The side view of the proboscis (right panels) shows innervation of muscles 7 and 8 in the haustellum. Muscles are visualized by the F-actin marker phalloidin (blue). (F) Schematic drawing of the head muscles with innervated muscles highlighted in blue. Scale bars, 50 µm. (G) Quantification of the behavioral phenotypes in control and experimental animals. Numbers and significances are listed in Supplementary file 1. See also Figure 8—figure supplement 1, Videos 14, 15 and 16.
Figure 8—figure supplement 1
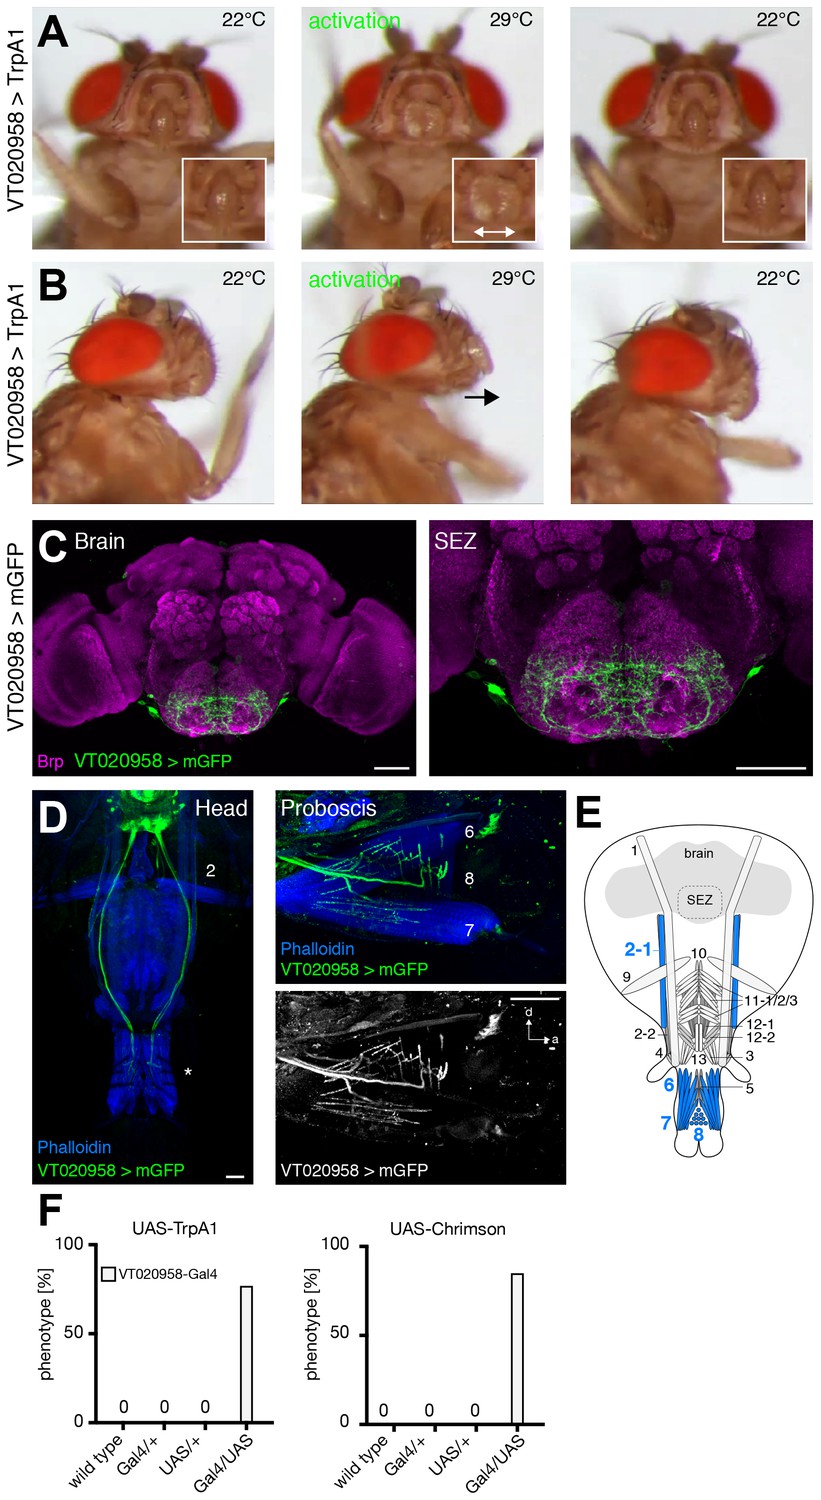
VT020958 neurons elicit labella spreading.
(A,B) Artificial activation of VT020958 neurons using TrpA1. Heat induced activation elicits labella spreading (middle panel (A)) and leads to the extension of the labella (middle panel (B), arrow). At the control temperature before (left panels) and after (right panels) activation the proboscis is retracted. Insets in (A) show magnifications of the labella and the double arrow indicates the spreading of the labella. (C) Expression pattern of VT020958 in the adult central brain. Cells are marked by the expression of mCD8-GFP (green) and the neuropil is visualized using the presynaptic active zone marker Bruchpilot (Brp, magenta). (D) Whole head preparation of VT020958>mCD8-GFP flies (left panel) reveals that the identified MNs (green) innervate muscle 2 and haustellum muscles (asterisk). The side view of the proboscis (right panels) reveals innervation of muscles 6, 7, and 8. Muscles are visualized by the F-actin marker phalloidin (blue). (E) Schematic drawing of the head muscles with innervated muscles highlighted in blue. Scale bars, 50 µm. (F) Quantification of the behavioral phenotypes in control and experimental animals. Numbers and significances are listed in Supplementary file 1. See also Video 15.
Figure 9
The PER motor program relies on the precise coordination of motoneuron activity.
(A–D) MN-Gal4>TrpA1 and MN-Gal4>Chrimson animals were used to display (TrpA1) and quantify (Chrimson) the effects of constant MN activation during sucrose evoked proboscis extension. Animals were stimulated with 200 mM sucrose and snapshots of the maximum proboscis displacement at control (panel 1) and activation temperature (panel 3) are shown. Proboscis displacement in response to heat induced activation is shown in panel 2. Graphs: Maximum proboscis displacement was measured at blue light (control) upon 200 mM sucrose stimulation (grey bar), at red light (activation) without sucrose stimulation (green bar), and at red light upon 200 mM sucrose stimulation (green + blue bar). The zero point is defined by the position of the proboscis at blue light without sucrose stimulation and 100% proboscis extension represents the maximum proboscis displacement at blue light upon 200 mM sucrose stimulation. Data are presented as mean ± SEM. (E) Same quantification as in (A–D) for control (w1118>Chrimson) animals. (F) Quantification of percentage of expected proboscis distance. The zero point is defined by the proboscis displacement at red light without sucrose stimulation while 100% proboscis extension represents maximum proboscis displacement at blue light upon 200 mM sucrose stimulation. Data are presented as mean ± SEM. Statistical analysis: see Materials and methods.
Figure 10 with 2 supplements
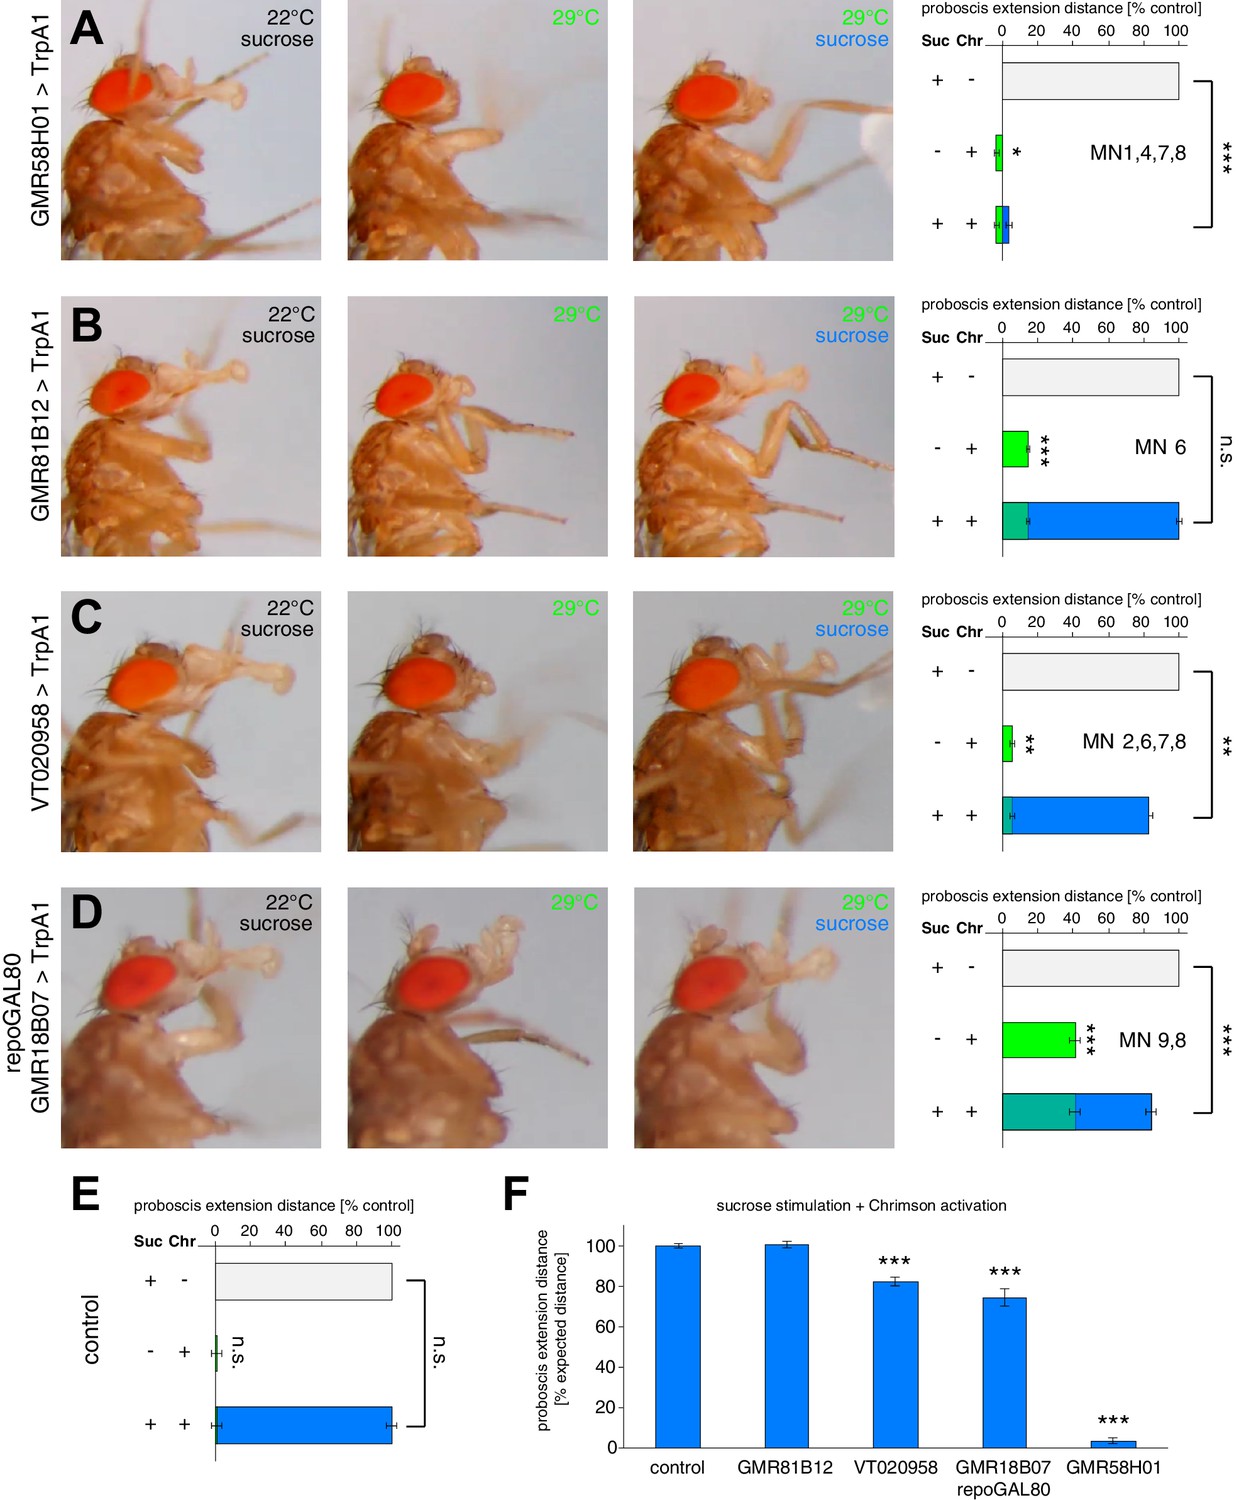
Motoneurons and muscles controlling the major steps of the PER motor program.
The extension of the proboscis in response to an attractive stimulus (200 mM sucrose, A–E) follows a stereotypic pattern that can be subdivided into a sequence of events. Snapshots of the motion pattern of a control fly (w1118) executing a continuous proboscis extension (left panels) and in the schematic drawings illustrating the direction of the movements (blue arrows) are shown. Muscles and MNs controlling the individual steps are indicated in the schematics (blue numbers) and in brains (right panels, inverted fluorescence images from Figures 5–8). MNs display a striking overlap in dendritic organization. Scale bar, 20 µm.
Figure 10—figure supplement 1
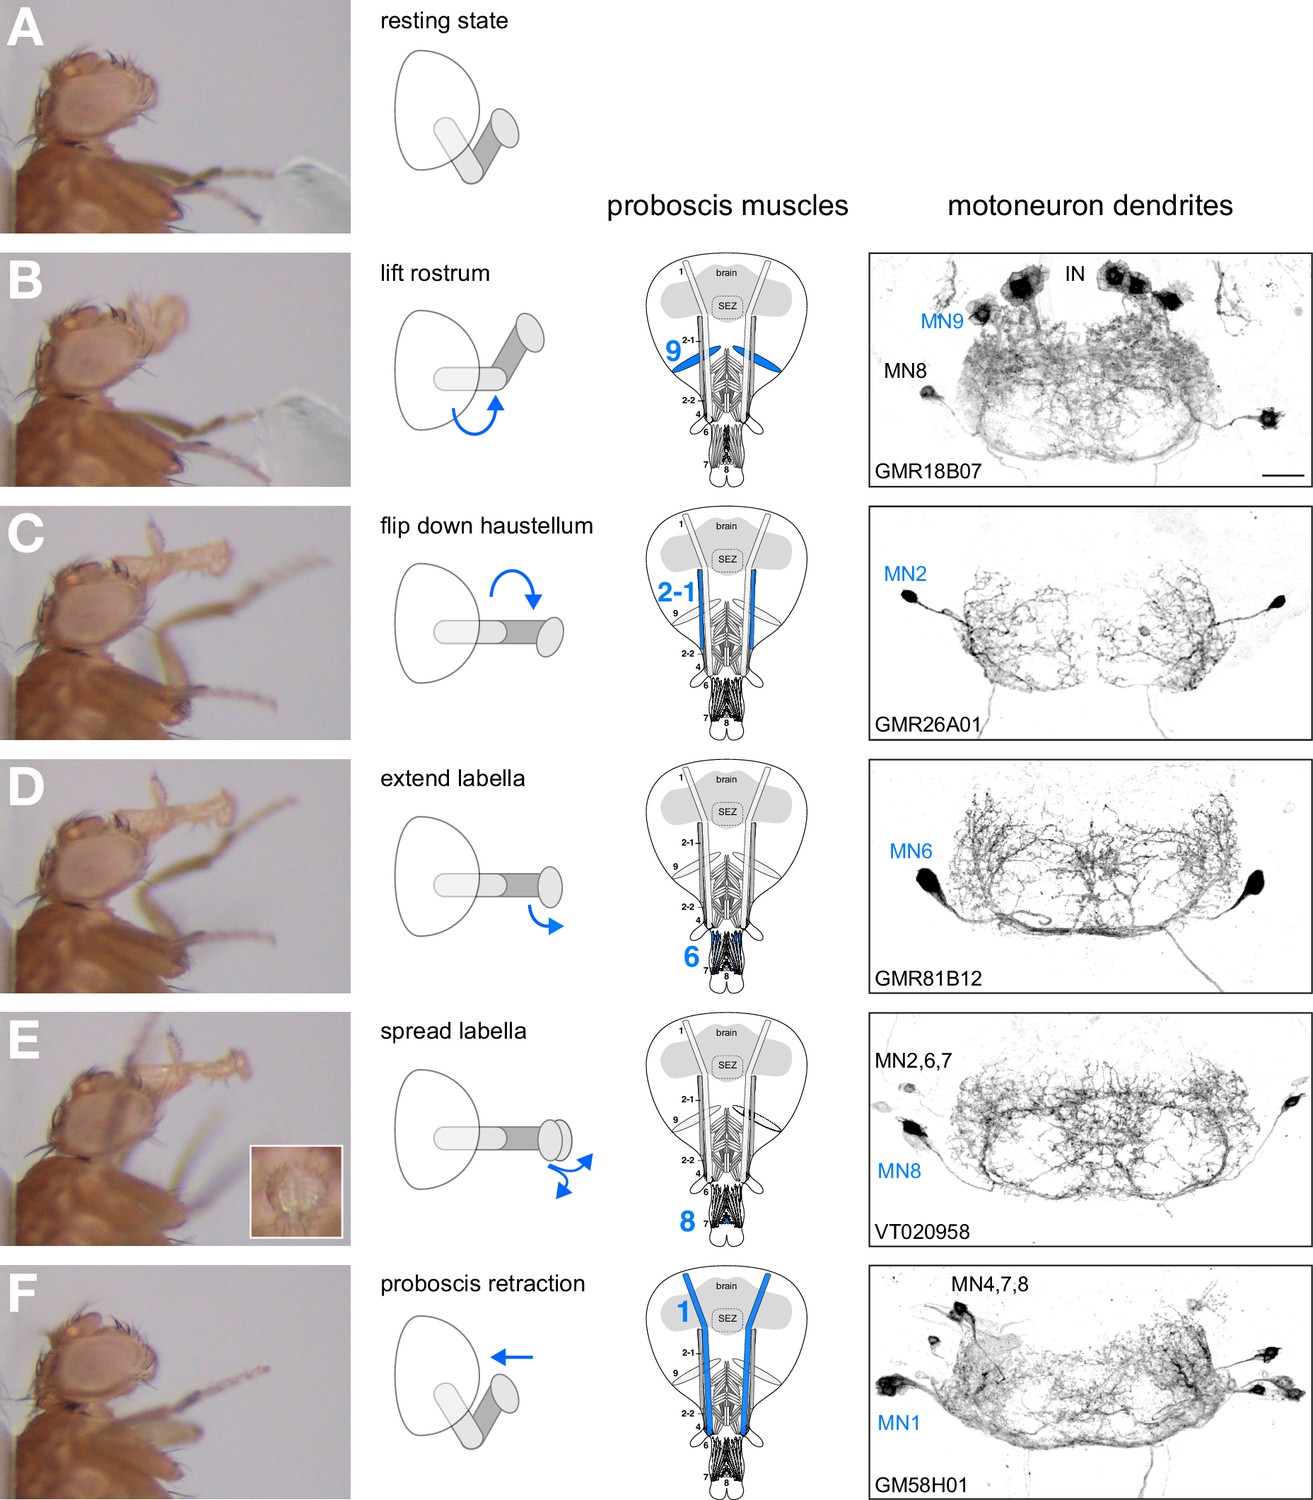
Spatial organization of MN dendrites in the SEZ.
(A–D) The expression pattern (mCD8-GFP, green) of three identified MN-Gal4-lines GMR26A01, chaGal80 MN2 (A), GMR81B12 MN6 (B), and GMR58H01 MN1,4,7,8 (C) is shown in comparison to the axonal projections of Gr5a-expressing sweet sensory neurons (D) in the adult central brain (Brp, magenta). For each genotype a front view (left panel), angled top view (middle panel), and a side view is shown. Scale bar, 50 µm.
Figure 10—figure supplement 2
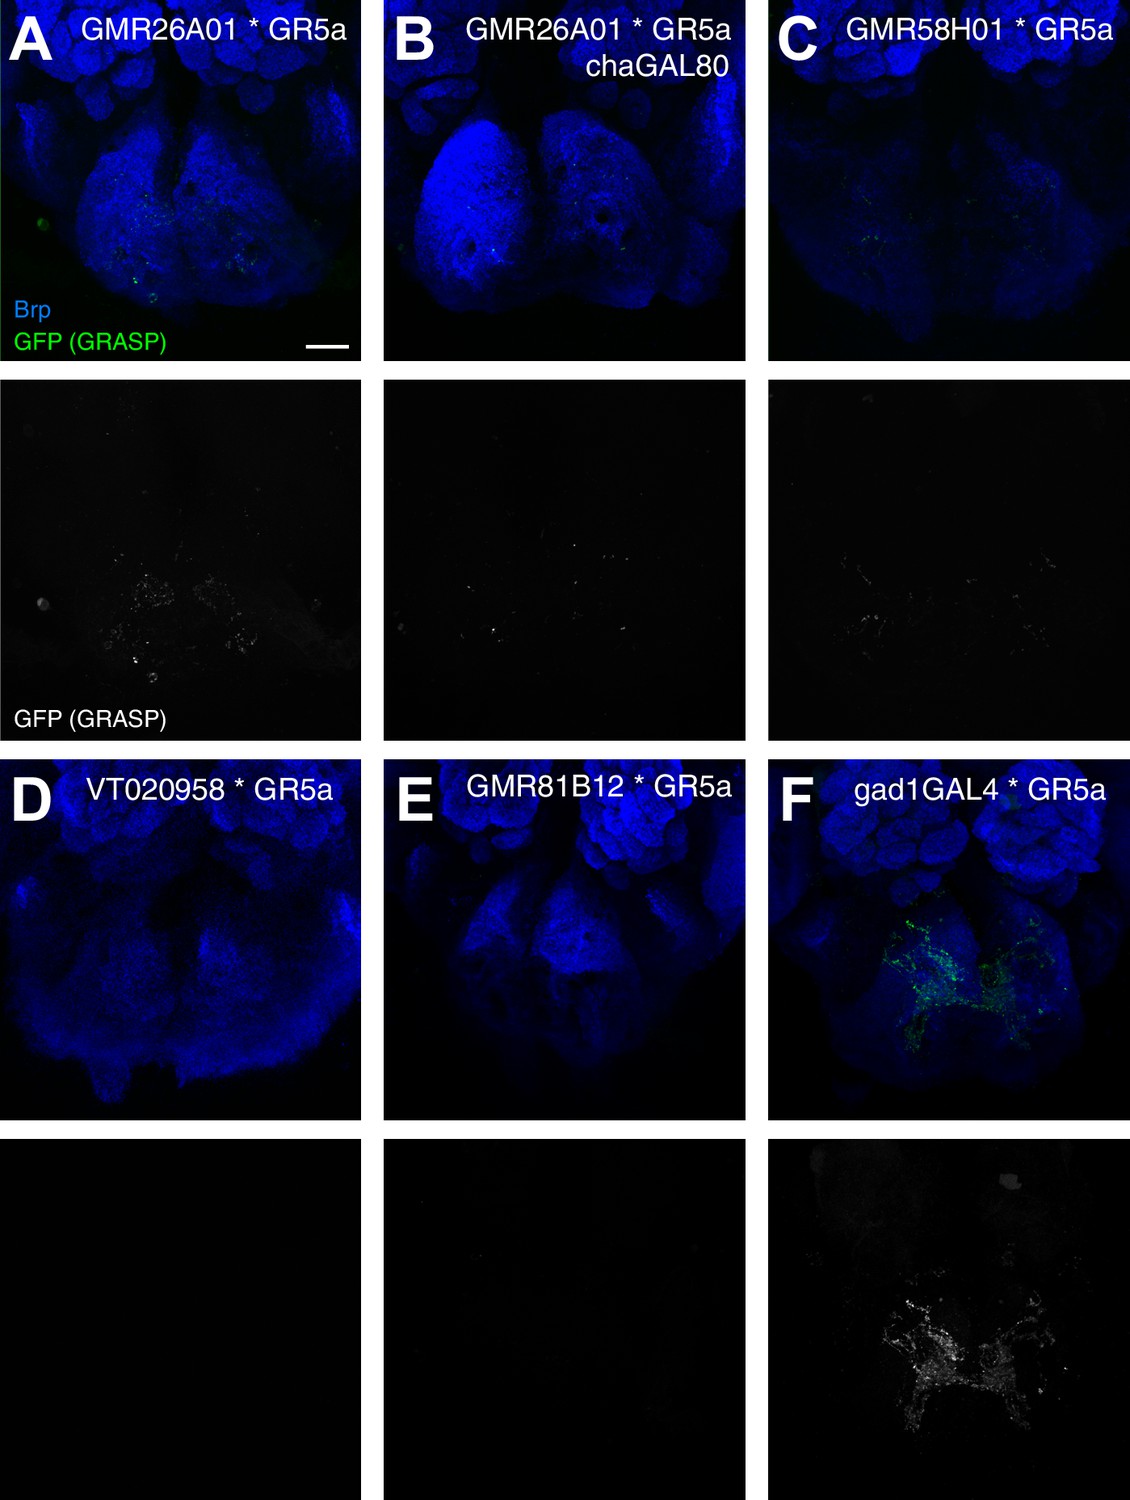
Gr5a sensory neurons do not form synaptic connections with proboscis MNs.
Analysis of endogenous GRASP signal (green, top panels; white, bottom panels) between GMR26A01-Gal4 (A), GMR26A01-Gal4, chaGal80 (B), GMR58H01-Gal4 (C), VT020958-Gal4 (D), GMR81B12 (E), Gad1-Gal4 (F) and Gr5a-LexA. The neuropil is visualized using the presynaptic active zone marker Brp (blue, top row). Weak GRASP-signals are present in the combination GMR26A01-Gal4 to Gr5a-LexA (A). These signals are likely due to interneurons marked in the Gal4-line as no signal can be detected when expression is restricted to MN2 by using cha-Gal80 (B). Similarly, we did not detect significant GRASP signals in all other MN-Gr5 combinations but strong signals were present in the positive control gad1-Gal4 to Gr5a-LexA. Scale bar, 20 µm.
Figure 11
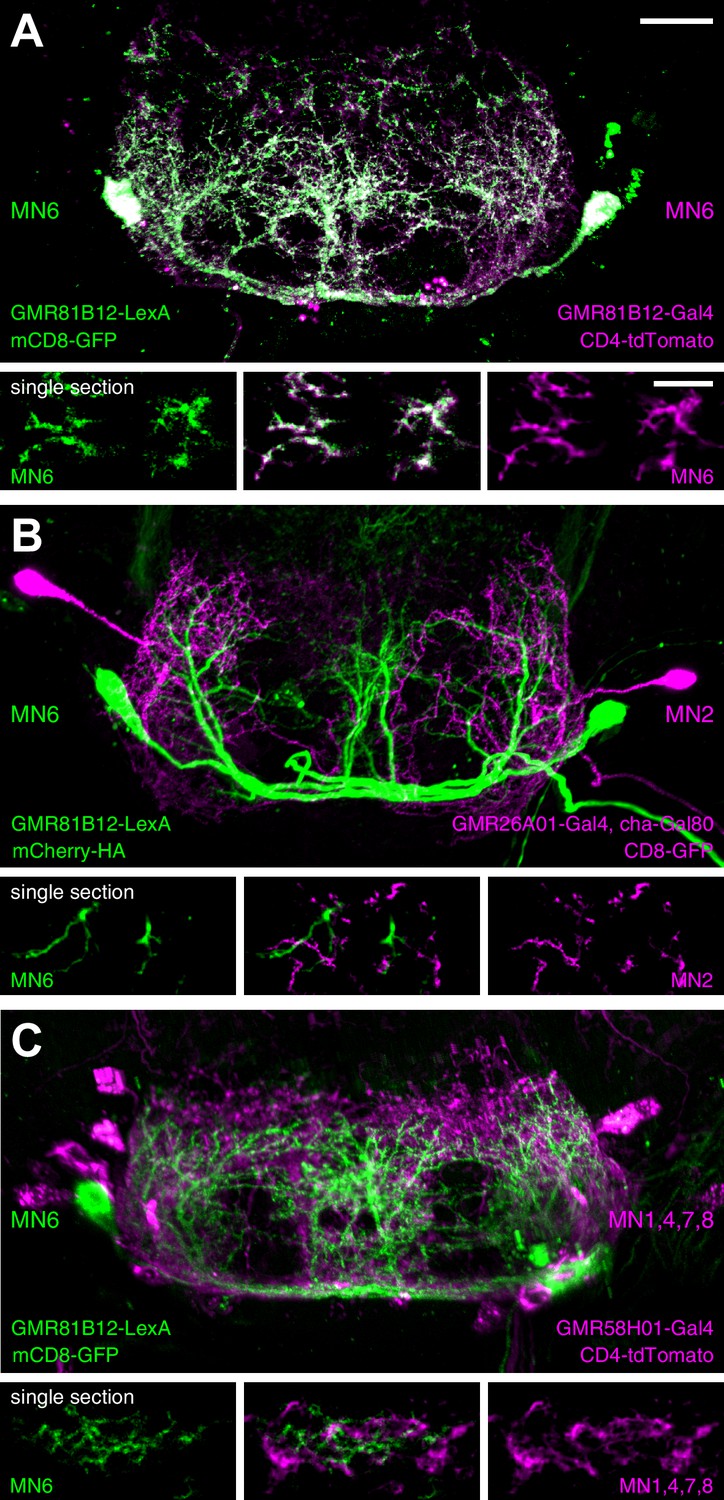
Analysis of dendritic arborizations of proboscis MNs.
(A–C) Coexpression of mCD8-GFP and tdTomato/mCherry in MN-expressing lines using two binary expression systems (Gal4 and LexA). Maximum intensity projections (upper panel) and single z-stack sections (lower panel) are displayed. Spatial relationship between GMR81B12-LexA targeted MN6 (green) and one of the following MN-lines are shown: GMR81B12-Gal4 targeted MN6 (A, magenta), GMR26A01-Gal4, cha-Gal80 targeted MN2 (B, magenta), and GMR81B12-Gal4 targeted MNs1, 4, 7, 8 (C, magenta). Single sections in B, C show close, but non-overlapping association of MN dendrites of different MN populations. Scale bar, 20 µm (overview), 10 µm (single sections).
Videos
Video 1
Proboscis extension sequence in wild type flies (related to Figure 1).
This video shows a side view sequence of a sucrose-evoked proboscis extension of a wildtype (w1118) fly first in real time followed by slow motion (0.1 x speed).
Video 2
Activation of Gr5a-expressing sweet sensory neurons using Chrimson.
This video shows a continuous sequence of a Gr5a-Gal4>Chrimson fly at the control wavelength (475 nm), at the activation wavelength (633 nm), and at the control wavelength. First in real time followed by slow motion (0.4 x speed).
Video 3
Activation of GMR18B07, repoGal80 neurons using TrpA1 (related to Figure 5).
This video shows a GMR18B07, repoGal80 > TrpA1 fly at control and activation temperatures. Order of sequence: Side view at 22°C, side view at 29°C, top view at 29°C, and side view at 22°C.
Video 4
Activation of GMR18B07, repoGal80 neurons using Chrimson (related to Figure 5).
This video shows a GMR18B07, repoGal80 > Chrimson fly at the control wavelength (475 nm), then at the activation wavelength (633 nm), and at the control wavelength.
Video 5
Silencing of GMR18B07, repoGal80 neurons using shits (related to Figure 5).
This video shows sucrose stimulations of a GMR18B07, repoGal80 > shits fly at 22°C, at 29°C, and at 22°C, displayed at a 0.5 x speed.
Video 6
Activation of GMR26A01 neurons using TrpA1 (related to Figure 6).
This video shows side view sequences of a GMR26A01 > TrpA1 fly at 22°C, at 29°C, and at 22°C.
Video 7
Activation of GMR26A01 neurons using Chrimson (related to Figure 6).
This video shows a side view sequence of a GMR26A01 > Chrimson fly at control, activation and control wavelength.
Video 8
Silencing of GMR26A01 neurons using shits (related to Figure 6).
This video shows sucrose stimulations of a GMR26A01 > shits fly first at 22°C, at 29°C, and at 22°C, displayed at 0.5 x speed.
Video 9
Activation of GMR26A01, chaGal80 neurons using Chrimson (related to Figure 6).
This video shows a side view sequence of a GMR26A01, chaGal80 > Chrimson fly at the control wavelength (475 nm), then at the activation wavelength (633 nm), and at the control wavelength.
Video 10
Activation of a unilateral GMR26A01, chaGal80 neuron using Chrimson (related to Figure 6—figure supplement 1).
This video shows a side view and front view sequence of a GMR26A01, chaGal80 > Chrimson fly at control, activation and control wavelength.
Video 11
Activation of GMR81B12 neurons using TrpA1 (related to Figure 7).
This video shows side view sequences of a GMR81B12 > TrpA1 fly at 22°C, at 29°C, and at 22°C.
Video 12
Activation of GMR81B12 neurons using Chrimson (related to Figure 7).
This video shows a side view sequence of a GMR81B12 > Chrimson fly at control, activation and control wavelength.
Video 13
Silencing of GMR81B12 neurons using shits (related to Figure 8).
This video shows sucrose stimulations of a GMR81B12 > shits fly at 22°C, at 29°C, and at 22°C, displayed at 0.5 x or 0.125 x speed.
Video 14
Activation of GMR58H01 neurons using TrpA1 (related to Figure 8).
This video shows front view sequences of a GMR58H01 > TrpA1 fly at 22°C, at 29°C, and at 22°C.
Video 15
Activation of VT020958 Neurons using TrpA1 (related to Figure 8—figure supplement 1).
This video shows sequences of a VT020958 > TrpA1 at control and activation temperatures. Order of video sequences: Front view at 22°C, front view at the transition to 29°C, front view at 22°C, side view at 22°C, side view at 29°C, and side view at 22°C.
Video 16
Activation of GMR58H01 neurons using Chrimson (related to Figure 8).
This video shows sucrose stimulations of a GMR58H01 > Chrimson fly at the control wavelength (475) and then at the activation wavelength (633 nm).
Video 17
Proboscis extension response after unilateral leg stimulation.
This video shows a top view sequence of a unilateral sucrose stimulation to the right front leg first in real time followed by slow motion (0.32 x speed).
Additional files
-
Supplementary file 1
Quantification and statistical analysis of behavioral phenotypes.
Numbers are shown as flies displaying phenotype/total flies analyzed.Experimental flies (Gal4/UAS) were compared to control flies (w1118; Gal4/+; UAS/+) using a Wilcoxon signed-rank test.* GMR26A01, chaGal80>Chrimson flies were starved for 24 hr prior to testing.
- https://doi.org/10.7554/eLife.19892.035
Download links
A two-part list of links to download the article, or parts of the article, in various formats.
Downloads (link to download the article as PDF)
Open citations (links to open the citations from this article in various online reference manager services)
Cite this article (links to download the citations from this article in formats compatible with various reference manager tools)
Motor control of Drosophila feeding behavior
eLife 6:e19892.
https://doi.org/10.7554/eLife.19892


