Figures and data
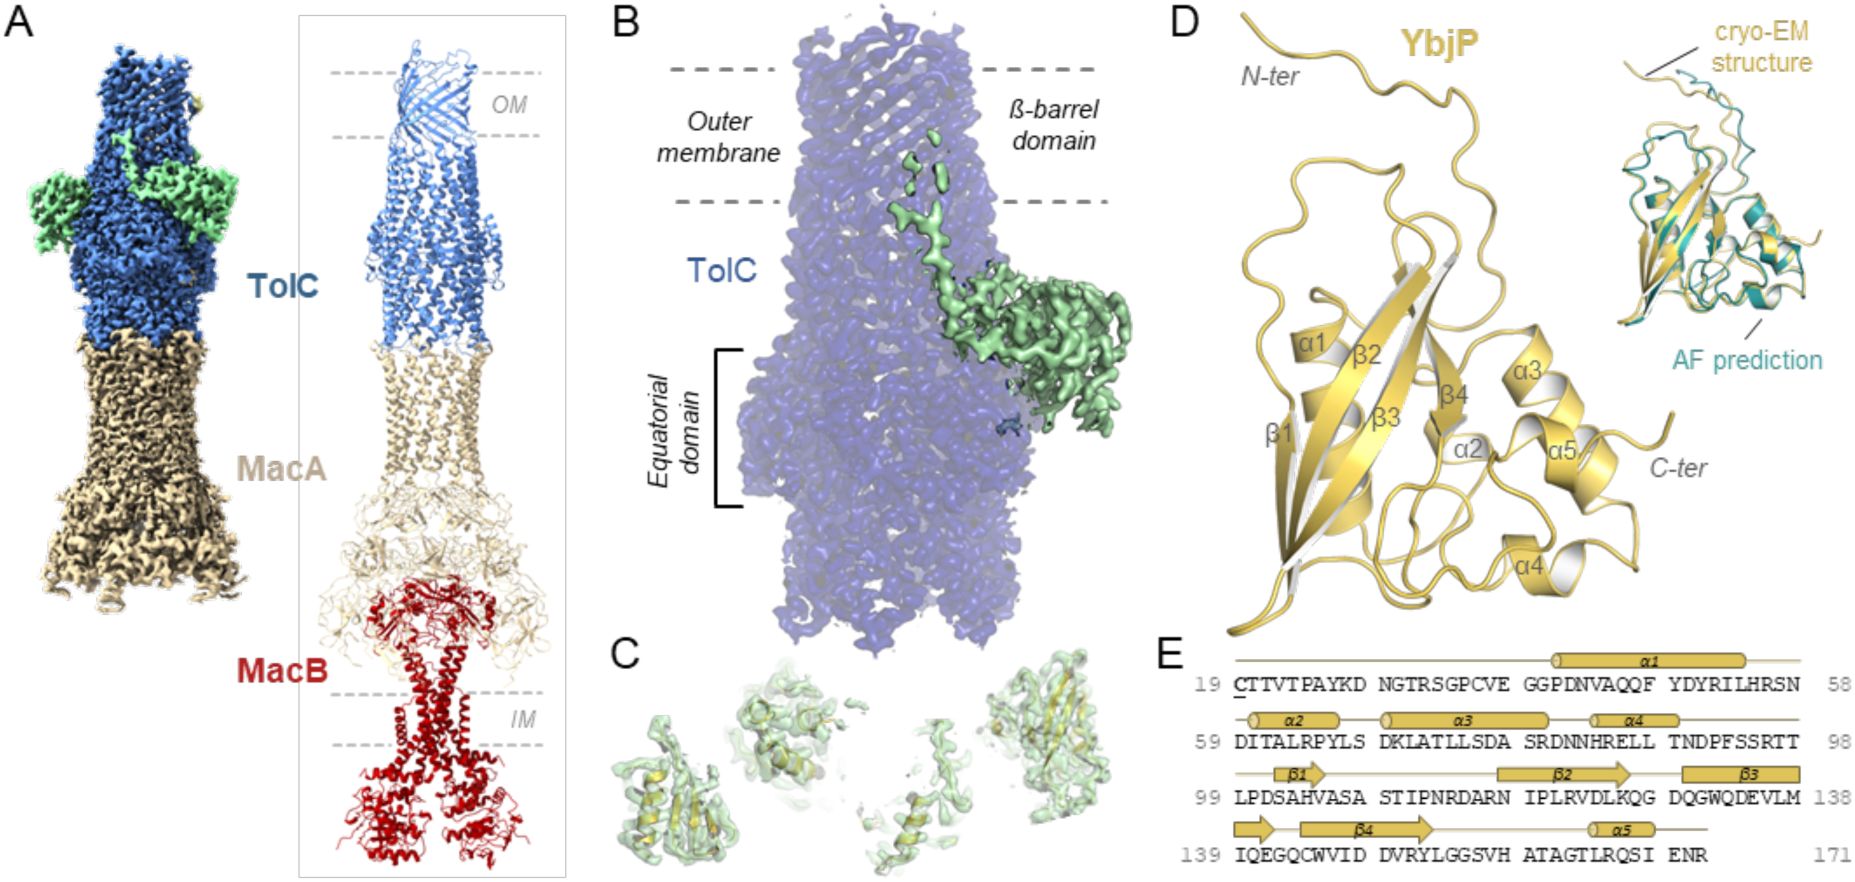
TolC partner identified by cryo-EM.
(A) Cryo-EM density map (left) and model (right) for the tripartite pump MacA-MacB-TolC (PDB 5NIL). Density for the MacB dimer is less well defined. (B) Close-up view on the TolC region showing additional density in green. TolC domain organisation is indicated. (C) Modelling of secondary structural elements fitting in the additional density. (D) The refined structure of the TolC partner, YbjP. After lipoprotein maturation, the N-terminal cysteine carries a lipid modification which is not shown here. Alignment of the YbjP structure from cryo-EM and corresponding AlphaFold prediction model is shown as inset. (E) Sequence and secondary structure alignment annotation of mature YbjP. The tri-acylated cysteine (C19) conserved in lipoproteins is underlined.
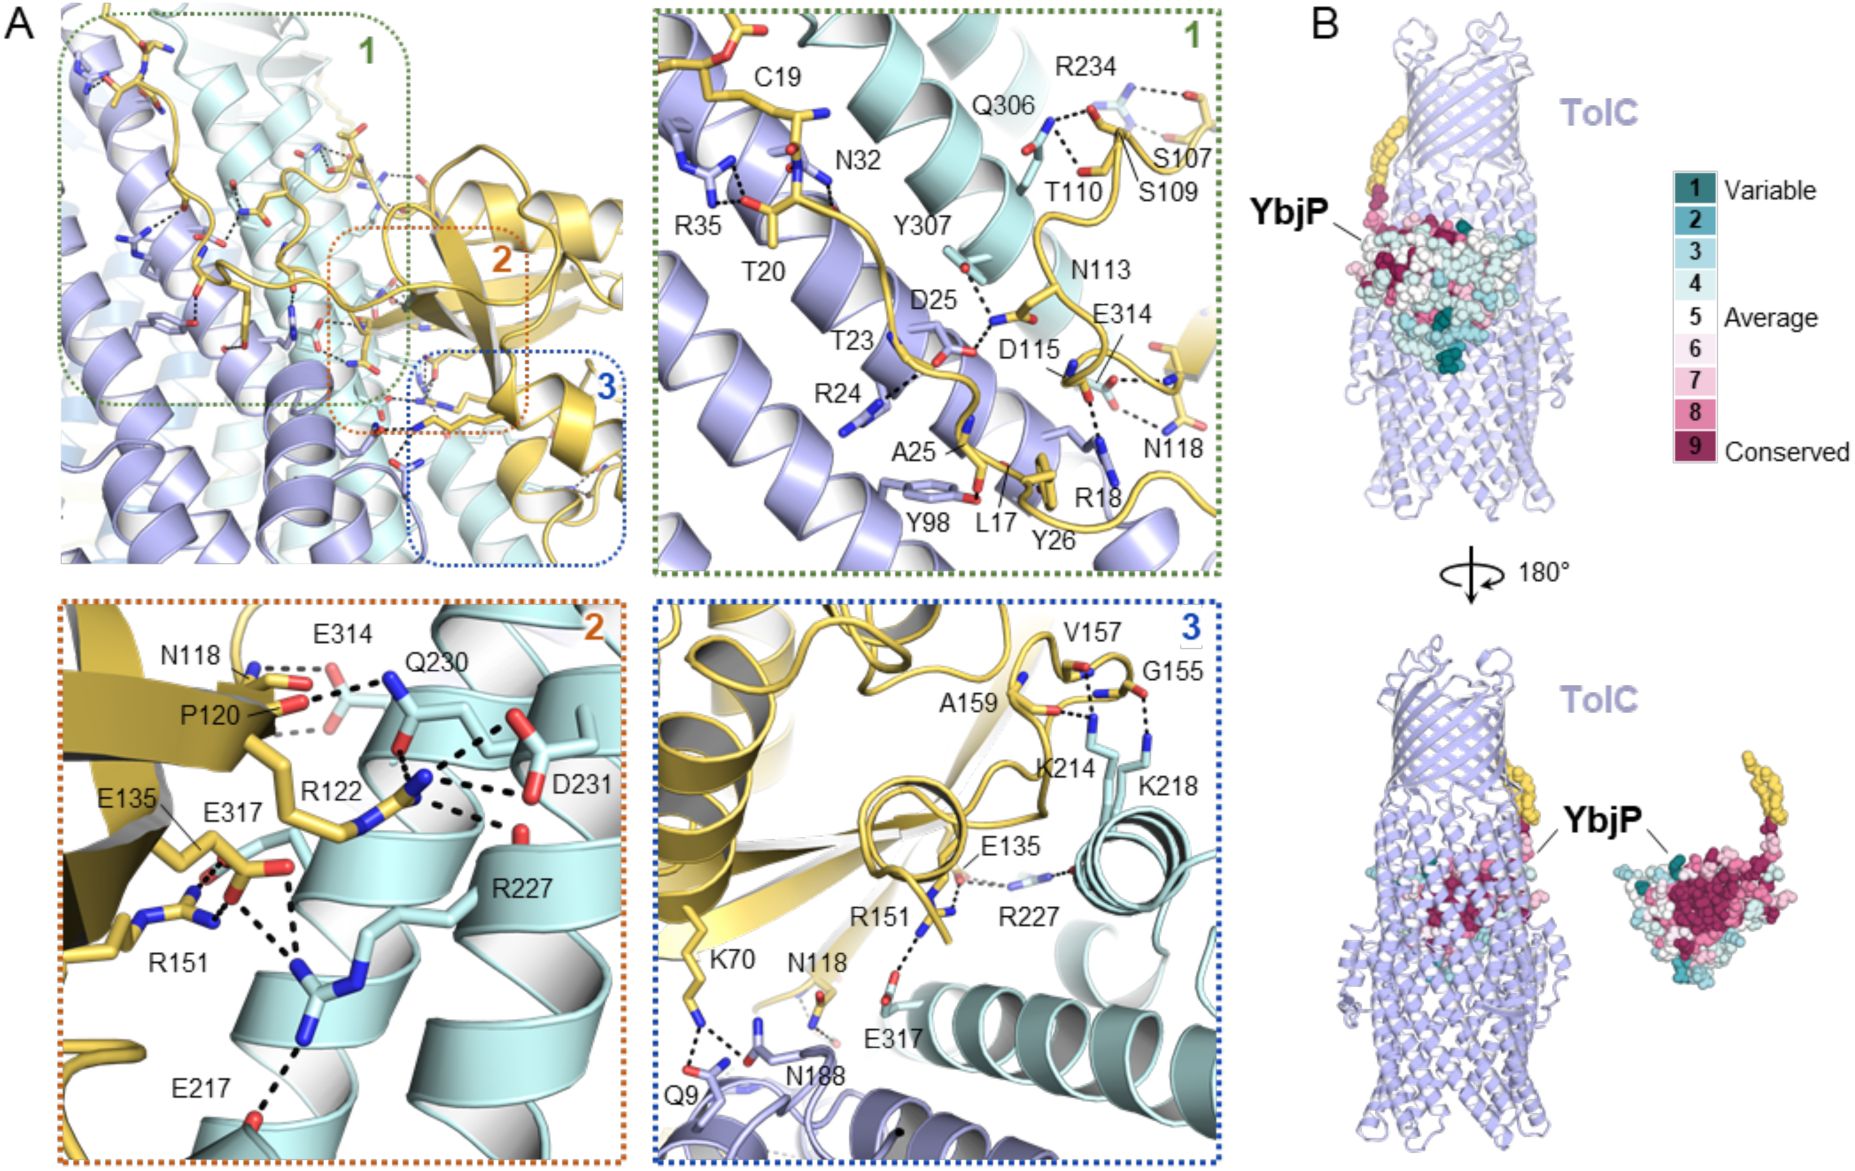
Interactions in the TolC-YbjP complex.
(A) Overview of protein-protein interactions with close-up views presented in panels 1, 2 and 3. The YbjP lipoprotein (yellow) contacts two adjacent protomers of the TolC trimer (blue). Lipoprotein acyl modification and residues involved in intermolecular contacts are shown in stick representation. (B) Residue variability analysis of YbjP highlighting the clustering of conserved residues at the TolC interface. Analysis was performed with the CONSURF server. YbjP is shown as spheres with the lipoylation in yellow.
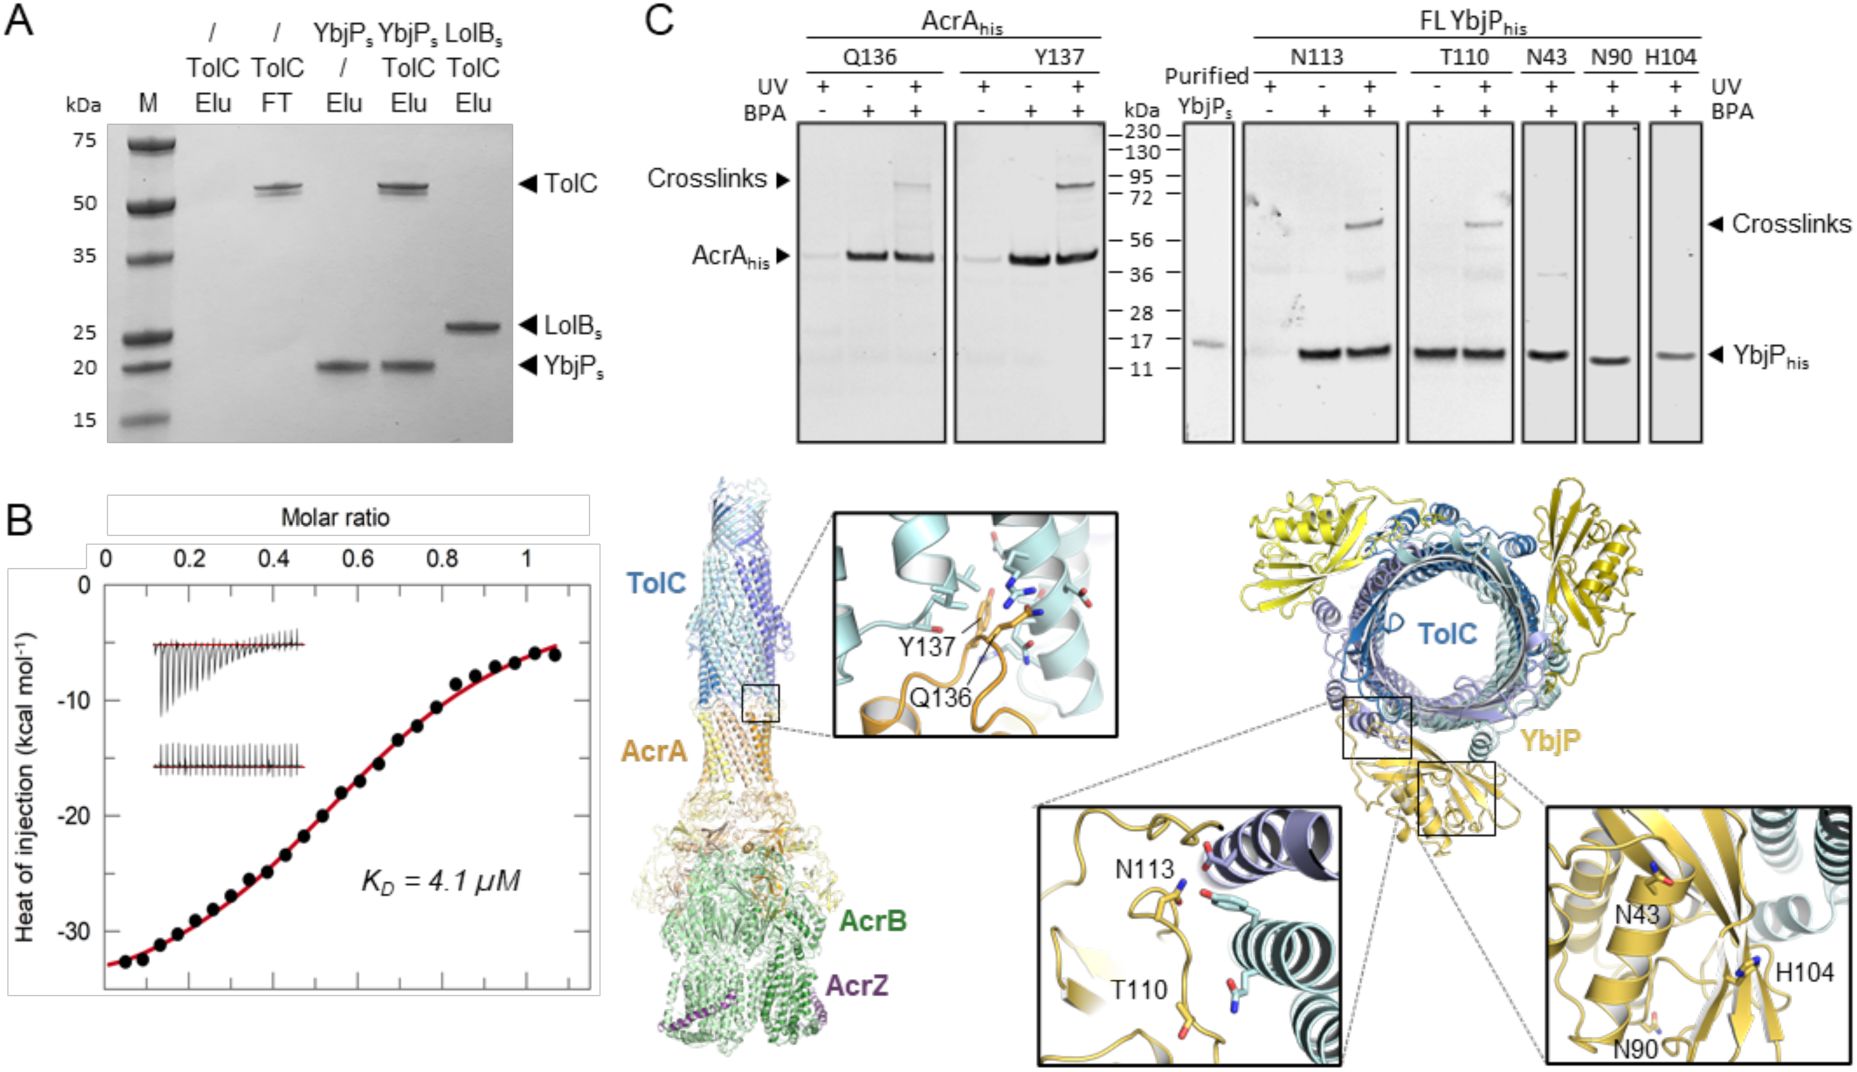
In vitro and in vivo experiments probing the TolC-YbjP interface.
(A) In vitro binding assay between TolC and soluble YbjP (YbjPs) that is missing the lipid modification. TolC-flag was mixed with histidine-tagged YbjPs or soluble LolB (LolBs) prior immobilization on IMAC resin. After several washes, the elution fractions (Elu) were analyzed by SDS-PAGE. Molecular masses of protein standards (M) are indicated. (B) Isothermal titration calorimetry (ITC) profile for the interaction of TolC and YbjPs. Background-corrected heats of injection are shown together with a fitted binding curve in red. The raw thermograms corresponding to the injection of YbjPs into a TolC-containing cell or into buffer are shown in upper and lower inlets, respectively. ITC parameters are listed in Table S3. (C) In vivo validation of the interaction between full-length (FL) YbjP and TolC by photo-crosslinking. The experimental procedure was validated using another periplasmic lipoprotein, AcrA, which associates with TolC. In brief, E. coli C43 cells expressing YbjPhis or AcrAhis mutants carrying a photoactivatable pBPA group at indicated positions were grown in the presence (+) or absence (-) of pBPA and irradiated (+) or not (-) with UV. Cells were then lysed by successive freeze-thaw cycles, solubilized with DDM and lysates purified by Ni-NTA chromatography. Eluted proteins were analyzed by SDS-PAGE and immunoblotting using anti-his antibodies. Purified YbjPs protein was also loaded as a benchmark control. Presence of crosslinked products are indicated with a black arrow. The expected sizes of proteins are as follows: AcrA, 40 kDa; YbjP, 17 kDa; and TolC, 54 kDa.
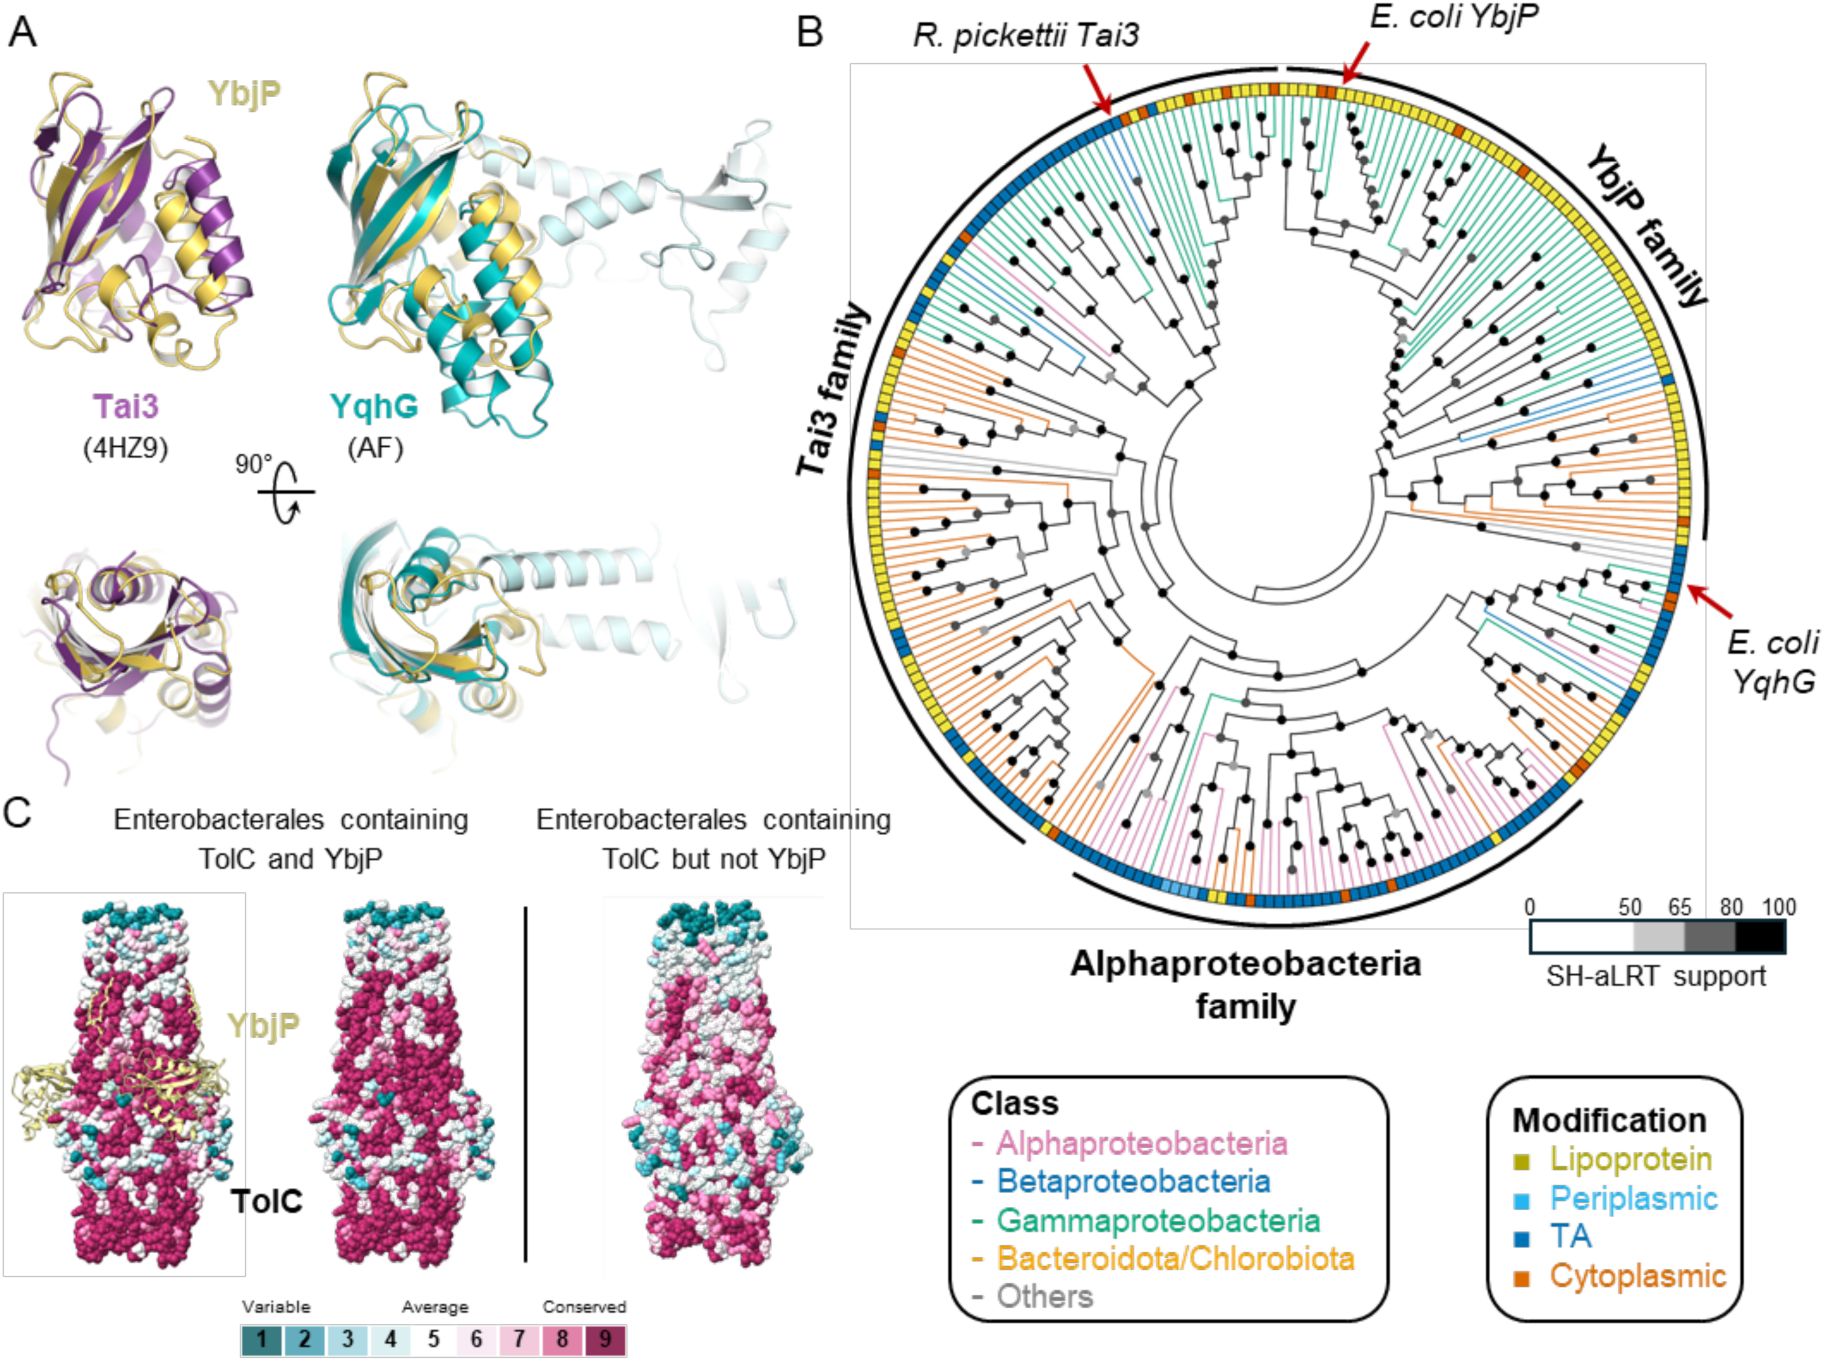
Analysis of YbjP evolution and co-evolution with TolC.
(A) Structural alignment of YbjP with other DUF3828-containing proteins: Tai3 (4HZ9, purple) and YqhG (AlphaFold Q46858, blue). A 90° rotation along the x-axis is shown underneath. (B) A cladogram of DUF3828-containing proteins. The reviewed proteins (Tai3, YbjP and YqhG) are marked by an arrow. (C) Surface conservation of TolC proteins from Enterobacterales containing or not YbjP. Results are displayed on E. coli TolC on the left and on P. atrosepticum TolC (AlphaFold model, Q6DAC5) on the right. For clarity, YbjP is displayed on the left panel but not on the right. Analysis was performed with the CONSURF server.
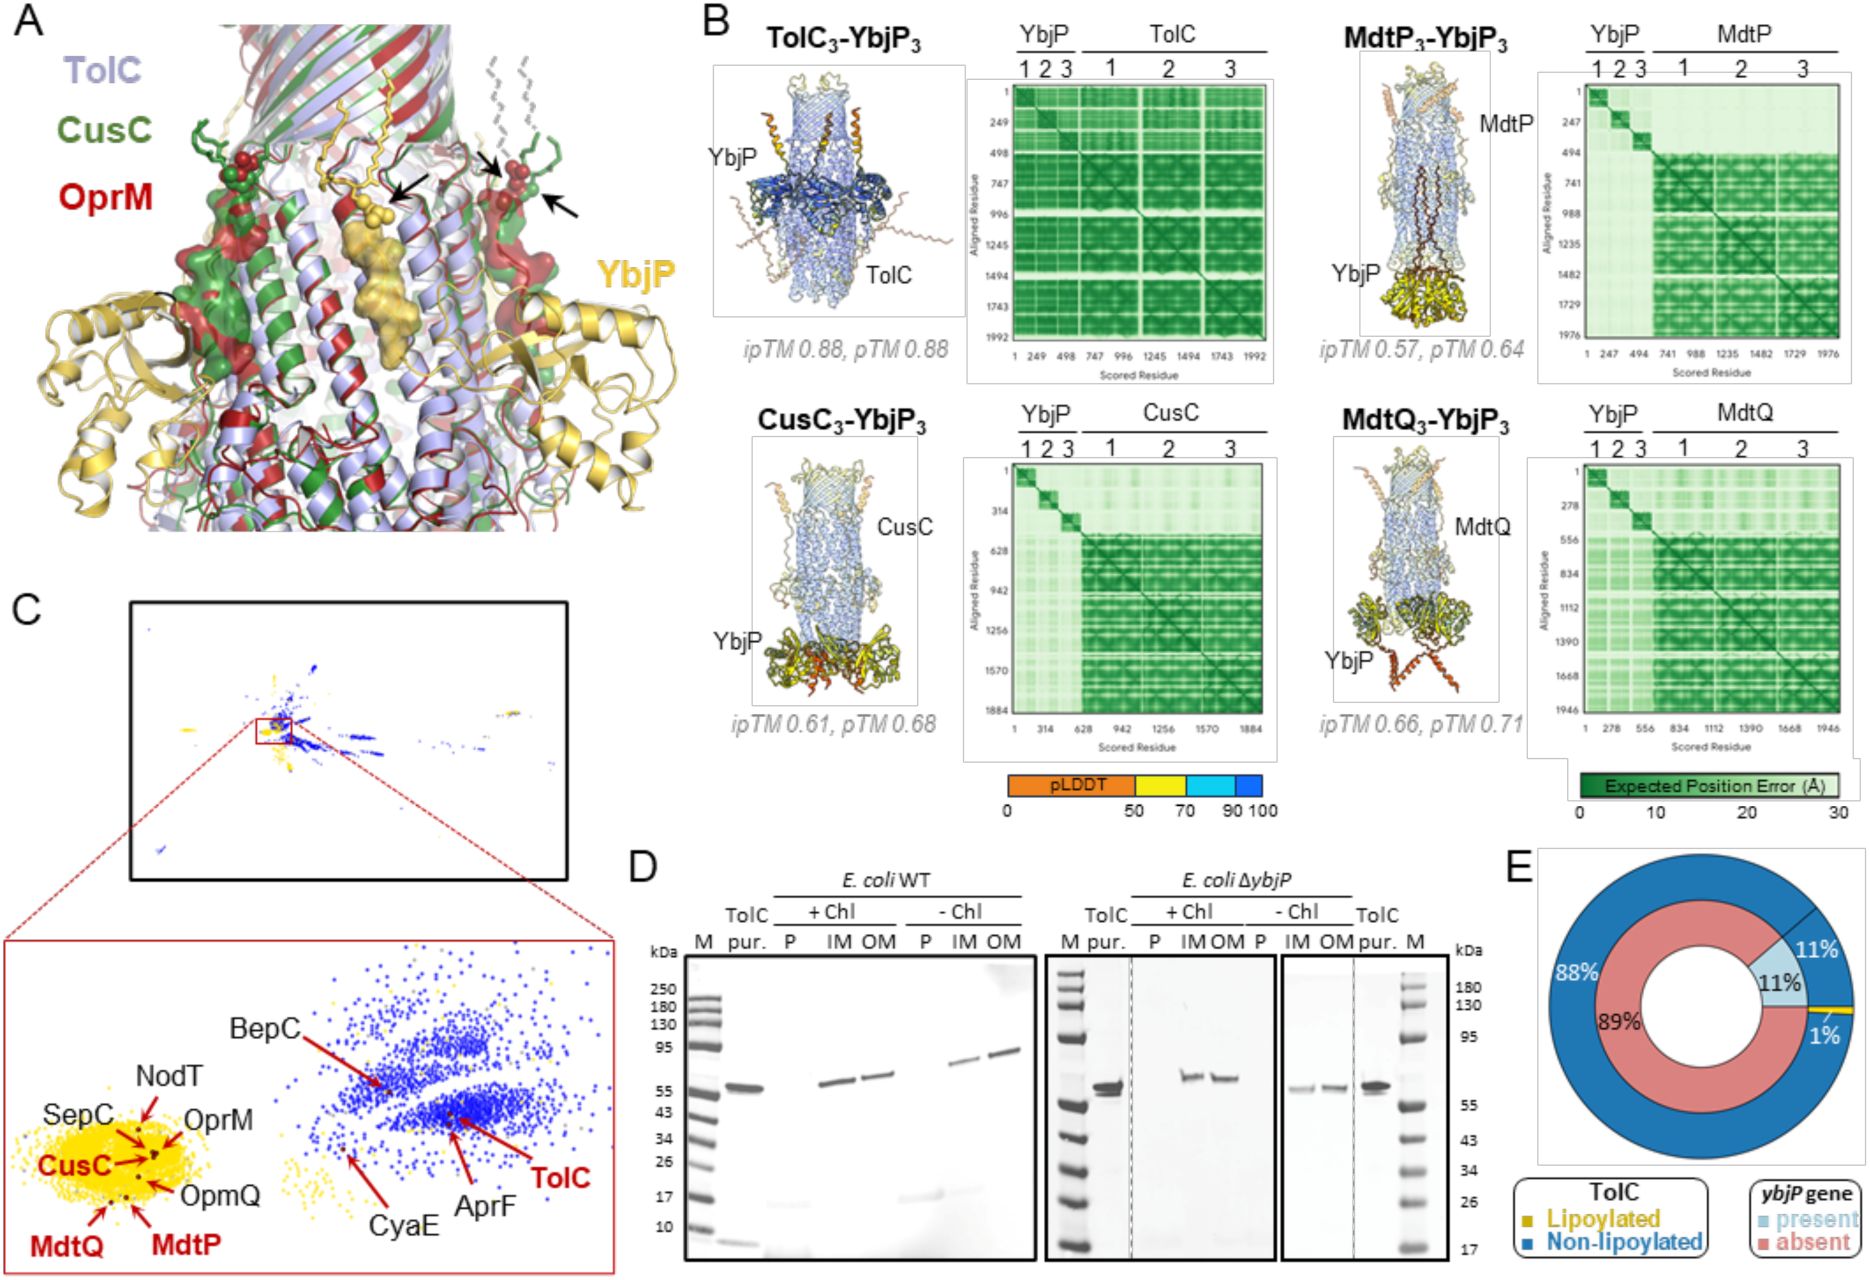
YbjP lipoprotein is not required for TolC trafficking in E. coli.
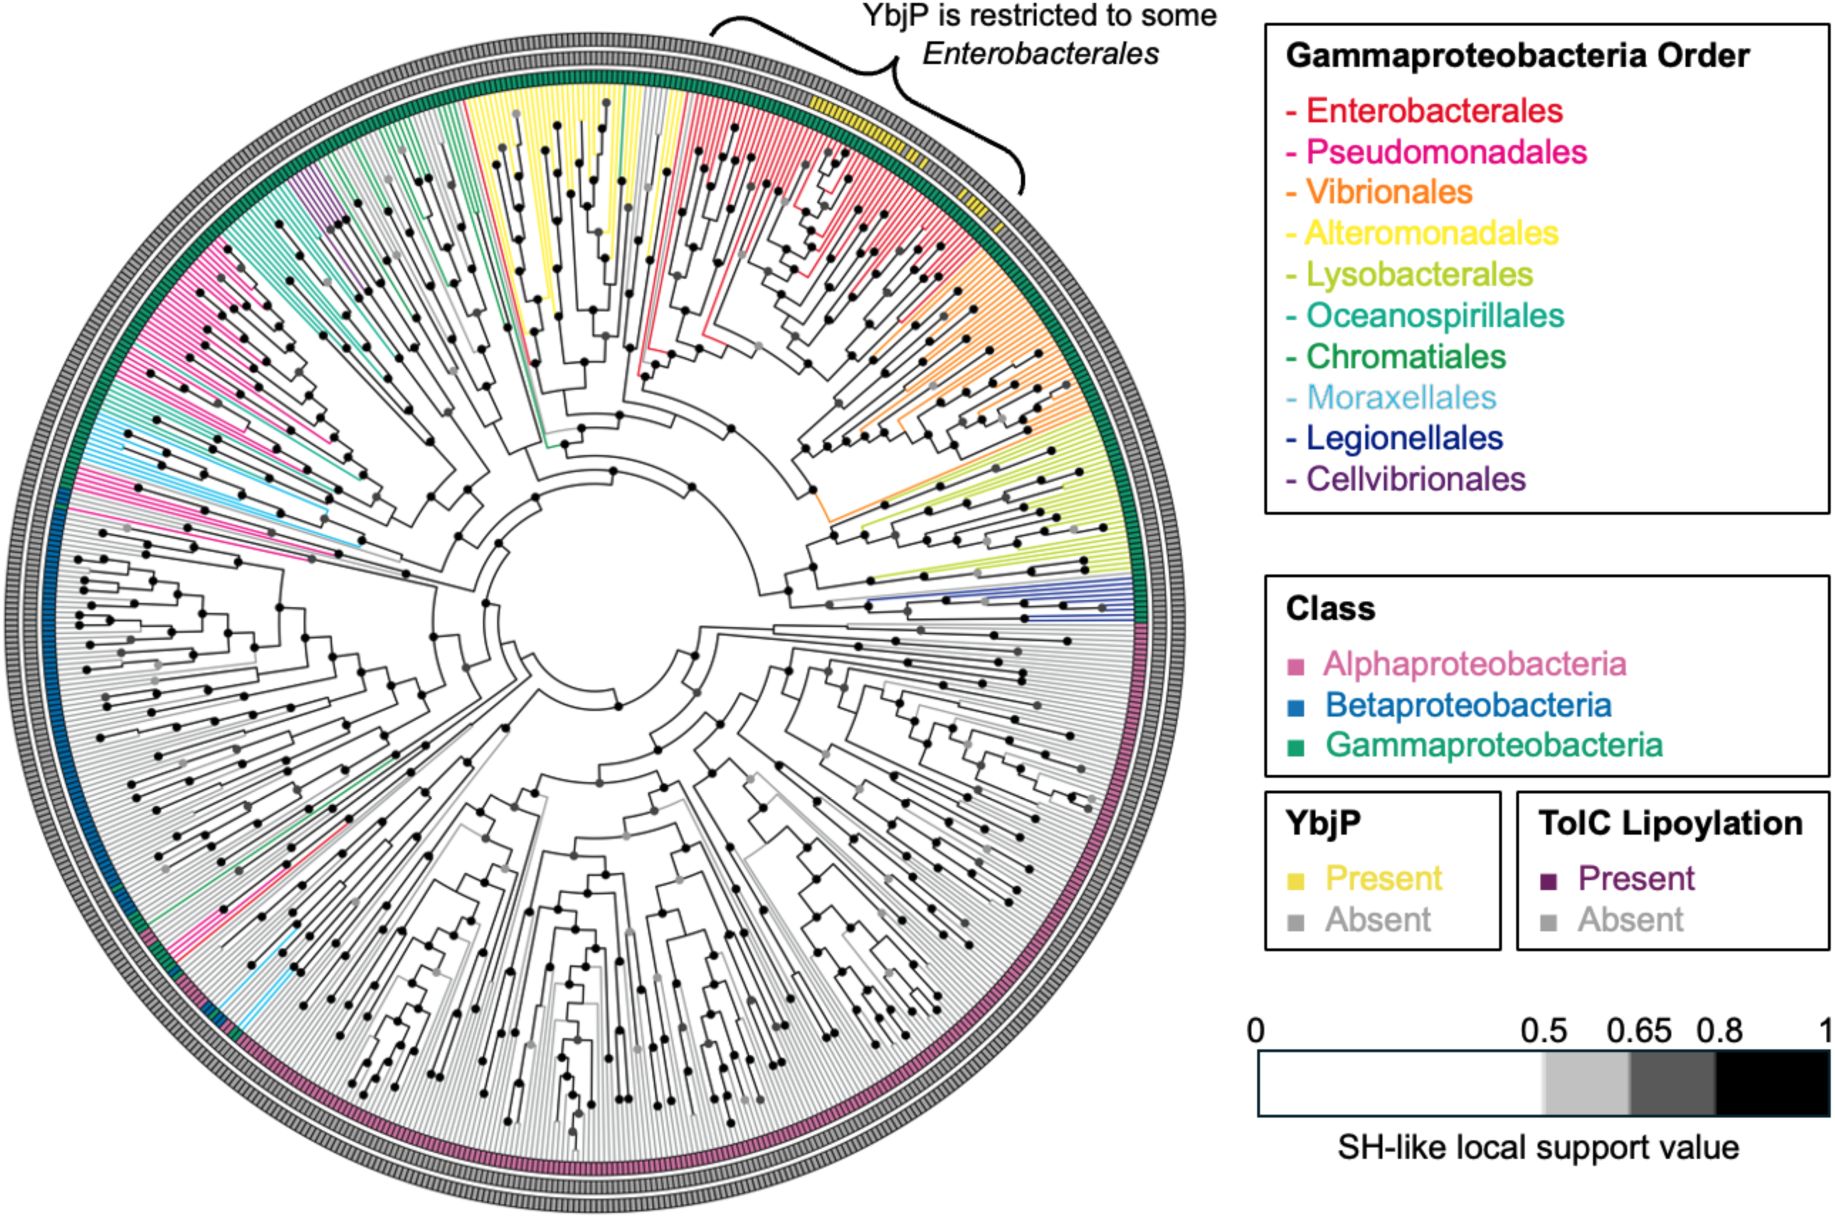
(A) Structural alignment of E. coli TolC (blue), CusC (3PIK, green) and P. aeruginosa OprM (3D5K, red). The YbjP or TolC-homologue linker is shown as transparent surface and modified cysteines are indicated by an arrow. Dashes lines show the extension of the lipid group (partially-or non-modelled in the structures). (B) AlphaFold3 prediction (Abramson et al., 2024) between E. coli outer membrane efflux proteins and YbjP. The model with the higher ipTM and pTM scores is shown out of three technical repeats. (B) CLANS analysis of outer membrane efflux proteins (IPR003423) in Pseudomonadota. Clustering was performed in 2D until equilibrium. Outer membrane proteins in E. coli are shown in red, and other key reviewed proteins in black. Yellow, lipoylation; blue, secreted; grey, other. (D) Immunoblot showing the localization of TolC in E. coli wild-type or ΔybjP cultured (+) or not in the presence of chloramphenicol (Chl). Cells were lysed and membranes separated on a sucrose gradient. Periplasmic fractions were obtained from spheroplast preparation as described in the Methods. Samples corresponding to the periplasmic fraction (P), the inner (IM) or the outer (OM) membranes were subjected to immunoblotting using anti-TolC antibodies. Purified (pur.) TolC protein served as control for the antisera. (E) Distribution of the ybjP gene and lipoylated TolC in Gammaproteobacteria. Repartitions are as follows: ybjP present (light blue, n=67) or absent (magenta, n=525); lipoylated (yellow, n=5) or non-lipoylated TolC (dark blue, n=587).
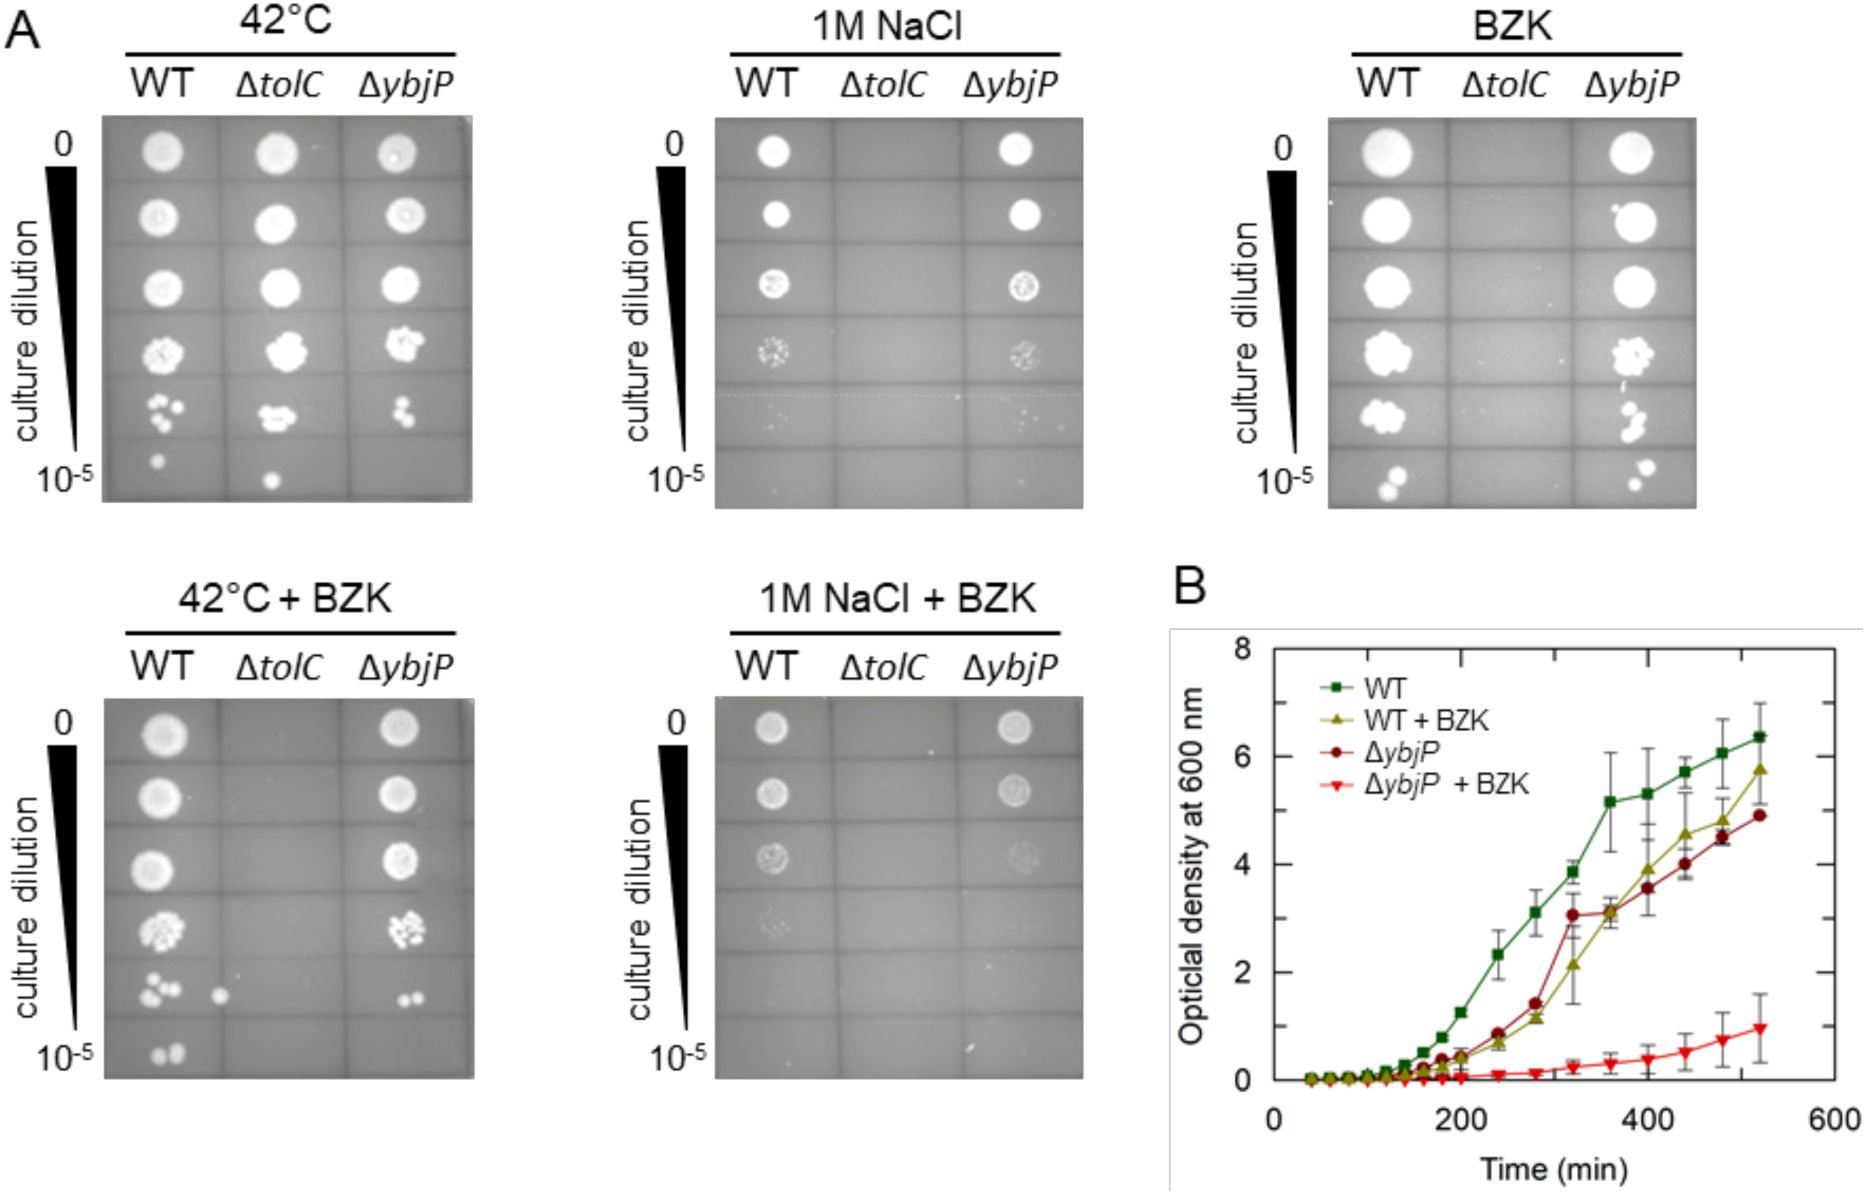
Impact of YbjP on E. coli growth under stress conditions.
(A) Dilution series on nutrient agar plates at 42°C temperature (left), in the presence of high salt concentration (1M NaCl, middle) or sublethal amounts of benzalkonium chloride (BZK, 10 μg mL-1, right). Plates combining grown at 42°C (left) or with 1M NaCl (right) and presence of BZK at the same concentration are displayed underneath. (B) Growth curves of WT and YbjP null strains in the absence or presence of 10 μg mL-1 benzalkonium chloride. Curves depict the mean ± standard deviation for two independent cultures.
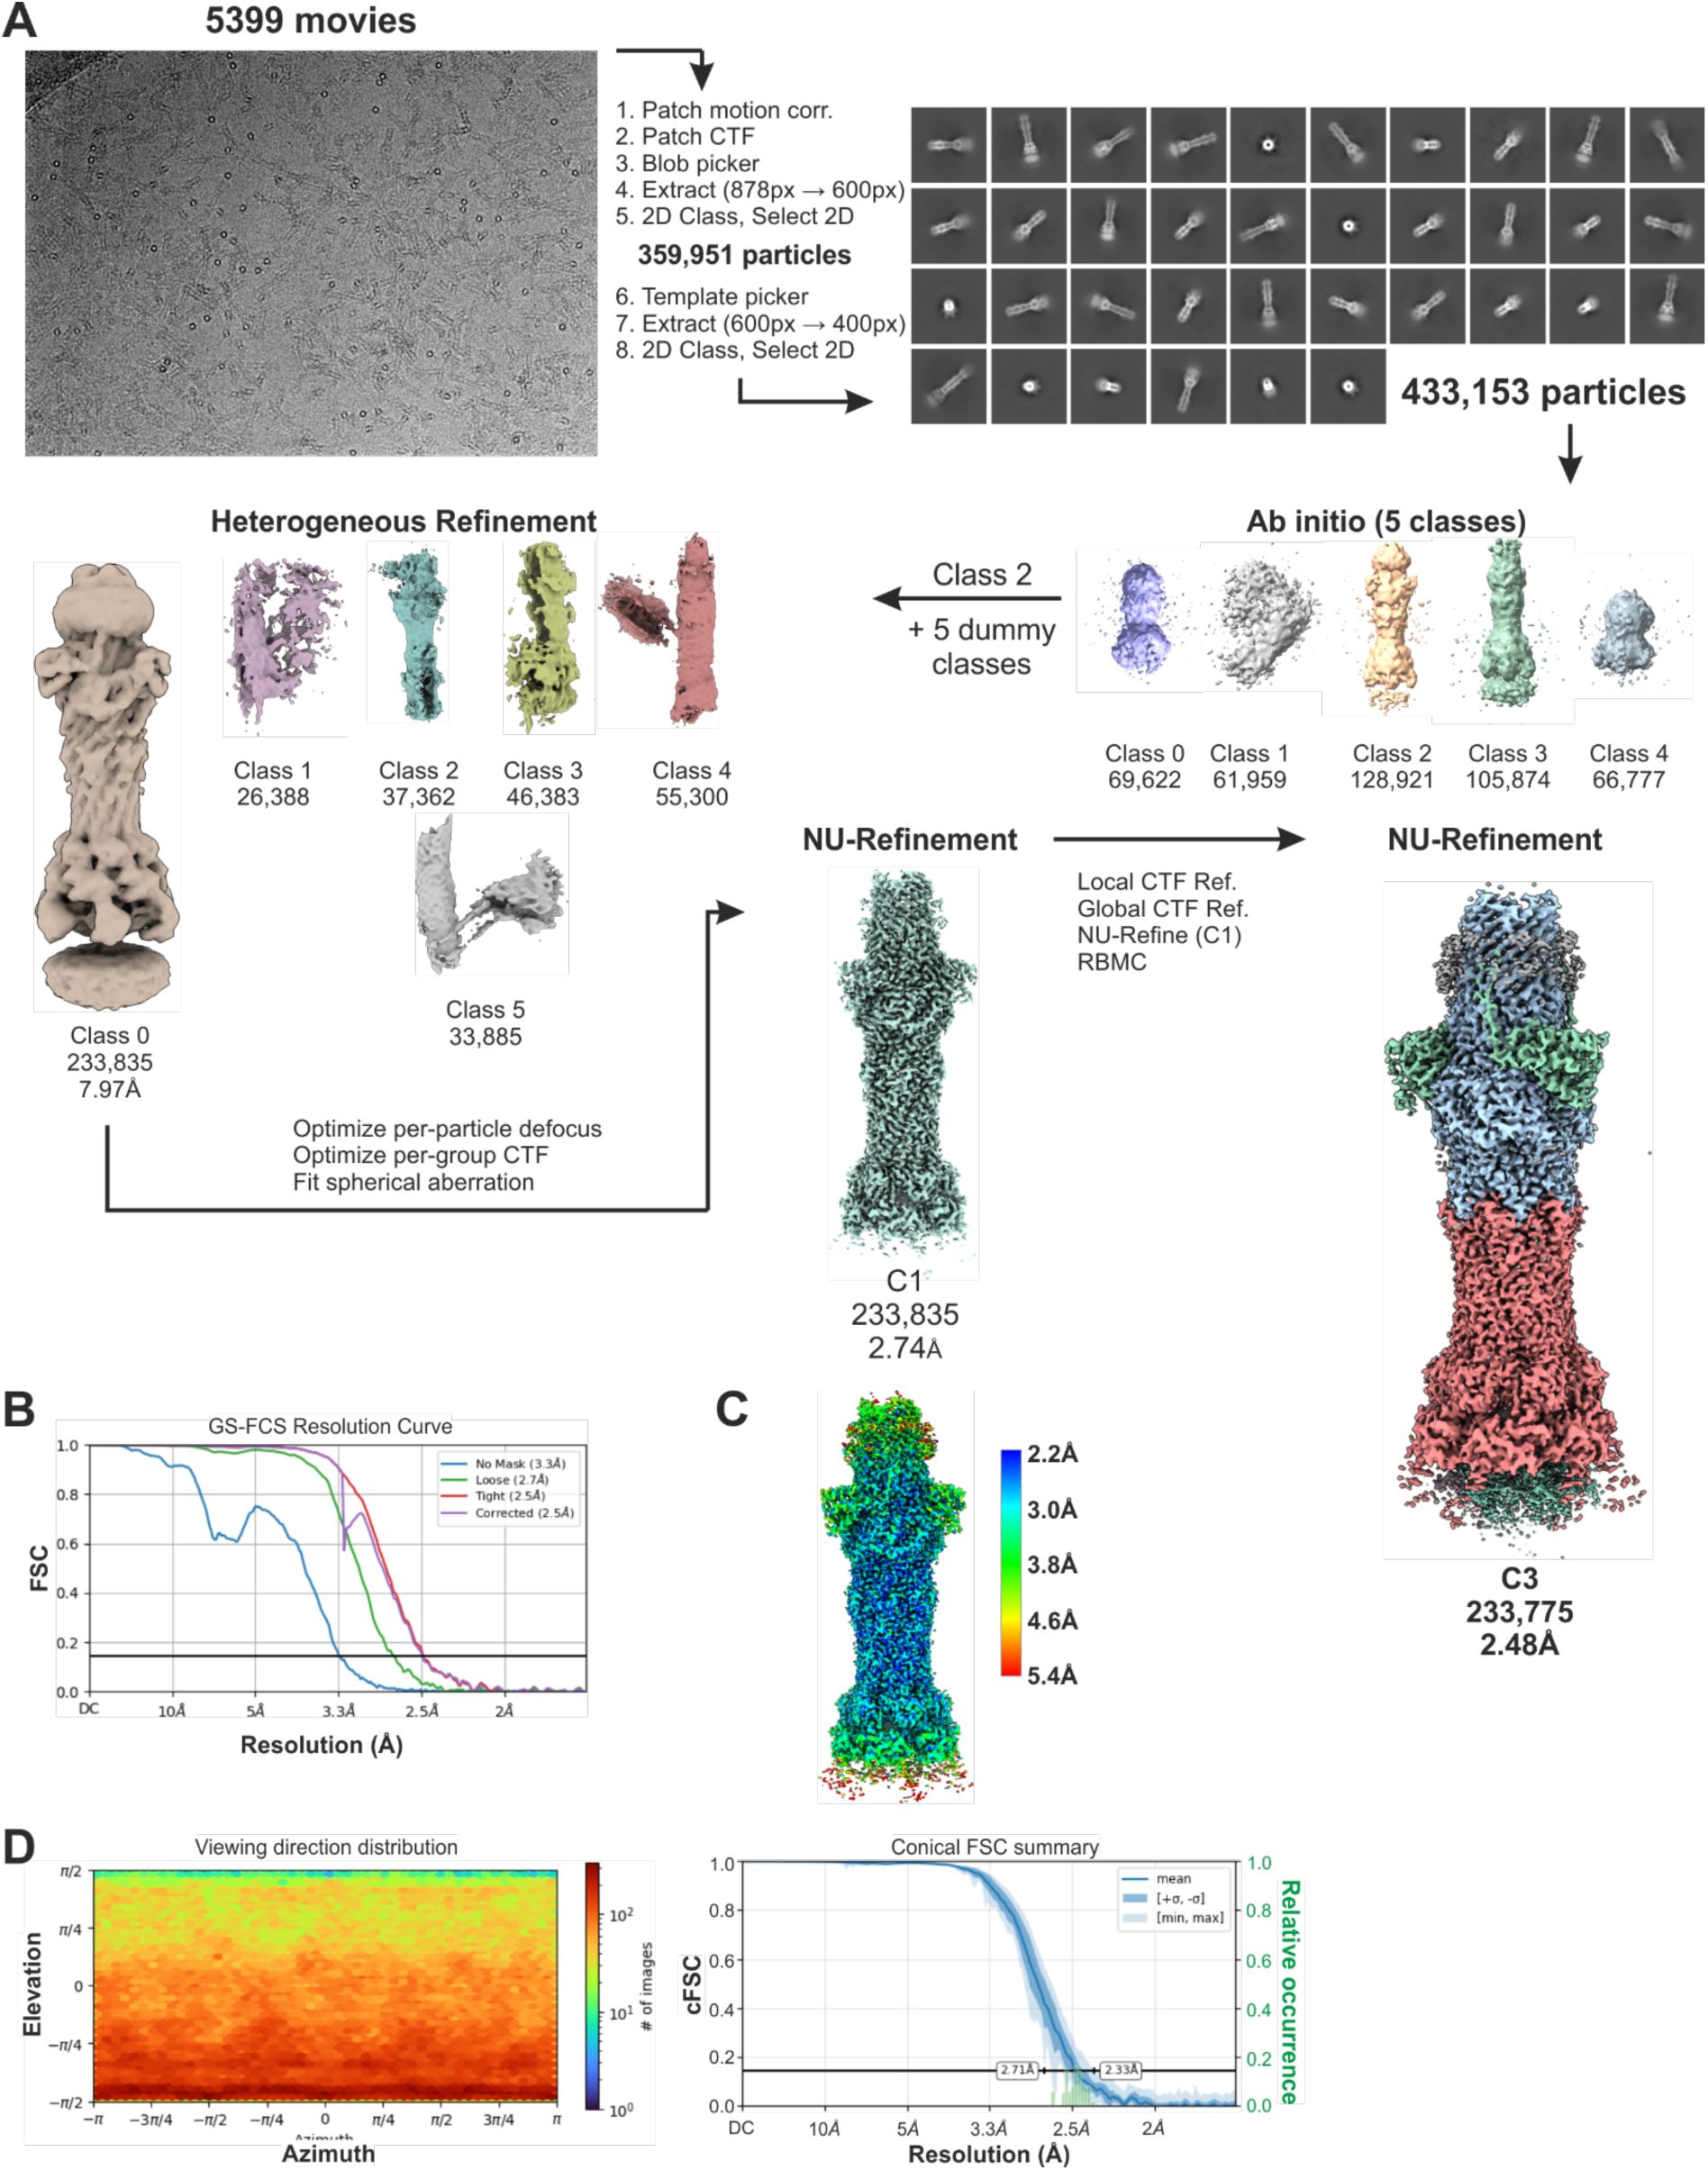
Cryo-EM processing workflow for MacAB-TolC-YbjP complex.
(A) Cryo-EM processing workflow. (B) Gold-standard Fourier Shell Correlation (GS-FSC) curves for final reconstruction. (C) Local resolution distribution in final map. (D) Angular distribution plot for final map, left, and Fourier Shell Correlation between half maps of MacAB-TolC-YbjP, right. These data suggest that there is not a large orientational bias in the final map.
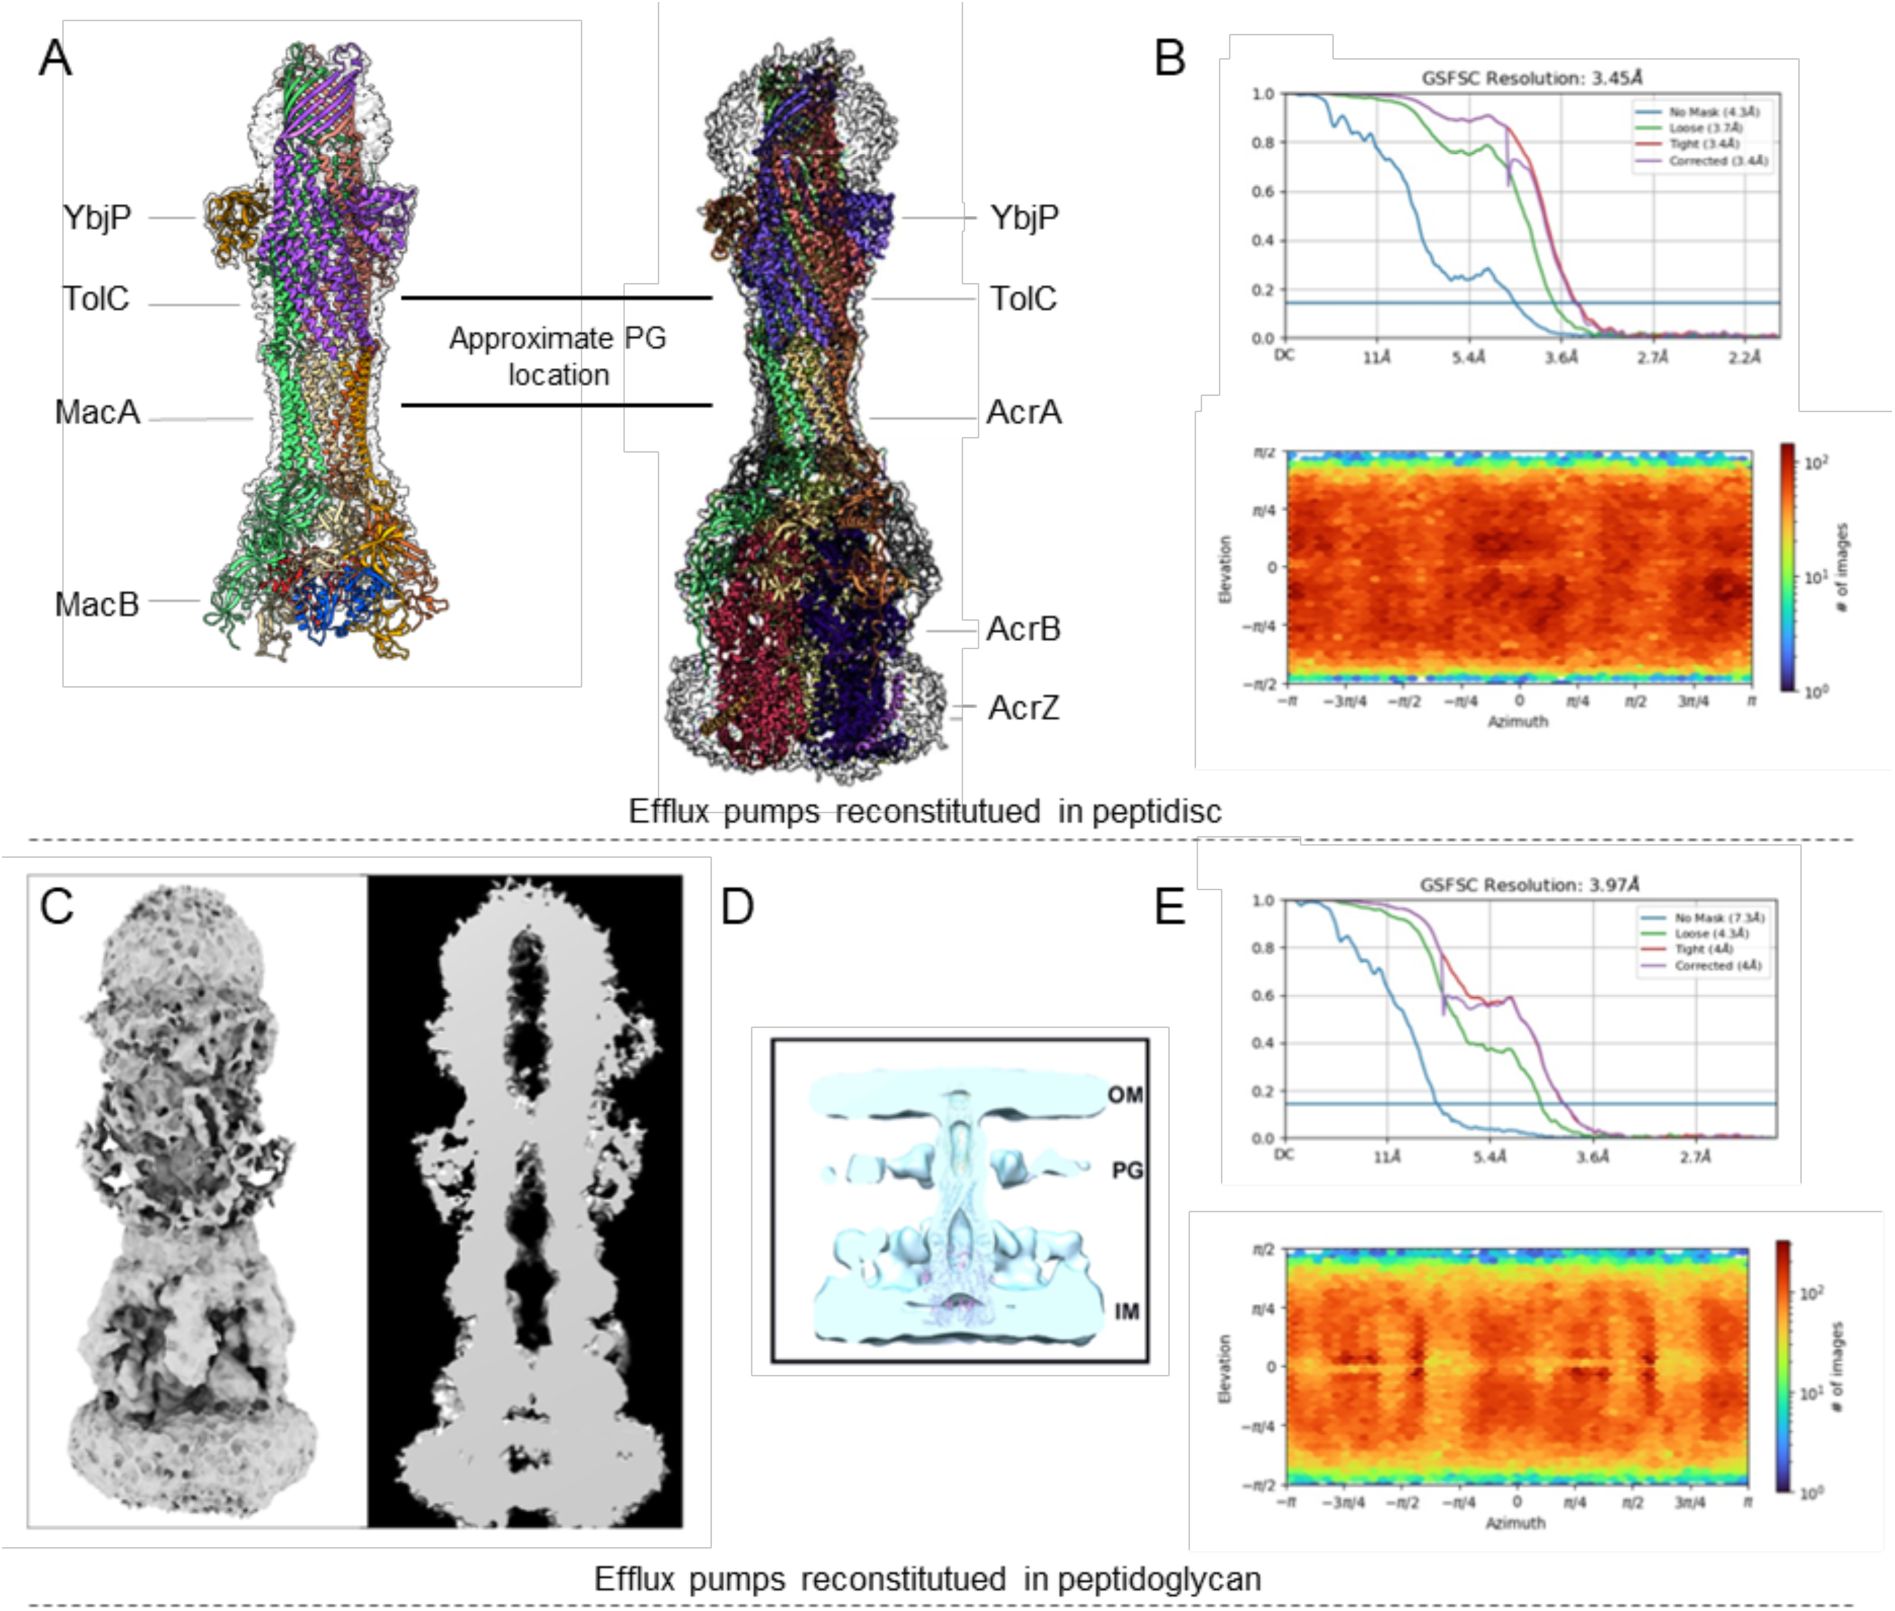
YbjP binds at the same position in the AcrABZ-TolC and MacAB-TolC tripartite pumps and may not interact with peptidoglycan.
(A) Cryo-EM maps and models of MacAB-TolC-YbjP and AcrABZ-TolC-YbjP reconstituted in peptidisc. (B) Fourier shell correlation between half-maps (top) and angular distribution of the particles (bottom) for the AcrABZ-TolC-YbjP dataset. (C) Cryo-EM map of AcrABZ-TolC-YbjP reconstituted in peptidoglycan. (D) Peptidoglycan location based on the cryo-ET map described by Shi et al., 2019. A similar location was reported by Gumbert et al., 2020. (E) Fourier Shell Correlation between half-maps (top) and angular distribution plot of the particles (bottom). Collection statistics for the AcrABZ-TolC-YbjP complex reconstituted in peptidisc and in peptidoglycan are listed in Supplementary Table S2.
The cladogram of TolC (IPR010130) in Pseudomonadota.
The sequence that showed the highest pairwise similarity to E. coli TolC in each organism is selected. None of these TolC proteins contain any lipoylation signal.

Structural comparison of TolC3–YbjP3 and TolC3–SlyB11.
(A) AlphaFold structure of TolC-SlyB11 with 30 palmitic acid (PLM) and 30 oleic acid (OLA) molecules. The model is colored by pLDDT score. The signal peptides of TolC and SlyB are cleaved. (B) PAE plot of TolC3–SlyB11 with 30 PLM and 30 OLA molecules. (C) Overlay of TolC3–YbjP3 structure and TolC3–SlyB11 AlphaFold structure. The lipoylation in YbjP is displayed as green spheres.

Cryo-EM data and refinement for MacAB-TolC-YbjP
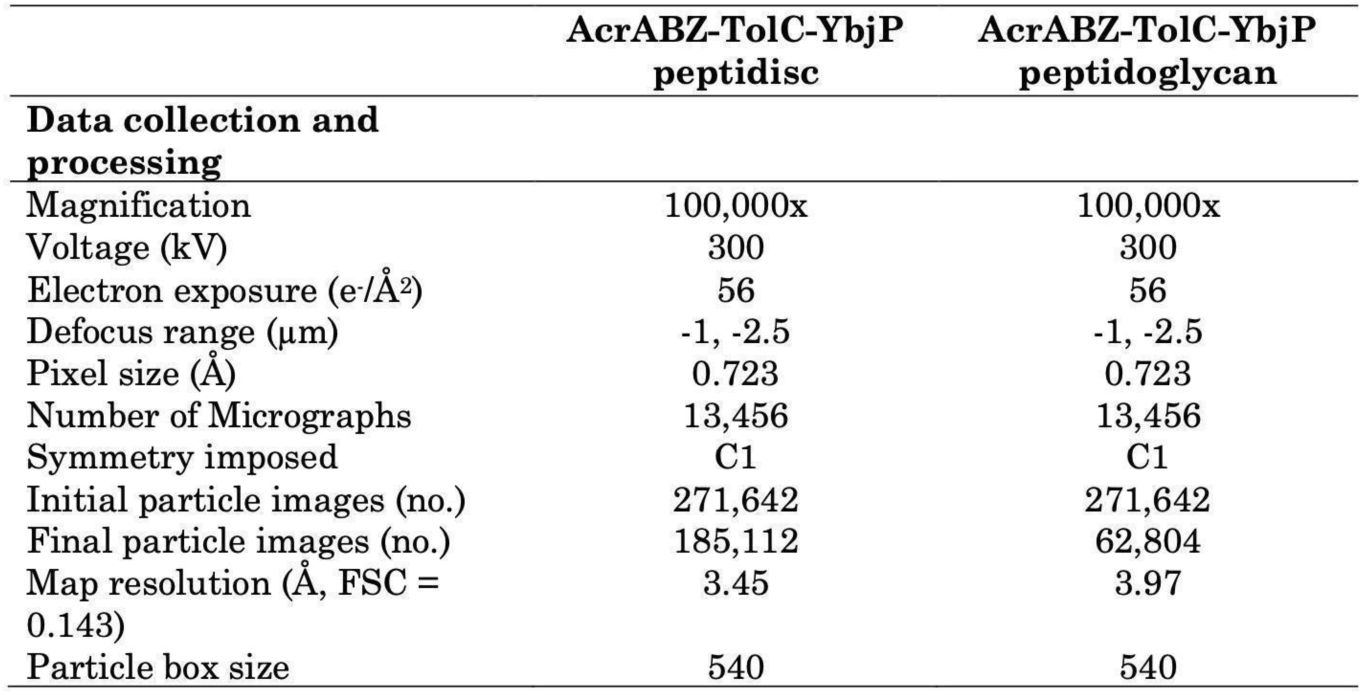
Cryo-EM analysis of AcrABZ-TolC-YbjP
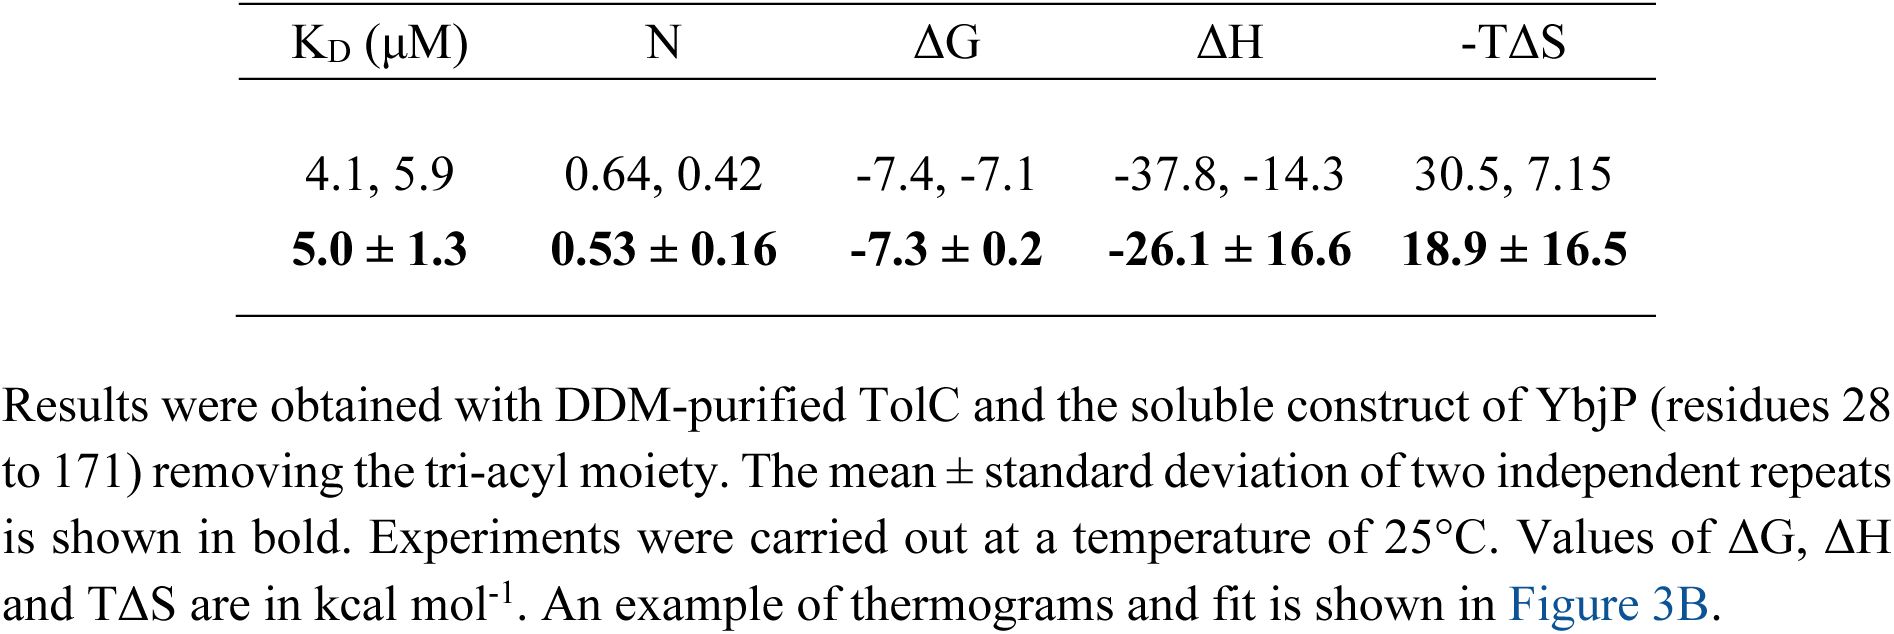
ITC parameters for the TolC-YbjPs interaction