Peer review process
Revised: This Reviewed Preprint has been revised by the authors in response to the previous round of peer review; the eLife assessment and the public reviews have been updated where necessary by the editors and peer reviewers.
Read more about eLife’s peer review process.Editors
- Reviewing EditorDavid Paz-GarciaCentro de Investigaciones Biológicas del Noroeste (CIBNOR), La Paz, Mexico
- Senior EditorGeorge PerryPennsylvania State University, University Park, United States of America
Reviewer #1 (Public Review):
Wang, He et al have constructed comprehensive single nucleus atlas for the gills of the deep sea Bathymodioline mussels, which possess intracellular symbionts that provide a key source of carbon and allow them to live in these extreme environments. They provide annotations of the different cell states within the gills, shedding light on how multiple cell types cooperate to give rise to the emergent functions of the composite tissues and the gills as a whole. They pay special attention to characterizing the bacteriocyte cell populations and identifying sets of genes that may play a role in their interaction with the symbiotes.
Wang, He et al sample mussels from 3 different environments: animals from their native methane rich environment, animals transplanted to a methane-poor environment to induce starvation and animals that have been starved in the methane-poor environment and then moved back to the methane-rich environment. They demonstrated that starvation had the biggest impact on bacteriocyte transcriptomes. They hypothesize that the up-regulation of genes associated with lysosomal digestion leads to the digestion of the intracellular symbiont during starvation, while the non-starved and reacclimated groups more readily harvest the nutrients from symbiotes without destroying them. Further work exploring the differences in symbiote populations between ecological conditions will further elucidate the dynamic relationship between host and symbiote. This will help disentangle specific changes in transcriptomic state that are due to their changing interactions with the symbiotes from changes associated with other environmental factors.
This paper makes available a high quality dataset that is of interest to many disciplines of biology. The unique qualities of this non-model organism and collection of conditions sampled make it of special interest to those studying deep sea adaptation, the impact of environmental perturbation on Bathymodioline mussels populations, and intracellular symbiotes. The authors also use a diverse array of tools to explore and validate their data.
Reviewer #2 (Public Review):
Wang, He et al. shed insight into the molecular mechanisms of deep-sea chemosymbiosis at the single-cell level. They do so by producing a comprehensive cell atlas of the gill of Gigantidas platifrons, a chemosymbiotic mussel that dominates the deep-sea ecosystem. They uncover novel cell types and find that the gene expression of bacteriocytes, the symbiont-hosting cells, supports two hypotheses of host-symbiont interactions: the "farming" pathway, where symbionts are directly digested, and the "milking" pathway, where nutrients released by the symbionts are used by the host. They perform an in situ transplantation experiment in the deep sea and reveal transitional changes in gene expression that support a model where starvation stress induces bacteriocytes to "farm" their symbionts, while recovery leads to the restoration of the "farming" and "milking" pathways.
A major strength of this study includes the successful application of advanced single nucleus techniques to a non-model, deep sea organism that remains challenging to sample. I also applaud the authors for performing an in situ transplantation experiment in a deep sea environment. From gene expression profiles, the authors deftly provide a rich functional description of G. platifrons cell types that is well-contextualized within the unique biology of chemosymbiosis. These findings offer significant insight into the molecular mechanisms of deep-sea host-symbiont ecology, and will serve as a valuable resource for future studies into the striking biology of G. platifrons.
The authors' conclusions are generally well-supported by their results. However, I recognize that the difficulty of obtaining deep-sea specimens may have impacted experimental design and no replicates were sampled.
It is notable that the Fanmao cells were much more sparsely sampled. It appears that fewer cells were sequenced, resulting in the Starvation and Reconstitution conditions having 2-3x more cells after doublet filtering. These discrepancies also are reflected in the proportion of cells that survived QC, suggesting a distinction in quality or approach. However, the authors provide clear and sufficient evidence via bootstrapping that batch effects between the three samples are negligible. While batch effect does not appear to have affected gene expression profiles, the proportion of cell types may remain sensitive to sampling techniques, and thus interpretation of Fig. S12 must be approached with caution.
Reviewer #3 (Public Review):
Wang et al. explored the unique biology of the deep-sea mussel Gigantidas platifrons to understand fundamental principles of animal-symbiont relationships. They used single-nucleus RNA sequencing and validation and visualization of many of the important cellular and molecular players that allow these organisms to survive in the deep-sea. They demonstrate that a diversity of cell types that support the structure and function of the gill including bacteriocytes, specialized epithelial cells that host sulfur-oxidizing or methane-oxidizing symbionts as well as a suite of other cell types including supportive cells, ciliary, and smooth muscle cells. By performing experiments of transplanting mussels from one habitat which is rich in methane to methane-limited environments, the authors showed that starved mussels may consume endosymbionts versus in methane-rich environments upregulated genes involved in glutamate synthesis. These data add to the growing body of literature that organisms control their endosymbionts in response to environmental change.
The conclusions of the data are well supported. The authors adapted a technique that would have been technically impossible in their field environment by preserving the tissue and then performing nuclear isolation after the fact. The use of single-nucleus sequencing opens the possibility of new cellular and molecular biology that is not possible to study in the field. Additionally, the in-situ data (both WISH and FISH) are high-quality and easy to interpret. The use of cell-type-specific markers along with a symbiont-specific probe was effective. Finally, the SEM and TEM were used convincingly for specific purposes in the case of showing the cilia that may support water movement.
The one particular area for future exploration surrounds the concept of a proliferative progenitor population within the gills. The authors recover molecular markers for these putative populations and additional future work will uncover if these are indeed proliferative cells contribute to symbiont colonization.
Overall the significance of this work is identifying the relationship between symbionts and bacteriocytes and how these host bacteriocytes modulate their gene expression in response to environmental change. It will be interesting to see how similar or different these data are across animal phyla. For instance, the work of symbiosis in cnidarians may converge on similar principles of there may be independent ways in which organisms have been able to solve these problems.
Author response:
The following is the authors’ response to the original reviews.
eLife assessment
This study provides an important cell atlas of the gill of the mussel Gigantidas platifrons using a single nucleus RNA-seq dataset, a resource for the community of scientists studying deep sea physiology and metabolism and intracellular host-symbiont relationships. The work, which offers solid insights into cellular responses to starvation stress and molecular mechanisms behind deep-sea chemosymbiosis, is of relevance to scientists interested in host-symbiont relationships across ecosystems.
Public Reviews:
Reviewer #1 (Public Review):
Wang et al have constructed a comprehensive single nucleus atlas for the gills of the deep sea Bathymodioline mussels, which possess intracellular symbionts that provide a key source of carbon and allow them to live in these extreme environments. They provide annotations of the different cell states within the gills, shedding light on how multiple cell types cooperate to give rise to the emergent functions of the composite tissues and the gills as a whole. They pay special attention to characterizing the bacteriocyte cell populations and identifying sets of genes that may play a role in their interaction with the symbiotes.
Wang et al sample mussels from 3 different environments: animals from their native methane-rich environment, animals transplanted to a methane-poor environment to induce starvation, and animals that have been starved in the methane-poor environment and then moved back to the methane-rich environment. They demonstrated that starvation had the biggest impact on bacteriocyte transcriptomes. They hypothesize that the upregulation of genes associated with lysosomal digestion leads to the digestion of the intracellular symbiont during starvation, while the non-starved and reacclimated groups more readily harvest the nutrients from symbiotes without destroying them.
Strengths:
This paper makes available a high-quality dataset that is of interest to many disciplines of biology. The unique qualities of this non-model organism and the collection of conditions sampled make it of special interest to those studying deep sea adaptation, the impact of environmental perturbation on Bathymodioline mussels populations, and intracellular symbiotes. The authors do an excellent job of making all their data and analysis available, making this not only an important dataset but a readily accessible and understandable one.
The authors also use a diverse array of tools to explore their data. For example, the quality of the data is augmented by the use of in situ hybridizations to validate cluster identity and KEGG analysis provides key insights into how the transcriptomes of bacteriocytes change.
The authors also do a great job of providing diagrams and schematics to help orient non-mussel experts, thereby widening the audience of the paper.
Thank the reviewer for the valuable feedback on our study. We are grateful that the reviewers found our work to be interesting and we appreciate their thorough evaluation of our research. Their constructive comments will be considered as we continue to develop and improve our study.
Weaknesses:
One of the main weaknesses of this paper is the lack of coherence between the images and the text, with some parts of the figures never being referenced in the body of the text. This makes it difficult for the reader to interpret how they fit in with the author's discussion and assess confidence in their analysis and interpretation of data. This is especially apparent in the cluster annotation section of the paper.
We appreciate the feedback and suggestions provided by the reviewer, and we have revised our manuscript to make it more accessible to general audiences.
Another concern is the linking of the transcriptomic shifts associated with starvation with changes in interactions with the symbiotes. Without examining and comparing the symbiote population between the different samples, it cannot be concluded that the transcriptomic shifts correlate with a shift to the 'milking' pathway and not other environmental factors. Without comparing the symbiote abundance between samples, it is difficult to disentangle changes in cell state that are due to their changing interactions with the symbiotes from other environmental factors.
We are grateful for the valuable feedback and suggestions provided by the reviewer. Our keen interest lies in understanding symbiont responses, particularly at the single-cell level. However, it's worth noting that existing commercial single-cell RNA-seq technologies rely on oligo dT priming for reverse transcription and barcoding, thus omitting bacterial gene expression information from our dataset. We hope that advancements in technology will soon enable us to perform an integrated analysis encompassing both host and symbiont gene expression.
Additionally, conclusions in this area are further complicated by using only snRNA-seq to study intracellular processes. This is limiting since cytoplasmic mRNA is excluded and only nuclear reads are sequenced after the organisms have had several days to acclimate to their environment and major transcriptomic shifts have occurred.
We appreciate the comments shared by the reviewer and agree that scRNA-seq provides more comprehensive transcriptional information by targeting the entire mRNA of the cell. However, we would like to highlight that snRNA-seq has some unique advantages over scRNA-seq. Notably, snRNA-seq allows for simple snap-freezing of collected samples, facilitating easier storage, particularly for samples obtained during field trips involving deep-sea animals and other ecologically significant non-model animal samples. Additionally, unlike scRNA-seq, snRNA-seq eliminates the need for tissue dissociation, which often involves prolonged enzymatic treatment of deep-sea animal tissue/cells under atmospheric pressure. This process can potentially lead to the loss of sensitive cells or alterations in gene expression. Moreover, snRNA-seq procedures disregard the size and shape of animal cells, rendering it a superior technology for constructing the cell atlas of animal tissues. Consequently, we assert that snRNA-seq offers flexibility and represents a suitable choice for the research objects of our current research.
Reviewer #2 (Public Review):
Wang, He et al. shed insight into the molecular mechanisms of deep-sea chemosymbiosis at the single-cell level. They do so by producing a comprehensive cell atlas of the gill of Gigantidas platifrons, a chemosymbiotic mussel that dominates the deep-sea ecosystem. They uncover novel cell types and find that the gene expression of bacteriocytes, the symbiont-hosting cells, supports two hypotheses of host-symbiont interactions: the "farming" pathway, where symbionts are directly digested, and the "milking" pathway, where nutrients released by the symbionts are used by the host. They perform an in situ transplantation experiment in the deep sea and reveal transitional changes in gene expression that support a model where starvation stress induces bacteriocytes to "farm" their symbionts, while recovery leads to the restoration of the "farming" and "milking" pathways.
A major strength of this study includes the successful application of advanced single-nucleus techniques to a non-model, deep-sea organism that remains challenging to sample. I also applaud the authors for performing an in situ transplantation experiment in a deep-sea environment. From gene expression profiles, the authors deftly provide a rich functional description of G. platifrons cell types that is well-contextualized within the unique biology of chemosymbiosis. These findings offer significant insight into the molecular mechanisms of deep-sea host-symbiont ecology, and will serve as a valuable resource for future studies into the striking biology of G. platifrons.
The authors' conclusions are generally well-supported by their results. However, I recognize that the difficulty of obtaining deep-sea specimens may have impacted experimental design. In this area, I would appreciate more in-depth discussion of these impacts when interpreting the data.
Thank the reviewer for their valuable feedback on our study. We're grateful that the reviewers found our work interesting, and we appreciate their thorough evaluation of our research. We'll consider their constructive comments as we continue to develop and improve our study.
Because cells from multiple individuals were combined before sequencing, the in situ transplantation experiment lacks clear biological replicates. This may potentially result in technical variation (ie. batch effects) confounding biological variation, directly impacting the interpretation of observed changes between the Fanmao, Reconstitution, and Starvation conditions. It is notable that Fanmao cells were much more sparsely sampled. It appears that fewer cells were sequenced, resulting in the Starvation and Reconstitution conditions having 2-3x more cells after doublet filtering. It is not clear whether this is due to a technical factor impacting sequencing or whether these numbers are the result of the unique biology of Fanmao cells. Furthermore, from Table S19 it appears that while 98% of Fanmao cells survived doublet filtering, only ~40% and ~70% survived for the Starvation and Reconstitution conditions respectively, suggesting some kind of distinction in quality or approach.
There is a pronounced divergence in the relative proportions of cells per cell type cluster in Fanmao compared to Reconstitution and Starvation (Fig. S11). This is potentially a very interesting finding, but it is difficult to know if these differences are the expected biological outcome of the experiment or the fact that Fanmao cells are much more sparsely sampled. The study also finds notable differences in gene expression between Fanmao and the other two conditions- a key finding is that bacteriocytes had the largest Fanmao-vs-starvation distance (Fig. 6B). But it is also notable that for every cell type, one or both comparisons against Fanmao produced greater distances than comparisons between Starvation and Reconstitution (Fig. 6B). Again, it is difficult to interpret whether Fanmao's distinctiveness from the other two conditions is underlain by fascinating biology or technical batch effects. Without biological replicates, it remains challenging to disentangle the two.
As highlighted by the reviewer, our experimental design involves pooling multiple biological samples within a single treatment state before sequencing. We acknowledge the concern regarding the absence of distinct biological replicates and the potential impact of batch effects on result interpretation. While we recognize the merit of conducting multiple sequencing runs for a single treatment to provide genuine biological replicates, we contend that batch effects may not exert a strong influence on the observed patterns.
In addition, we applied a bootstrap sampling algorithm to assess whether the gene expression patterns within a cluster are more similar than those between clusters. This algorithm involves selecting a portion of cells per cluster and examining whether this subset remains distinguishable from other clusters. Our assumption was that if different samples exhibited distinct expression patterns due to batch effect, the co-assignment probabilities of a cluster would be very low. This expectation was not met in our data, as illustrated in Fig. S2. The lack of significantly low co-assignment probabilities within clusters suggests that batch effects may not exert a strong influence on our results.
Indeed, we acknowledge a noticeable shift in the expression patterns of certain cell types, such as the bacteriocyte. However, this is not universally applicable across all cell types. For instance, the UMAP figure in Fig. 6A illustrates a substantial overlap among basal membrane cell 2 from Fanmao, Starvation, and Reconstitution treatments, and the centroid distances between the three treatments are subtle, as depicted in Fig. 6B. This consistent pattern is also observed in DEPC, smooth muscle cells, and the food groove ciliary cells.
The reviewer also noted variations in the number of cells per treatment. Specifically, Fanmao sequencing yielded fewer than 10 thousand cells, whereas the other two treatments produced 2-3 times more cells after quality control (QC). It is highly probable that the technician loaded different quantities of cells into the machine for single-nucleus sequencing—a not uncommon occurrence in this methodology. While loading more cells may increase the likelihood of doublets, it is crucial to emphasize that this should not significantly impact the expression patterns post-QC. It's worth noting that overloading samples has been employed as a strategic approach to capture rare cell types, as discussed in a previous study (reference: 10.1126/science.aay0267).
The reviewer highlighted the discrepancy in cell survival rates during the 'doublet filtering' process, with 98% of Fanmao cells surviving compared to approximately 40% and 70% for the Starvation and Reconstitution conditions, respectively. It's important to clarify that the reported percentages reflect the survival of cells through a multi-step QC process employing various filtering strategies.
Post-doublet removal, we filtered out cells with <100 or >2500 genes and <100 or >6000 unique molecular identifiers (UMIs). Additionally, genes with <10 UMIs in each data matrix were excluded. The observed differences in survival rates for Starvation and Reconstitution cells can be attributed to the total volume of data generated in Illumina sequencing. Specifically, we sequenced approximately 91 GB of data for Fanmao, ~196 GB for Starvation, and ~249 GB for Reconstitution. As a result, the qualified data obtained for Starvation and Reconstitution conditions was only about twice that of Fanmao due to the limited data volume.
The reviewer also observed a divergence in the relative proportions of cells per cell type cluster in Fanmao compared to Reconstitution and Starvation, as depicted in Fig. S1. This discrepancy may hold true biological significance, presenting a potentially intriguing finding. However, our discussion on this pattern was rather brief, as we acknowledge that the observed differences could be influenced by the sample preparation process for dissection and digestion. It is crucial to consider that cutting a slightly different area during dissection may result in variations in the proportion of cells obtained. While we recognize the potential impact of this factor, we do not think that the sparsity of sampling alone could significantly affect the relative proportions of cells per cell type.
In conclusion, we acknowledge the reviewer's suggestion that sequencing multiple individual samples per treatment condition would have been ideal, rather than pooling them together. However, the homogenous distribution observed in UMAP and the consistent results obtained from bootstrap sampling suggest that the impact of batch effects on our analyses is likely not substantial. Additionally, based on our understanding, the smaller number of cells in the Fanmao sample should not have any significant effect on the resulting different proportion of cells or the expression patterns per each cluster.
Reviewer #3 (Public Review):
Wang et al. explored the unique biology of the deep-sea mussel Gigantidas platifrons to understand the fundamental principles of animal-symbiont relationships. They used single-nucleus RNA sequencing and validation and visualization of many of the important cellular and molecular players that allow these organisms to survive in the deep sea. They demonstrate that a diversity of cell types that support the structure and function of the gill including bacteriocytes, specialized epithelial cells that host sulfur-oxidizing or methane-oxidizing symbionts as well as a suite of other cell types including supportive cells, ciliary, and smooth muscle cells. By performing experiments of transplanting mussels from one habitat which is rich in methane to methane-limited environments, the authors showed that starved mussels may consume endosymbionts versus in methane-rich environments upregulated genes involved in glutamate synthesis. These data add to the growing body of literature that organisms control their endosymbionts in response to environmental change.
The conclusions of the data are well supported. The authors adapted a technique that would have been technically impossible in their field environment by preserving the tissue and then performing nuclear isolation after the fact. The use of single-nucleus sequencing opens the possibility of new cellular and molecular biology that is not possible to study in the field. Additionally, the in-situ data (both WISH and FISH) are high-quality and easy to interpret. The use of cell-type-specific markers along with a symbiont-specific probe was effective. Finally, the SEM and TEM were used convincingly for specific purposes in the case of showing the cilia that may support water movement.
We appreciate the valuable feedback provided by the reviewer on our study. It is encouraging to know that our work was found to be interesting and that they conducted a thorough evaluation of our research. We will take their constructive comments into account as we strive to develop and enhance our study. Thank the reviewer for all the input.
The one particular area for clarification and improvement surrounds the concept of a proliferative progenitor population within the gill. The authors imply that three types of proliferative cells within gills have long been known, but their study may be the first to recover molecular markers for these putative populations. The markers the authors present for gill posterior end budding zone cells (PEBZCs) and dorsal end proliferation cells (DEPCs) are not intuitively associated with cell proliferation and some additional exploration of the data could be performed to strengthen the argument that these are indeed proliferative cells. The authors do utilize a trajectory analysis tool called Slingshot which they claim may suggest that PEBZCs could be the origin of all gill epithelial cells, however, one of the assumptions of this analysis is that differentiated cells are developed from the same precursor PEBZC population.
However, these conclusions do not detract from the overall significance of the work of identifying the relationship between symbionts and bacteriocytes and how these host bacteriocytes modulate their gene expression in response to environmental change. It will be interesting to see how similar or different these data are across animal phyla. For instance, the work of symbiosis in cnidarians may converge on similar principles or there may be independent ways in which organisms have been able to solve these problems.
We are grateful for the valuable comments and suggestions provided by the reviewer. All suggestions have been carefully considered, and the manuscript has been revised accordingly. We particularly value the reviewer's insights regarding the characterization of the G. platifrons gill proliferative cell populations. In a separate research endeavor, we have conducted experiments utilizing both cell division and cell proliferation markers on these proliferative cell populations. While these results are not incorporated into the current manuscript, we would be delighted to share our preliminary findings with the reviewer. Our preliminary results indicate that the proliferative cell populations exhibit positivity for cell proliferation markers and contain a significant number of mitotic cells..
Recommendations for the authors:
Reviewer #1 (Recommendations For The Authors):
Further experiments are needed to link the changes in transcriptomes of Bathymodioline mussels in the different environmental conditions to changes in their interactions with symbiotes. For example, quantifying the abundance and comparing the morphology of symbiotes between the environmental conditions would lend much support for shifting between milking and farming strategies. Without analyzing the symbiotes and comparing them across populations, it is difficult to comment on the mechanisms of interactions between symbiotes and the hosts. Without this analysis, this data is better suited towards comments about the general effect of environmental perturbation and stress on gene expression in these mussels.
We appreciate the reviewer’s comments. We are also very curious about the symbiont responses, especially at the single-cell level. However, all the current commercial single-cell RNA-seq technologies are based on oligo dT priming for reverse transcription and barcoding. Therefore, the bacterial gene expression information is omitted from our dataset. Hopefully, with the development of technology, we could conduct an integrated analysis of both host and symbiont gene expression soon.
Additionally, clarification is needed on which types of symbiotes are being looked at. Are they MOX or SOX populations? Are they homogenous? What are the concentrations of sulfur at the sampled sites?
We thank you for your valuable comments and suggestions. Gigantidas platifrons harbors a MOX endosymbiont population characterized by a single 16S rRNA phylotype. We apologize for any confusion resulting from our previous wording. To clarify, we have revised lines 57-59 of our introduction
In the text and images, consider using standardized gene names and leaving out the genome coordinates. This would greatly help with readability. Also, be careful to properly follow gene naming and formatting conventions (ie italicizing gene names and symbols).
We appreciate the reviewer’s insightful comments. In model animals, gene nomenclature often stems from forward genetic approaches, such as the identification of loss-of-function mutants. These gene names, along with their protein products, typically correspond to unique genome coordinates. Conversely, in non-model invertebrates (e.g., Gigantidas platifrons of present study), gene prediction relies on a combination of bioinformatics methods, including de novo prediction, homolog-based prediction, and transcriptomics mapping. Subsequently, the genes are annotated by identifying their best homologs in well-characterized databases. Given that different genes may encode proteins with similar annotated functions, we chose to include both the gene ID (genome coordinates) and the gene name in our manuscript. This dual labeling approach ensures that our audience receives accurate and comprehensive information regarding gene identification and annotation.
Additionally, extending KEGG analysis to the atlas annotation section could help strengthen the confidence of annotations. For example, when identifying bacteriocyte populations, the functional categories of individual marker genes (lysosomal proteases, lysosomal traffic regulators, etc) are used to justify the annotation. Presenting KEGG support that these functional categories are upregulated in this population relative to others would help further support how you characterize this cluster by showing it's not just a few specific genes that are enriched in this cell group, but rather an overall functionality.
We appreciate the valuable suggestion provided by the reviewer. Indeed, incorporating KEGG analysis into the atlas annotation section could further enhance the confidence in our annotations. However, in our study, we encountered some limitations that impeded us from conducting a comprehensive KEGG enrichment analysis.
Firstly, the number of differentially expressed genes (DEGs) that we identified for certain cell populations was relatively small, making it challenging to meet the threshold required for meaningful KEGG enrichment analysis. For instance, among the 97 marker genes identified for the Bacteriocyte cluster, only two genes, Bpl_scaf_59648-4.5 (lysosomal alpha-glucosidase-like) and Bpl_scaf_52809-1.6 (lysosomal-trafficking regulator-like isoform X1), were identified as lysosomal genes. To generate reliable KEGG enrichments, a larger number of genes is typically required.
Secondly, single-nucleus sequencing, as employed in our study, tends to yield a relatively smaller number of genes per cell compared to bulk RNA sequencing. This limited gene yield can make it challenging to achieve sufficient gene representation for rigorous KEGG enrichment analysis.
Furthermore, many genes in the genome still lack comprehensive annotation, both in terms of KEGG and GO annotations. In our dataset, out of the 33,584 genes obtained through single-nuclei sequencing, 26,514 genes have NO KEGG annotation, and 25,087 genes have NO GO annotation. This lack of annotations further restricts the comprehensive application of KEGG analysis in our study.
The claim that VEPCs are symbiote free is not demonstrated. Additional double in situs are needed to show that markers of this cell type localize in regions free of symbiotes.
We appreciate your comments and suggestions. In Figure 5B, our results demonstrate that the bacteriocytes (green fluorescent signal) are distant from the VEPCs, which are located around the tip of the gill filaments (close to the food groove). We have revised our Figure 5B to make it clear.
Additionally, it does not seem like trajectory analysis is appropriate for these sampling conditions. Generally, to create trajectories confidently, more closely sampled time points are needed to sufficiently parse out the changes in expression. More justification is needed for the use of this type of analysis here and a discussion of the limitations should be mentioned, especially when discussing the hypotheses relating to PEBZCs, VEPCs, and DEPCs.
We greatly appreciate your thoughtful commentary. It is important to acknowledge that in the context of a developmental study, incorporating more closely spaced time points indeed holds great value. In our ongoing project investigating mouse development, for instance, we have implemented time points at 24-hour intervals. However, in the case of deep-sea adult animals, we hypothesized a slower transcriptional shift in such extreme environment, which led us to opt for a time interval of 3-7 days. Examining the differential expression profiles among the three treatments, we observed that most cell types exhibited minimal changes in their expression profiles. For the cell types strongly impacted by in situ transplantation, their expression profiles per cell type still exhibited highly overlap in the UMAP analysis (Figure 6a), thus enabling meaningful comparisons. Nevertheless, we recognize that our sampling strategy may not be flawless. Additionally, the challenging nature of conducting in situ transplantation in 1000-meter depths limited the number of sampling occasions available to us. We sincerely appreciate your input and understanding.
Finally, more detail should be added on the computational methods used in this paper. For example, the single-cell genomics analysis protocol should be expanded on so that readers unfamiliar with BD single-cell genomics handbooks could replicate the analysis. More detail is also needed on what criteria and cutoffs were used to calculate marker genes. Also, please be careful to cite the algorithms and software packages mentioned in the text.
Acknowledged, thank you for highlighting this. In essence, the workflow closely resembles that of the 10x Genomics workflow (despite the use of a different software, i.e., Cell Ranger). We better explain the workflow below, and also noting that this information may no longer be relevant for newer users of BD or individuals who are not acquainted with BD, given that the workflow underwent a complete overhaul in the summer of 2023.
References to lines
Line 32: typo "..uncovered unknown tissue heterogeny" should read "uncovering" or "and uncovered")
Overall abstract could include more detail of findings (ex: what are the "shifts in cell state" in line 36 that were observed)
We apologize for the mistakes, and have revised the manuscript accordingly.
Line 60: missing comma "...gill filament structure, but also"
We apologize for the mistakes, and have revised the manuscript accordingly.
Line 62-63: further discussion here, or in the relevant sections of the specific genes identified in the referenced bulk RNA-seq project could help strengthen confidence in annotation
We appreciate the comment, and have revised the manuscript accordingly.
Line 112: what bootstrapping strategy? Applied to what?
This is a bootstrap sampling algorithm to assess the robustness of each cell cluster developed in a recent biorxiv paper. (Singh, P. & Zhai, Y. Deciphering Hematopoiesis at single cell level through the lens of reduced dimensions. bioRxiv, 2022.2006.2007.495099 (2022). https://doi.org:10.1101/2022.06.07.495099)
Lines 127-129: What figures demonstrate the location of the inter lamina cells? Are there in situs that show this?
We apologize for any errors; the referencing of figures in the manuscript has been revised for clarity
Lines 185-190: does literature support these as markers of SMCs? Are they known smooth muscle markers in other systems?
We characterized the SMCs by the expression of LDL-associated protein, angiotensin-converting enzyme-like protein, and the "molecular spring" titin-like protein, all of which are commonly found in human vascular smooth muscle cells. Based on this analysis, we hypothesize that these cells belong to the smooth muscle cell category.
Line 201: What is meant by "regulatory roles"?
In this context, we are discussing the expression of genes encoding regulatory proteins, such as SOX transcription factors and secreted-frizzled proteins.
Line 211: which markers disappeared? What in situs show this?
We apologize for the mistakes, and have revised the manuscript accordingly.
Line 211: typo, "role" → "roll"
We apologize for the mistakes, and have revised the manuscript accordingly.
Line 214: what are these "hallmark genes"
We apologize for the mistakes, here we are referring to the genes listed in figure 4B. We have revised the manuscript accordingly.
Line 220: are there meristem-like cells in metazoans? If so, this would be preferable to a comparison with plants.
In this context, we are discussing the morphological characteristics of gill proliferative cell populations found in filibranch bivalves. These populations, namely PEPC, VEPC, and DEPC, consist of cells exhibiting morphological traits akin to those of plant cambial-zone meristem cells. These cells typically display small, round shapes with a high nucleus-to-plasma ratio. We acknowledge that while these terms are utilized in bivalve studies (citations below), they lack the robust support seen in model systems backed by molecular biology evidences. The present snRNA-seq data, however, may offer valuable cell markers for future comprehensive investigations.
Leibson, N. L. & Movchan, O. T. Cambial zones in gills of Bivalvia. Mar. Biol. 31, 175-180 (1975). https://doi.org:10.1007/BF00391629
Wentrup, C., Wendeberg, A., Schimak, M., Borowski, C. & Dubilier, N. Forever competent: deep-sea bivalves are colonized by their chemosynthetic symbionts throughout their lifetime. Environ. Microbiol. 16, 3699-3713 (2014). https://doi.org:10.1111/1462-2920.12597
Cannuel, R., Beninger, P. G., McCombie, H. & Boudry, P. Gill Development and its functional and evolutionary implications in the blue mussel Mytilus edulis (Bivalvia: Mytilidae). Biol. Bull. 217, 173-188 (2009). https://doi.org:10.1086/BBLv217n2p173
Line 335: what is slingshot trajectory analysis? Does this differ from the pseudotime analysis?
Slingshot is an algorithm that uses the principal graph of the cells to infer trajectories. It models trajectories as curves on the principal graph, capturing the progression and transitions between different cellular states.
Both Slingshot and pseudotime aim to infer cellular trajectories. Slingshot focuses on capturing branching patterns which is fully compatible with the graph generated using dimensionality reduction such as UMAP and PHATE, while pseudotime analysis aims to order cells along a continuous trajectory. It does not rely on dimensionality reduction graphs. We used both in the MS for different purposes.
Line 241: introduce FISH methodology earlier in the paper, when in situ images are first referenced
We appreciate the comment, and have revised the manuscript accordingly.
Line 246-249: can you quantify the decrease in signal or calculate the concentration of symbiotes in the cells? Was 5C imaged whole? This can impact the fluorescent intensity in tissues of different thicknesses.
We appreciate your comment. In Figure 5C, most of the typical gill filament region is visible (the ventral tip of the gill filament, and the mid part of the gill filament) except for the dorsal end. The gill filament of bathymodioline mussels exhibits a simple structure: a single layer of bacteriocytes grow on the basal membrane. Consequently, the gill slices have a fairly uniform thickness (with two layers of bacteriocytes and one layer of interlamina cells in between), minimizing any potential impact on fluorescent intensity. As of now, detailed quantification of intracellular symbionts may necessitate continuous TEM or ultra-resolution confocal sections to 3D reconstruct the bacteriocytes, which may exceed the scope of the current study. Therefore, fluorescent intensity remains the only method available to us for estimating bacterial density/distribution across the gill filament.
Line 249: What is meant by 'environmental gradient?'
Here we are refereeing the gases need for symbiont’s chemosynthesis. We have revised the manuscript to make it clear.
Lines 255-256: Were the results shown in the TEM images previously known? Not clear what novel information is conveyed in images Fig 5 C and D
In the Fig 5 C and D, we’ve delivered a high-quality SEM TEM image of a typical bacteriocyte, showcasing its morphology and subcellular machinery with clarity. These electron microscopy images offer the audience a comprehensive introduction to the cellular function of bacteriocytes. Additionally, they serve as supportive evidence for the bacteriocytes' snRNA-seq data.
Line 295-296: Can you elaborate on what types of solute carrier genes have been shown to be involved with symbioses?
We appreciate the comment, and have revised the manuscript accordingly. The putative functions of the solute carriers could be found in Figure 5I.
Line 297-301: Which genes from the bulk RNA-seq study? Adding more detail and references in cluster annotation would help readers better understand the justifications.
We appreciate the comment, and have revised the manuscript accordingly.
Line 316 -322: Can you provide the values of the distances?
We also provide values in the main text, in addition to the Fig6b. We also provide a supplementary Table (Supplementary Table S19).
Line 328: What are the gene expression patterns?
We observed genes that are up- and down-regulated in Starvation and reconstitution.
LIne 334-337: A visualization of the different expression levels of the specific genes in clusters between sites might be helpful to demonstrate the degree of difference between sites.
We have prepared a new supplementary file showing the different expression levels.
Line 337: Citation needed
We appreciate the comment. Here, we hypothesize the cellular responds based on the gene’s function and their expression patterns.
Line 402-403: Cannot determine lineages from data presented. Need lineage tracing over time to determine this
We acknowledge the necessity of conducting lineage tracing over time to validate this hypothesis. Nonetheless, in practical terms, it is difficult to obtain samples for testing this. Perhaps, it is easier to use their shallow sea relatives to test this hypothesis. However, in practice, it is very difficult.
413-414: What are the "cell-type specific responses to environmental change"? It could be interesting to present these results in the "results and discussion" section
These results are shown in Supplementary Figure S8.
Line 419-424: Sampling details might go better earlier on in the paper, when the sampling scheme is introduced.
We appreciate the comments. Here, we are discussing the limitations of our current study, not sampling details.
Line 552: What type of sequencing? Paired end? How long?
We conducted 150bp paired-end sequencing.
556-563: More detail here would be useful to readers not familiar with the BD guide. Also be careful to cite the software used in analysis!
The provided guide and handbook elucidate the intricacies of gene name preparation, data alignment to the genome, and the generation of an expression matrix. It is worth mentioning that we relied upon outdated versions of the aforementioned resources during our data analysis phase, as they were the only ones accessible to us at the time. However, we have since become aware of a newer pipeline available this year, rendering the information presented here of limited significance to other researchers utilizing BD.
Many thanks for your kind reminding. We have now included a reference for STAR. All other software was cited accordingly. There are no scholarly papers or publications to refer to for the BD pipeline that we can cite.
Line 577-578: How was the number of clusters determined? What is meant by "manually combine the clusters?" If cells were clustered by hand, more detail on the method is needed, as well as direct discussion and justification in the body of the paper.
It would be more appropriate to emphasize the determination of cell types rather than clusters. The clusters were identified using a clustering function, as mentioned in the manuscript. It's important to note that the clustering function (in our case, the FindClusters function of Seurat) provides a general overview based on diffuse gene expression. Technically speaking, there is no guarantee that one cluster corresponds to a single cell type. Therefore, it is crucial to manually inspect the clustering results to assign clusters to the appropriate cell types. In some cases, multiple clusters may be assigned to the same cell type, while in other cases, a single cluster may need to be further subdivided into two or more cell types or sub-cell types, depending on the specific circumstances.
For studies conducted on model species such as humans or mice, highly and specifically expressed genes within each cluster can be compared to known marker genes of cell types mentioned in previous publications, which generally suffices for annotation purposes. However, in the case of non-model species like Bathymodioline mussels, there is often limited information available about marker genes, making it challenging to confidently assign clusters to specific cell types. In such situations, in situ hybridisation proves to be incredibly valuable. In our study, WISH was employed to visualise the expression and morphology of marker genes within clusters. When WISH revealed the expression of marker genes from a cluster in a specific type of cell, we classified that cluster as a genuine cell type. Moreover, if WISH demonstrated uniform expression of marker genes from different clusters in the same cell, we assigned both clusters to the same cell type.
We expanded the description of the strategy in the Method section.
LIne 690-692: When slices were used, what part of the gill were they taken from?
We sectioned the gill around the mid part which could represent the mature bacteriocytes.
References to figures:
General
Please split the fluorescent images into different channels with an additional composite. It is difficult to see some of the expression patterns. It would also make it accessible to colorblind readers.
We appreciate the comments and suggestions from the reviewer. We have converted our figures to CMYK colour which will help the colorblind audiences to read our paper.
Please provide the number of replicates for each in situ and what proportion of those displayed the presented pattern.
We appreciate the reviewer’s comments. We have explained in the material and methods part of the manuscript.
Figure 2.C' is a fantastic summary and really helps the non-mussel audience understand the results. Adding schematics like this to Figures 3-5 would be helpful as well.
We value the reviewer's comments. We propose that Figures 3K, 4C, and 5A-D could offer similar schematic explanations to assist the audience.
Figure 2:
Figures 2.C-F, 2.C', 2.H-J are not referenced in the text. Adding in discussions of them would help strengthen your discussions on the cluster annotation
We appreciate the reviewer's comments. We have revise the manuscript accordingly.
In 2.B. 6 genes are highlighted in red and said to be shown in in situs, but only 5 are shown.
We apology for the mistake. We didn’t include the result 20639-0.0 WISH in present study. We have changed the label to black.
Figure 3:
FIg 2C-E not mentioned.
We appreciate the reviewer's comments. We have revise the manuscript accordingly.
In 3.B 8 genes are highlighted in red and said to be shown in in situs. Only 6 are.
The result of the WISH were provided in Supplementary Figures S4 and S5.
FIgure 3.K is not referenced in the legend.
We appreciate the comment, and have revised the manuscript accordingly.
Figure 4:
In Figure D, it might be helpful to indicate the growth direction.
We appreciate the comment, and have revised the manuscript accordingly by adding an arrow in panel D to indicate growth direction.
4F: A double in situ with the symbiote marker is needed to demonstrate the nucleolin-like positive cells are symbiote free.
We appreciate the comment. The symbiont free region could be found in Figure 5A.
Figure 5:
In 5.A, quantification of symbiote concentration would help support your conclusion that they are denser around the edges.
We appreciate the comment, as we mentioned above, detailed quantification of intracellular symbionts may necessitate continuous TEM or ultra-resolution confocal sections to 3D reconstruct the bacteriocytes, which may exceed the scope of the current study. Therefore, fluorescent intensity remains the only method available to us for estimating bacterial density/distribution across the gill filament.
In 5.D, the annotation is not clear. Adding arrows like in 5.C would be helpful.
We appreciate the comment, and have revised the manuscript accordingly.
A few genes in 5.F are not mentioned in the paper body when listing other genes. Mentioning them would help provide more support for your clustering.
We appreciate the comment, and have revised the manuscript accordingly.
Is 5.I meant to be color coded with the gene groups from 5.F? Color Coding the gene names, rather than organelles or cellular structures might portray this better and help visually strengthen the link between the diagram and your dot plot.
We appreciate the suggestions. We've experimented with color-coding the gene names, but some colors are less discernible against a white background.
Figure 6:
6.B Is there a better way to visualize this data? The color coding is confusing given the pairwise distances. Maybe heatmaps?
We attempted a heatmap, as shown in the figure below. However, all co-authors agree that a bar plot provides clearer visualization compared to the heatmap. We agree that the color scheme maya be confusing because they use the same color as for individual treatment. So we change the colors.
Author response image 1.
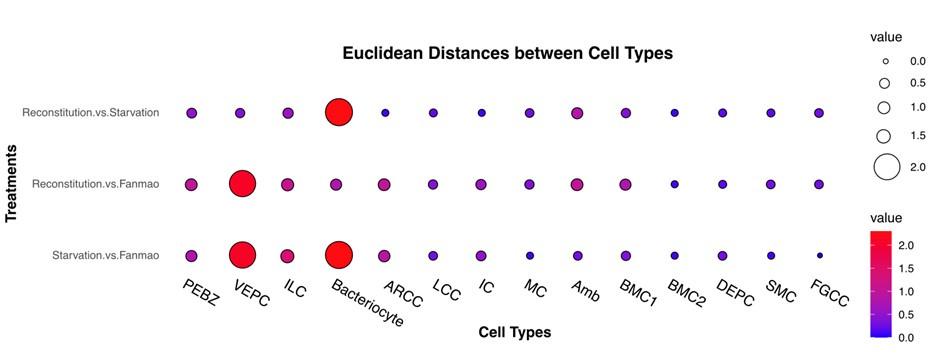
Figure 6.D: Why is the fanmao sample divided in the middle?
Fig6C show that single-cell trajectories include branches. The branches occur because cells execute alternative gene expression programs. Thus, in Fig 6D, we show changes for genes that are significantly branch dependent in both lineages at the same time. Specifically, in cluster 2, the genes are upregulated during starvation but downregulated during reconstitution. Conversely, genes in cluster 1 are downregulated during starvation but upregulated during reconstitution. It's of note that Fig 6D displays only a small subset of significantly branch-dependent genes.
FIgure 6.D: Can you visualize the expression in the same format as in figures 2-5?
We appreciate the comments from the reviewer. As far as we know, this heatmap are the best format to demonstrate this type of gene expression profile.
Supplementary Figure S2:
Please provide a key for the cell type abbreviations
We appreciate the comment, and have added the abbreviations of cell types accordingly.
Supplementary Figures S4 and S5:
What part of the larger images are the subsetted image taken from?
We appreciate the comment, these images were taken from the ventral tip and mid of the gill slices, respectively. We have revised the figure legends to make it clear.
Supplemental Figure S7:
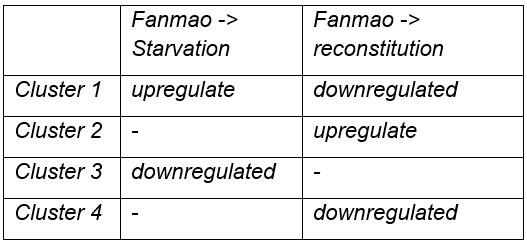
If clusters 1 and 2 show genes up and downregulated during starvation, what do clusters 4 and 3 represent?
Cluster 1: Genes that are obviously upregulated during Starvation, and downregulated during reconstitution; luster4: genes are downregulated during reconstitution but not obviously upregulated during Starvation.
Cluster 2 show genes upregulated during reconstitution, and cluster 3 obviously downregulated during Starvation.
Author response table 1.
Supplemental Figure S8:
This is a really interesting figure that I think shows some of the results really well! Maybe consider moving it to the main figures of the paper?
We appreciate the comments and suggestions. We concur with the reviewer on the significance of the results presented. However, consider the length of this manuscript, we have prioritized the inclusion of the most pertinent information in the main figures. Supplementary materials containing additional figures and details on the genes involved in these pathways are provided for interested readers.
Supplemental Figure S11:
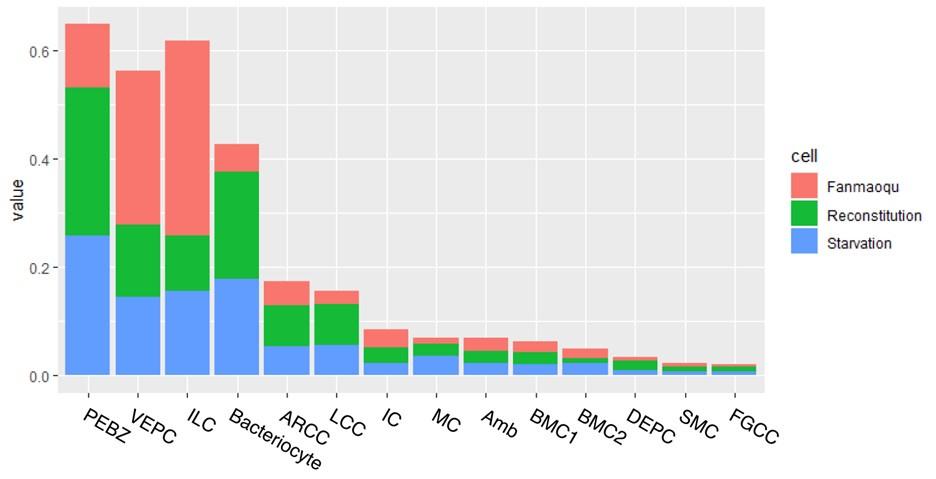
Switching the axes might make this image easier for the reader to interpret. Additionally, calculating the normalized contribution of each sample to each cluster could help quantify the extent to which bacteriocytes are reduced when starving.
Thank you for the insightful suggestion, which we have implemented as detailed below. We acknowledge the importance of understanding the changes in bacteriocyte proportions across different treatments. However, it's crucial to note that the percentage of cells per treatment is highly influenced by factors such as the location of digestion and sequencing, as previously mentioned.
Author response image 2.
Reviewer #2 (Recommendations For The Authors):
The following are minor recommendations for the text and figures that may help with clarity:
Fig. 3K: This figure describes water flow induced by different ciliary cells. It is not clear what the color of the arrows corresponds to, as they do not match the UMAP (i.e. the red arrow) and this is not indicated in the legend. Are these colours meant to indicate the different ciliary cell types? If so it would be helpful to include this in the legend.
We appreciate the reviewer's comments and suggestions. The arrows indicate the water flow that might be agitated by the certain types of cilium. We have revised our figure and figure legends to make it clear.
Line 369: The incorrect gene identifier is given for the mitochondrial trifunctional enzyme. This gene identifier is identical to the one given in line 366, which describes long-chain-fatty-acid-ligase ACSBG2-like (Bpl_scaf_28862-1.5).
We appreciate the reviewer's comments and suggestions. We have revised our manuscript accordingly.
Line 554: The Bioproject accession number (PRJNA779258) does not appear to lead to an existing page in any database.
We appreciate the reviewer's comments and suggestions. We have released this Bioproject to the public.
Line 597-598: it would be helpful to know the specific number of cells that the three sample types were downsampled to, and the number of cells remaining in each cluster, as this can affect the statistical interpretation of differential expression analyses.
The number of cells per cluster in our analysis ranged from 766 to 14633. To mitigate potential bias introduced by varying cell numbers, we implemented downsampling, restricting the number of cells per cluster to no more than 3500. This was done to ensure that the differences between clusters remained less than 5 times. We experimented with several downsampling strategies, exploring cell limits of 4500 and 2500, and consistently observed similar patterns across these variations.
Data and code availability:
The supplementary tables and supplementary data S1 appear to be the final output of the differential expression analyses. Including the raw data (e.g. reads) and/or intermediate data objects (e.g. count matrices, R objects), in addition to the code used to perform the analyses, may be very helpful for replication and downstream use of this dataset. As mentioned above, the Bioproject accession number appears to be incorrect.
We appreciate the reviewer's comments and suggestions. Regarding our sequencing data, we have deposited all relevant information with the National Center for Biotechnology Information (NCBI) under Bioproject PRJNA779258. Additionally, we have requested the release of the Bioproject. Furthermore, as part of this round of revision, we have included the count matrices for reference.
Reviewer #3 (Recommendations For The Authors):
As noted in the public review, my only major concerns are around the treatment of progenitor cell populations. I am sympathetic to the challenges of these experiments but suggest a few possible avenues to the authors.
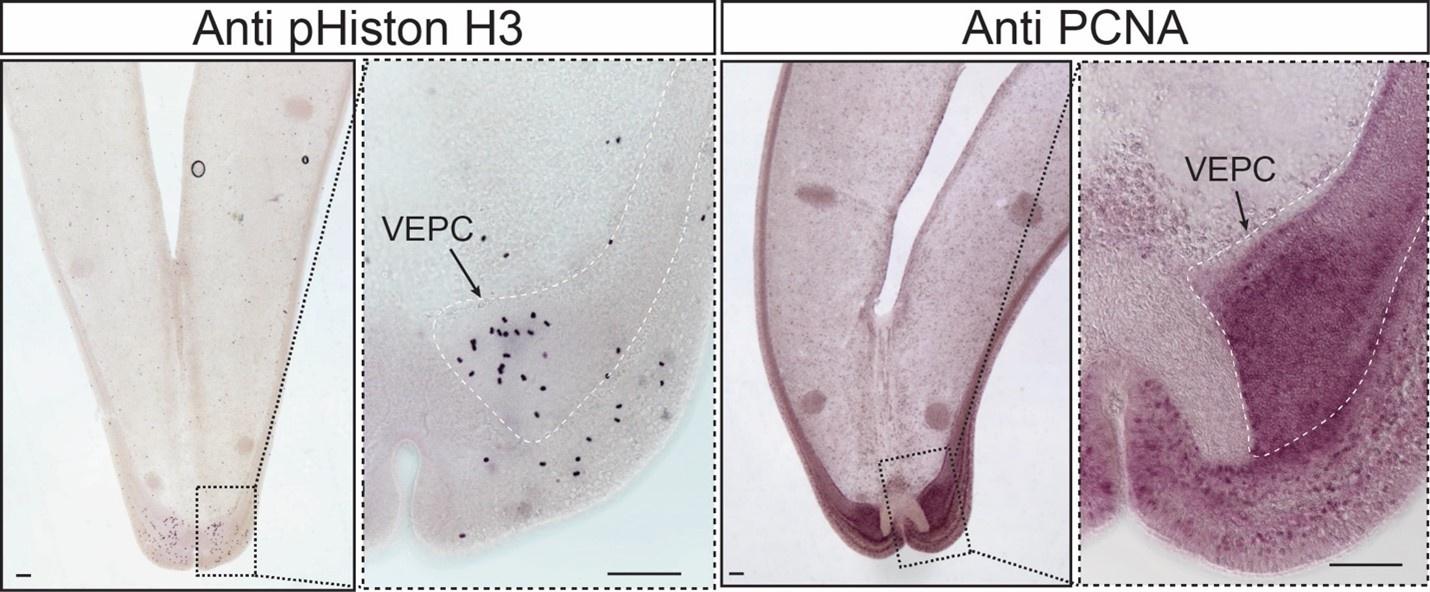
First, there could be some demonstration that these cells in G. platifrons are indeed proliferative, using EdU incorporation labeling or a conserved epitope such as the phosphorylation of serine 10 in histone 3. It appears in Mytilus galloprovincialis that proliferating cell nuclear antigen (PCNA) and phospho-histone H3 have previously been used as good markers for proliferative cells (Maiorova and Odintsova 2016). The use of any of these markers along with the cell type markers the authors recover for PEBZCs for example would greatly strengthen the argument that these are proliferative cells.
If performing these experiments would not be currently possible, the authors could use some computation approaches to strengthen their arguments. Based on conserved cell cycle markers and the use of Cell-Cycle feature analysis in Seurat could the authors provide evidence that these progenitors occupy the G2/M phase at a greater percentage than other cells? Other than the physical position of the cells is there much that suggests that these are proliferative? While I am more convinced by markers in VEPCs the markers for PEBZCs and DEPCs are not particularly compelling.
While I do not think the major findings of the paper hinge on this, comments such as "the PBEZCs gave rise to new bacteriocytes that allowed symbiont colonization" should be taken with care. It is not clear that the PBEZCs are proliferative and there does not seem to be any direct evidence that PBEZCs (or DEPCs or VEPCS for that manner) are the progenitor cells through any sort of labeling or co-expression studies.
We appreciate the comments and suggestions from the reviewer. We have considered all the suggestions and have revised the manuscript accordingly. We especially appreciate the reviewer’s suggestions about the characterisations of the G. platifrons gill proliferative cell populations. In a separate research project, we have tested both cell division and cell proliferation markers on the proliferation cell populations. Though we are not able to include these results in the current manuscript, we are happy to share our preliminary results with the reviewer. Our results demonstrate the proliferative cell populations, particularly the VEPCs, are cell proliferation marker positive, and contains high amount of mitotic cells.
Author response image 3.
Finally, there is a body of literature that has examined cell proliferation and zones of proliferation in mussels (such as Piquet, B., Lallier, F.H., André, C. et al. Regionalized cell proliferation in the symbiont-bearing gill of the hydrothermal vent mussel Bathymodiolus azoricus. Symbiosis 2020) or other organisms (such as Bird, A. M., von Dassow, G., & Maslakova, S. A. How the pilidium larva grows. EvoDevo. 2014) that could be discussed.
We appreciate the comments and suggestions from the reviewer. We have considered all the suggestions and have revised the manuscript accordingly (line 226-229).
Minor comments also include:
Consider changing the orientation of diagrams in Figure 2C' in relationship to Figure 2C and 2D-K.
We appreciate the comments and suggestions from the reviewer. The Figure 2 has been reorganized.
For the diagram in Figure 3K, please clarify if the arrows drawn for the direction of inter lamina water flow is based on gene expression, SEM, or some previous study.
We are grateful for the reviewer's valuable feedback and suggestions. The arrows in the figure indicate the direction of water flow that could be affected by specific types of cilium. Our prediction is based on both gene expression and SEM results. To further clarify this point, we have revised the figure legend of Fig. 3.
Please include a label for the clusters in Figure 5E for consistency.
We have revised our Figure 5E to keep our figures consistent.
Please include a note in the Materials and Methods for Monocle analysis in Figure 6.
We conducted Monocle analyses using Monocle2 and Monocle 3 in R environment. We have revised our material and methods with further information of Figure 6.
In Supplement 2, the first column is labeled PEBC while the first row is labeled PEBZ versus all other rows and columns have corresponding names. I am guessing this is a typo and not different clusters?
We appreciate the great effort of the reviewer in reviewing our manuscript. We have corrected the typo in the revised version.


