Foggy perception slows us down
- Max Planck Institute for Biological Cybernetics, Germany
- University Pierre Mendès-France and CNRS, France
- University of Fribourg, Switzerland
Figures
Figure 1
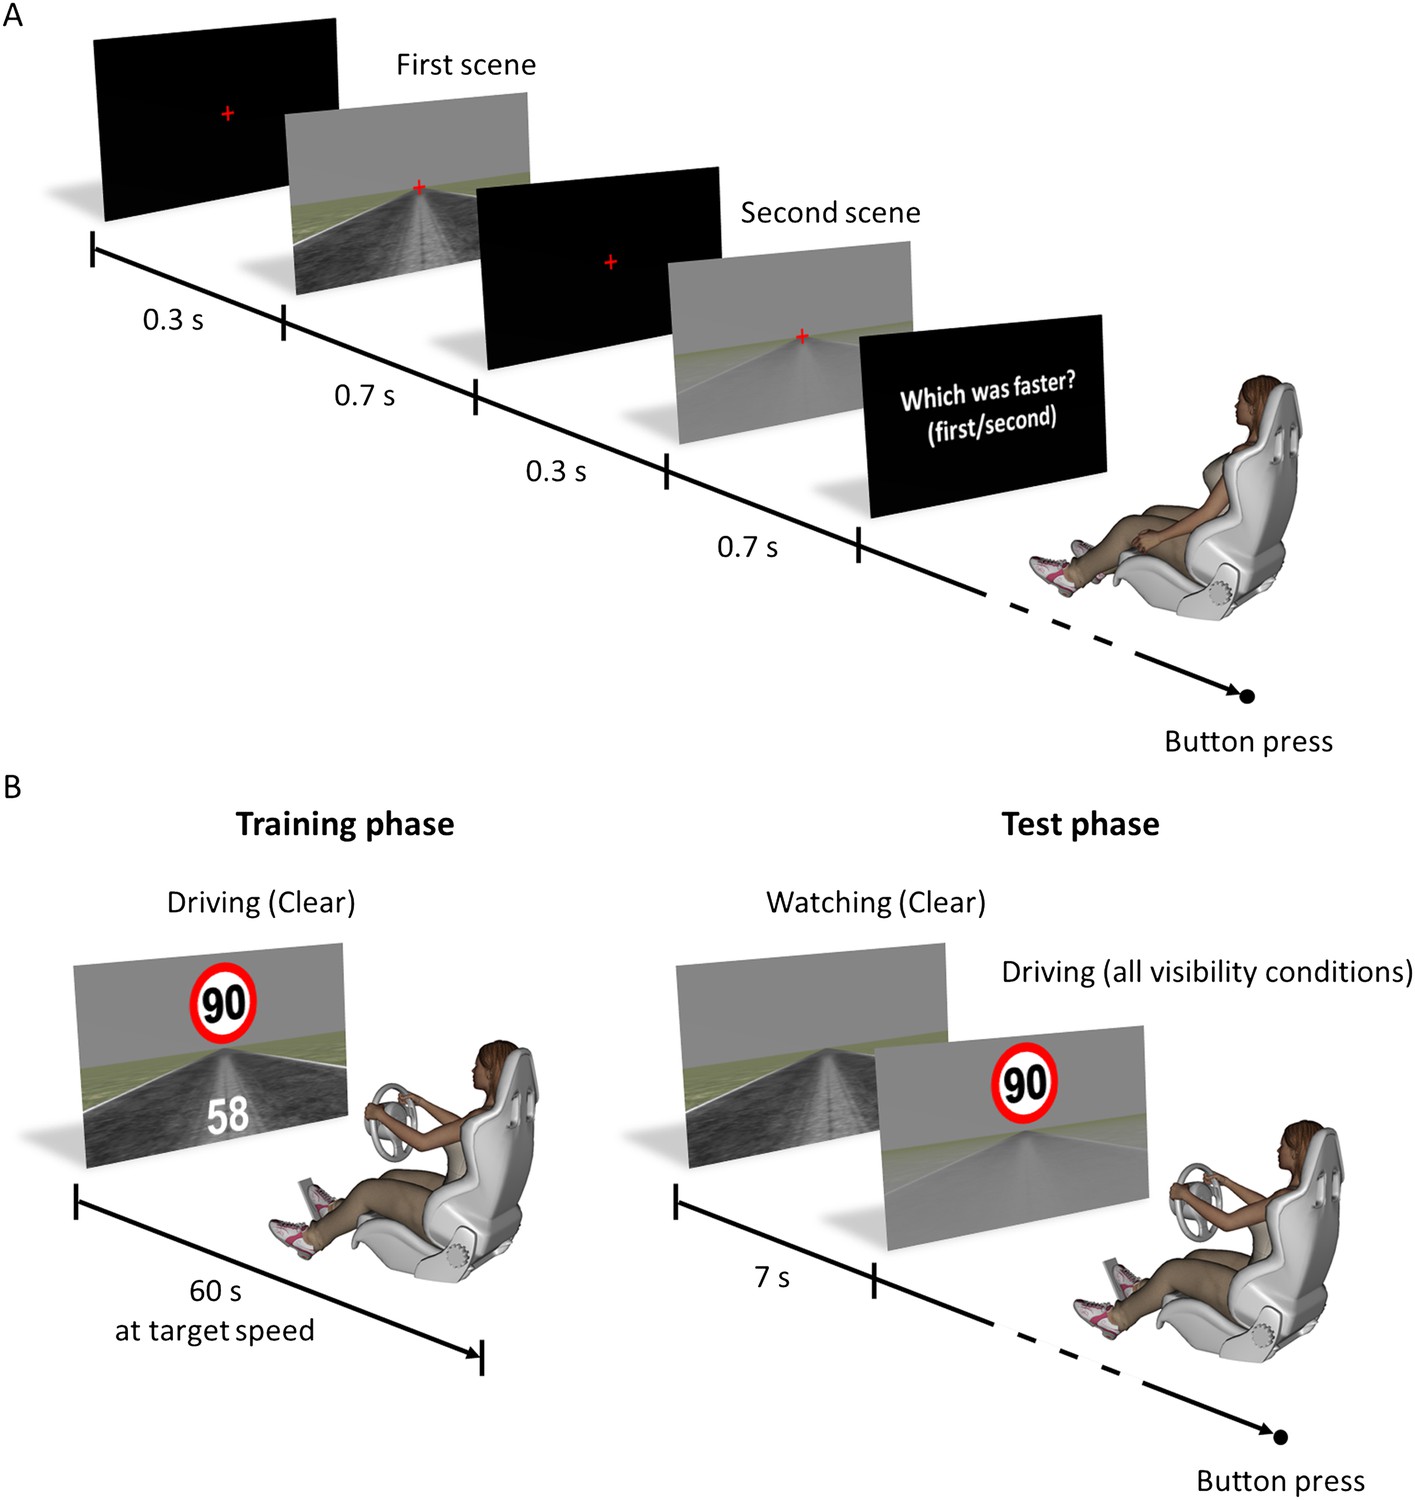
Experimental design and time course of trials.
(A) Experiments 1 and 3: for each trial, the first scene was presented for 700 ms, which included a 100-ms fade-in phase at the beginning and a 100-ms fade-out phase at the end. The second scene was presented 300 ms after the end of the first scene and had the same temporal structure as the first one. Participants had to fixate a central cross for the whole duration of the trial. The order of presentation of the reference and test scene was randomized. (B) Experiments 2 and 4: three driving sessions (i.e., one per target speed) were performed in random order for experiment 2, and one session for experiment 4. Before each test session, the drivers performed a training phase in which a numerical feedback indicated the driving speed when it did not match the target speed (white digits at the bottom of the screen, left panel). In each training phase, the drivers had to drive a total of 5 min at target speed. In addition, at the beginning of each test trial, the scene was shown for 7 s moving at target speed with clear visibility (memory refresher).
Figure 2
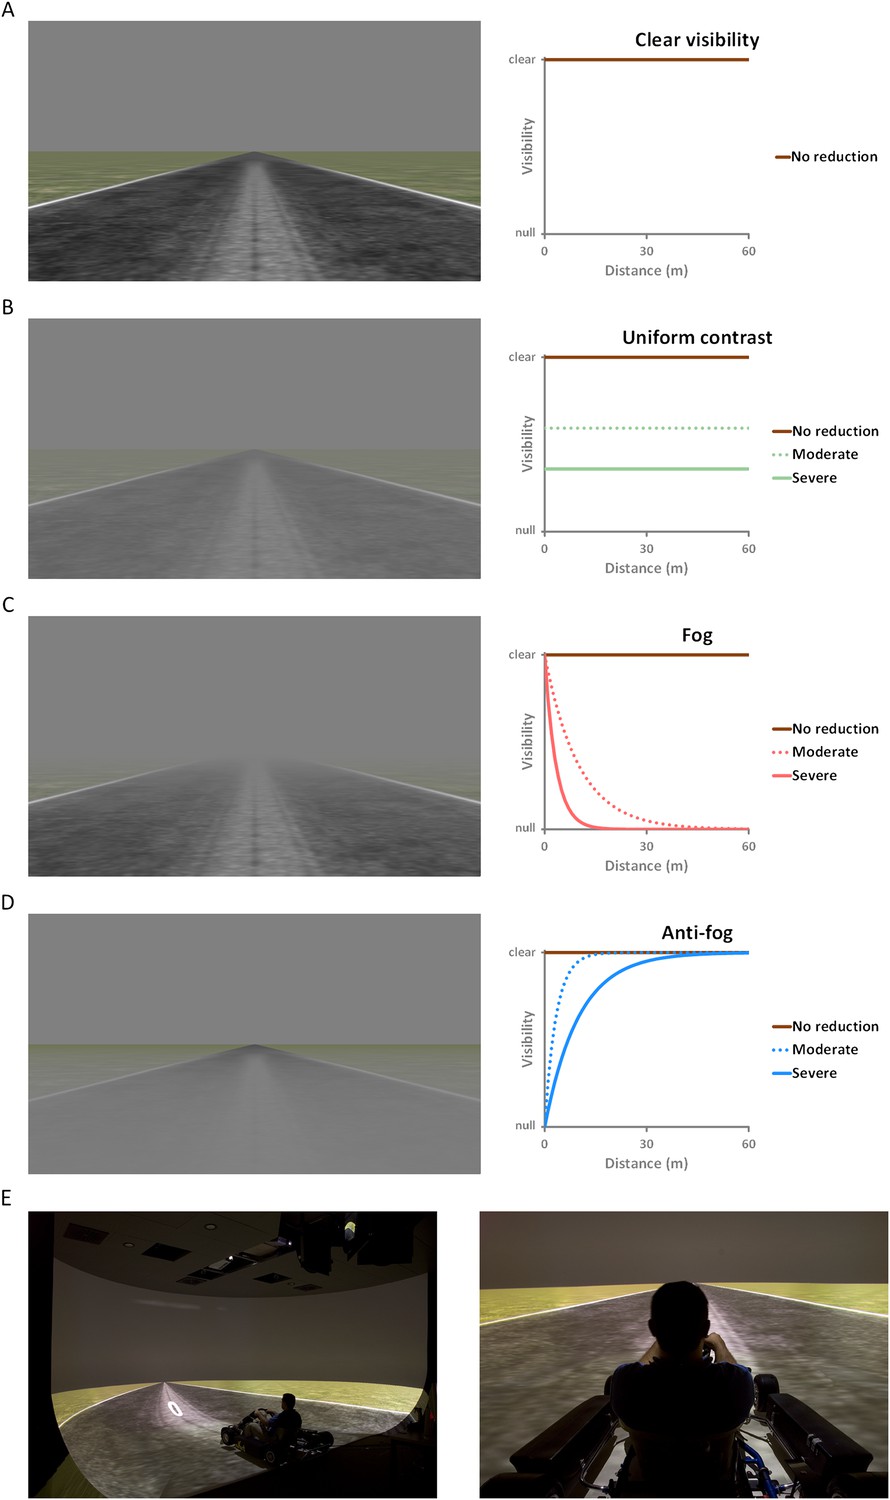
Visibility conditions.
(A) Clear weather conditions (clear visibility): contrast is unaltered and the visibility is optimal in all directions (brown line). (B) Distance-independent contrast reduction (uniform contrast): visibility drops equally for all objects of the visual scene, irrespective of their distance from the observer (green lines). (C) Distance-dependent contrast reduction (fog): visibility is good for close objects, and worsens as distance from the observer increases (red lines). (D) Reversed distance-dependent contrast reduction (anti-fog): visibility is poor for close objects, and improves as distance from the observer increases (blue lines). (E) Pictures of the actual setup: side view (left) and driver's view (right).
Figure 3
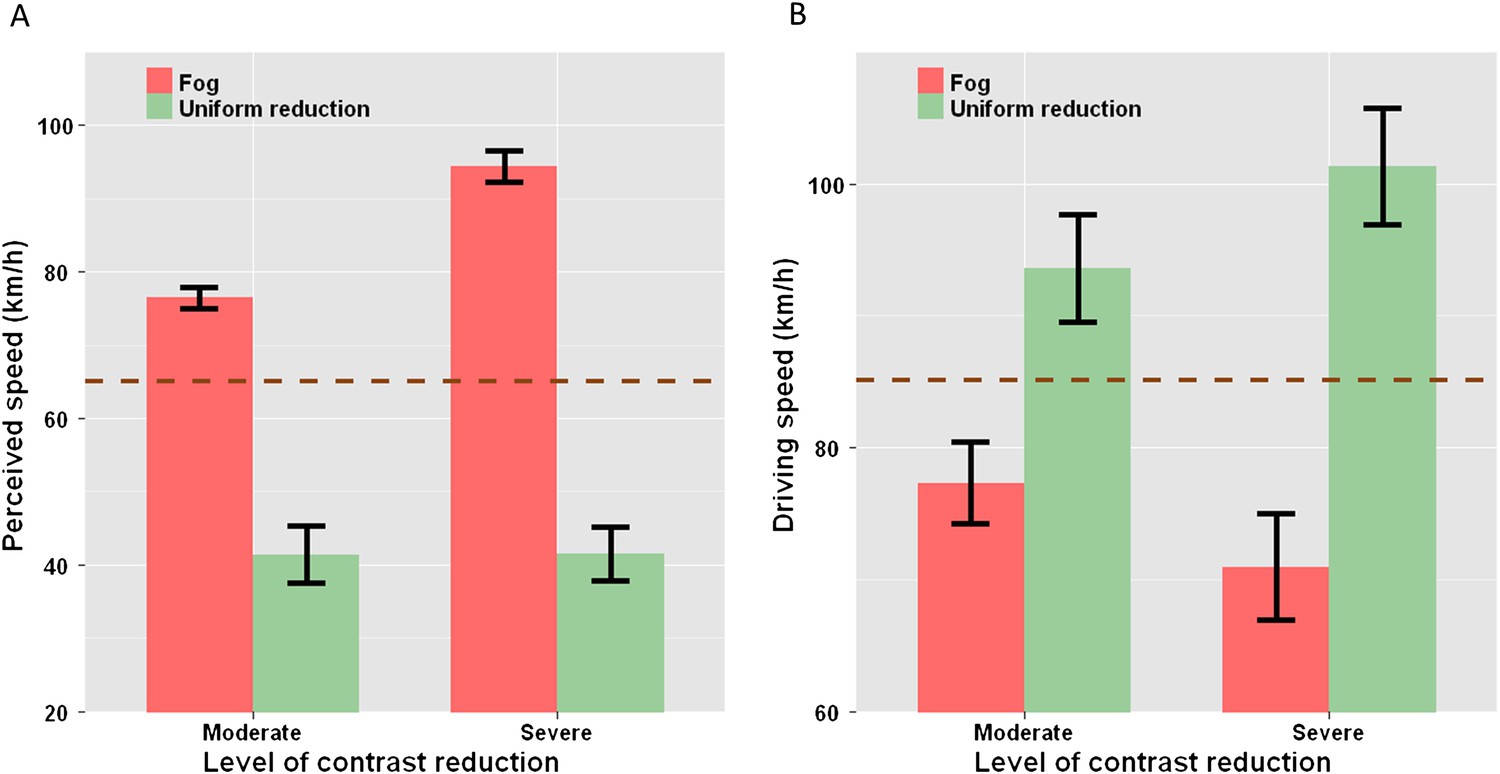
Opposite effects of distance-dependent and distance-independent contrast reduction. Experiments 1 and 2.
(A) Mean perceived driving speed across subjects as a function of visibility: for each subject, PSE values were averaged across the three target speeds (i.e., 40, 60, and 90 km/hr), then perceived speed was calculated using the following equation: Speedperceived = PSEclear + PSEclear × ln(PSEclear/PSEreduced visibility). As compared to clear visibility (brown dashed line), speed was overestimated with distance-dependent visibility reduction (red bars) and underestimated with distance-independent visibility reduction (green bars). (B) Mean produced driving speed across subjects as a function of visibility: for each subject, measured speed values were averaged across the three target speeds. As compared to their driving speed with clear visibility (brown dashed line), drivers drove slower with distance-dependent visibility reduction (red bars) and faster with distance-independent visibility reduction (green bars). In both (A) and (B), the error bars represent the standard error of the mean. PSE: point of subjective equality.
Figure 4
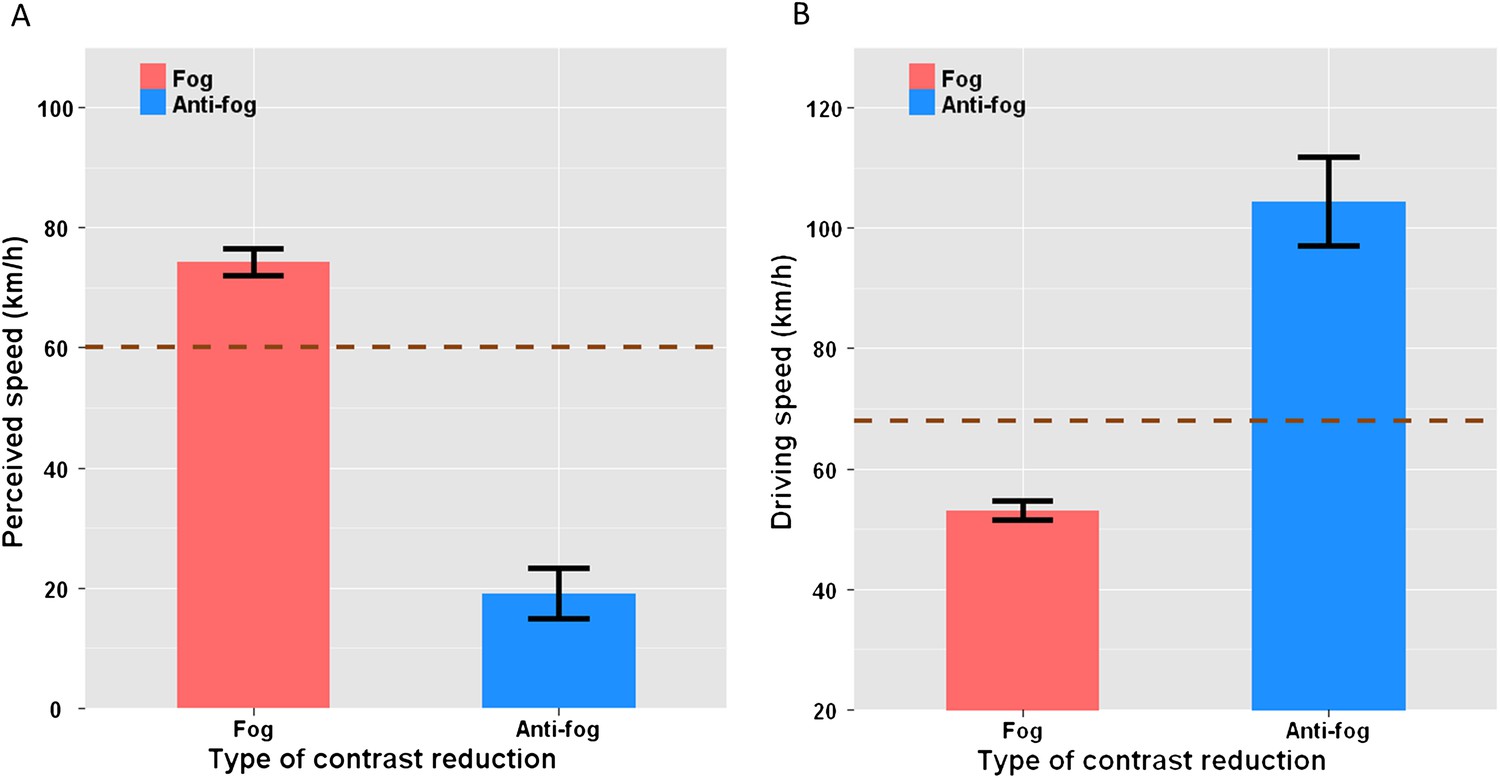
Opposite effects of fog and anti-fog. Experiments 3 and 4.
(A) Mean perceived driving speed across subjects as a function of visibility: Perceived speed was calculated from the measured PSEs using the following equation: Speedperceived = PSEclear + PSEclear × ln(PSEclear/PSEreduced visibility). As compared to clear visibility (brown dashed line), speed was overestimated when visibility was better for close than for distant objects, that is, in fog (red bars), and underestimated when visibility was better for distant than for close objects, that is, anti-fog (blue bars). (B) Mean produced driving speed across subjects as a function of visibility: As compared to their driving speed with clear visibility (brown dashed line), drivers drove slower when visibility was better for close than for distant objects, that is, in fog (red bars), and faster when visibility was better for distant than for close objects, that is, anti-fog (blue bars). In both (A) and (B), the error bars represent the standard error of the mean. PSE: point of subjective equality.
Download links
A two-part list of links to download the article, or parts of the article, in various formats.
Downloads (link to download the article as PDF)
Open citations (links to open the citations from this article in various online reference manager services)
Cite this article (links to download the citations from this article in formats compatible with various reference manager tools)
Foggy perception slows us down
eLife 1:e00031.
https://doi.org/10.7554/eLife.00031


