Mammalian genes induce partially reprogrammed pluripotent stem cells in non-mammalian vertebrate and invertebrate species
- University of Puerto Rico Medical Sciences Campus, Puerto Rico
- Duke University Medical Center, United States
- Howard Hughes Medical Institute, Duke University Medical Center, United States
Figures
Figure 1 with 3 supplements
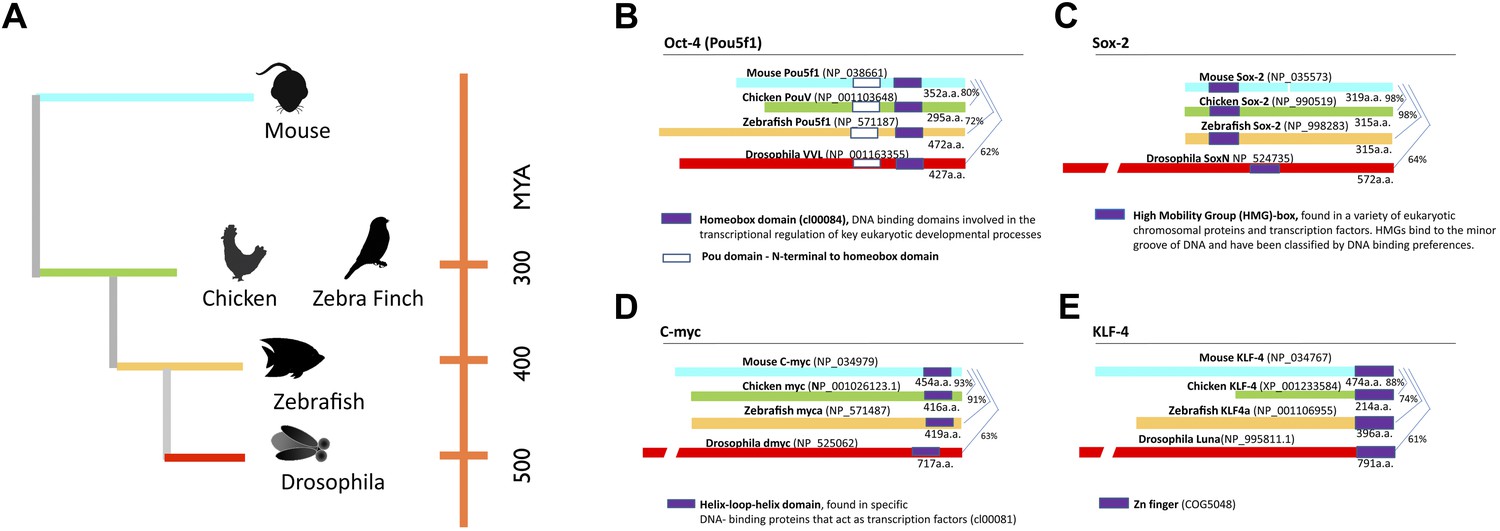
Phylogeny of species used and stem cell gene homologies.
(A) Phylogenetic relationships of the species studied relative to mouse: birds (galliforms and songbirds), fish (zebrafish), and an insect (Drosophila). The phylogenetic tree is based on (Sullivan et al., 2006). (B) General structure and sequence comparisons of the putative homologs of the four stem cell inducing transcription factors included in the cassette (Figure 1—figure supplement 1; Oct-4, Sox-2, C-myc, Klf-4) across species. Although overall homologies vary significantly, DNA binding sites are highly conserved. Gene sequences were either from published studies (Lavial et al., 2007; Camp et al., 2009) or from those predicted in sequence databases (Ensembl). Conserved domains (color coated boxed regions with accession numbers) were found using the Ensembl orthologue function and NCBI’s HomoloGene. Detailed sequence homologies can be seen in Figure 1—figure supplement 1.
Figure 1—figure supplement 1
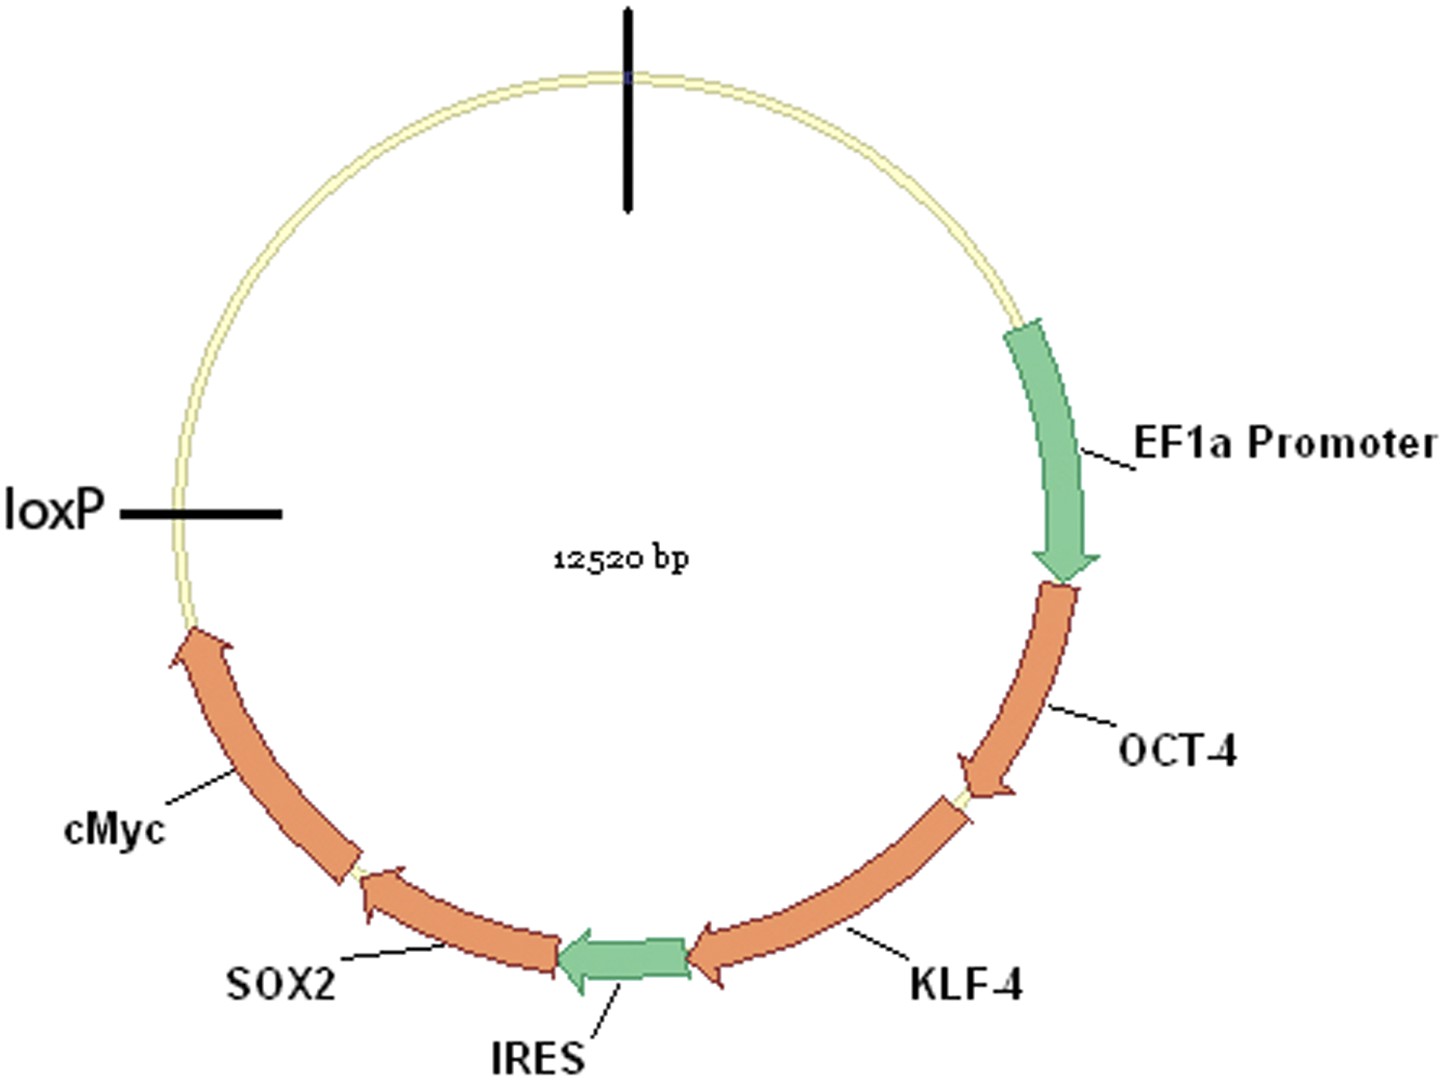
Schematic representation of the pHAGE-STEMCCA vector map.
The critical induction genes depicted are transcribed on a single multicistronic mRNA transcribed under the control of the human EF1? promoter. The mRNA contains an IRES element separating two fusion cistrons (Oct4 and Klf4; and Sox2 and cMyc). The LoxP site can be used to excise the four genes after the cells have been induced to become stem cells, and thus prevent c-myc from causing aberrant growth in transgenics or re-activation of the exogenous stem cell genes. For a full map of the vector see (Sommer et al., 2009).
Figure 1—figure supplement 2
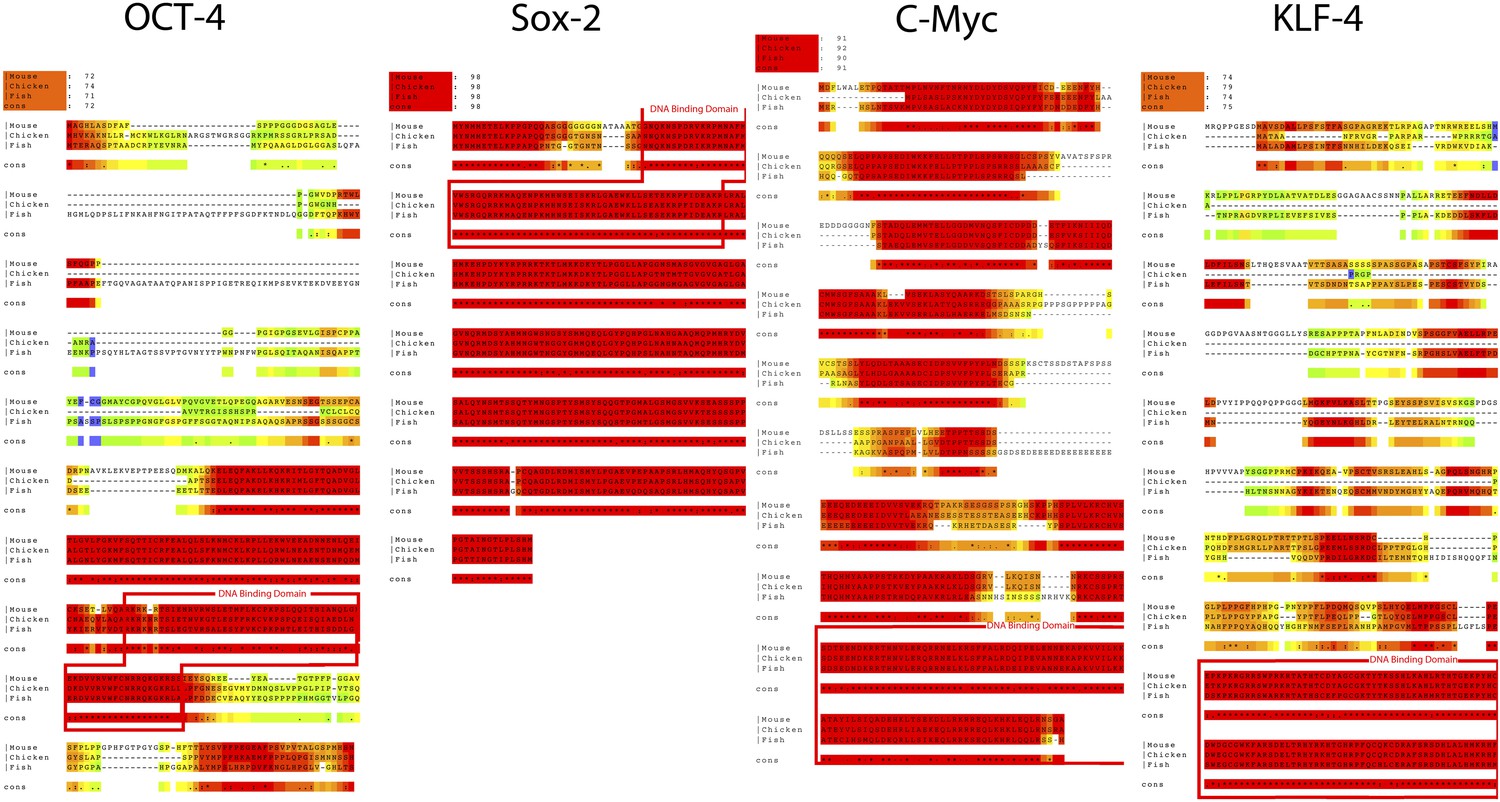
Alignments of the coding sequence of the putative Oct4, Sox2, Klf4, and c-myc homologs across vertebrate species.
The DNA binding domain are highlighted by a red box. Alignments were generated using T-coffee (www.tcoffee.org). Color-coding indicates degree of amino acid similarity (red, very similar or identical; blue, completely different). Accession numbers for the specific sequences used are in Supplementary file 1C (same sequences used to generate primers).
Figure 1—figure supplement 3
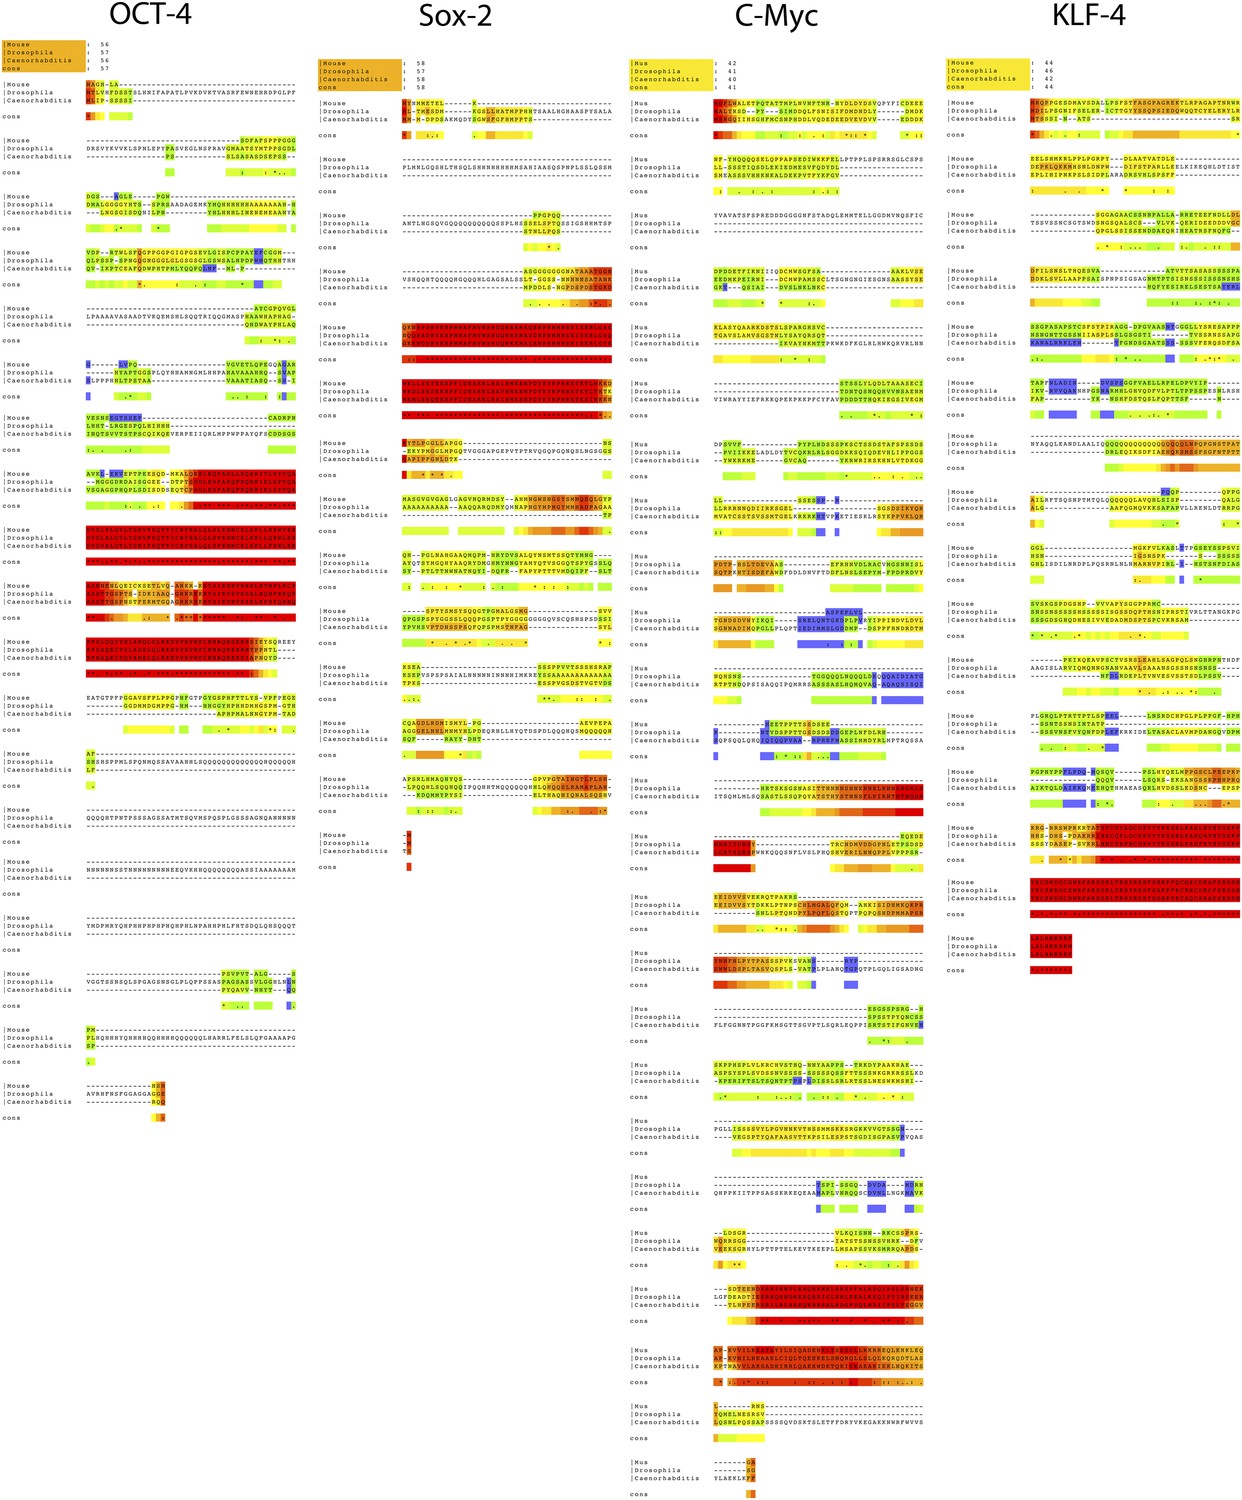
Alignments of the coding sequence of the putative Oct4, Sox2, Klf4, and c-myc homologs across invertebrate species.
Accession numbers for the specific sequences used are in Supplementary file 1C (same sequences used to generate primers).
Figure 2 with 2 supplements

Generation of iPSC-like cells from differentiated cells of mouse, birds, fish, and Drosophila using the mouse transcription factors.
(A) Non-transduced mouse, avian and zebrafish embryonic fibroblasts, and Drosophila S2 cell line. (B) Transformed cells (colonies) after 20 days (first passage), using optimal titers (Figure 2—figure supplement 1). (C) Non-transduced cells labeled for ALP activity. (D) Colonies formed by transformed cells labeled for ALP activity after the first passages (10th passage staining can be seen in Figure 2—figure supplement 2). (E) Non-transduced cells and F, transduced cells after colony formation reacted with a Stage Specific Embryonic Antigen-1 (SSEA-1; green fluorescence) antibody. (G) Colonies of embryonic stem cells (positive controls). (H) Embryonic stem cells labeled for ALP activity (positive controls). Black scale bars, 100 μm; green and red bars, 50 μm.
Figure 2—figure supplement 1

Colony formation in vertebrate cells as a function of species and titer.
After transduction with different viral titers, iPSC-like colonies were counted in 35-mm plates. Higher titers produced more colonies, although the highest titer did result in greater variability. The mouse cells gave the highest number of colonies. This could be due to the efficacy of transducing mouse cells with mouse genes or a species difference. Higher titers were used for transductions presented in this paper, as they provided the higher number of colonies. Error bars, S.E.M (n = 11 independently transduced plates for each species and titer). Statistics in Supplementary file 1D.
Figure 2—figure supplement 2
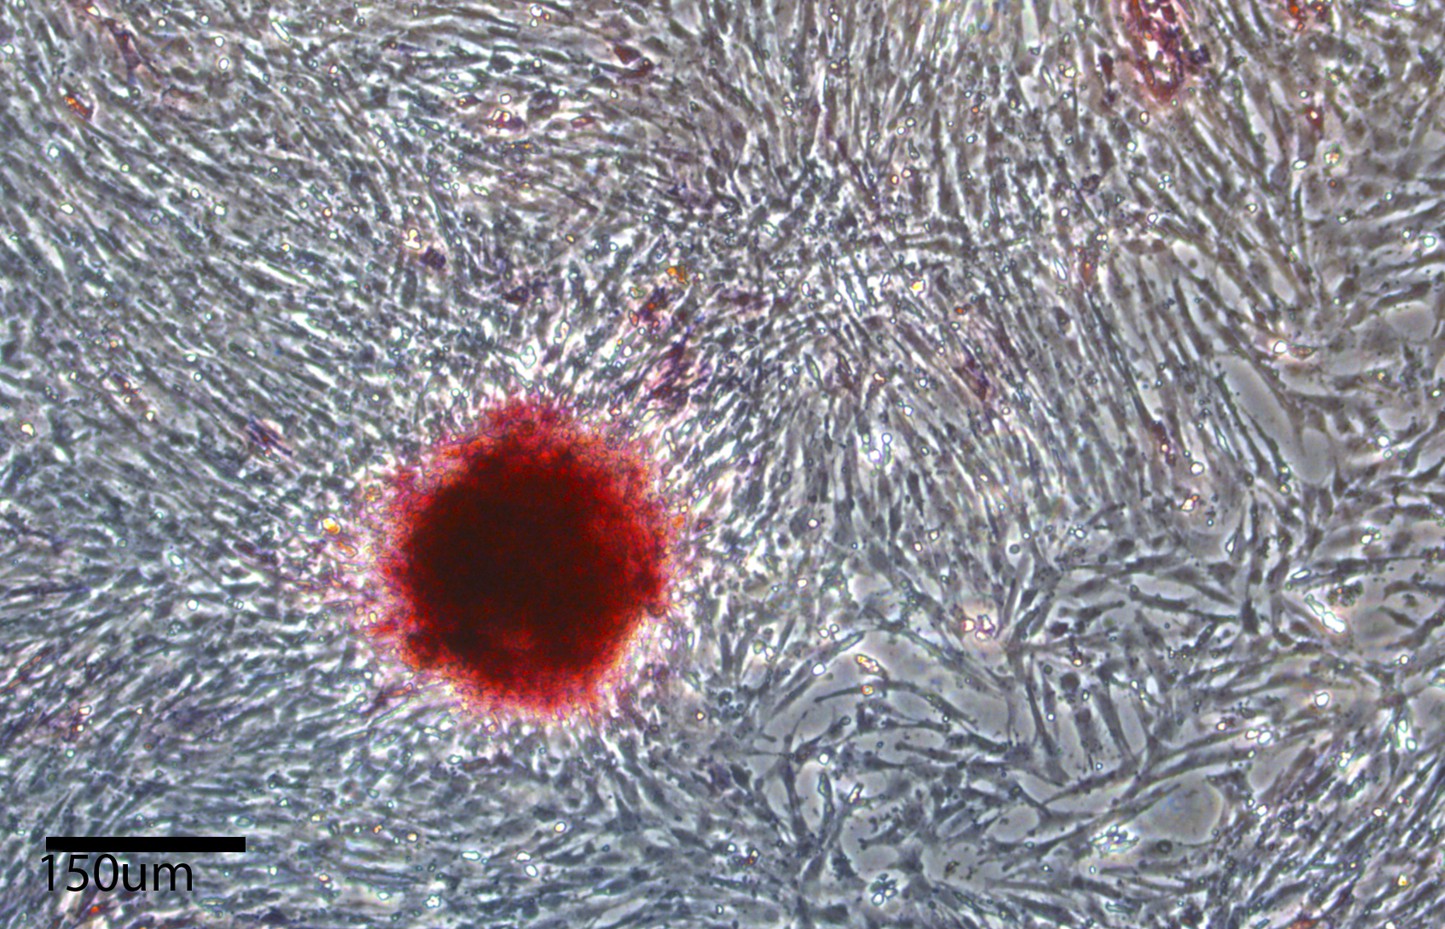
Alkaline phosphetase staining (red color labling) in chicken iPSC-like colonies after the 10th passage, and growth of fibroblast feeder layer cells that are not labeled.
https://doi.org/10.7554/eLife.00036.009
Figure 3 with 3 supplements
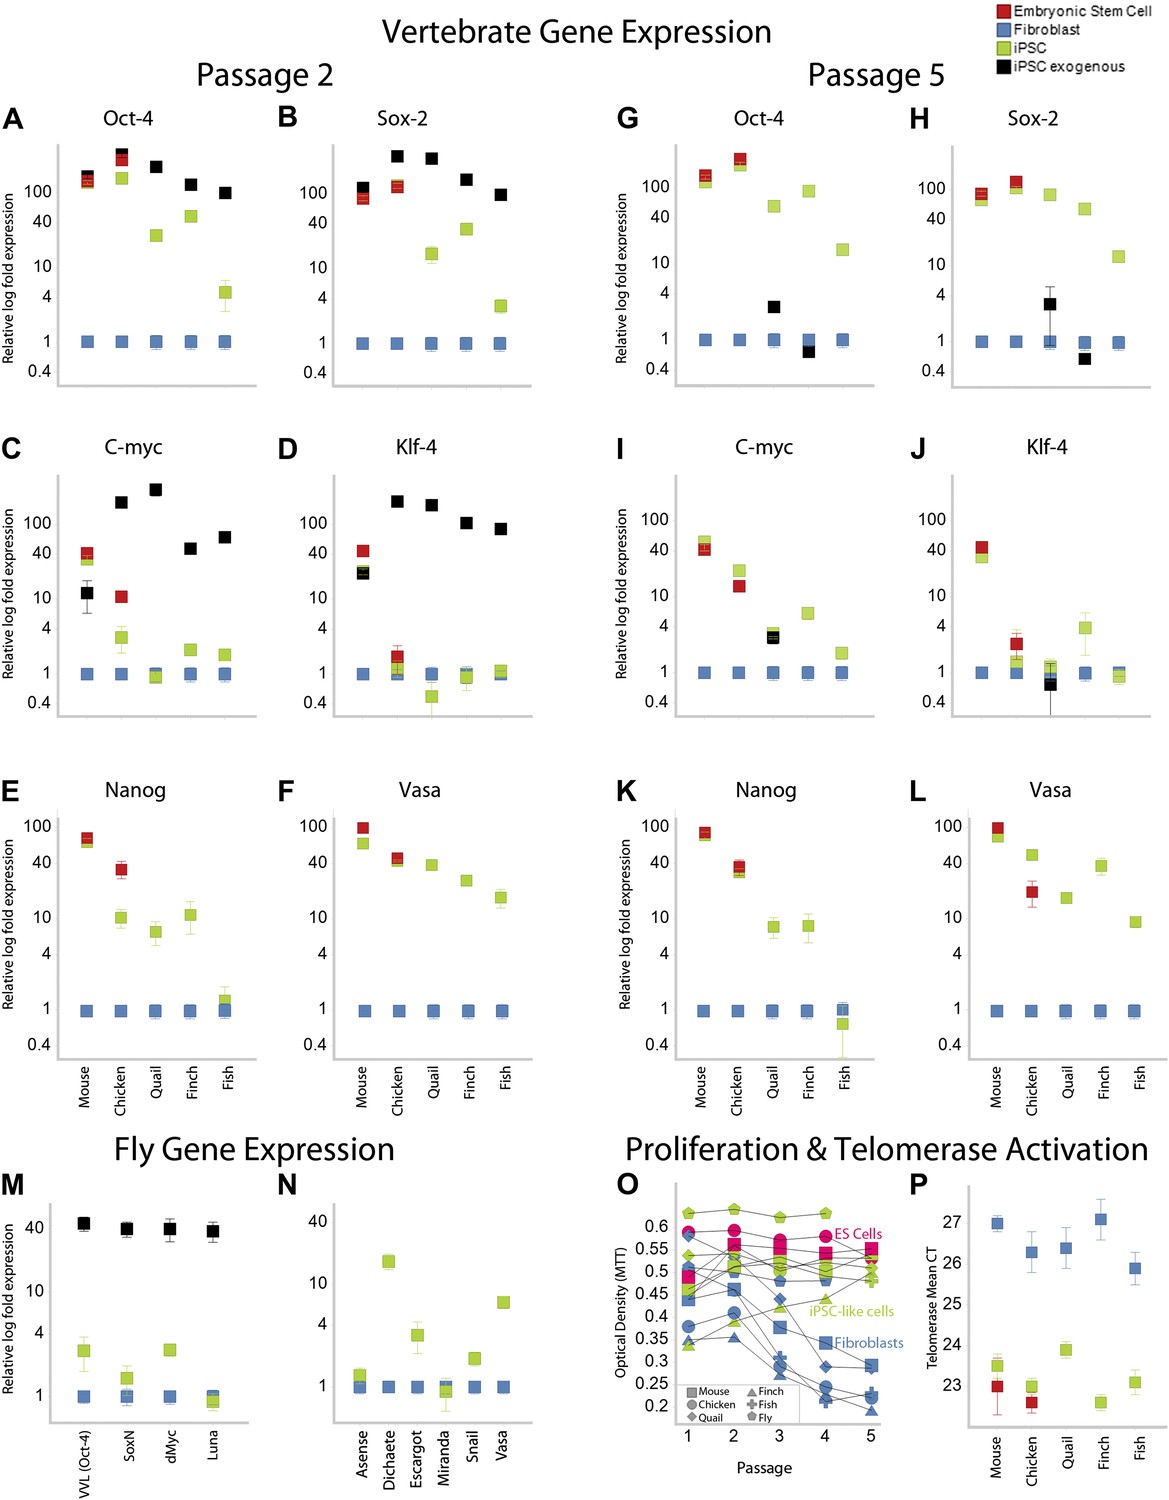
Upregulation of stem cell genes in mouse, birds, fish, and Drosophila by mouse transcription factors.
(A–D) qRT-PCR of exogenous (black) mouse and endogenous (green) species-specific expression of Oct-4 (A), Sox-2 (B), c-myc (C), and Klf-4 (D) in iPSC-like cells of each species after the second passage relative to (normalized) non-transduced fibroblast controls (blue). Mouse and chicken ESCs were included as positive controls (red). Primers used are shown in Supplementary file 1C. Several values overlap among cell types (e.g., mouse exogenous and endogenous Oct-4 and Klf-4) and are thus not distinguishable in the graph. (E–F) qRT-PCR of Nanog (E) and Vasa (F) homologs in the different cell types across species. (G–L) qRT-PCR after the fifth passage show that the exogenous mouse genes are significantly downregulated or silenced. These values were normalized to the same fibroblast values as in the second passage. Nanog and Vasa expression levels exhibit no significant difference from passage two levels, except in chicken cells. Expression levels were also measured for 12th passage iPSC-like cells (Figure 3—figure supplement 1) and fifth passage iPSC-like cells were normalized against adult tissue (Figure 3—figure supplement 2). (M) qRT-PCR of exogenous and endogenous (homologs) Drosophila specific genes in the transformed S2 cells, and N, other genes known to be involved in early embryogenesis in Drosophila. Expression levels were also measured with iPSC-like cells generated from a primary drosophila cell line (BG2; Figure 3—figure supplement 3). Error bars, S.E.M within cell populations. p-values for all comparisons are shown in Supplementary file 1D, ANOVA, (Tukey’s post hoc, p<0.001; n = 5 replicates of independent transformed lines). (O) Time course of self-renewal and proliferation of stem cells (iPSC-like cells and ESCs) relative to control fibroblast (or S2) as measured by the MTT [(3-(4,5-Dimethylthiazol-2-yl)-2,5-diphenilytetrazolium bromide] assay (read at 570 nm) (error bars not shown for clarity). ESCs and iPSC-like cells maintain high proliferation levels, while primary fibroblasts decay. (P) Telomerase activity was greatly increased (lower mean Cycle Threshold, CT) in iPSC-like cells and control ESCs over control fibroblast cells. Error bars, S.E.M (n = 5 independent cell line replicates for both MTT and telomerase data). Statistics shown in Supplementary file 1D.
Figure 3—figure supplement 1
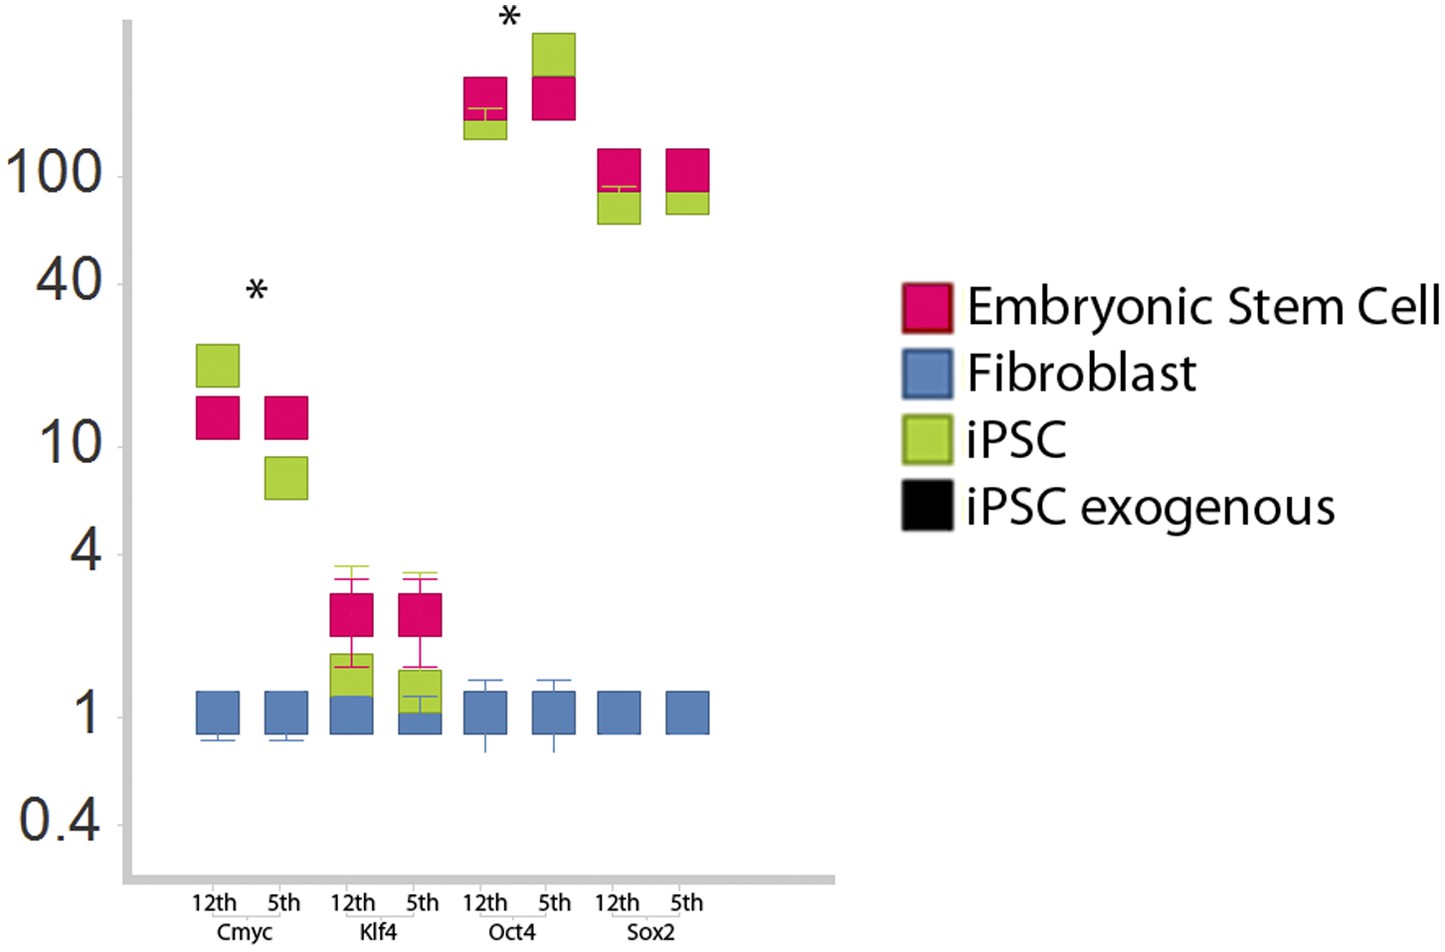
Comparison of iPSC-like expression patterns after the 5th passage and 12th passage.
Cmyc exhibited a slight down regulation by the 12th passage relative to the fifth, while Oct-4 was slightly upregulated. Neither Klf-4 nor Sox2 exhibited significant changes. *p<0.001, ANOVA, followed by Tukey's post hoc; n = 5 replicates of independent transformed lines. Error bars, S.E.M within cell populations.
Figure 3—figure supplement 2
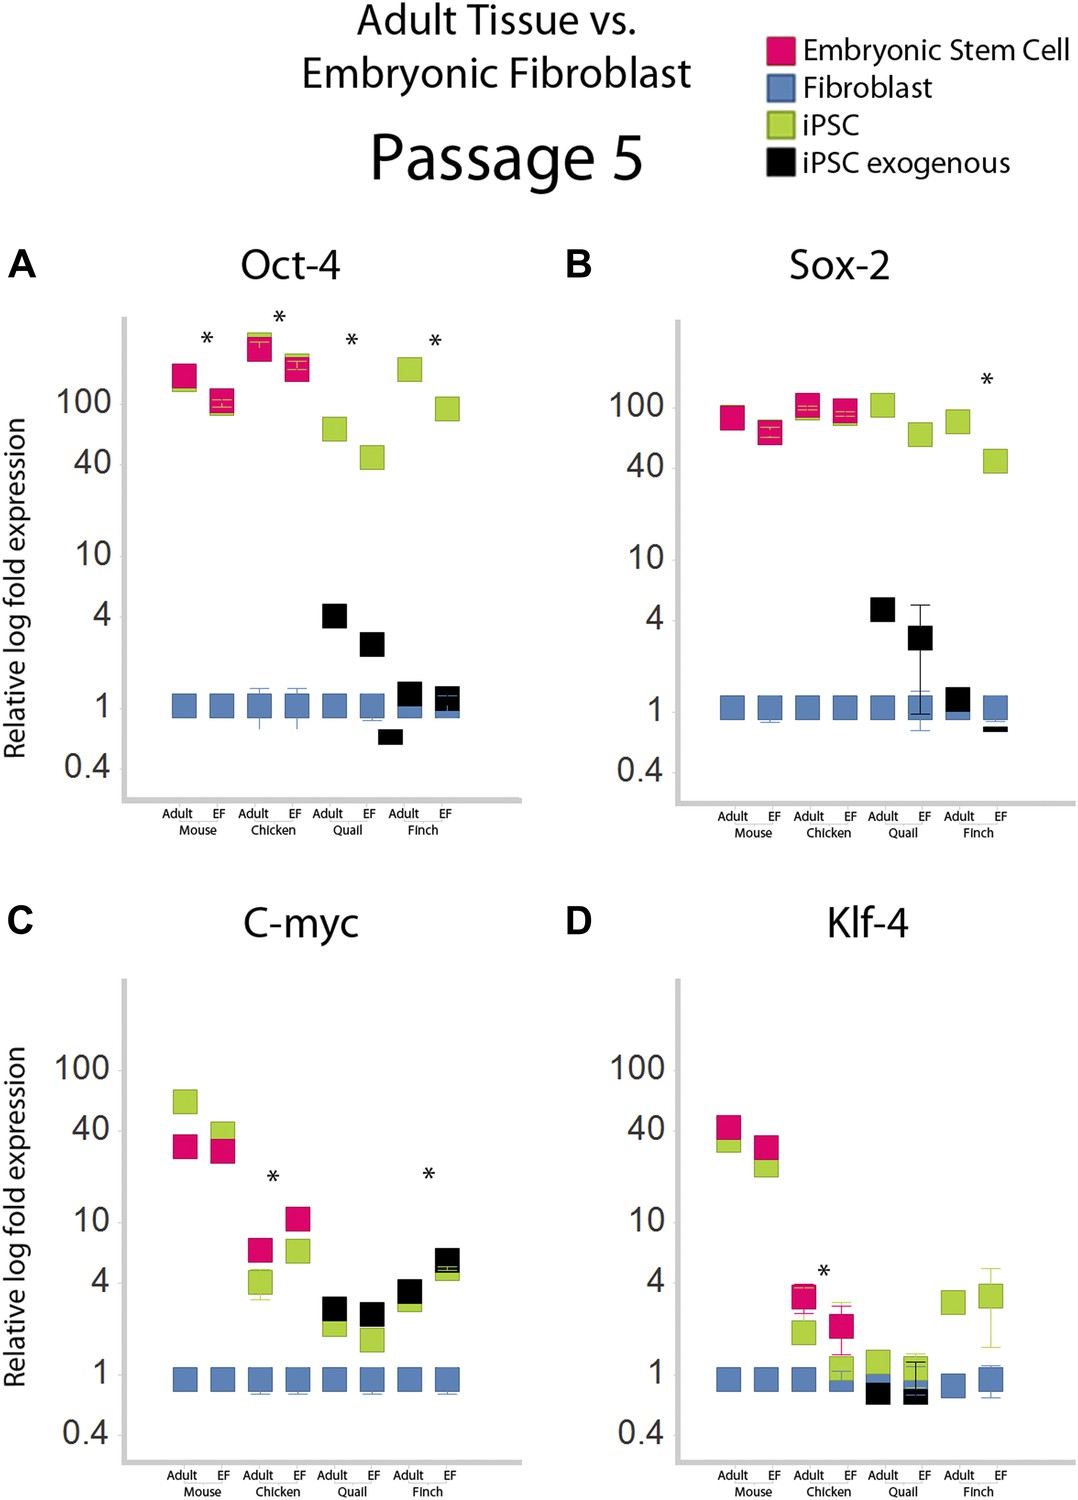
Gene expression profiles under different normalization basis.
Fifth passage iPSC-like cells for mice and aves were normalized relative to embryonic fibroblasts and adult tissue, and compared. Adult tissue RNA was purchased for mice and chicken (Zyagen Cat MR-201 and CR-201 respectively), while for finch and quail they were isolated from brains of animals in the lab using a total RNA isolation kit. The comparison shows several significant, but small differences. Expression of Oct-4 was significantly higher when compared to adult tissue in all species. The finch showed significant differential expression in all genes, except Klf4. *p<0.001, ANOVA, followed by Tukey's post hoc; n = 5 replicates of independent transformed lines. Error bars, S.E.M within cell populations.
Figure 3—figure supplement 3

Drosophila BG2 cells also exhibited some transformation.
(A) BG2 before and 7 days after transfection with the STEMCCA gene casset. Note the clustered colony morphology in the later. (B) RT-PCR analyses of mouse (black) and homologous drosophila homolog (green) of the four inducing transcription factors, relative to starting levels in non-transformed cells (blue). (C) RT-PCR analyses of other Drosophila stem cell genes.
Figure 4
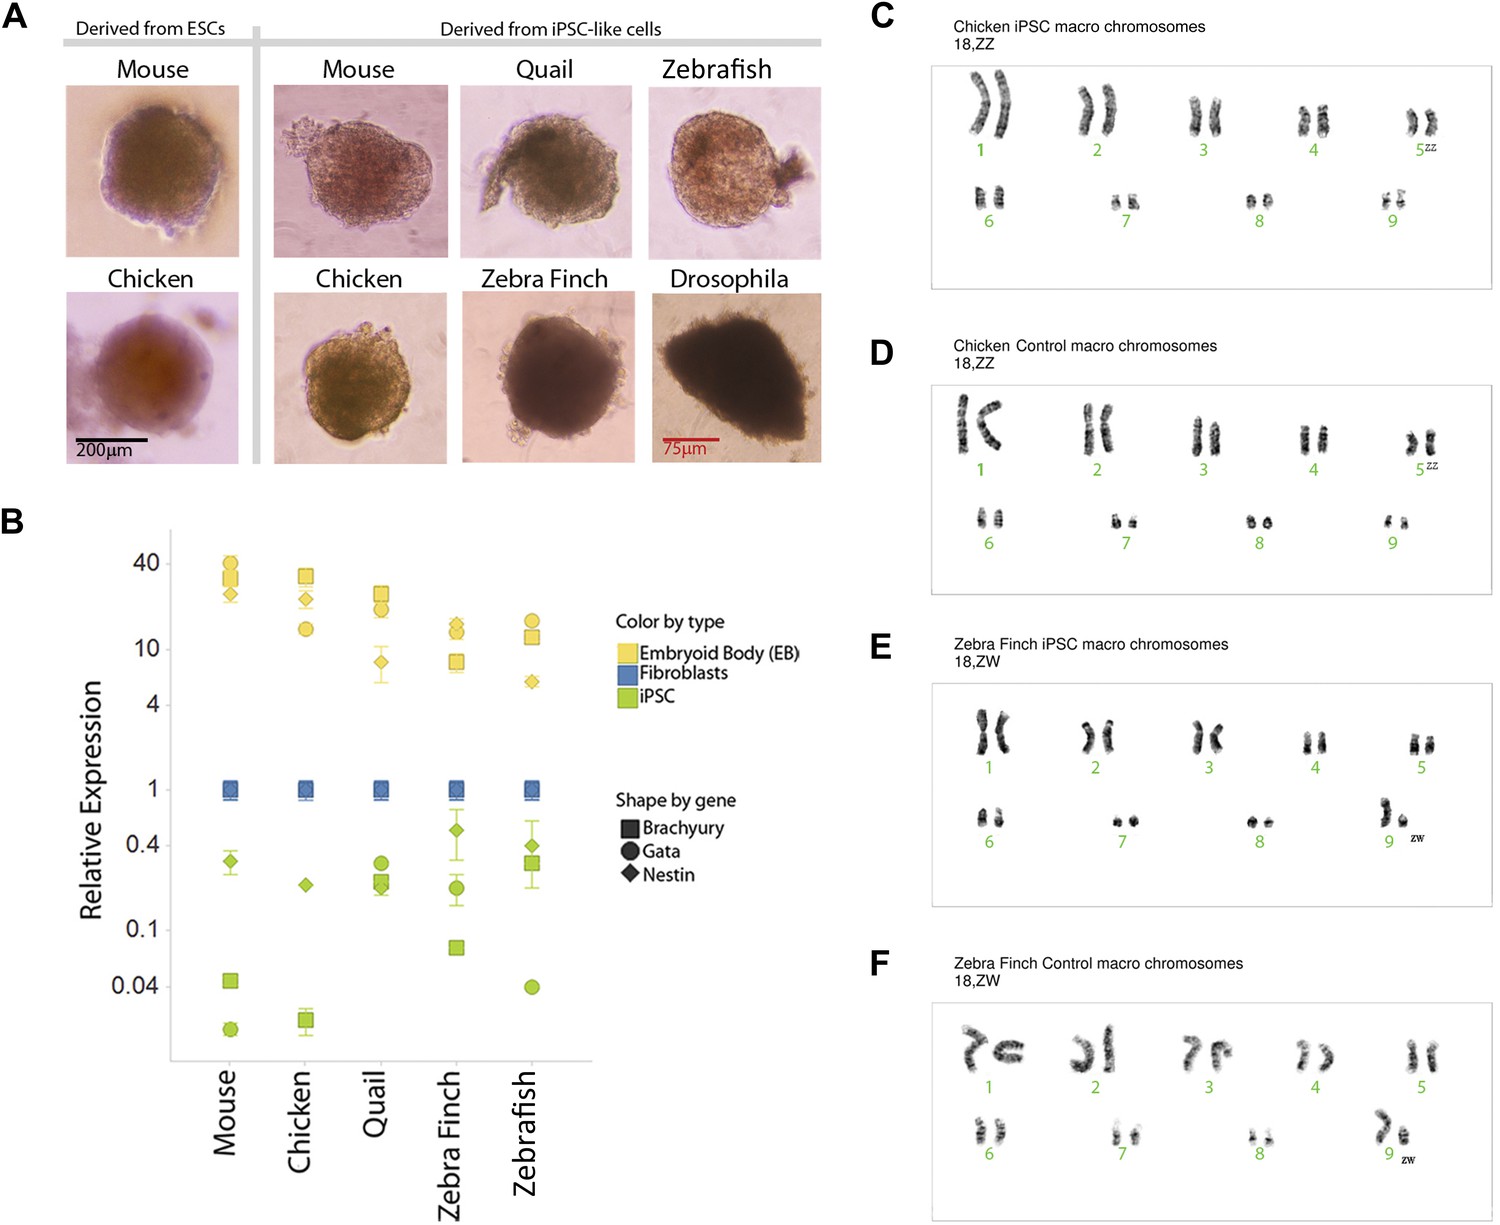
Karyotyping and in vitro pluripotency of iPSC-like cells.
(A) Embryoid bodies (EB) from iPSC-like cells in differentiation media. (B) qRT-PCR gene expression analyses of Nestin (ectoderm marker), Brachyury (mesoderm), and Gata-4 (endoderm) homologs in undifferentiated iPSC-like cells (green) and in EBs (yellow) from mouse, bird and fish relative to their control fibroblasts (normalized; blue). Error bars, S.E.M. (n = 5 replicates of independently generated cell lines or EBs). Statistics in Supplementary file 1D. (C–F) Karyotypes of macro chromosomal arrangements of the chicken iPSC-like (C), chicken control fibroblasts (D), zebra finch iPSC-like cells (E) and zebra finch control fibroblasts (F), exhibiting 18 normal chromosomes. ZZ is female and ZW is male in birds. Black scale bar, 100 μm.
Figure 5
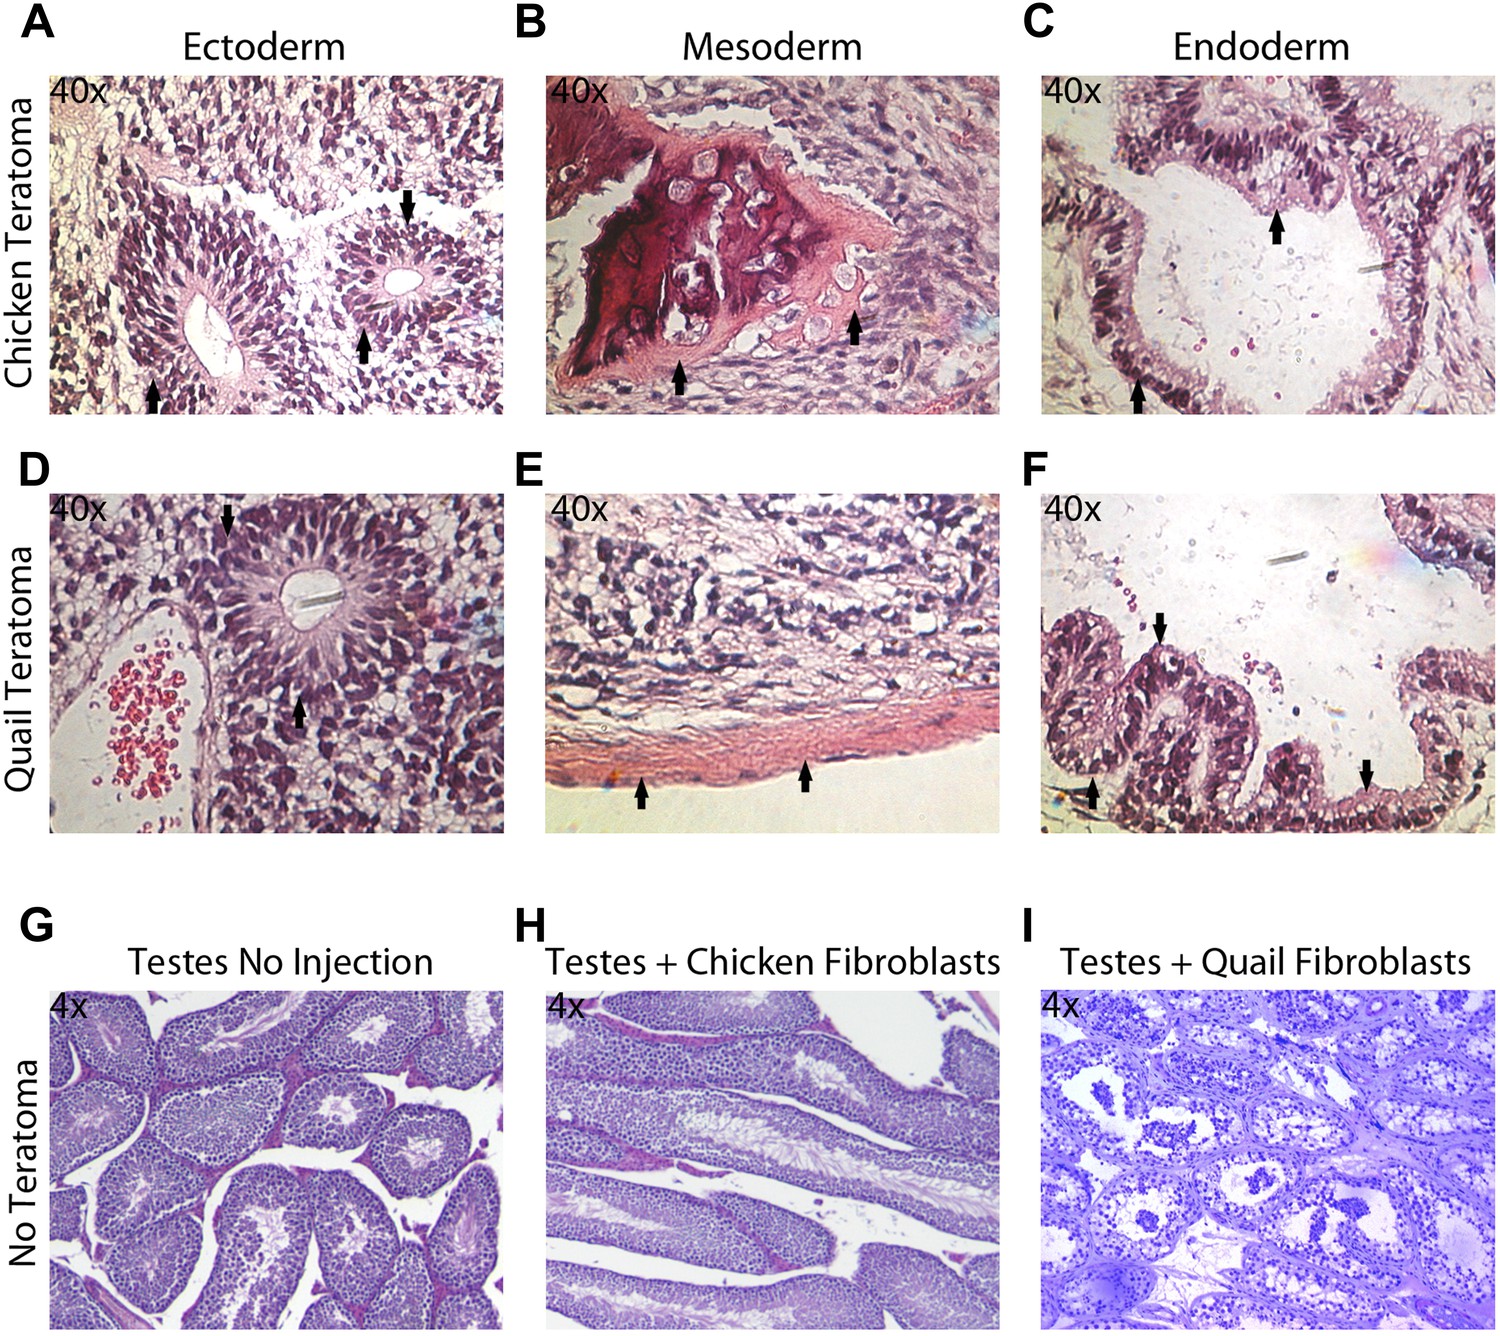
Teratoma formation generated by chicken and quail iPSC-like cells.
(A–C) Teratoma formation after injections of chicken iPSC-like cells in testes of SCID mice, showing aberrant growth of (A) neural like cells (neuronal rosettes, endoderm, black arrows), (B) bone-like cells (mesoderm, black arrows), and (C) gastrointestinal tract-like cells (endoderm, black arrows). Similar features are seen in the quail generated teratomas (D–F). (G) Control testes without cell injections showing normal tissue morphology. (H) Testis with control chicken fibroblasts injected showing no germline formation. (I) Testis injected with control quail fibroblasts that did not generate teratomas. Panels A–F are at 40 × magnification, whereas G–I are at 4 × in order to get a broader view.
Figure 6 with 3 supplements
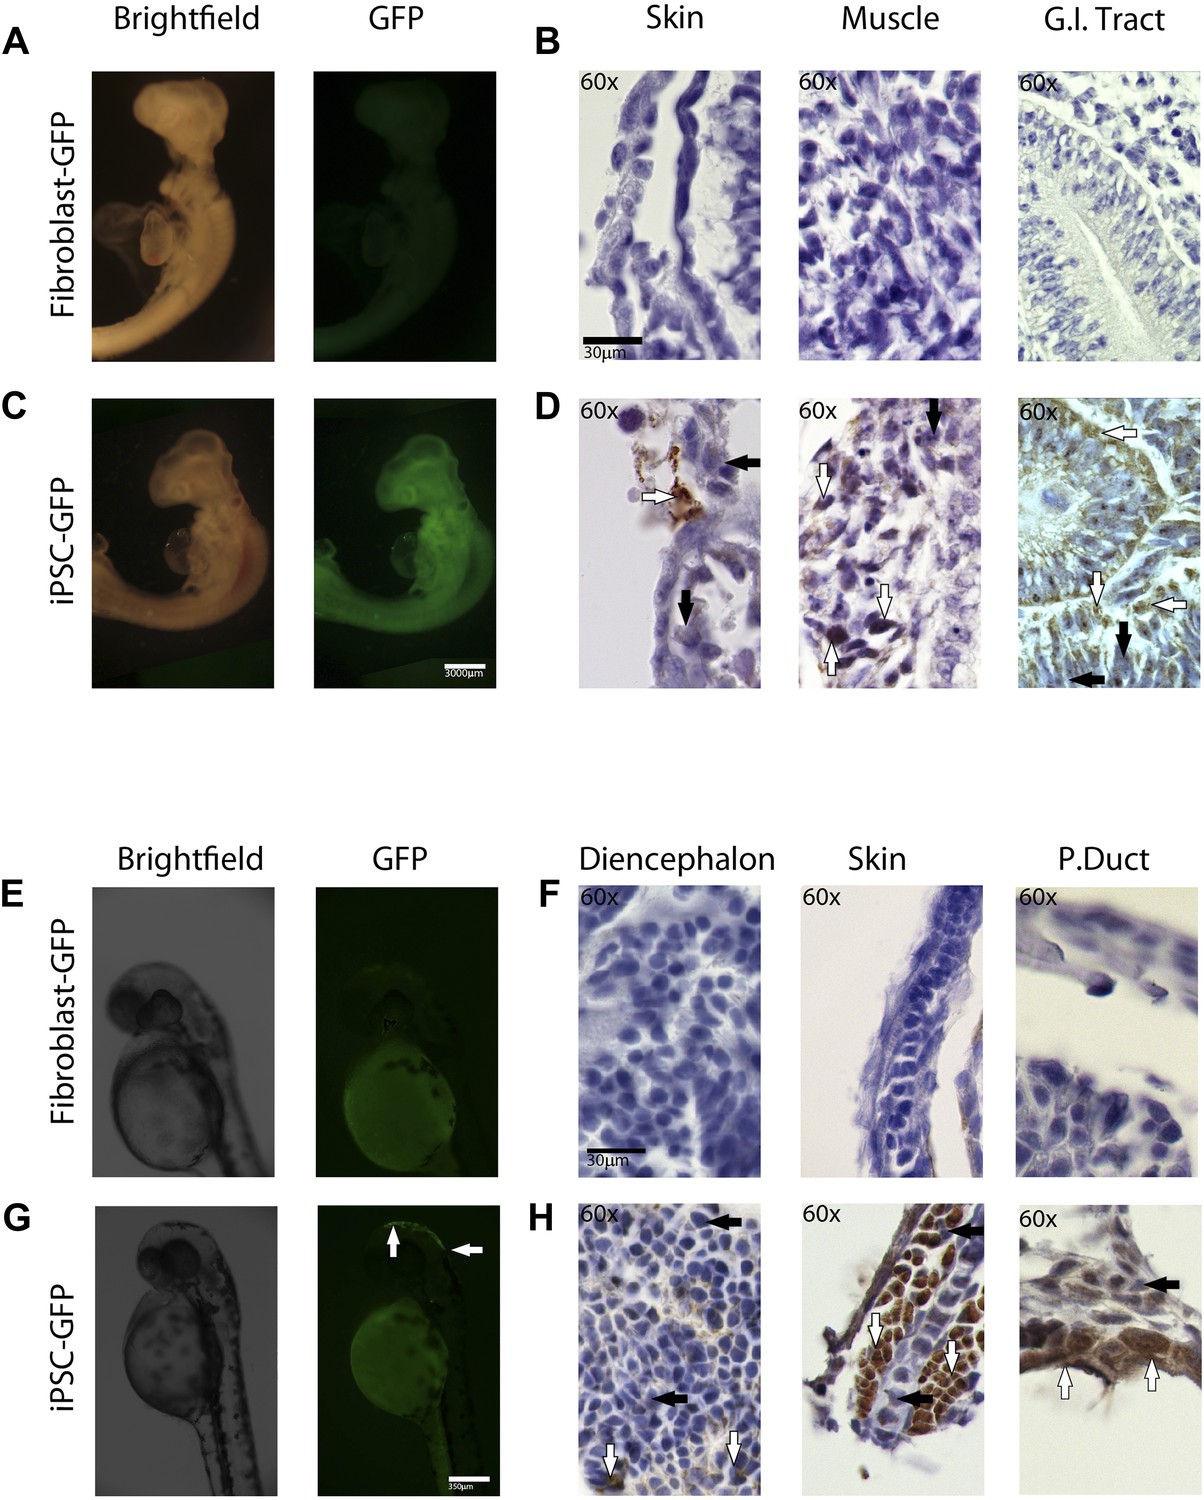
In-vivo pluripotency of iPSC-like cells from chicken and fish.
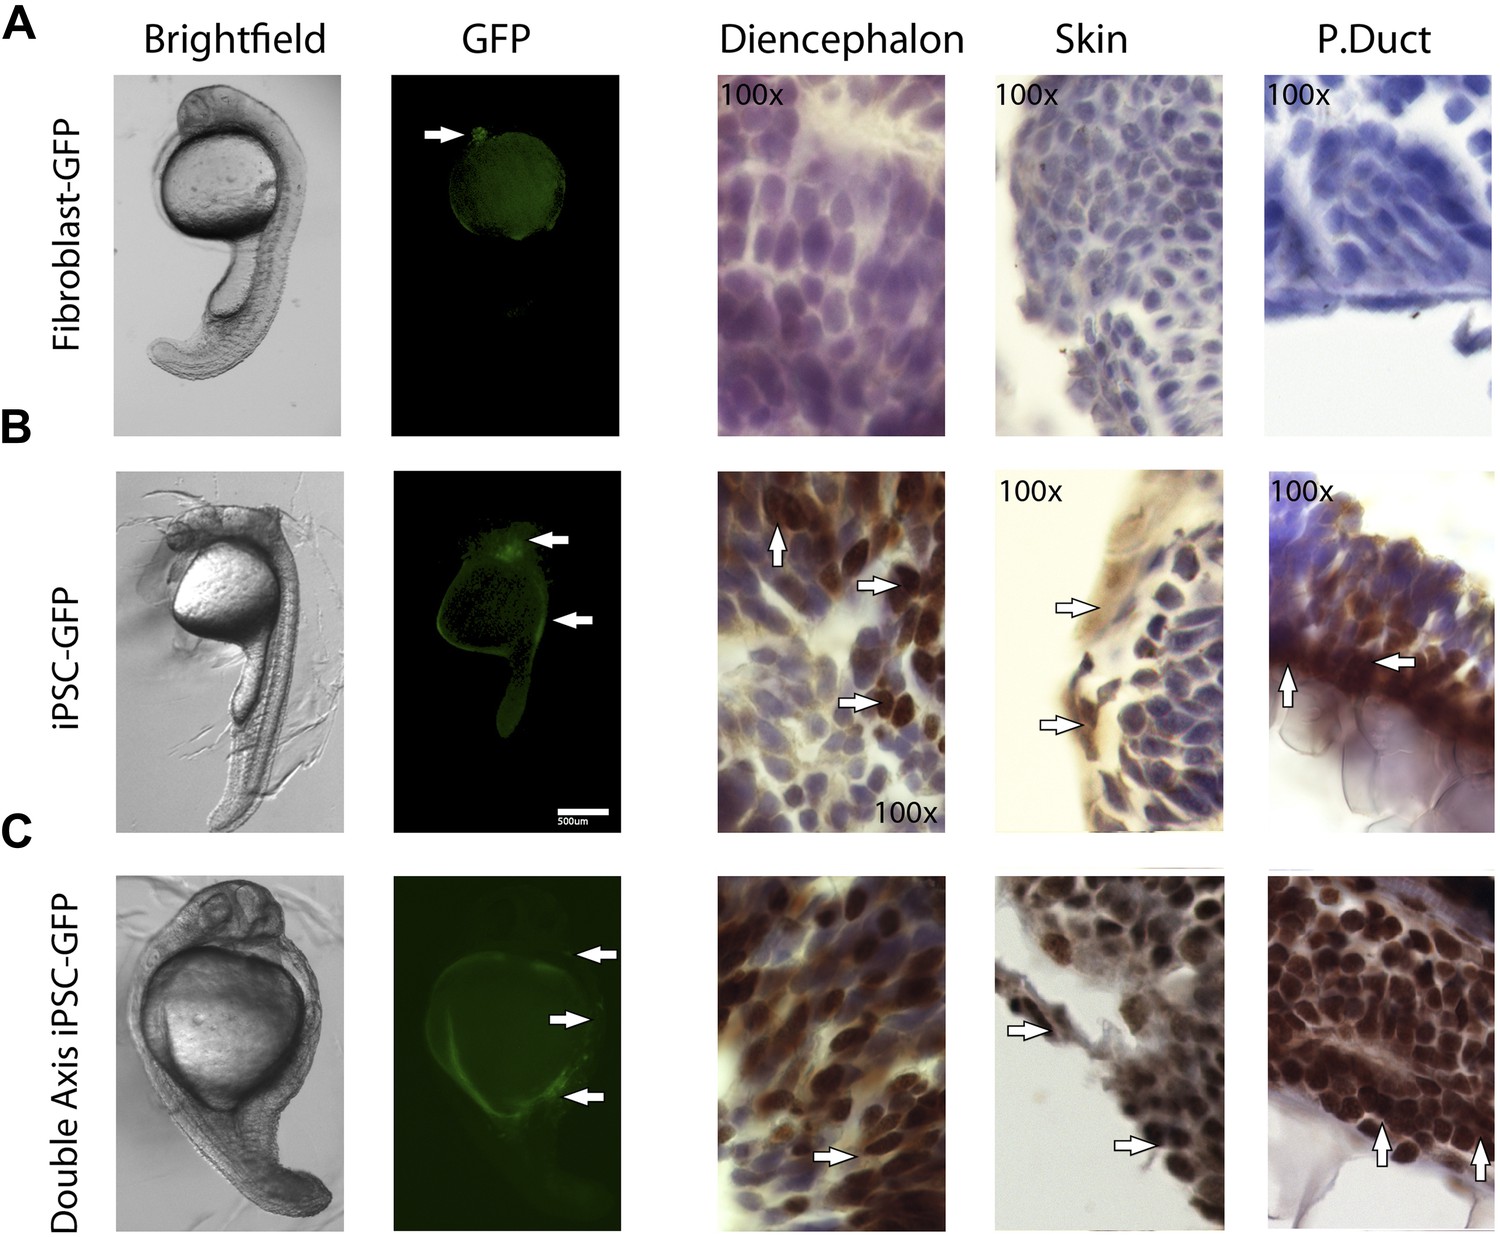
(A and C) 4 day old chicken embryos that had been injected with GFP-labeled chicken fibroblasts (A) or GFP-labeled iPSC-like cells (C) 3 days earlier (GFP labeled cells in Figure 6—figure supplement 1). Incorporated GFP-labeled cells (green) are spread throughout the body for the iPSC cells but, not fibrobloast. (B and D) Histological sections stained with antibodies to GFP (brown) confirming absence of label in chicken fibroblast injected animals (B), and presence of label in multiple tissue types in the iPSC-like injected animals (D). (E and G) 3-day old (72hpf) zebrafish embryos injected with GFP-labeled zebrafish fibroblasts (E) or GFP-labelled iPSC-like cells (G), respectively. (F and H) Histological sections stained with antibodies to GFP (brown) confirming absence in controls (F) and presence of labeled cells in iPSC-like injected animals (H). Arrows in all images point to GFP-labeled cells; P.duct = pronephric duct (P. duct). 1 day old fish embryo is shown in Figure 5—figure supplement 2. Black bars, 30um; white scale bar, 3000 μm for the chicken and 350 μm for the fish. 1 day old post fertilization zebrafish embryos (Figure 6—figure supplement 2), and chicken embryos with partial incorporation (Figure 6—figure supplement 3).
Figure 6—figure supplement 1
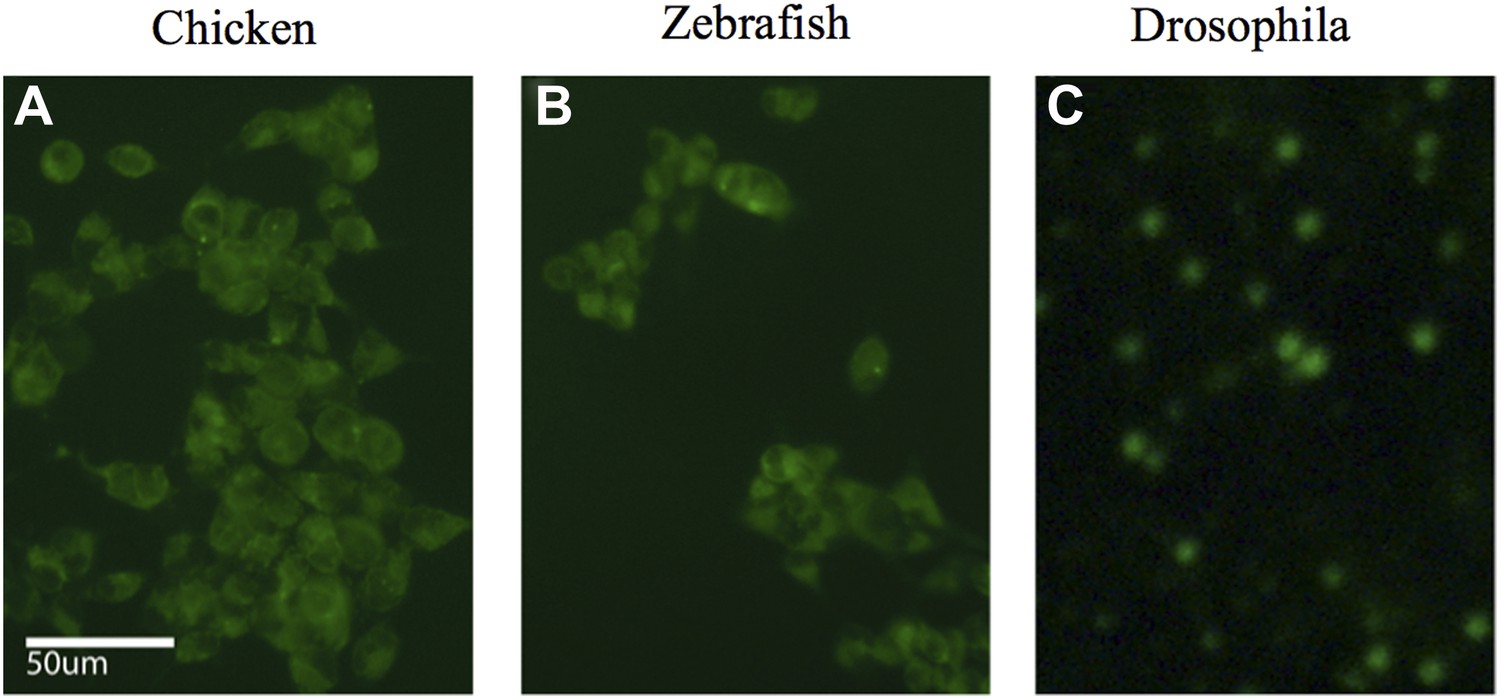
iPSC-like cells for (A) chicken, (B) zebrafish, and (C) Drosophila, transfected with a GFP expressing lentivirus. Post induction to iPSC-like state.
https://doi.org/10.7554/eLife.00036.017
Figure 6—figure supplement 2
1 day old post fertilization zebrafish embryos.
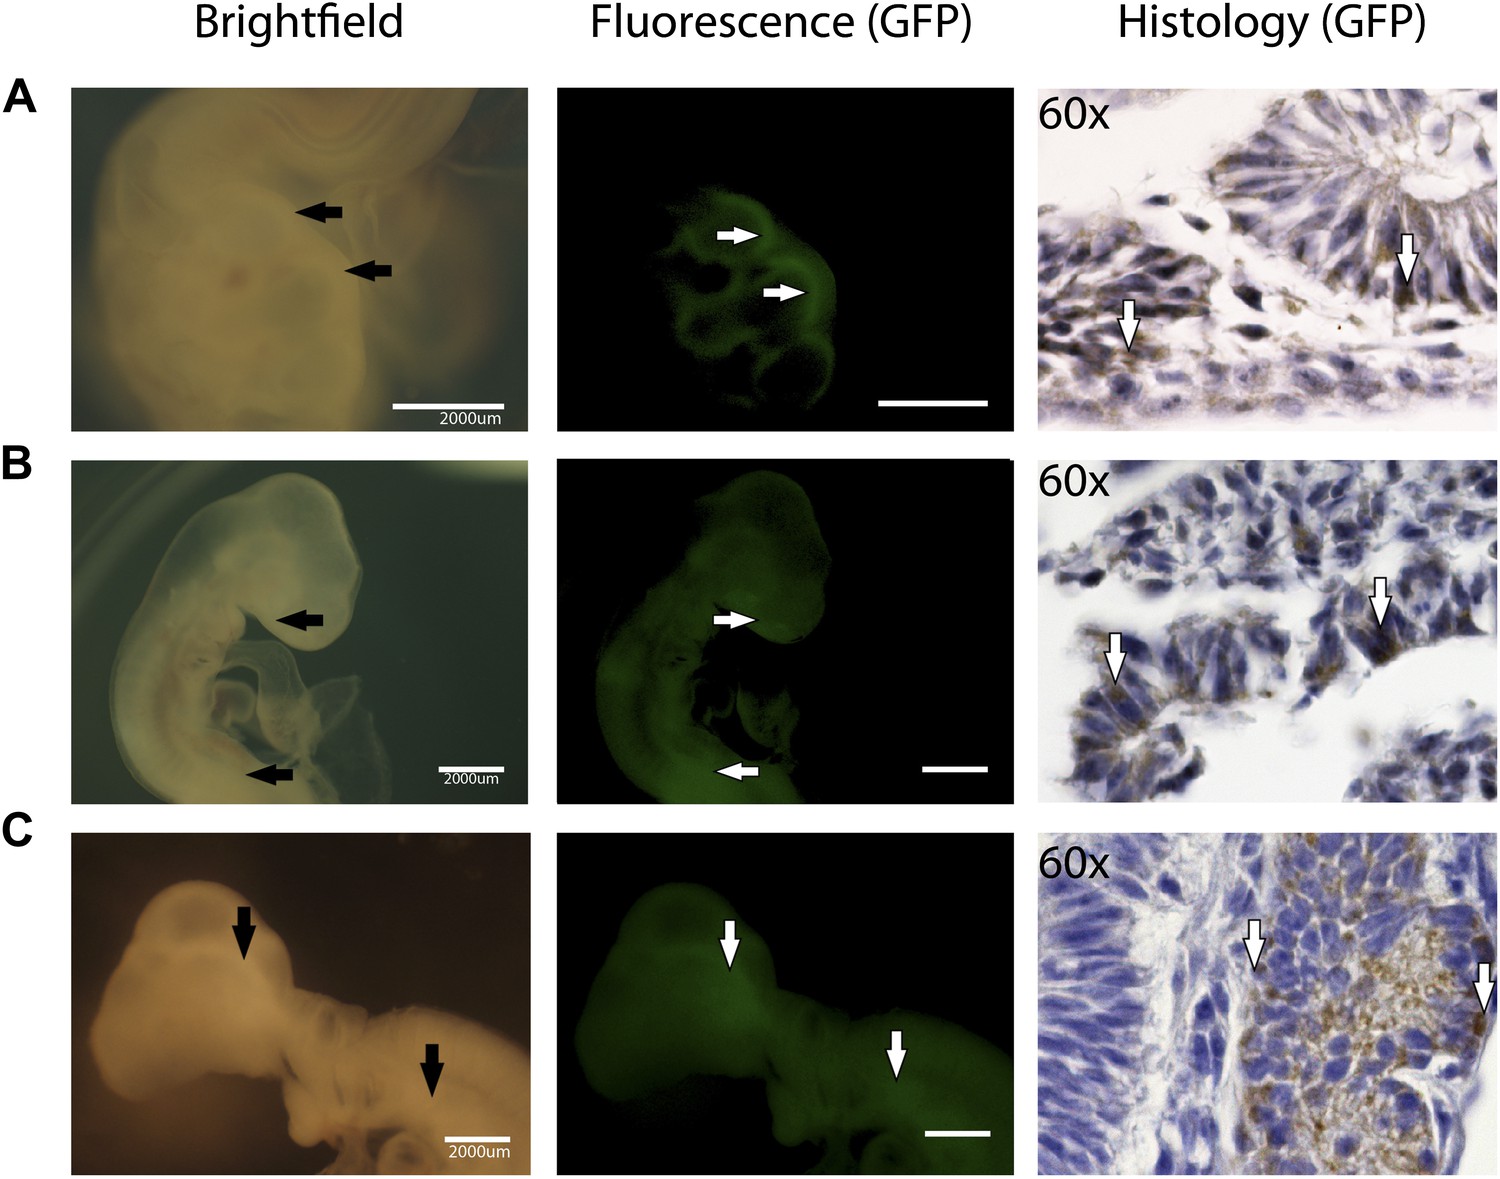
(A) Embryos generated with control fibroblast cells exhibiting some localized flourescent cells. (B) Generated with iPSC-like GFP cells distributed in several parts of the embryo. (C) A double axis embryo, generated with iPSC-like GFP cells, showning one axis with high gfp flourescence, and none on the other. Explanation of histology sections is the same as in Figure 5.
Figure 6—figure supplement 3
Partial incorporation of chicken iPSC-like cells in chicken embryos as demonstrated by fluorescence and immunohistochemistry.
(A) Chicken embryo (day 2) expressing with incorporated cells expressing GFP in the neuraltube, (B) Chicken embryo (day 3) expressing GFP in the mouth and GI Tract C. Chicken embryo expressing GFP in the developing brain.
Tables
Table 1
Comparison of characteristics of the IPSCs or PRPSCs cells across species
| Stem Cell markers | Self-renewal | Pluripotency | ||||||||
|---|---|---|---|---|---|---|---|---|---|---|
| iPSC or PRPSC cells | Morphology | Alkaline phosphatase | Induced endogenous homologs | Exogenous silencing | Gene expression | Proliferation | Telomerase | EB formation/ Teratoma | Gene expression | Chimera formation |
| Mouse | ESC-like clusters | YES | Oct4, Sox2, c-myc, Klf4 | YES | Nanog Vasa SSEA-1 | YES | YES | large aggregates | three germ lines | YES |
| Chicken | ESC-like clusters | YES | Oct4, Sox2, c-myc, −Klf4 | YES | Nanog Vasa SSEA-1 | YES | YES | large aggregates/ Teratomas formed | three germ lines | YES |
| Quail | ESC-like clusters | YES | Oct4, Sox2, c-myc, −Klf4 | YES | Nanog Vasa SSEA-1 | YES | YES | large aggregates /Teratomas formed | three germ lines | ND |
| Finch | ESC-like clusters | YES | Oct4, Sox2, c-myc, −Klf4 | YES | Nanog Vasa SSEA-1 | YES | YES | small aggregates | three germ lines | ND |
| Zebrafish | ESC-like clusters | YES | Oct4, Sox2, c-myc, −Klf4 | YES | - Nanog Vasa SSEA-1 | YES | YES | small aggregates | three germ lines | YES |
| Drosophila | Darker, some clusters | YES | Oct4 (VVL), SoxN, d-myc, −Luna (klf4) | ND | Vasa Dichaete Escargot Snail | YES | NA | small aggregates | NA | ND |
-
A large number of similarities are found. Species differences are highlighted in bold. NA, not applicable; ND, not done.
Additional files
-
Supplementary file 1
(A) Controls and experimental groups. (B) Conditions used for cell derivation and maintenance. (C) Primers used for RT-PCR to amplify and quantify expression of species-specific regions of the genes. (D) p-values for the graphs shown in the figures of this study. All comparisons show Tukey’s post hoc p-values from an ANOVA test, except for titer (Figure 2—figure supplement 2) that shows the overall ANOVA p-value. Bold, significantly different at p<0.05; #, approaches significance. iPSC* = Exogenous expression of factors; iPSCs = Endogenous expression of factors; FB = fibroblast, ESC = Embryonic stem cell, EB = Embryoid body. NA = Not applicable. (E) RNA extraction of adult tissue. The contents of the table denote the origin of the adult tissues template used to compare the different levels of gene expression versus embryonic fibroblasts and iPSC-like cells.
- https://doi.org/10.7554/eLife.00036.021
Download links
A two-part list of links to download the article, or parts of the article, in various formats.
Downloads (link to download the article as PDF)
Open citations (links to open the citations from this article in various online reference manager services)
Cite this article (links to download the citations from this article in formats compatible with various reference manager tools)
Mammalian genes induce partially reprogrammed pluripotent stem cells in non-mammalian vertebrate and invertebrate species
eLife 2:e00036.
https://doi.org/10.7554/eLife.00036


