Dendritic cells loaded with FK506 kill T cells in an antigen-specific manner and prevent autoimmunity in vivo
- The Rockefeller University, United States
- Hospital for Special Surgery, United States
- Howard Hughes Medical Institute, The Rockefeller University, United States
- Memorial Sloan-Kettering Cancer Center, United States
Figures
Figure 1
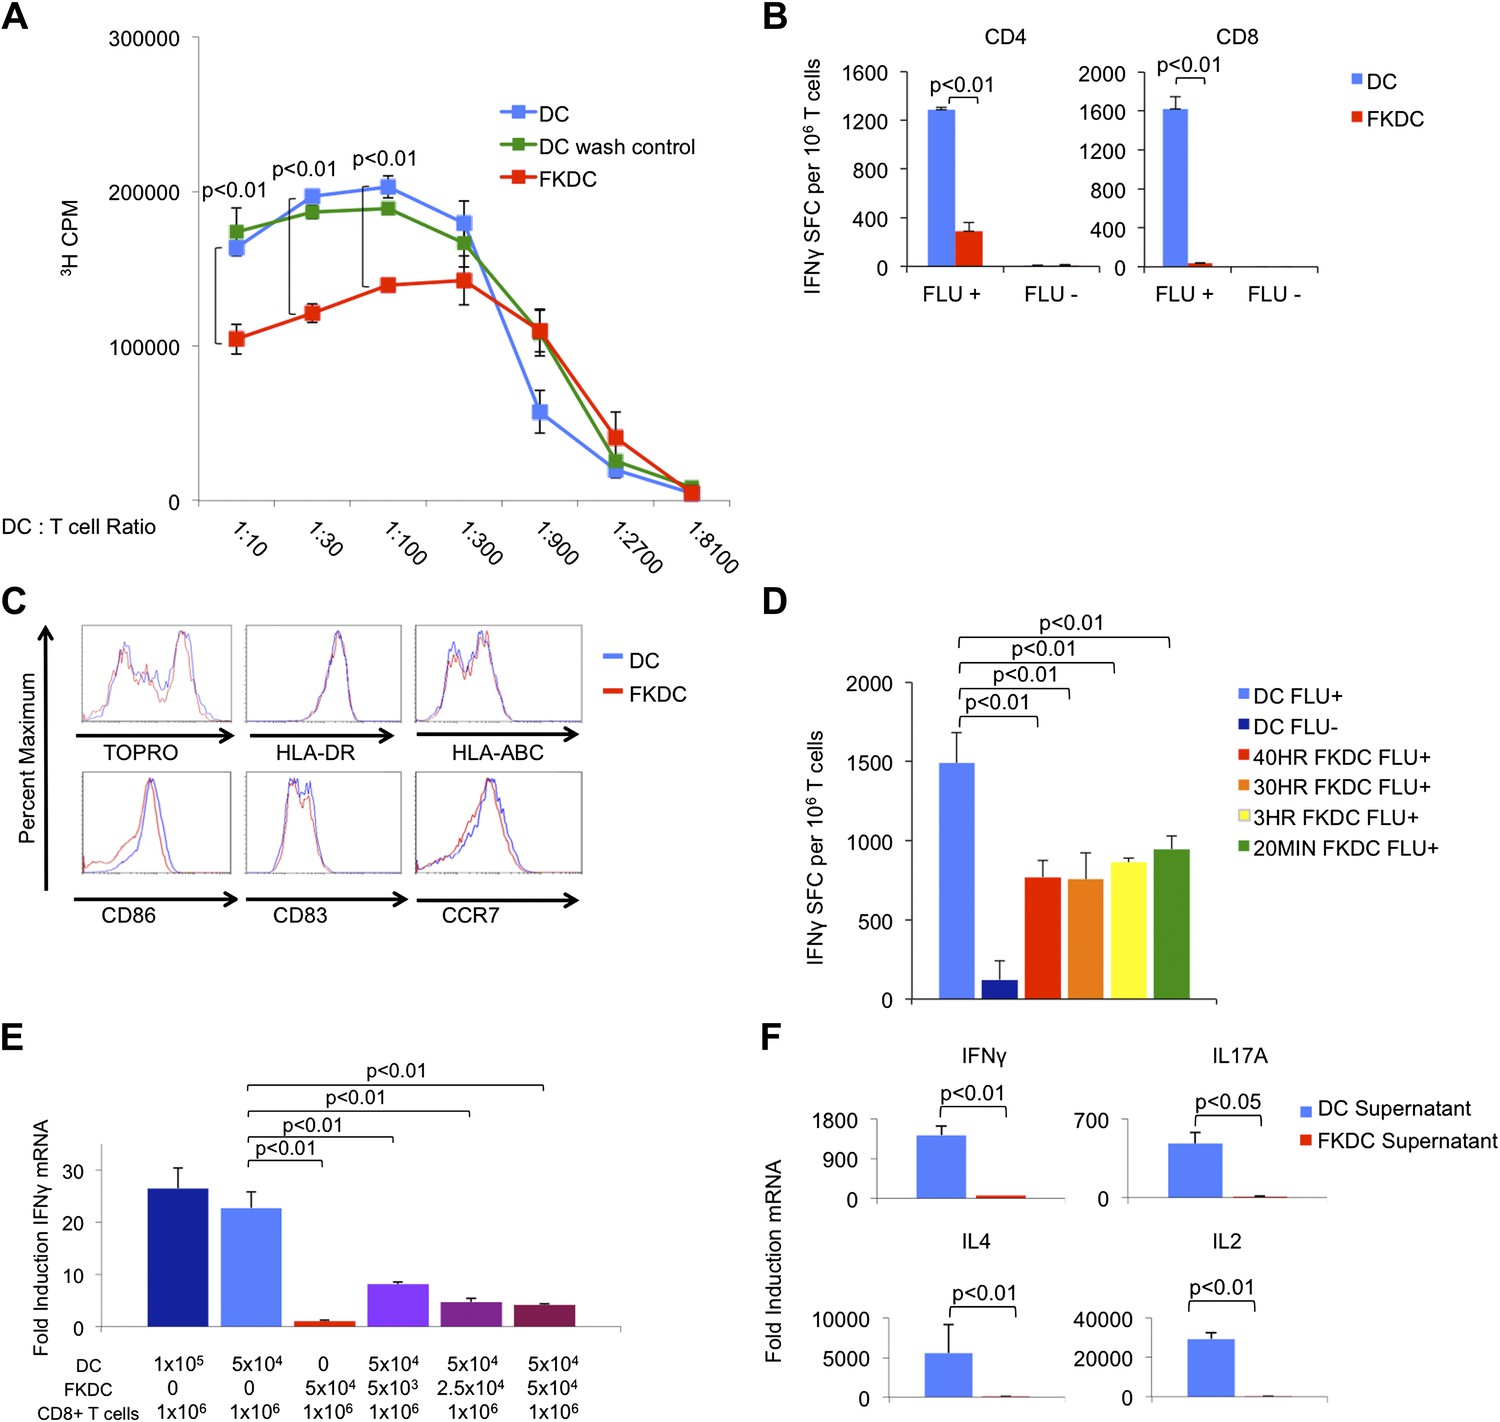
FK506 treated DC secrete a direct T cell inhibitor.
(A) T cell proliferative responses to allogeneic DC or FKDC after 5-day coculture. DC wash control indicates untreated DCs suspended in supernatant of the last wash of FKDC. Data are mean counts per minute ± standard deviation (SD) of triplicate wells. (B) T cell IFNγ Elispot response to DC or FKDC presenting influenza infected (FLU+) or control (FLU−) apoptotic 3T3 cells. Data are mean spot forming cells (SFC) per million cells + SD of triplicate wells. (C) Phenotype of FK506 treated or untreated DC. (D) CD8 T cell IFNγ Elispot response to DC treated with 40 hr, 30 hr, 3 hr or 20 min of FK506. Data are mean SFC per million cells + SD of triplicate wells. (E) CD8 T cell induction of IFNγ mRNA in response to 6-hr stimulation with DC or FKDC. 1 × 10⁶ T cells cultured with various ratios of syngeneic DC and FKDC (x-axis). Data are mean IFNγ mRNA induction of T cells cultured with DC presenting influenza vs DC presenting control cell + SD of triplicate wells. (F) Anti-CD3/28 stimulated T cells cultured in untreated DC or FKDC supernatants. Data are mean mRNA induction of stimulated vs unstimulated groups + SD of triplicate wells. p values were obtained using two-tailed unpaired t-test. Data are representative of three independent experiments.
Figure 2
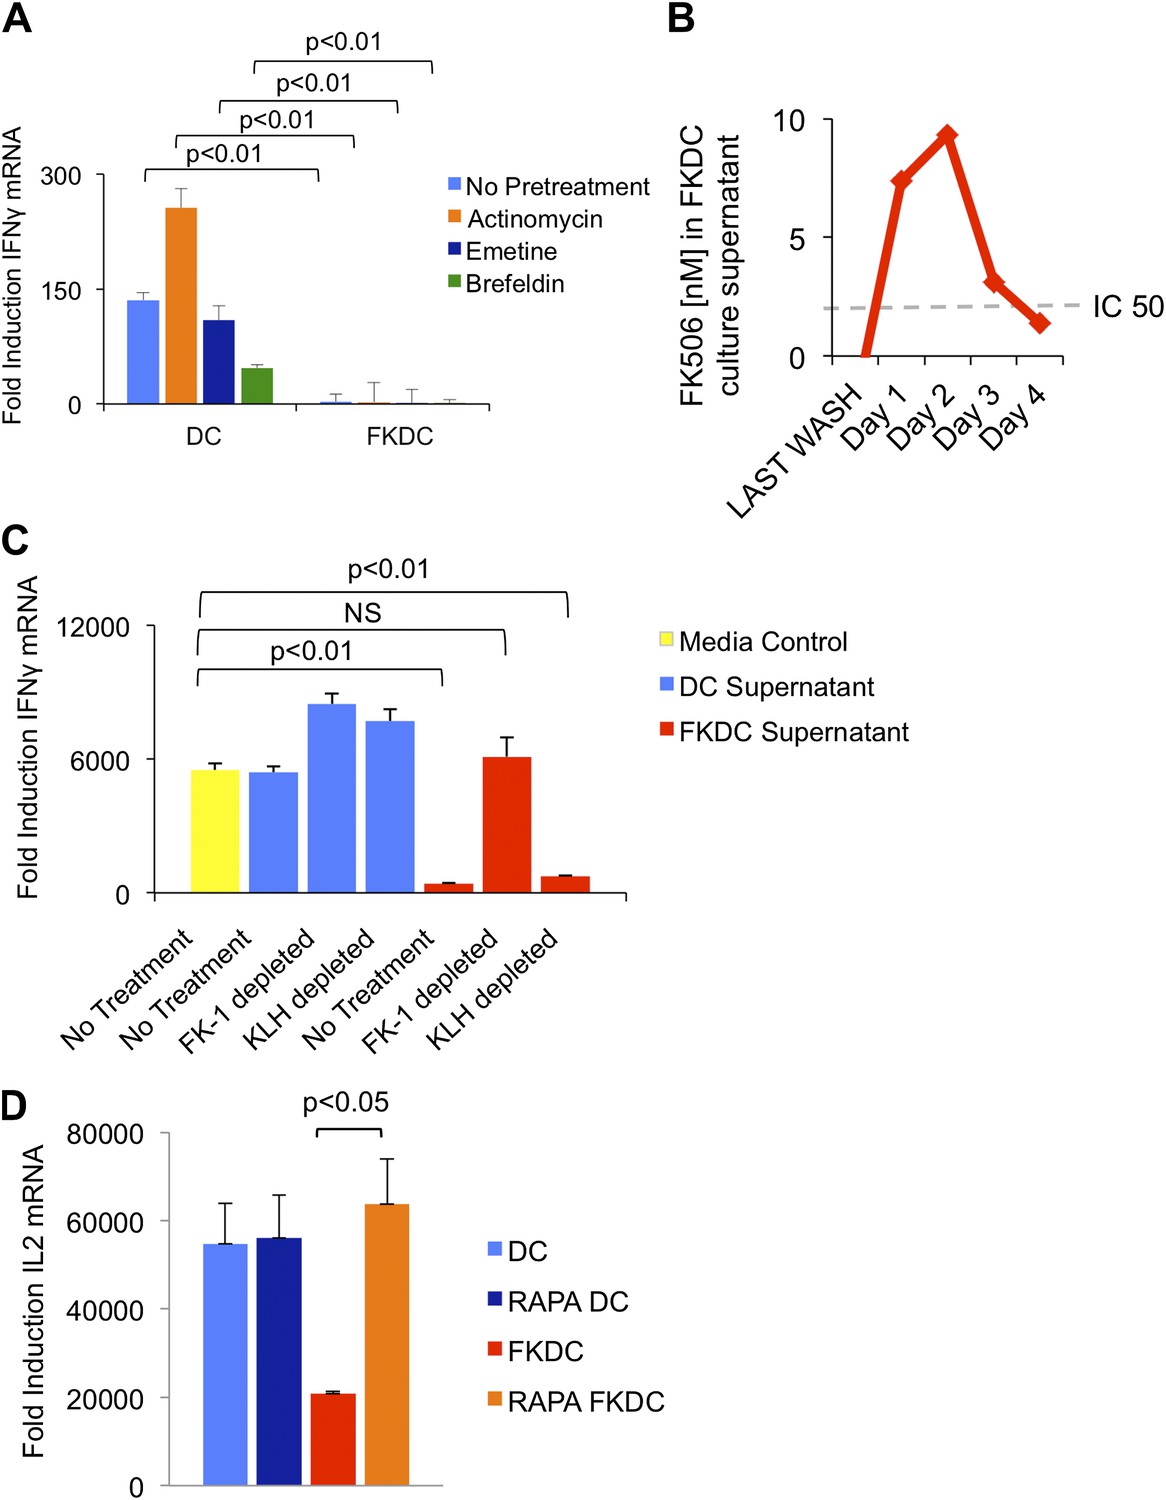
FK506 derived from FK506 treated DC blocks T cell activation.
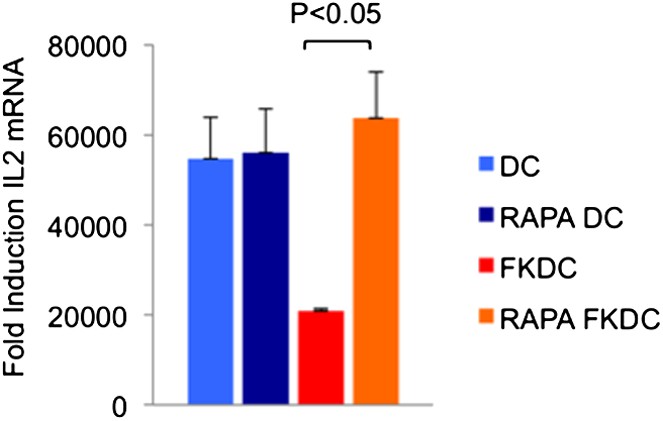
(A) Transcription, translation and translocation through the secretory pathway are not required for FKDC to produce a T cell inhibitor. DC were pretreated with actinomycin, emetine, brefeldin A or media prior to treatment with FK506 or media control and washed extensively. T cells were stimulated for 4 hr with anti-CD3/28 or media and mixed with treated DC. Data are mean IFNγ mRNA induction of stimulated vs unstimulated control T cell groups + standard deviation (SD) of triplicate wells. (B) FKDC were washed and supernatants measured daily via ELISA. Levels after last wash were undetectable. Dashed line indicates FK506 concentration that inhibits 50% induction of IL2. Data are nM ± SD of triplicate wells. (C) FKDC or untreated DC supernatants treated with FK-1 (anti-FK506) or anti-KLH (isotype control) antibody depletion. Depleted supernatants were added to anti-CD3/28 stimulated T cells. Data are mean IFNγ mRNA induction + SD of triplicate wells. (D) DCs treated with 0.5 μM rapamycin or media control for 18 hr prior to treatment with 0.5 μM FK506 or media control for 1 hr and washed extensively. Syngeneic CD4+ T cells were cultured with various treated DCs and CD3/28 beads for 4 hr. Data are mean fold induction of IL2 mRNA of stimulated vs unstimulated cells ± SD. p values were obtained using two-tailed unpaired t-test. Data are representative of three independent experiments.
Figure 3

FK506 derived from FK506 treated DC causes activated T cell death in vitro.
(A) Annexin V stained CFSE labeled allogeneic CD4+ T cells cultured with DC or FKDC ± IL2 for 4 days. Boxes indicate gating strategy for selecting undivided or divided T cells in Figure 3B and C. (B) Histogram of annexin V staining of undivided or divided T cells cultured with allogeneic DC or FKDC ± IL2. Percent annexin V positive divided cells. (C) Histogram of bcl-xl staining of undivided or divided T cells cultured with allogeneic DC or FKDC ± IL2. Percent bcl-xl positive divided cells. (D) CD8 T cell IFNγ Elispot response to DC or FKDC presenting FLU infected apoptotic cells supplemented with IL2. Data are mean SFC + standard deviation of triplicate wells. p values were obtained using two-tailed unpaired t-test. Data are representative of three independent experiments.
Figure 4
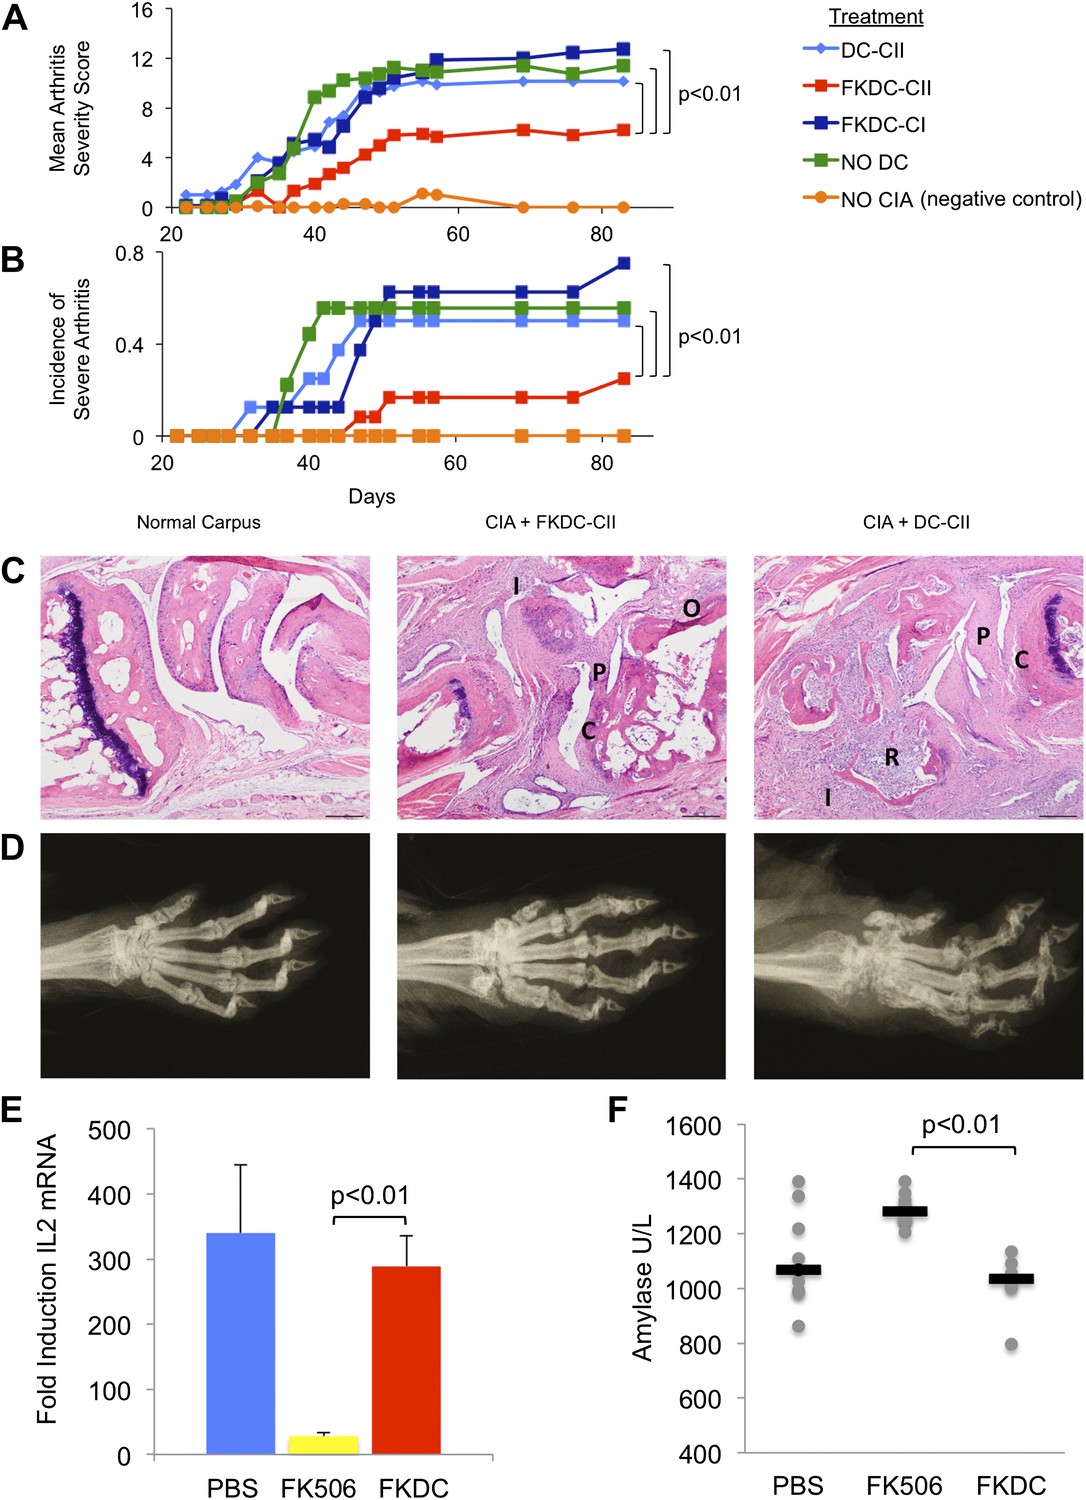
FK506 treated DC modulate antigen specific immune responses in vivo.
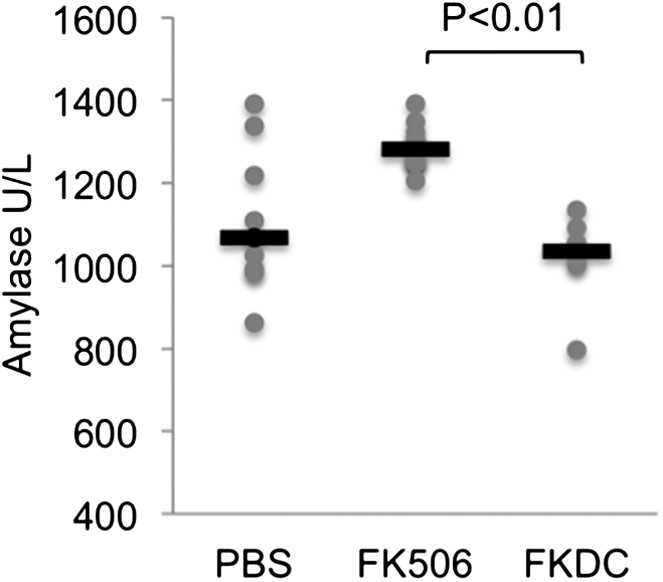
(A) DBA1/J bone marrow derived DC pulsed with either type I or II collagen and treated with FK506 or media. DC were transferred intravenously 7 and 14 days after type II collagen/CFA immunization. Data are mean arthritis severity score of each group on each day. N = 8–12 per group. (B) Incidence of severe arthritis. (C) Histology of normal paw and paw of CIA mouse treated with FKDC-CII or DC-CII (mouse with median histologic score per group is presented). C: Cartilage damage; R: Bone resorption; I: inflammation; P: pannus; O: Osteophyte. (D) Radiographs from paws presented in (C). (E) CD4+ splenocytes from an untreated mouse were cultured with serum drawn from PBS, FK506 or FKDC treated mice after the last dose of treatment (day 14), and the CD4+ T cells then stimulated for 4 hr with CD3/28 beads. Data are mean fold induction of IL2 mRNA of stimulated vs unstimulated groups + standard deviation. N = 6–10 mice per group. p value was calculated using a two tailed t-test to compare FK506 and FKDC groups. (F) Serum chemistries of mice treated with 14 days, as indicated, with PBS, FK506 or FKDC, as described in (E). N = 6–10 mice per group. Gray circles are serum amylase values for individual mice. Black bars represent median values per group. p value was calculated using a two-tailed Mann–Whitney test comparing FK506 and FKDC treated groups. Data from (E) and (F) are representative of two independent experiments.
Author response image 1
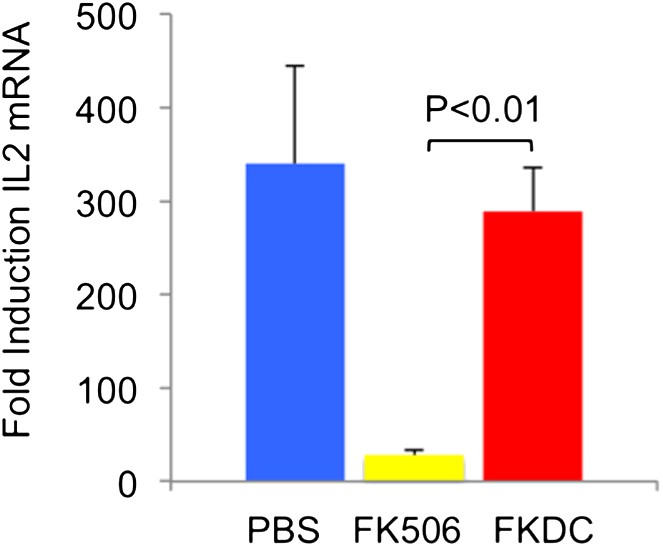
FK506 delivered by DCs protects from systemic immunosuppression.
CD4+ splenocytes from an untreated mouse were cultured with serum drawn from the indicated groups of mice after last dose of either treatment regimen, and the CD4+ T cells were then stimulated for 4 hours with CD3/28 beads. Data are mean fold induction of IL2 mRNA of stimulated vs unstimulated groups + SD. N = 6–10 mice per group. P value was calculated using two-tailed unpaired t-test. Data are representative of two independent experiments.
Author response image 2
FK506 delivered by DCs protects from off-target organ toxicity.
Serum amylase drawn from the indicated groups of mice after last dose of either treatment regimen, as described in Author response image 1. N = 6–10 mice per group. Gray circles are serum amylase values for individual mice. Black bars represent median values per group. P value was calculated using 2 tailed Mann Whitney test comparing FK506 and FKDC groups.
Author response image 3
Effect of Rapamycin and FK506 on DC.
Mature monocyte derived DCs were treated with 0.5 μM Rapamycin or media control for 18 hours prior to treatment with 0.5 μM FK506 or media control for one hour and washed extensively. Syngeneic CD4+ T cells were cultured with various treated DCs and CD3/28 beads for 4 hours. Data are mean fold induction of IL2 mRNA of stimulated vs unstimulated cells +/− SD. P value was calculated using two tailed, unpaired t-test to compare FKDC and RAPA FKDC. Data are representative of three independent experiments.
Tables
Table 1
Mature, monocyte derived DC express mRNA of several FKBP
| Accession number | Gene name | Mean affymetrix expression level | Standard deviation |
| NM_000801.1 | FK506-binding protein 1A (12kD) (FKBP1A) | 1210.0 | 178.4 |
| NM_004470.1 | FK506-binding protein 2 (13kD) (FKBP2) | 370.8 | 23.7 |
| NM_003602.1 | FK506-binding protein 6 (36kD) (FKBP6) | 289.0 | 51.1 |
| NM_012181.1 | FK506-binding protein 8 (38kD) (FKBP8) | 211.8 | 82.9 |
| NM_004117.1 | FK506-binding protein 5 (FKBP5) | 203.6 | 40.8 |
| NM_002014.1 | FK506-binding protein 4 (59kD) (FKBP4) | 121.8 | 47.1 |
| NM_002013.1 | FK506-binding protein 3 (25kD) (FKBP3) | 116.5 | 21.2 |
| AF322070.1 | FK506-binding protein FKBP9 | 115.6 | 11.6 |
| NM_004116.1 | FK506-binding protein 1B (12.6 kD) (FKBP1B) | 90.7 | 25.3 |
-
FK506 binding proteins expressed in mature human DCs are ranked by mean Affymetrix expression level; values over 200 are considered to be robustly present. Mean expression and standard deviation are derived from four biologic replicates.
Download links
A two-part list of links to download the article, or parts of the article, in various formats.
Downloads (link to download the article as PDF)
Open citations (links to open the citations from this article in various online reference manager services)
Cite this article (links to download the citations from this article in formats compatible with various reference manager tools)
Dendritic cells loaded with FK506 kill T cells in an antigen-specific manner and prevent autoimmunity in vivo
eLife 2:e00105.
https://doi.org/10.7554/eLife.00105


