Myosin motors fragment and compact membrane-bound actin filaments
- Max Planck Institute of Biochemistry, Germany
Figures
Figure 1
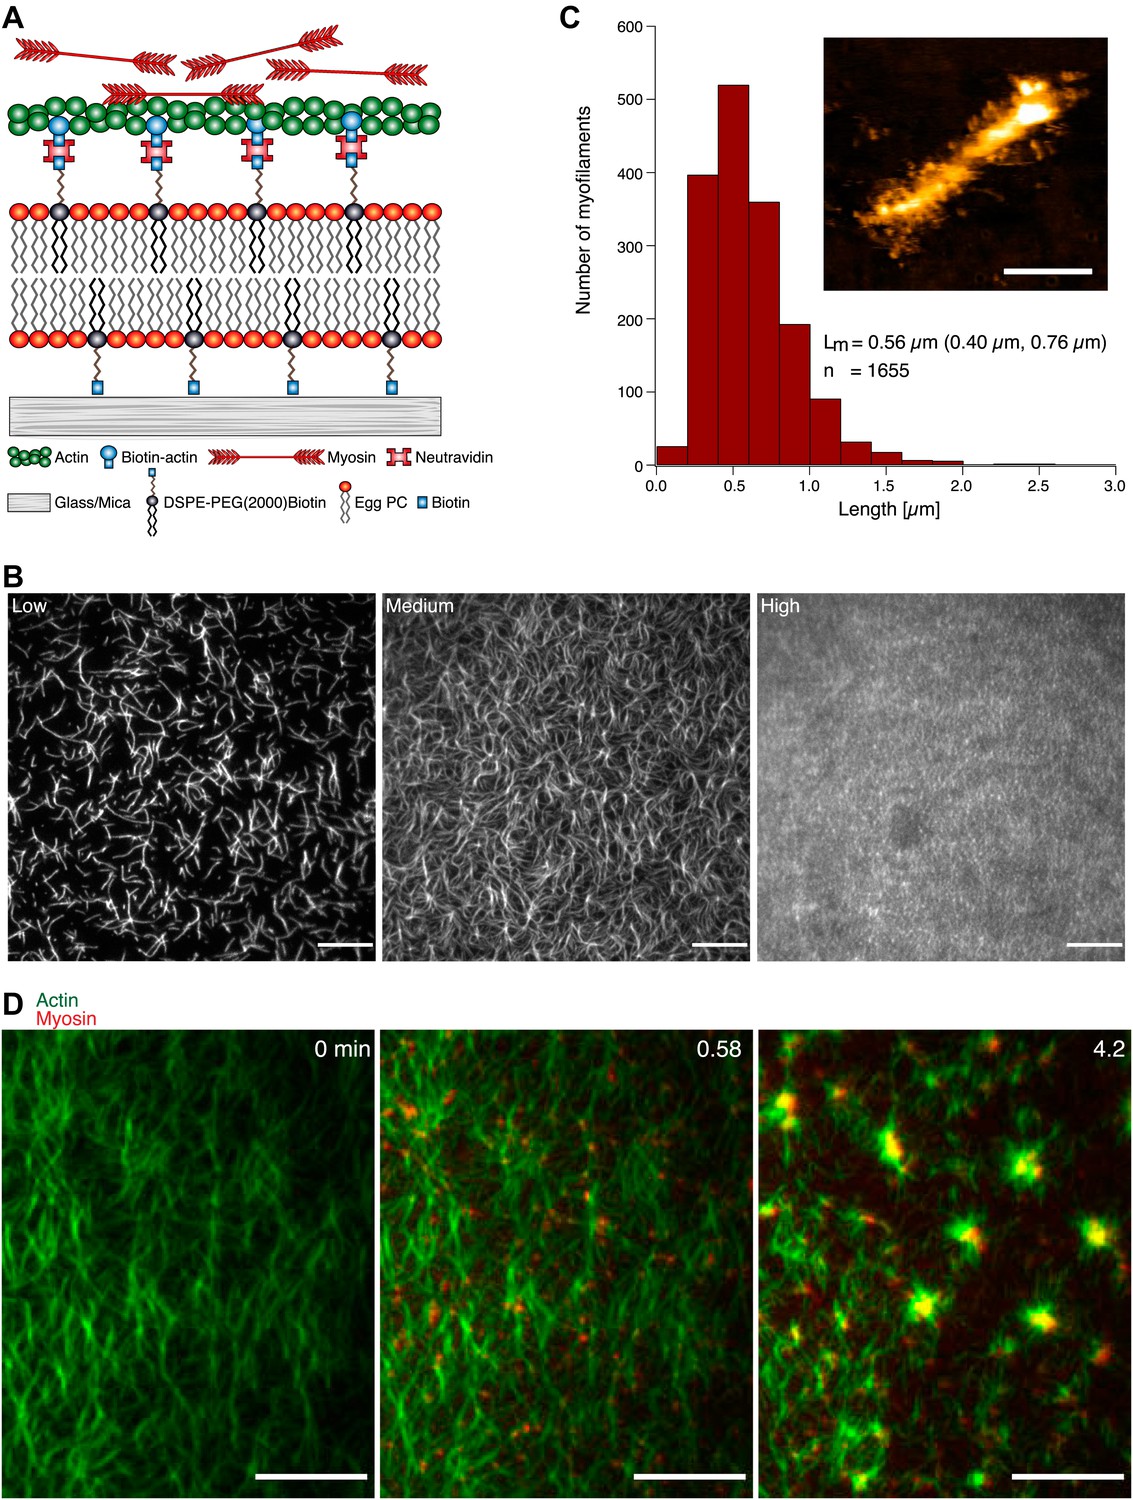
MAC composition and actin pattern formation by myofilaments. (A) Scheme of the MAC. Biotinylated actin filaments are coupled to a supported lipid bilayer (Egg PC) containing biotinylated lipids (DSPE-PEG(2000)-Biotin) via Neutravidin. (B) TIRFM images of MACs containing Alexa-488-phalloidin labeled actin filaments. The increase of actin filament densities (left to right) corresponds to an increase in the amount of DSPE-PEG200-Biotin (low = 0.01 mol%, medium = 0.1 mol%, high = 1 mol%) in the membrane. Scale bars, 10 µm. (C) Length distribution of myofilaments. The median length (Lm) and the 25th and 75th percentile (brackets) are indicated in µm. Inset shows a topographical AFM image of a myofilament. Height, 12 nm; scale bar 200 nm. (D) Dual-color TIRFM time-lapse images of a medium actin density MAC with Alexa-488-phalloidin labeled actin filaments (green) and myofilaments (0.3 µM unlabeled myosin II doped with Alexa 647 myosin II (red)) before (left image) and during actin pattern formation. Scale bars, 10 µm.
Figure 2

Actin filament shortening and compaction by myofilaments. (A) TIRFM time-lapse images of a low actin density MAC with Alexa-488-phalloidin labeled actin filaments before (left image) and after addition of (non-labeled) myofilaments (0.3 µM). Scale bars, 10 µm. (B) Actin filament length distribution at 0, 20 and 53 min after myofilament addition. The median length (Lm) and the 25th and 75th percentile (brackets) are indicated in µm. (C) TIRFM time-lapse sequence of an Alexa-488-phalloidin labeled actin filament in the presence of myofilaments (0.3 µM). Yellow arrowheads point at deformation and breakage events. White arrowheads indicate an increase in fluorescence intensity. Scale bar, 5 µm. (D) and (E) image and the corresponding intensity profile (blue curve) of the actin filament. The intensity was measured along the yellow dashed line shown in (D). The line started and ended outside the actin filament to indicate the background level. Asteriks in (C) and (D) mark the image taken for the intensity profile measurement.
Figure 3
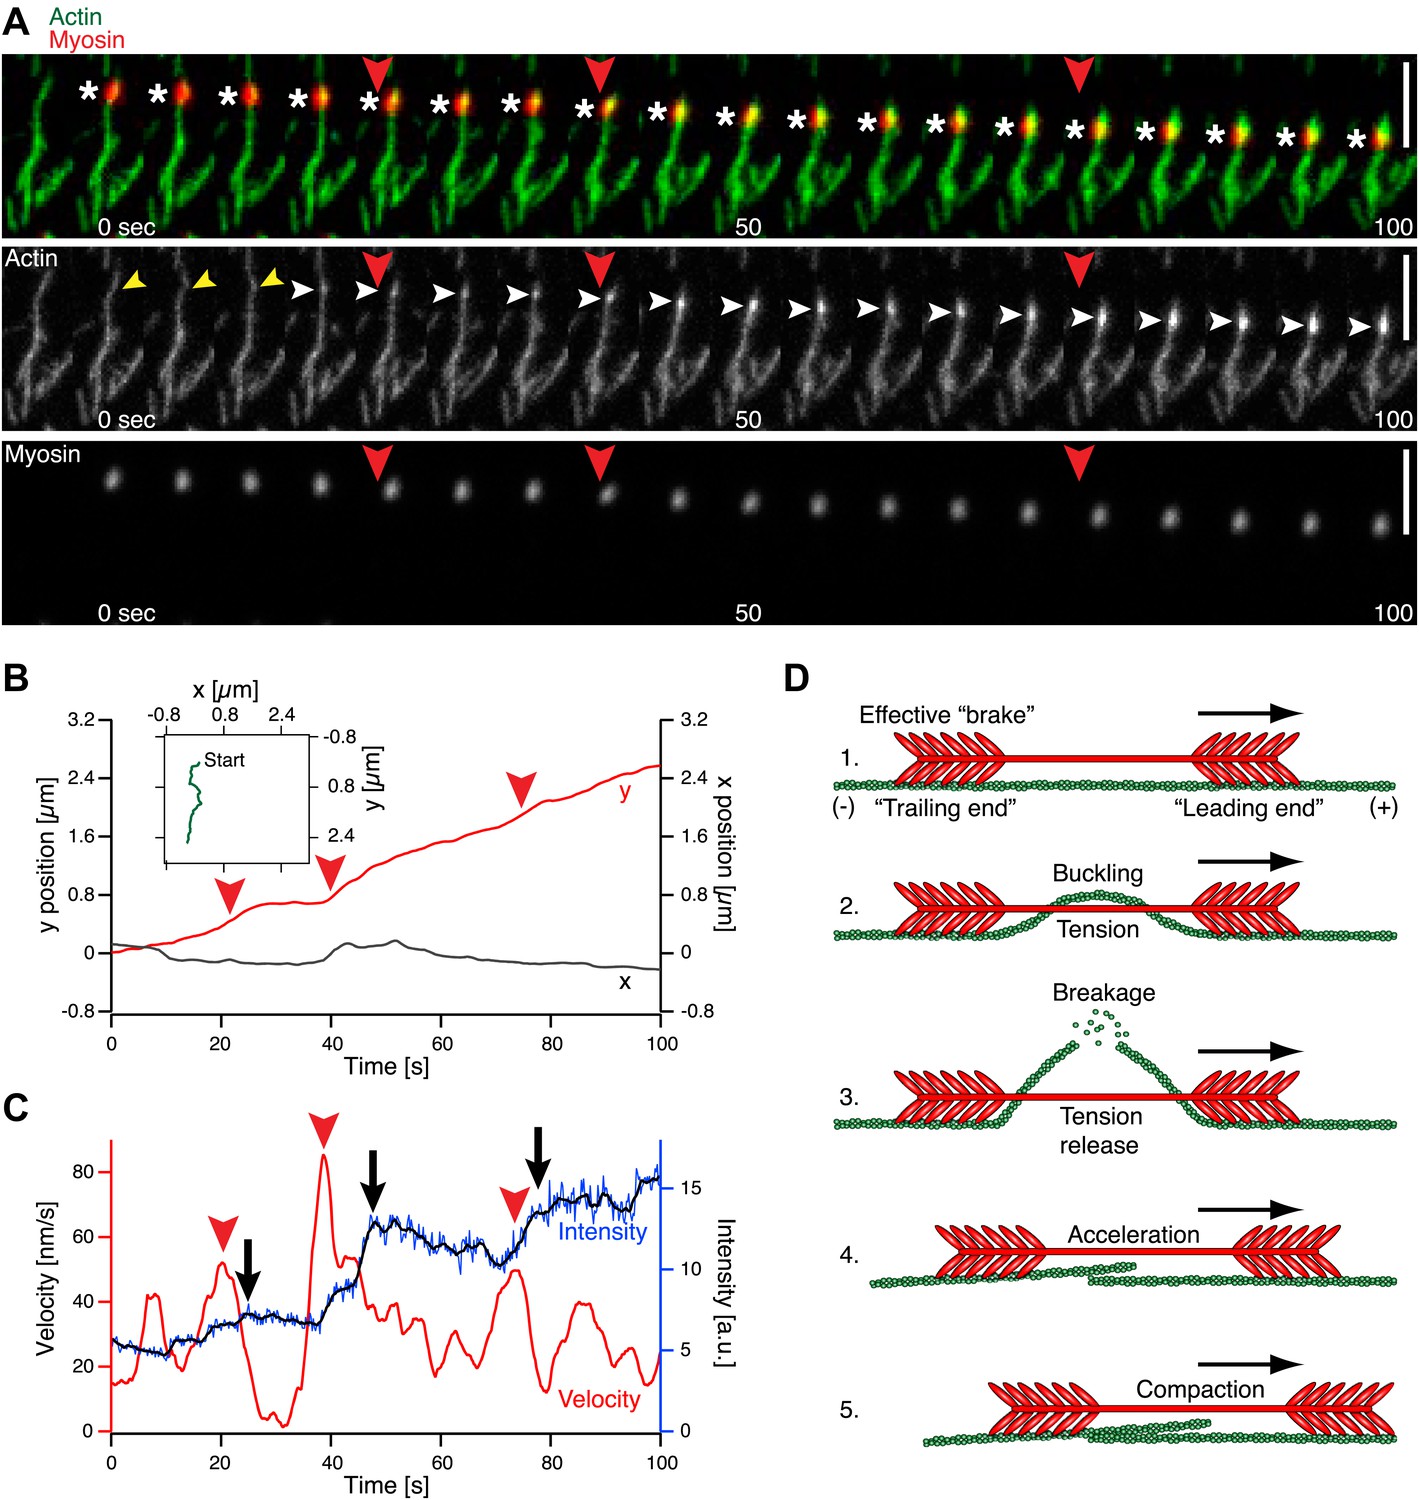
Single molecule analysis of the myofilament movement and actin fragmentation. (A) Dual-color TIRFM time-lapse sequence of a Alexa-647 labeled myofilament (red) moving along an Alexa-488-phalloidin labeled actin filament (green). White asterisks mark the position of the myofilament. Yellow arrowheads point to actin filament deformations. White arrowheads indicate an increase in fluorescence intensity. Scale bars, 5 µm. (B) x (grey curve) and y (red curve) positions of the myofilament movement shown in (A) as a function of time. Inset depicts the trajectory (green curve). (C) Myofilament velocity (red curve) calculated from the xy positions in (B) and actin filament intensity (blue [raw data] and black [smoothed] curves) over time. Red arrowheads denote acceleration events. Black arrows point to fluorescence intensity increases. Red arrowheads in (A)–(C) mark corresponding time points in (A). (D) Proposed model for myofilament driven actin fragmentation and compaction (details in text).
Figure 4

Simulation of the interaction between myofilaments and an actin filament. (A) Mean tension force F within the myofilament when bending of actin is not allowed; dependence on ATP concentration for several different numbers of interacting myosin heads nm. The forces when the myosin heads of the trailing end are not performing steps (pst=0, points connected by a solid line) are slightly higher than the forces when the steps occur with the probability pst=0.1 (dashed lines). (B) Mean tension force when the actin filament is allowed to bend at the threshold force of 23 pN (points and solid line: pst=0, dashed line: pst=0.1). (C) Actin filament curvature fluctuations during 20 s of the simulation at 0.0025 mM ATP concentration, showing that the critical curvature of 5.6 µm−1 needed for actin filament breakage is often reached, while at higher ATP concentration (0.01 mM), the critical curvature is never reached (D) (pst=0 in (C) and (D)).
Figure 5
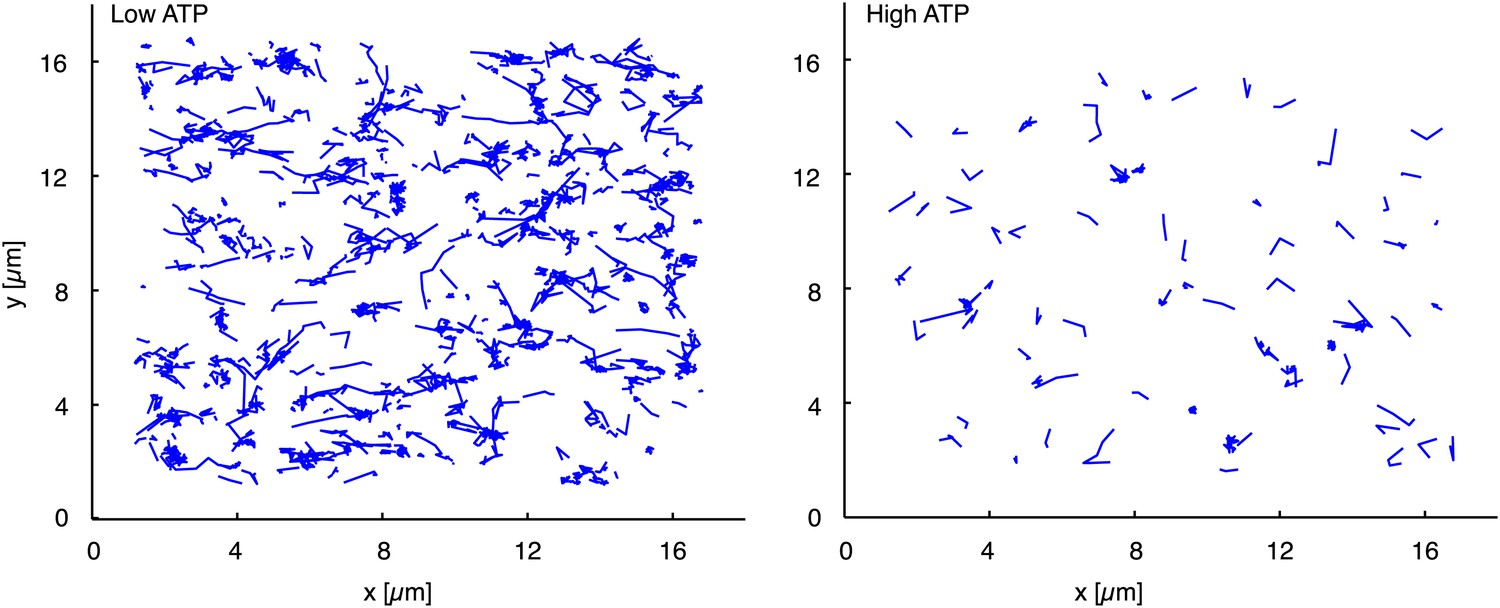
Trajectories of individual myofilaments moving along actin filaments. Left panel displays the trajectories of myofilaments at low (1 µM) ATP concentration (see also the corresponding Movie 5). Right panel shows trajectories of myofilaments at high (4 mM) ATP concentration (see also the corresponding Movie 5). Myofilaments were tracked for one minute and those who stayed less than 900 ms attached to the actin filament were filtered out (Rogers et al., 2007).
Figure 6

Dependence of the mean velocity and mean number of attached myosin heads on the ATP concentration obtained from the simulations of myofilament–actin filament interaction. (A) Mean velocity (points and solid line: pst=0, dashed line: pst=0.1). (B) Mean fraction of attached myosin heads.
Figure 7
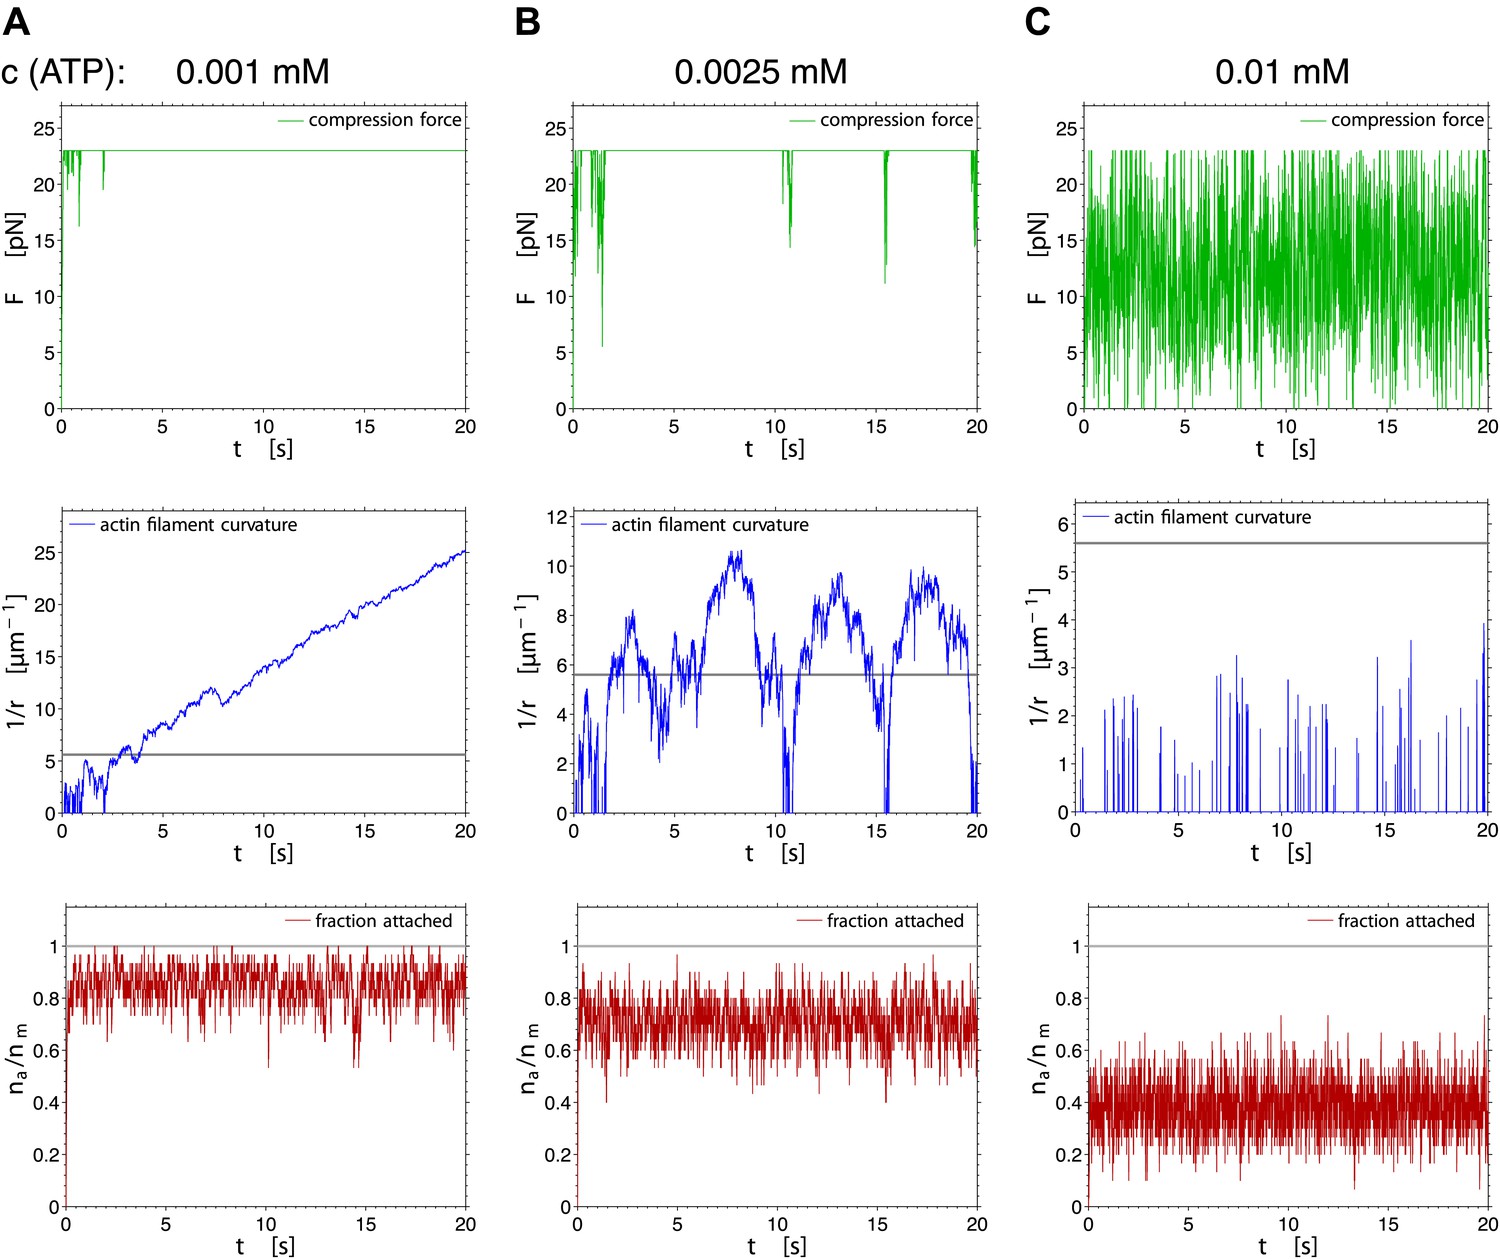
Fluctuations of the compression force (upper row), the actin curvature (middle row) and the fraction of attached myosin heads (lower row) during 20 s of the simulation, for three different ATP concentrations (pst=0).
Figure 8
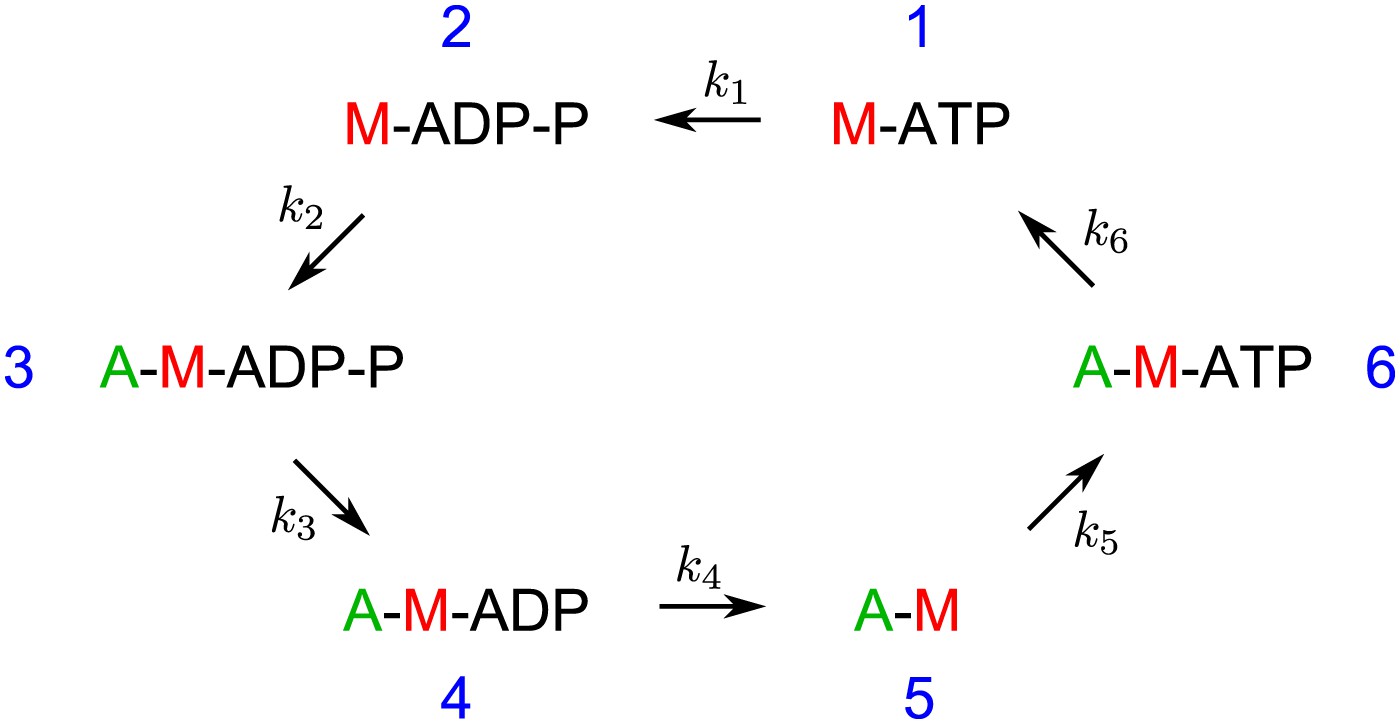
The biochemical cycle of the myosin heads with rates k1–k6 assumed in the model and the simulations. The rate k5 is ATP-dependent.
Figure 9
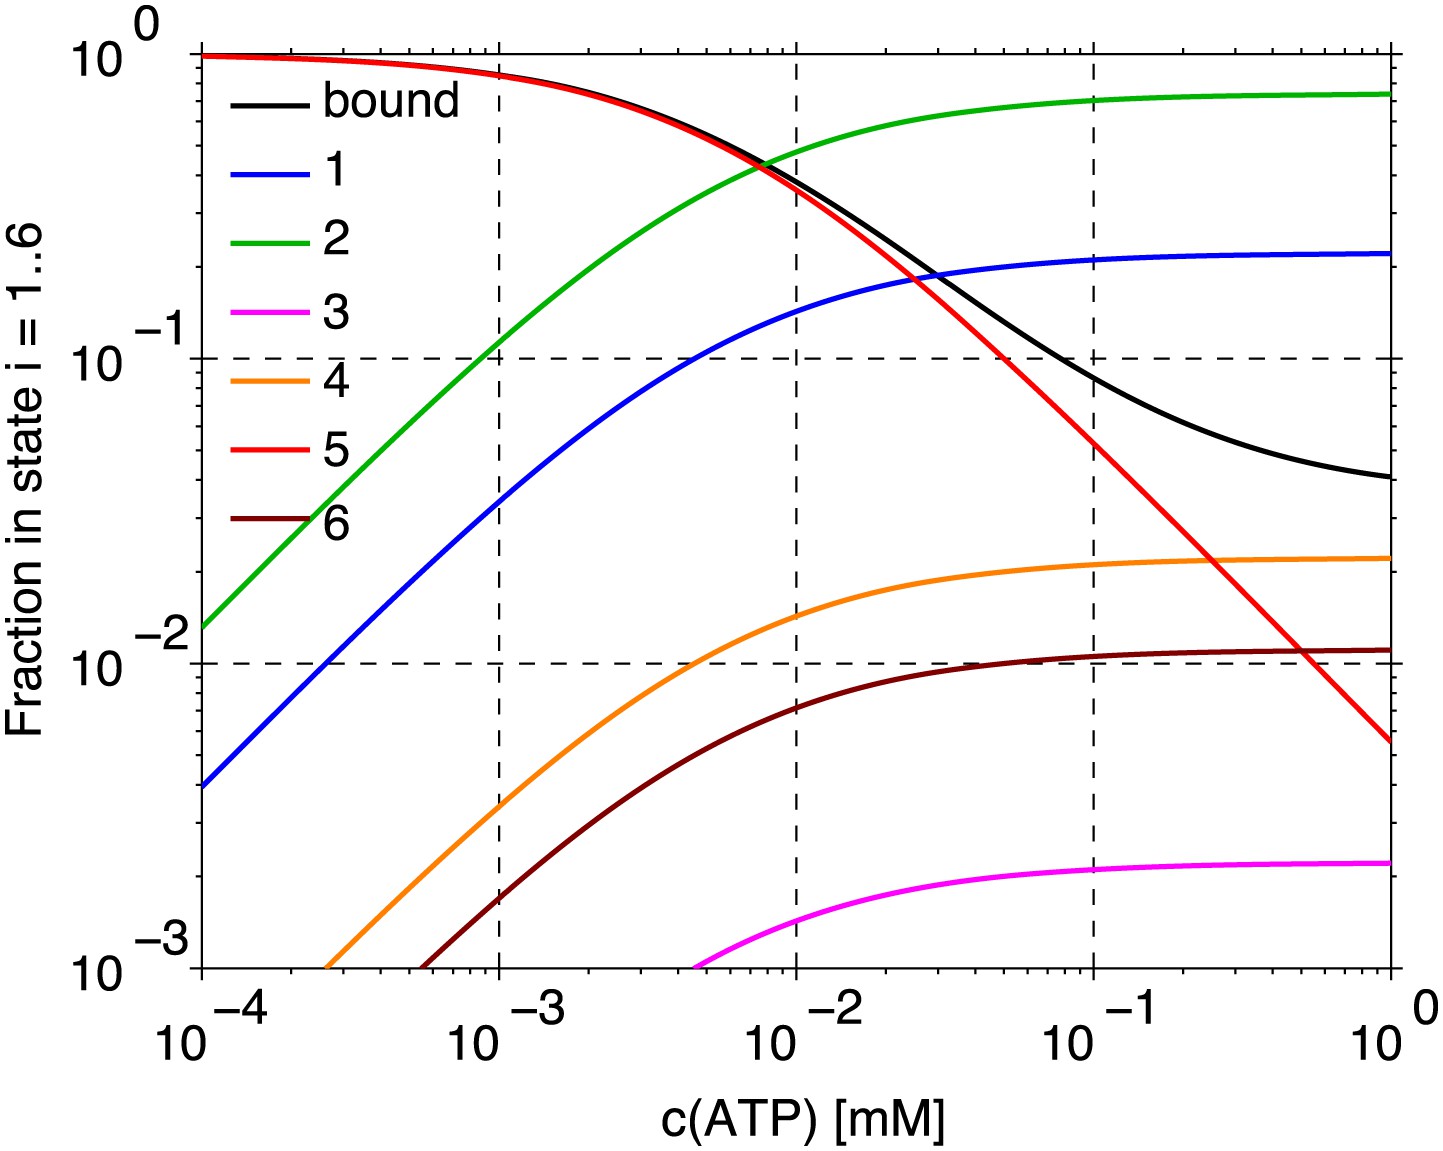
The fractions of myosin heads in states 1–6, and in the actin-bound state (sum of states 3–6) in dependence on the ATP concentration. The values are calculated from the model of the myosin head cycle in Figure 8.
Videos
Movie 1
Actin pattern formation by myofilaments.
Medium density MAC containing Alexa-488-phalloidin labeled actin filaments (green) exhibits dynamic rearrangements of actin filaments after addition of myofilaments (0.3 µM unlabeled myosin II doped with Alexa 647 myosin II [red]). Original image sequence was acquired at 200 ms intervals and contained 1500 frames. The frame number in the video was reduced to 187 frames and is displayed at 15 frames per second (fps). Total time: 5 min. Corresponds to Figure 1D (compressed avi; 32.7 MB).
Movie 2
Shortening of individual actin filaments by myofilaments.
Individual Alexa-488-phalloidin labeled actin filaments in a low density MAC shorten over time in the presence of myofilaments. Original image sequence was acquired at 400 ms intervals and contained 8000 frames. The frame number in the video was reduced to 248 frames and is displayed at 30 fps. Total time: 53 min. Corresponds to Figure 2A. (compressed avi; 7.7 MB).
Movie 3
Fragmentation of a single actin filament.
Example of a single Alexa-488-phalloidin labeled actin filament during its fragmentation and compaction in the presence of myofilaments. Images were acquired at 400 ms intervals. The video contains 1451 frames and is displayed at 100 fps. Total time: 9.7 min. Corresponds to Figure 2C. (compressed avi; 2.8 MB).
Movie 4
Movement and actin fragmentation by a single myofilament.
Example of a single Alexa-647 labeled myofilament during its directed movement along an Alexa-488-phalloidin labeled actin filament. During the movement the myofilament breaks and compacts the actin filament. Images were acquired at 200 ms intervals. The video contains 668 frames and is displayed at 60 fps. Total time: 2.2 min. Corresponds to Figure 3A. (compressed avi; 1.3 MB).
Movie 5
Behavior of single myofilaments at low and high ATP concentrations.
The video shows the binding and moving behavior of Alexa-647 labeled myofilaments added to medium actin density MACs at low (1 µM) and high (4 mM) ATP concentrations respectively. The white bar in the middle separates the movies of low ATP concentration (left) and high ATP concentration (right). Note the comparatively higher number of myofilaments that are bound to actin filaments and exhibit movement at the low ATP concentration (left). By contrast at high ATP concentration (right) bound myofilaments are less frequently visible and do not move. Images were acquired at 300 ms intervals. The video contains 200 frames and is displayed at 15 fps. Total time: 1 min. The video was used for the tracking data presented in Figure 5. (compressed avi; 3.3 MB).
Tables
Table 1
ATP dependency of contraction and fragmentation. ATP was kept at a constant level during the experiment by enzymatic regeneration (see ‘Material and methods’). Buffer containing ATP concentrations listed in the table and 0.3 µM myofilaments were added to medium and or low-density MACs. Contraction here is defined as visible dynamic rearrangements of actin filaments after myofilament addition. Fragmentation implies visible actin filament breakage events after myofilament addition
| Regenerated ATP concentration (µM) | Contraction | Fragmentation |
| 100 | No | No |
| 50 | No | No |
| 25 | No | No |
| 12.5 | No | No |
| 10 | No | No |
| 1 | Yes | Yes |
| 0.3 | Yes | Yes |
| 0.1 | Yes | No |
| 0 | No | No |
Download links
A two-part list of links to download the article, or parts of the article, in various formats.
Downloads (link to download the article as PDF)
Open citations (links to open the citations from this article in various online reference manager services)
Cite this article (links to download the citations from this article in formats compatible with various reference manager tools)
Myosin motors fragment and compact membrane-bound actin filaments
eLife 2:e00116.
https://doi.org/10.7554/eLife.00116


