Distinct gating mechanisms revealed by the structures of a multi-ligand gated K+ channel
- University of Texas Southwestern Medical Center, United States
- Howard Hughes Medical Institute, University of Texas Southwestern Medical Center, United States
- Zhejiang University, China
Figures
Figure 1
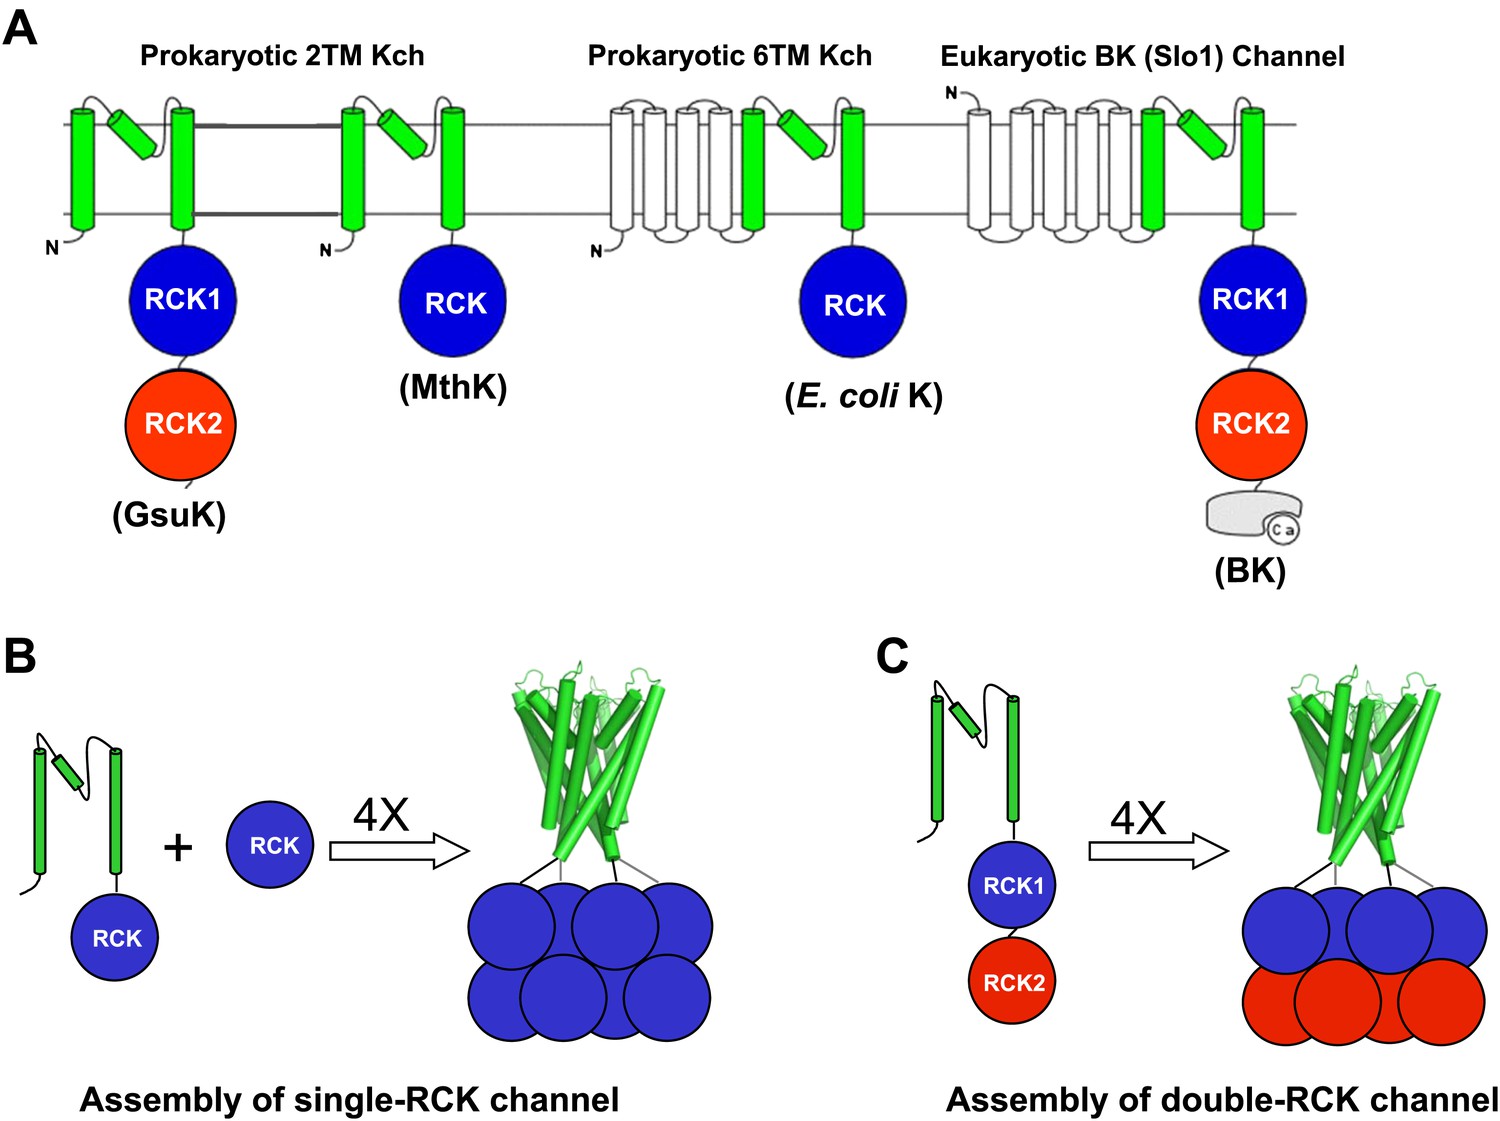
RCK-Regulated K+ Channels. (A) Topology of RCK-regulated K+ channels. (B) Functional assembly of single RCK-containing channels such as MthK. (C) Functional assembly of double RCK-containing channels such as GsuK in this study.
Figure 2
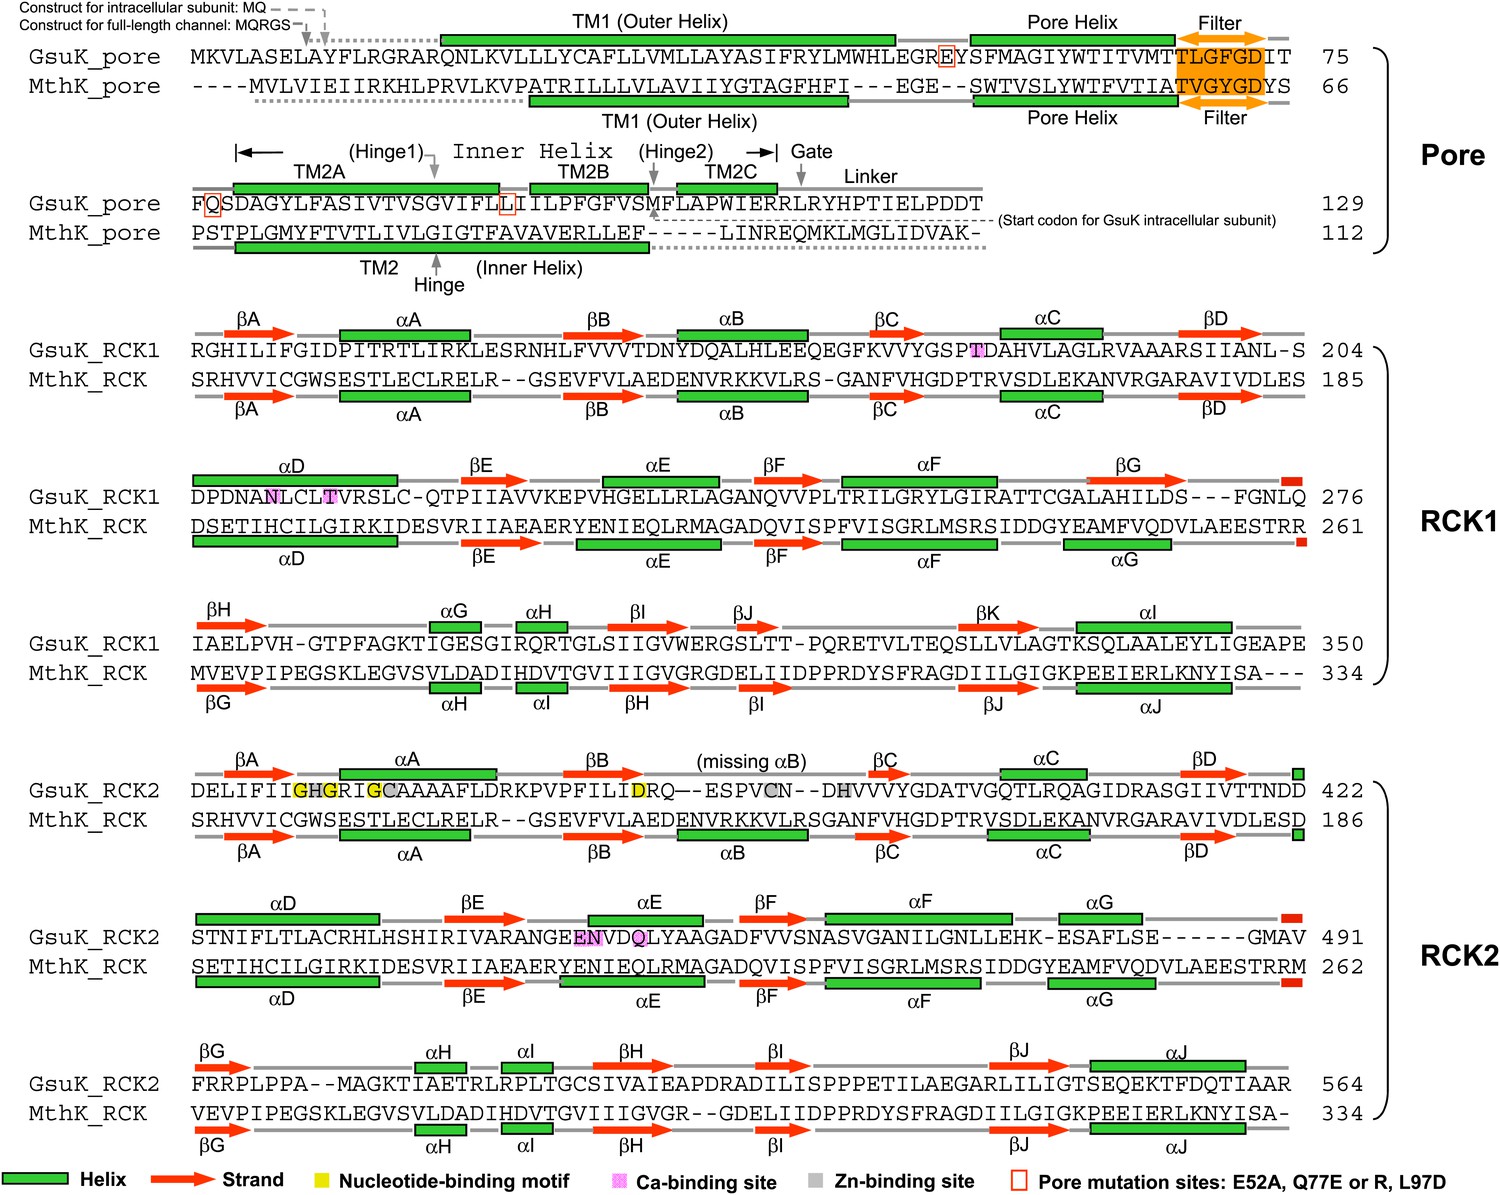
Sequence and secondary structure comparison between GsuK and MthK. For comparative purposes, the secondary structural elements of each GsuK RCK domain are labeled following the same nomenclature used for MthK. A duplicate copy of MthK RCK is used in the alignment with GsuK RCK2.
Figure 3
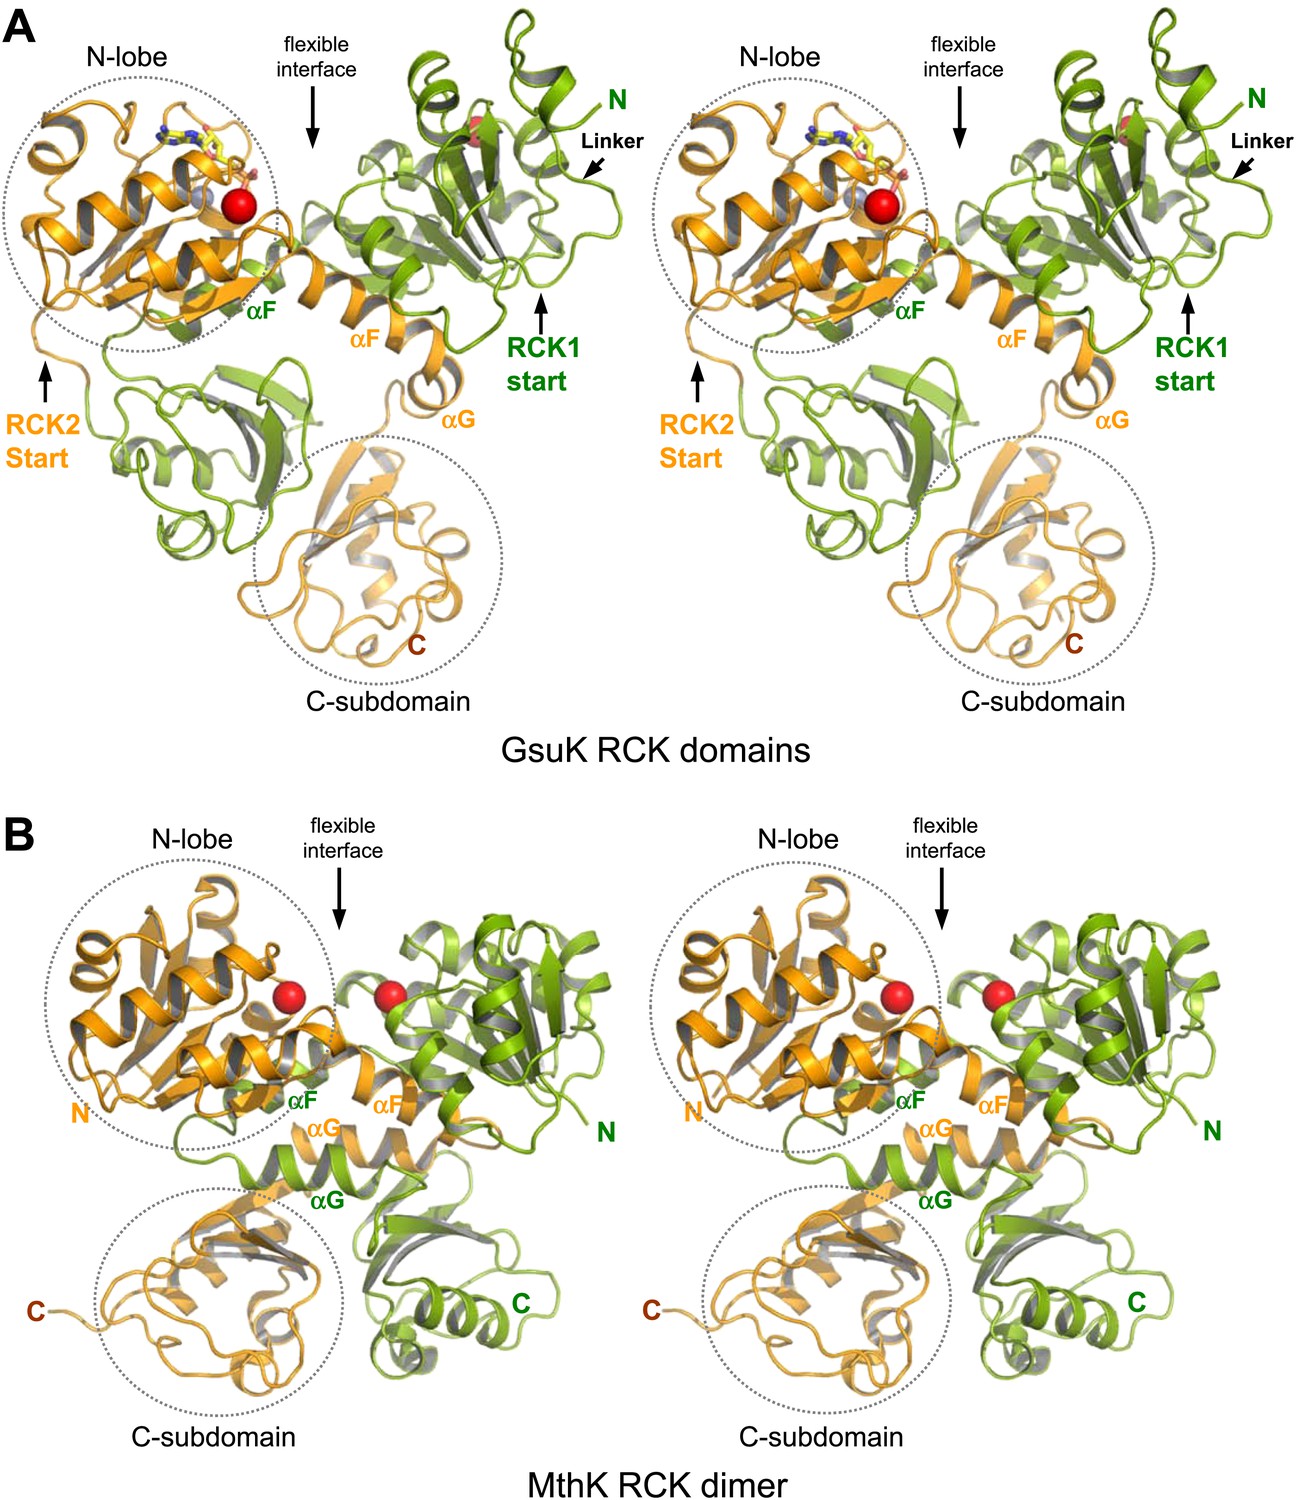
Structure of the GsuK intracellular subunit. (A) Stereoviews of GsuK intracellular subunit. RCK1 and RCK2 are colored green and orange, respectively. Ca2+ and Zn2+ ions are shown as red and silver spheres, respectively. The same color representations are used in all figures. (B) Stereoviews of MthK RCK dimer. The N-terminal lobes and the C-terminal subdomains are circled in RCK2 of GsuK and in one of the RCK subunits of MthK.
Figure 4
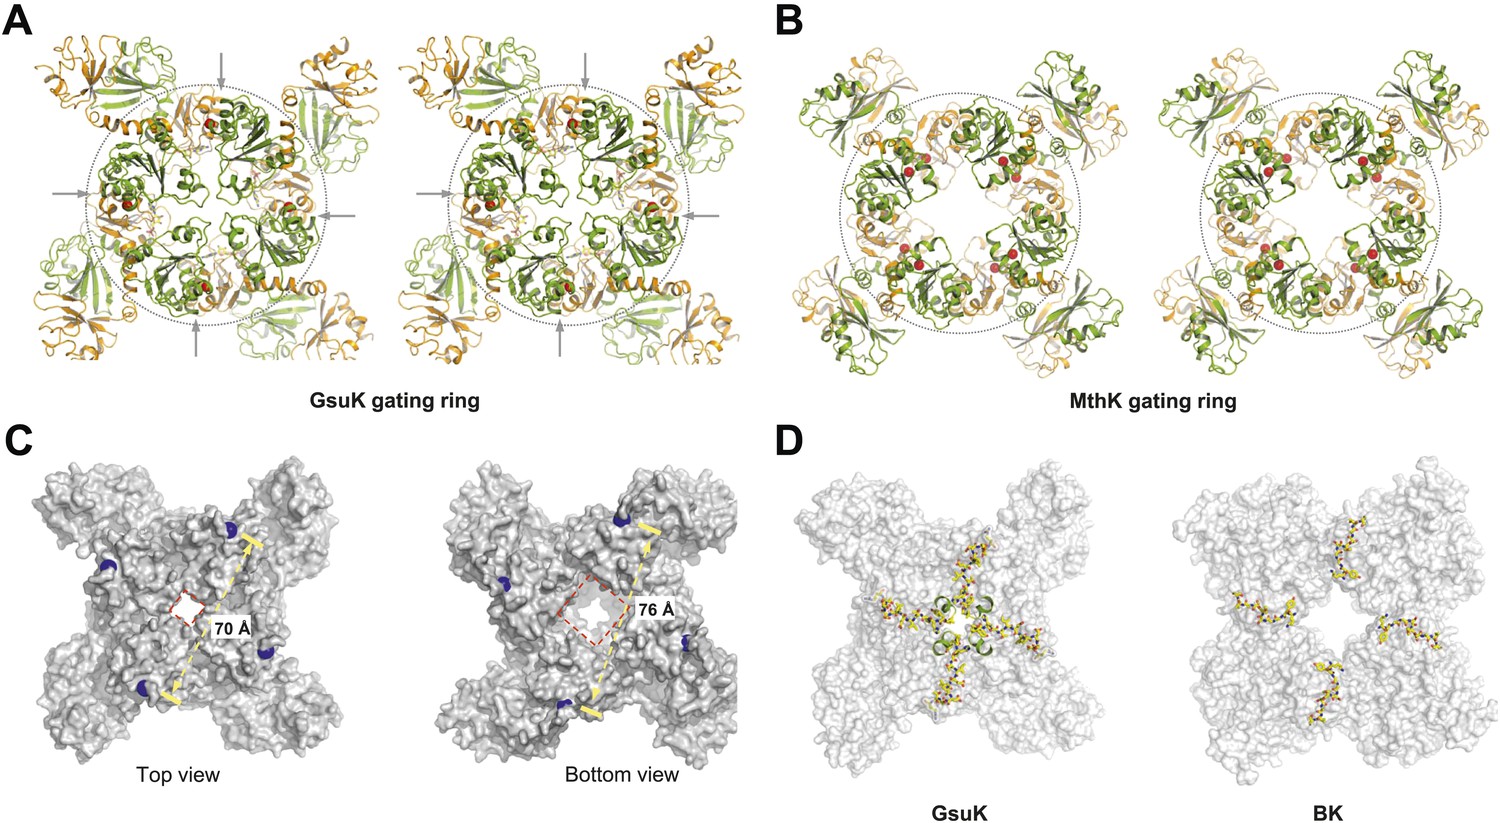
Structure of the GsuK gating ring. (A) Stereo representation of the GsuK gating ring viewed from the top. Arrows indicate the inter-subunit assembly interface. (B) Stereo view of the symmetrical MthK gating ring in the open state. (C) Dimension of the GsuK gating ring viewed from top (left) and bottom (right). The diagonal distance is measured between the Ca atoms of Gly131, which is the starting residue of the RCK1. Red square marks the size of the central hole. (D) The position of linkers between the gating ring and the ion conduction pore in GsuK (left) and BK channel (right). The linkers are in ball-and-stick representation and the gating rings are shown as surface rendered representation. The short N-terminal four-helix bundle on top of the GsuK gating ring is shown as green ribbons.
Figure 5
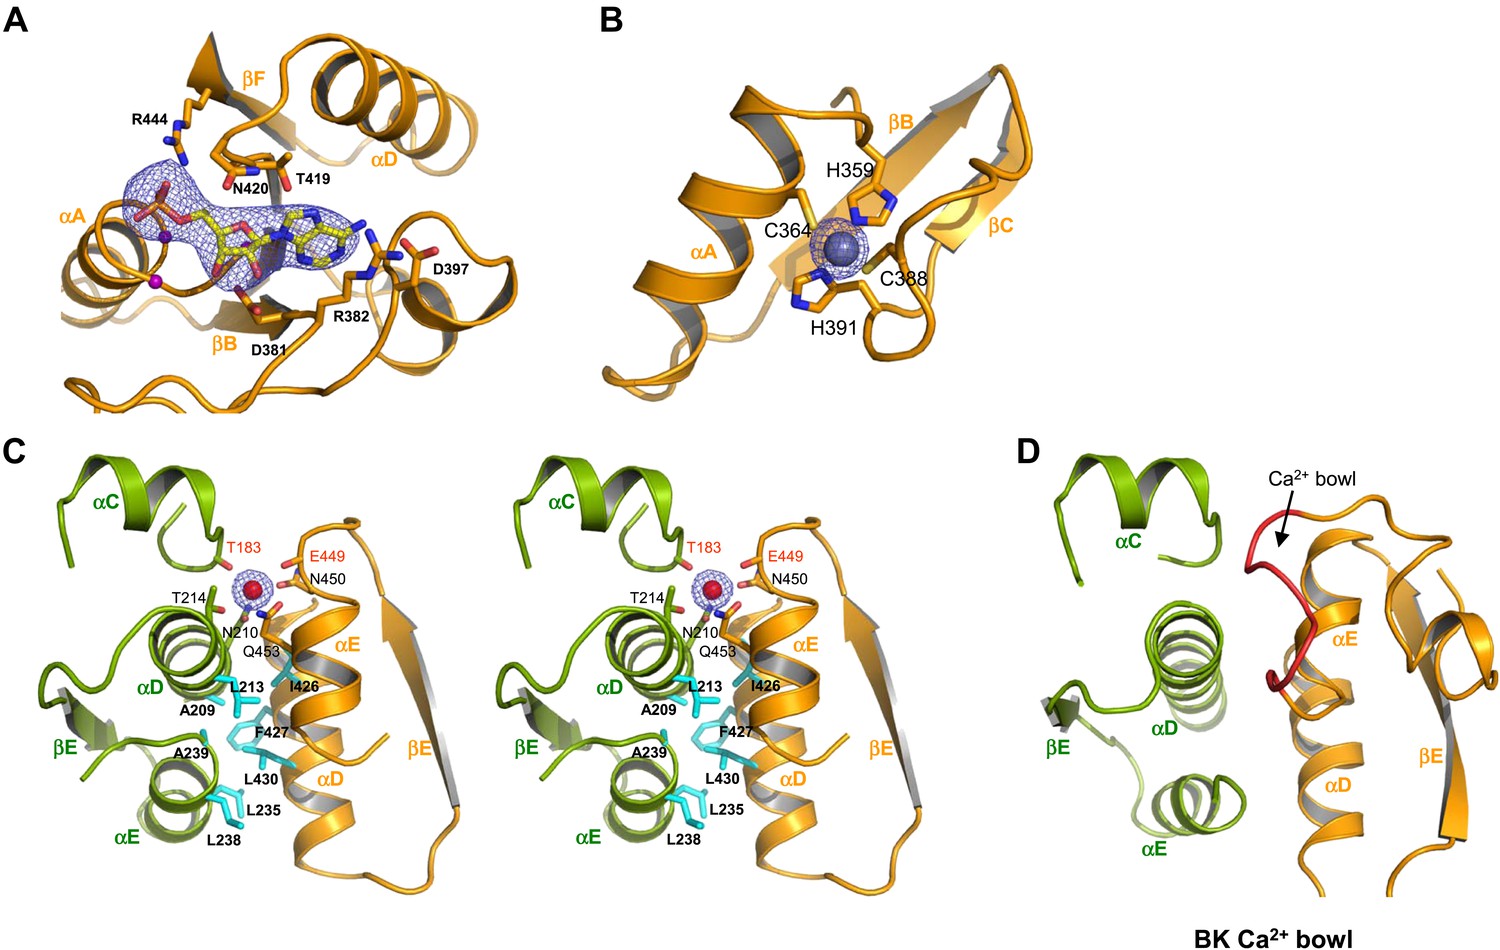
Ion and ligand binding in GsuK. (A) Structure of the nucleotide-binding site on RCK2. The electron density (blue mesh, contoured at 3σ) from Fo–Fc omit map is modeled as AMP. Purple spheres represent the Cα atoms of glycine residues from the conserved nucleotide binding motif. (B) Local structure of the Zn2+ (silver sphere) binding site on RCK2 with Fo–Fc ion omit map (blue mesh) contoured at 9σ. (C) Stereoview of the inter-subunit interactions at the assembly interface. Side chains of hydrophobic residues are shown as cyan sticks. Residues that chelate the Ca2+ ion with backbone carbonyl oxygen atoms are labeled in red. The electron density of Ca2+ (red sphere) from Fo–Fc ion omit map is contoured at 5.5σ. (D) The inter-subunit interface and Ca2+ bowl (red loop) of the BK channel.
Figure 6
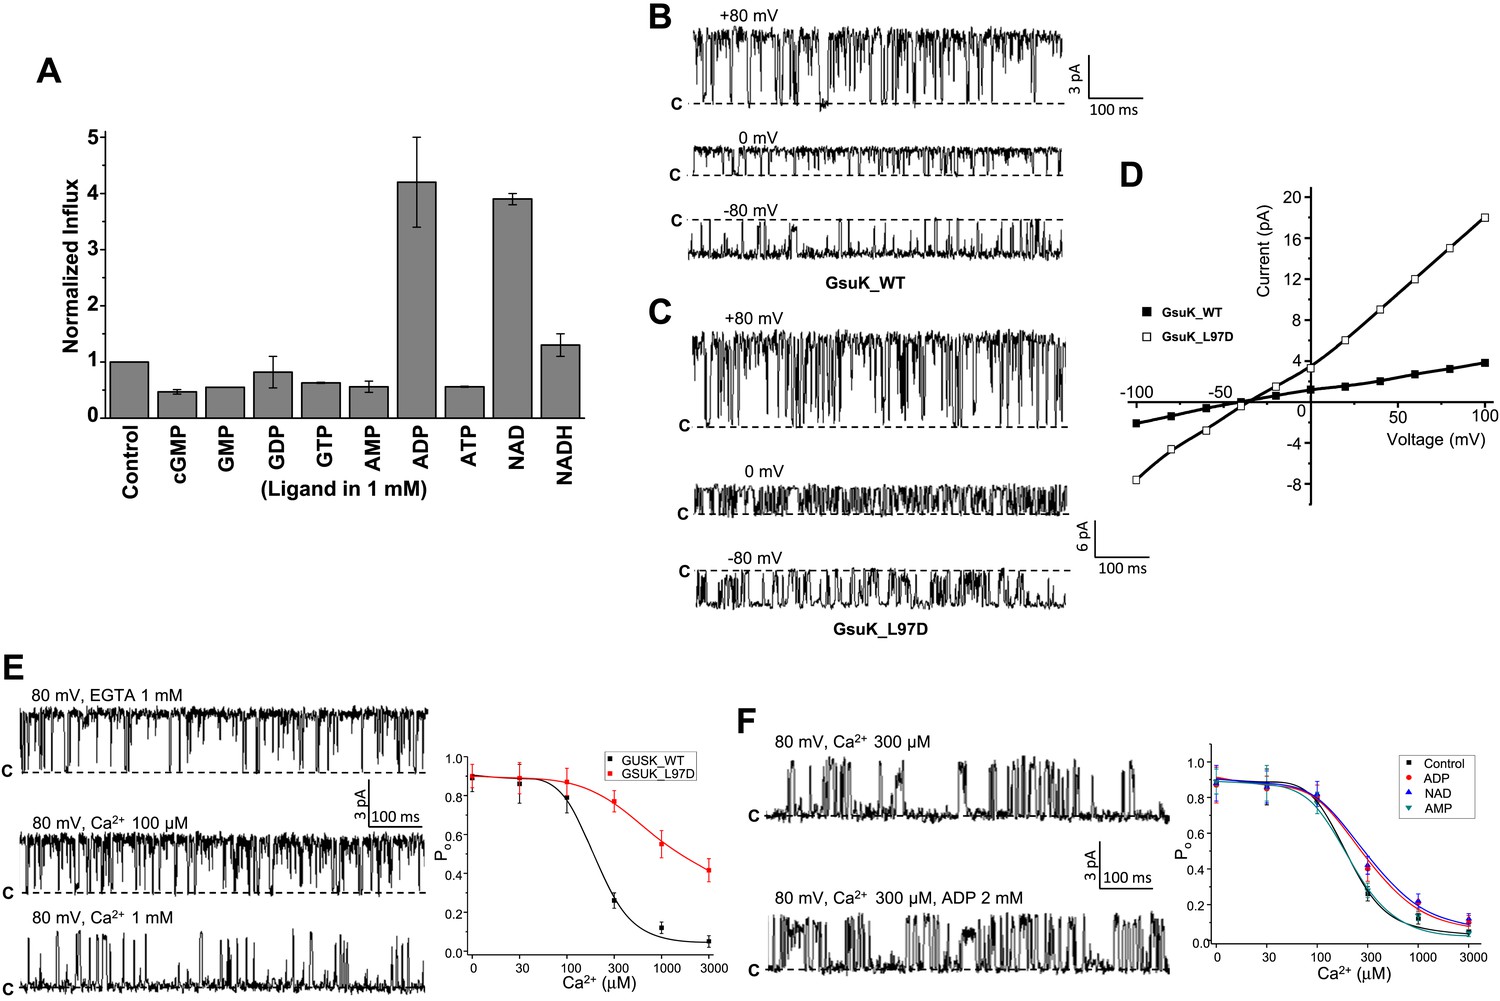
Functional analysis of the GsuK channel. (A) 86Rb+ flux assays of GsuK-containing liposomes in the presence of various nucleotides. Data are averages of two measurements and normalized against the control sample without nucleotide. (B)–(D) Single channel traces and I–V curves of the wild-type channel and L97D mutant. Currents were recorded using giant liposome patch clamping with 150 mM NaCl and 150 mM KCl in the pipette and bath solutions, respectively. (E) Sample traces of wild-type channel in the presence and absence of intracellular Ca2+ (left) and the plot of [Ca2+]-dependent single channel open probability of wild-type GsuK and L97D mutant (right). Both pipette and bath solutions contain symmetrical 150 mM KCl. Data for wild-type channel are fitted to the Hill equation with K1/2 of 197 uM and Hill coefficient n = 2.3. Data are mean ± SEM of seven measurements. (F) Sample traces of partially deactivated GsuK channel in the presence and absence of 2 mM ADP. Shown on the right is the plot of [Ca2+]-dependent single channel open probability of wild-type GsuK in the presence of 2 mM various adenine-containing nucleotide. Both pipette and bath solutions contain symmetrical 150 mM KCl. Data are fitted to the Hill equation with K1/2 = 210 μM and n = 2 for AMP, K1/2 = 350 μM and n = 1.4 for ADP, and K1/2 = 370 μM and n = 1.3 for NAD+. Data are mean ± SEM of five measurements.
Figure 7

Structure of the full-length GsuK channel. (A) Stereoview of full-length GsuK channel with L97D mutation. The transmembrane helices are shown as blue cylinders and the gating ring is in ribbon representation with RCK1 in green and RCK2 in orange. Subdomains from the front and back subunits are disordered and absent in the structure. (B) Comparison of the translational distances between the gating ring and the membrane-spanning pore in GsuK (left, L97D mutant) and MthK (right). (C) Comparison of the relative orientation between the gating ring (ribbon representation) and ion conduction pore (cylinder representation) in GsuK (left) and MthK (right). Only one subunit from each channel is colored. Both channels are superimposed using the pore region and viewed from the extracellular side. Arrows connect the central fourfold axis (square) to the starting residue (Cα atoms of Gly131 in GsuK and Arg114 in MthK) of the first RCK domains, indicating the approximate direction of the linker.
Figure 8
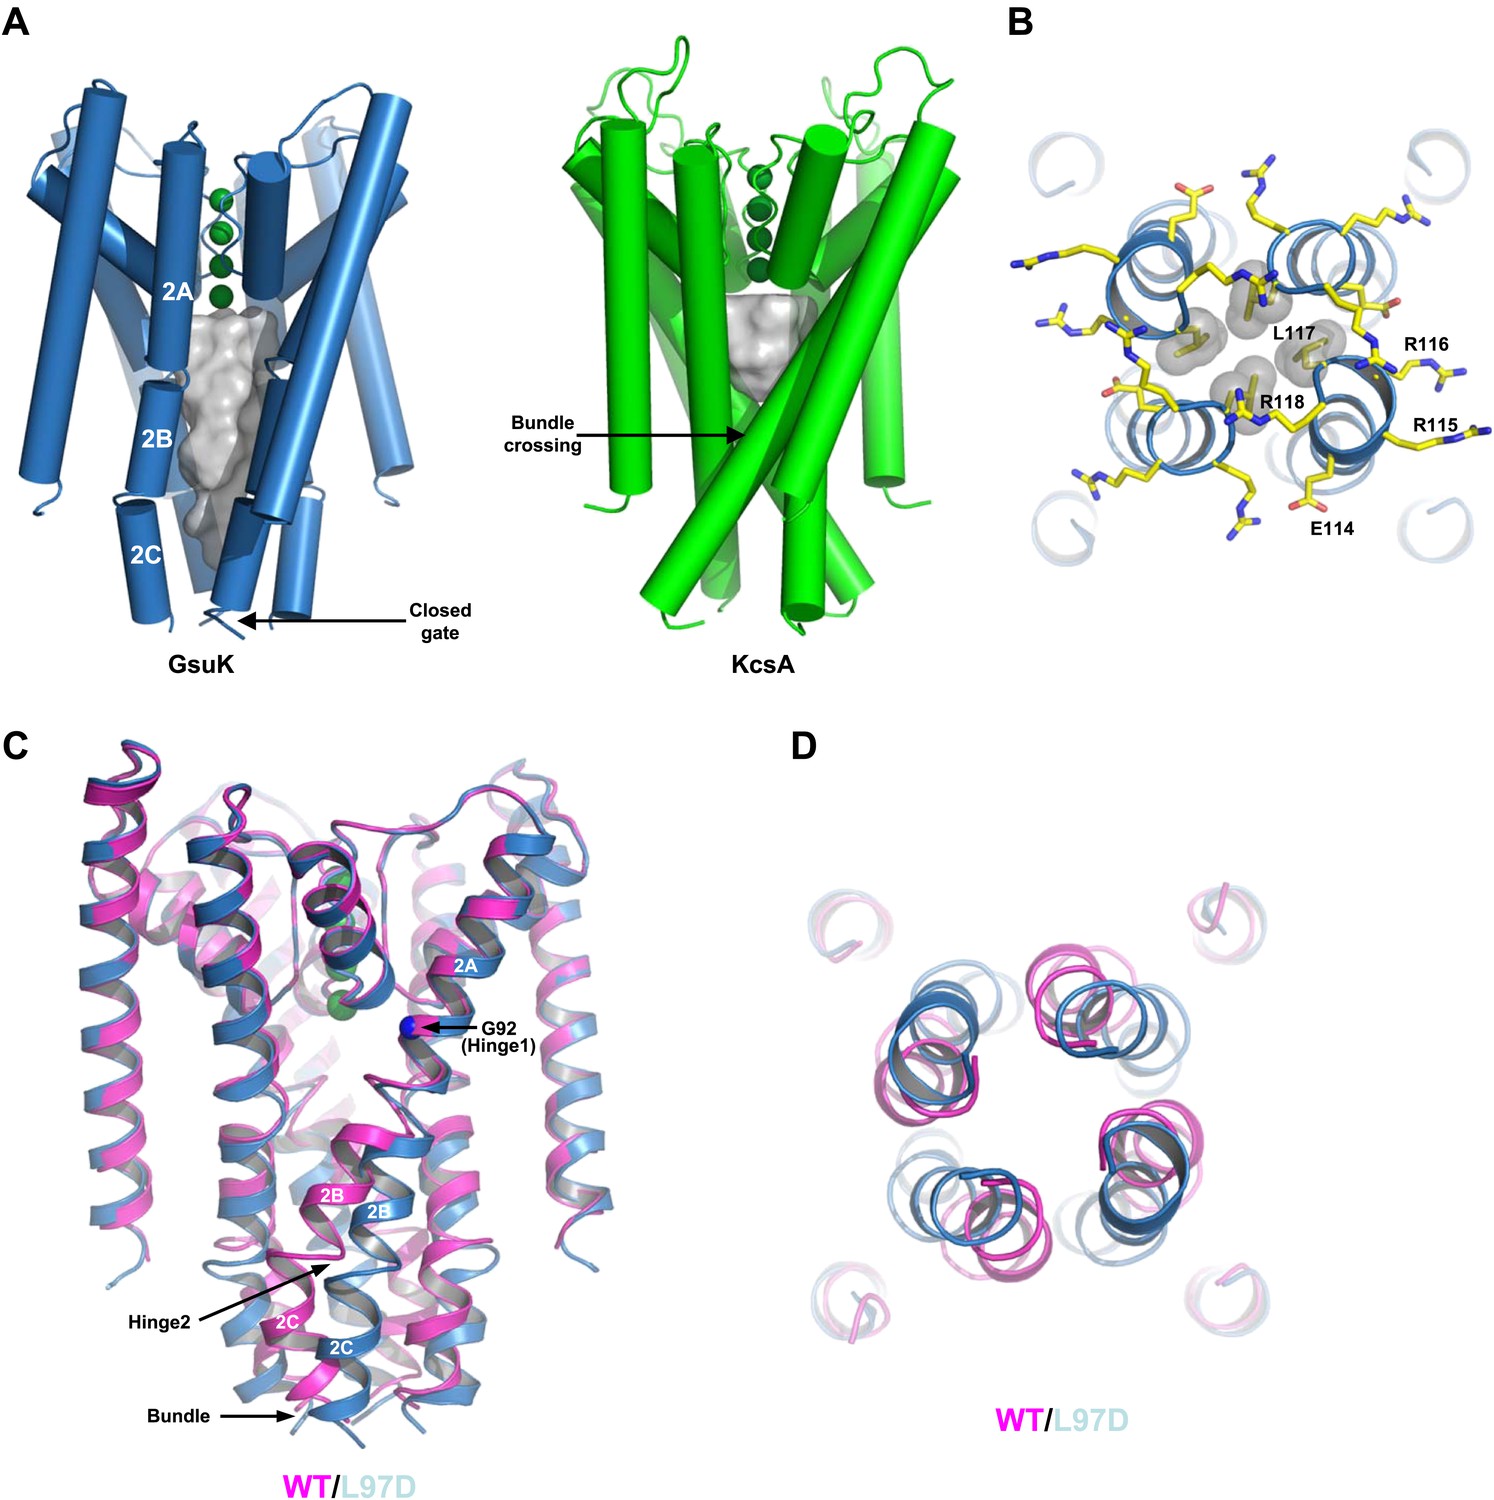
The ion conduction pore of GsuK. (A) Structural comparison between the GsuK pore and KcsA. K+ ions in the filter are shown as green spheres. Grey surface representation illustrates the space of the central cavity. GsuK inner helix (TM2) is segmented into three parts labeled as 2A, 2B and 2C, respectively. (B) Zoomed-in view of the GsuK intracellular gate with the surrounding charged residues drawn as sticks. Leu117 side chains are shown in CPK models. (C) Superimposition of the ion conduction pores from the wild-type (magenta) and the L97D mutant (blue) channels. (D) View of the superimposition from the intracellular side. The intracellular gate remains closed in the L97D mutant.
Figure 9
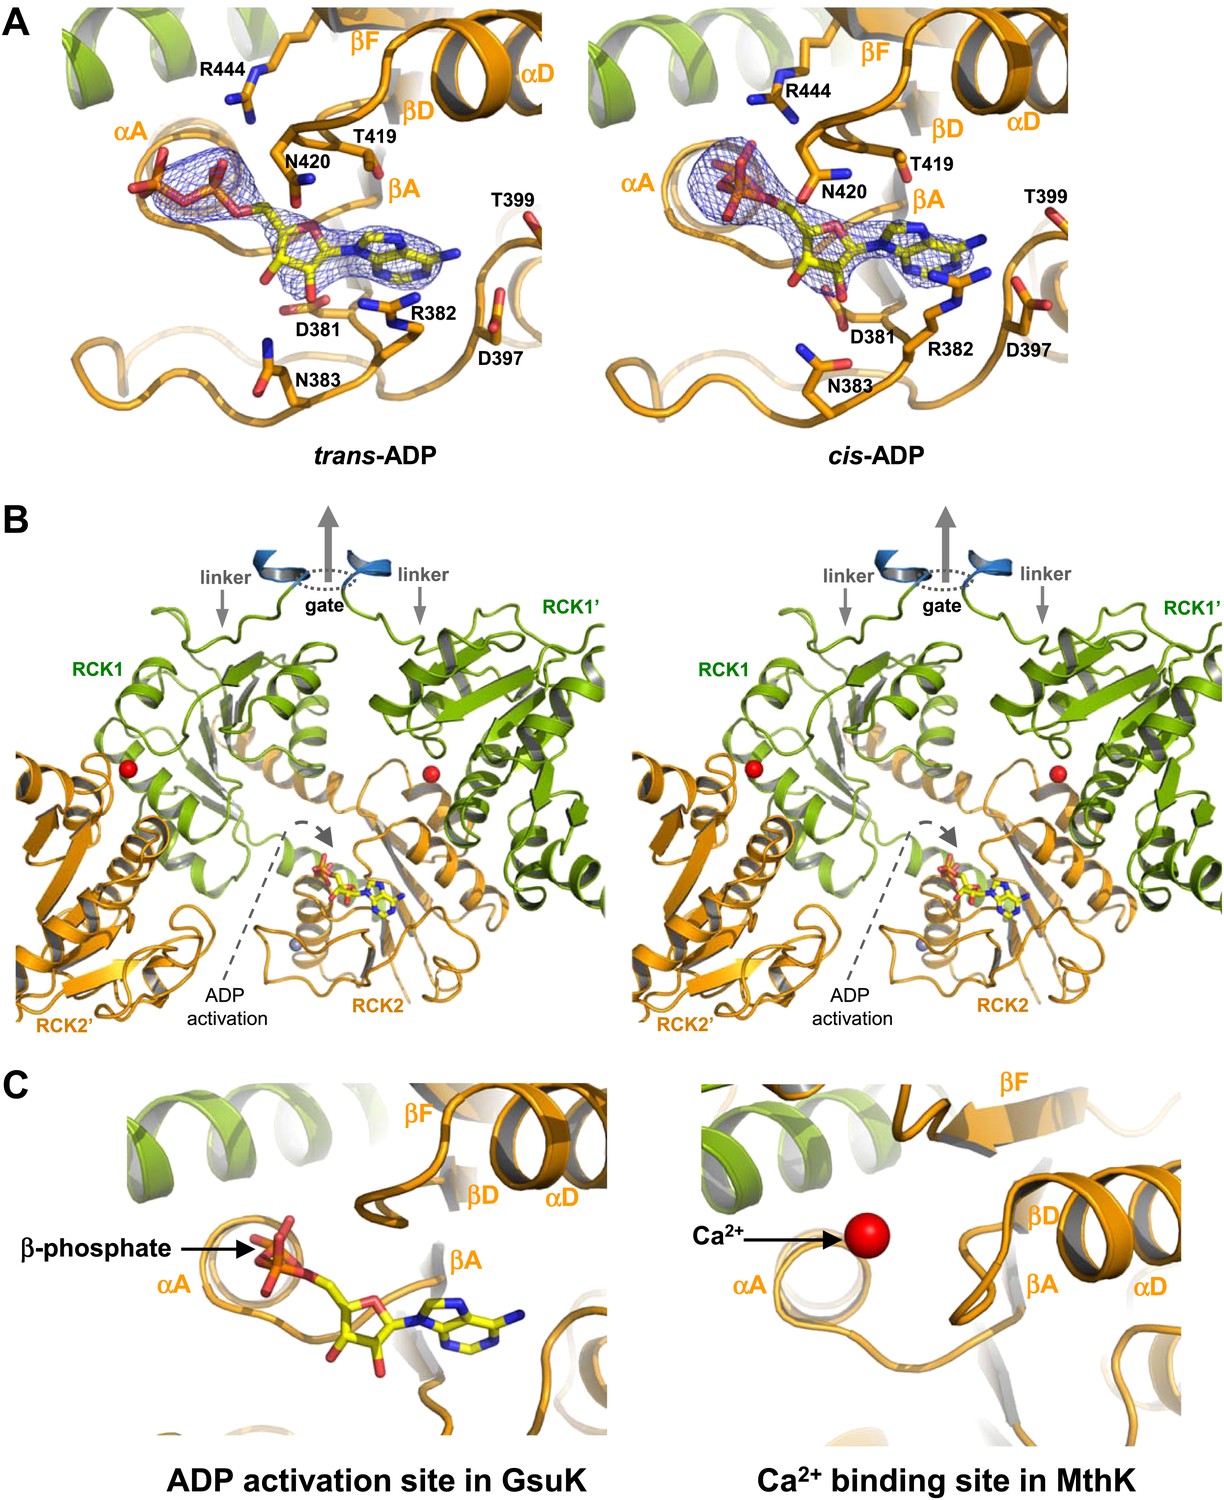
ADP binding in GsuK. (A) Bound ADP in trans (left, non-active) and cis (right, active) configurations. The electron density is from Fo–Fc omit map contoured at 3.0σ. (B) Stereoview of the cis-ADP activation site from inside the gating ring. RCK1′ and RCK2′ are from the neighboring subunits. Dotted oval indicates the location of the gate and the central arrow indicates the direction of the central axis of the pore. (C) Local structure comparison between the ADP activation site in GsuK and the Ca2+ activation site in MthK.
Figure 10
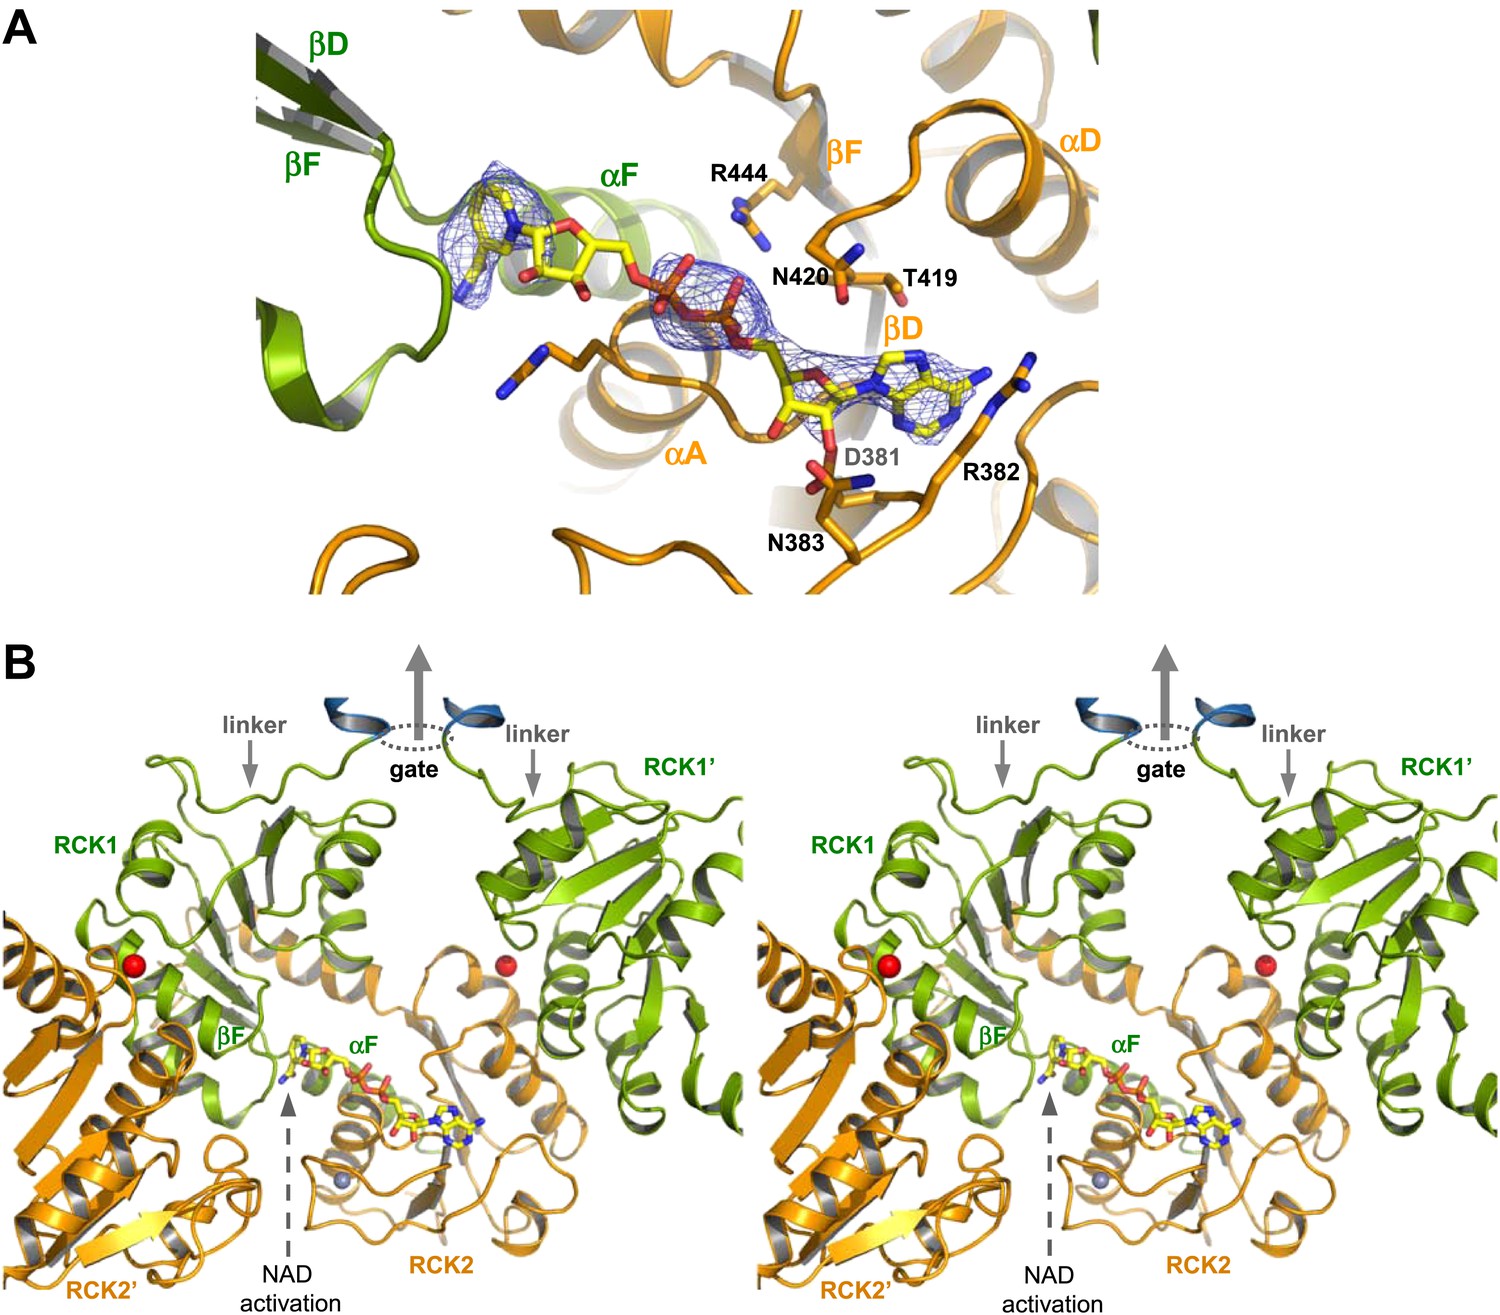
NAD+ binding in GsuK. (A) NAD+ binding in GsuK with Fo–Fc omit map contoured at 3.0σ. (B) Stereoview of the NAD+ activation site from inside the gating ring.
Figure 11
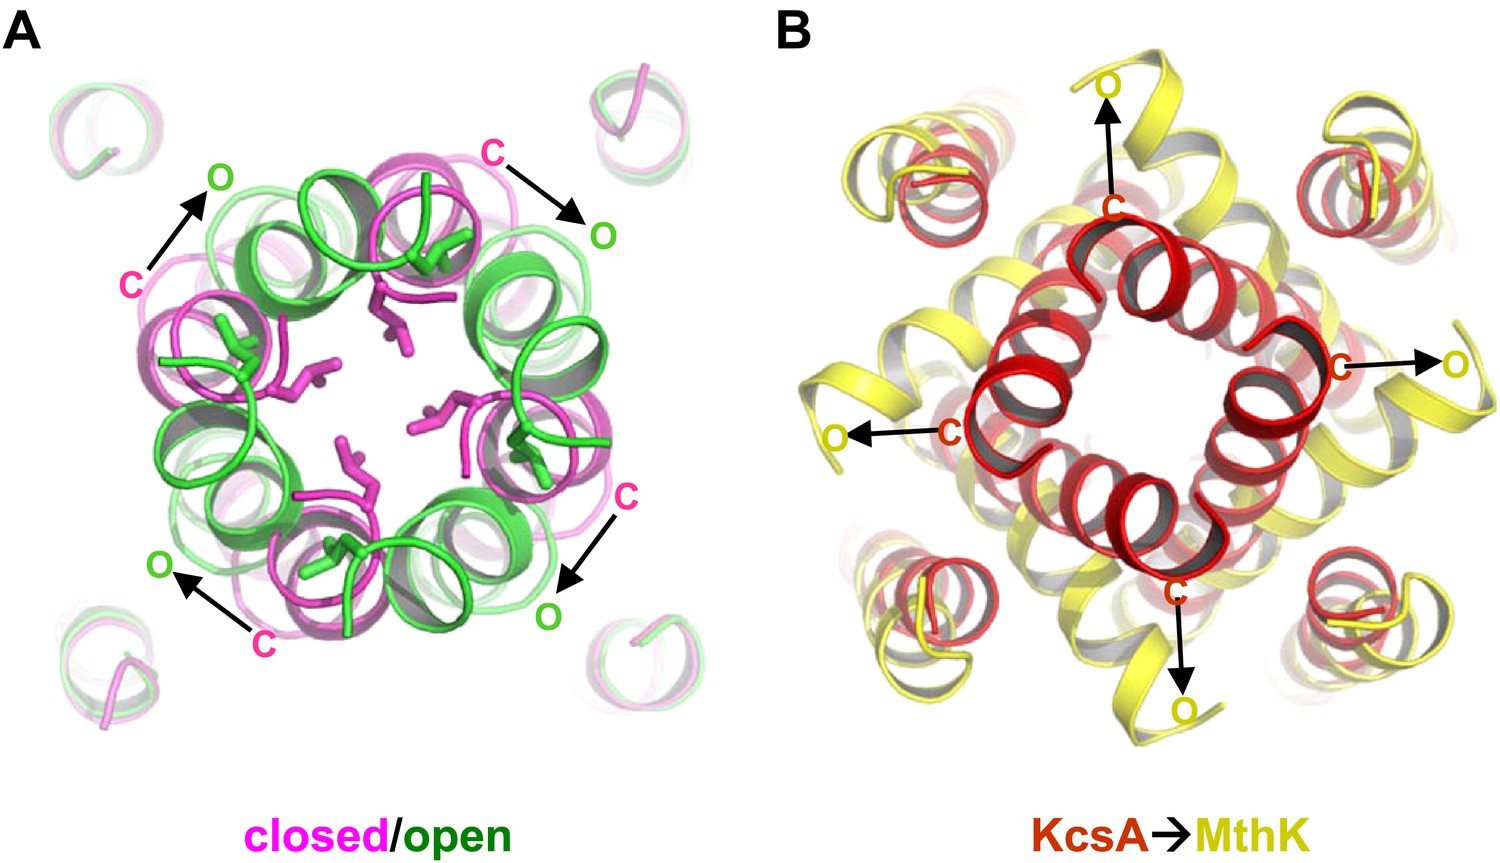
Proposed pore opening mechanics of GsuK. (A) Working model of the GsuK intracellular gate from closed (magenta) to open (green). Arrows indicate the direction of inner helix movement from closed to open state. Leu117 side chains are shown as sticks. (B) Pore opening mechanics of MthK. KcsA is used as the closed model for MthK.
Tables
Table 1
Data collection and refinement statistics
| Data Collection | Intracellular subunit | Wild type | L97D mutant | L97D mutant /ADP | L97D mutant /NAD |
| Space group | I222 | C2 | C2 | C2 | C2 |
| Cell dimensions: a, b, c (Å) | 110.6, 161.7, 310.1 | 235.0, 108.4, 165.8 | 232.9, 111.7, 164.1 | 234.3, 111.4, 164.7 | 232.5, 111.1, 164.6 |
| α, β, γ (°) | 90, 90, 90 | 90, 135.0, 90 | 90, 134.5, 90 | 90, 134.9, 90 | 90, 134.8, 90 |
| Wavelength (Å) | 0.9792 | 1.0332 | 0.9786 | 0.9792 | 0.9792 |
| Resolution (Å) | 50.0 − 3.0 | 50.0 − 3.7 | 50.0 − 2.6 | 50.0 − 2.8 | 50.0 − 3.2 |
| Measured reflections | 309,562 | 123,263 | 303,788 | 225,169 | 141,834 |
| Unique reflections | 55,435 | 27,539 | 87,305 | 72,260 | 47,223 |
| Redundancy* | 5.6 | 4.5 | 3.5 | 3.1 | 3.0 |
| Completeness (%, highest shell) | 99.2 (93.6) | 86.7 (47.4) | 94.7 (57.8) | 96.4 (88.9) | 95.6 (92.5) |
| Mean I/σI (highest shell) | 35.9 (1.8) | 19.0 (1.0) | 18.4 (1.0) | 15.6 (1.0) | 14.7 (1.0) |
| Rsym (%, highest shell)† | 6.0 (68.3) | 7.8 (82.9) | 6.4 (51.6) | 7.0 (86.7) | 7.1 (79.2) |
| Refinement | |||||
| Resolution (Å) | 50.0 − 3.0 | 50.0 − 3.7 | 30.0 − 2.6 | 50.0 − 2.8 | 50 − 3.2 |
| No. of reflections |F|>0 σF | 54,224 | 27,458 | 87,242 | 71,570 | 47,059 |
| R-factor/R-free (%)‡ | 22.8/26.2 | 26.1/29.3 | 20.3/24.9 | 21.3/25.5 | 23.0/27.0 |
| No. of protein atoms | 13,840 | 14,246 | 14,235 | 14,244 | 14,255 |
| No. of solvent atoms | 0 | 0 | 391 | 273 | 50 |
| No. of ions (K+/Ca2+/Zn2+) | 0/4/4 | 12/4/4 | 12/4/4 | 11/4/4 | 12/4/4 |
| No. of ligands | 4 AMP | 0 | 0 | 4 ADP | 4 NAD |
| Rmsd bond lengths (Å)§ | 0.009 | 0.006 | 0.004 | 0.005 | 0.003 |
| Rmsd bond angles (°) | 1.243 | 1.053 | 0.666 | 0.902 | 0.723 |
-
*
Redundancy = total measurements/unique reflections.
-
†
Rsym = Σ|Ii − <Ii>|/ΣIi, where <Ii> is the average intensity of symmetry equivalent reflections.
-
‡
R factor = Σ|F(obs) − F(cal)|/ΣF(obs), 5% of the data were used in the Rfree calculations.
-
§
Rmsd = root-mean-square deviation.
-
Numbers in parentheses are statistics for highest resolution shell.
Download links
A two-part list of links to download the article, or parts of the article, in various formats.
Downloads (link to download the article as PDF)
Open citations (links to open the citations from this article in various online reference manager services)
Cite this article (links to download the citations from this article in formats compatible with various reference manager tools)
Distinct gating mechanisms revealed by the structures of a multi-ligand gated K+ channel
eLife 1:e00184.
https://doi.org/10.7554/eLife.00184


