De novo modeling of the F420-reducing [NiFe]-hydrogenase from a methanogenic archaeon by cryo-electron microscopy
- Max Planck Institute of Biophysics, Germany
- Max Planck Institute for Terrestrial Microbiology, Germany
- Japan Science and Technology Agency, Japan
Figures
Figure 1
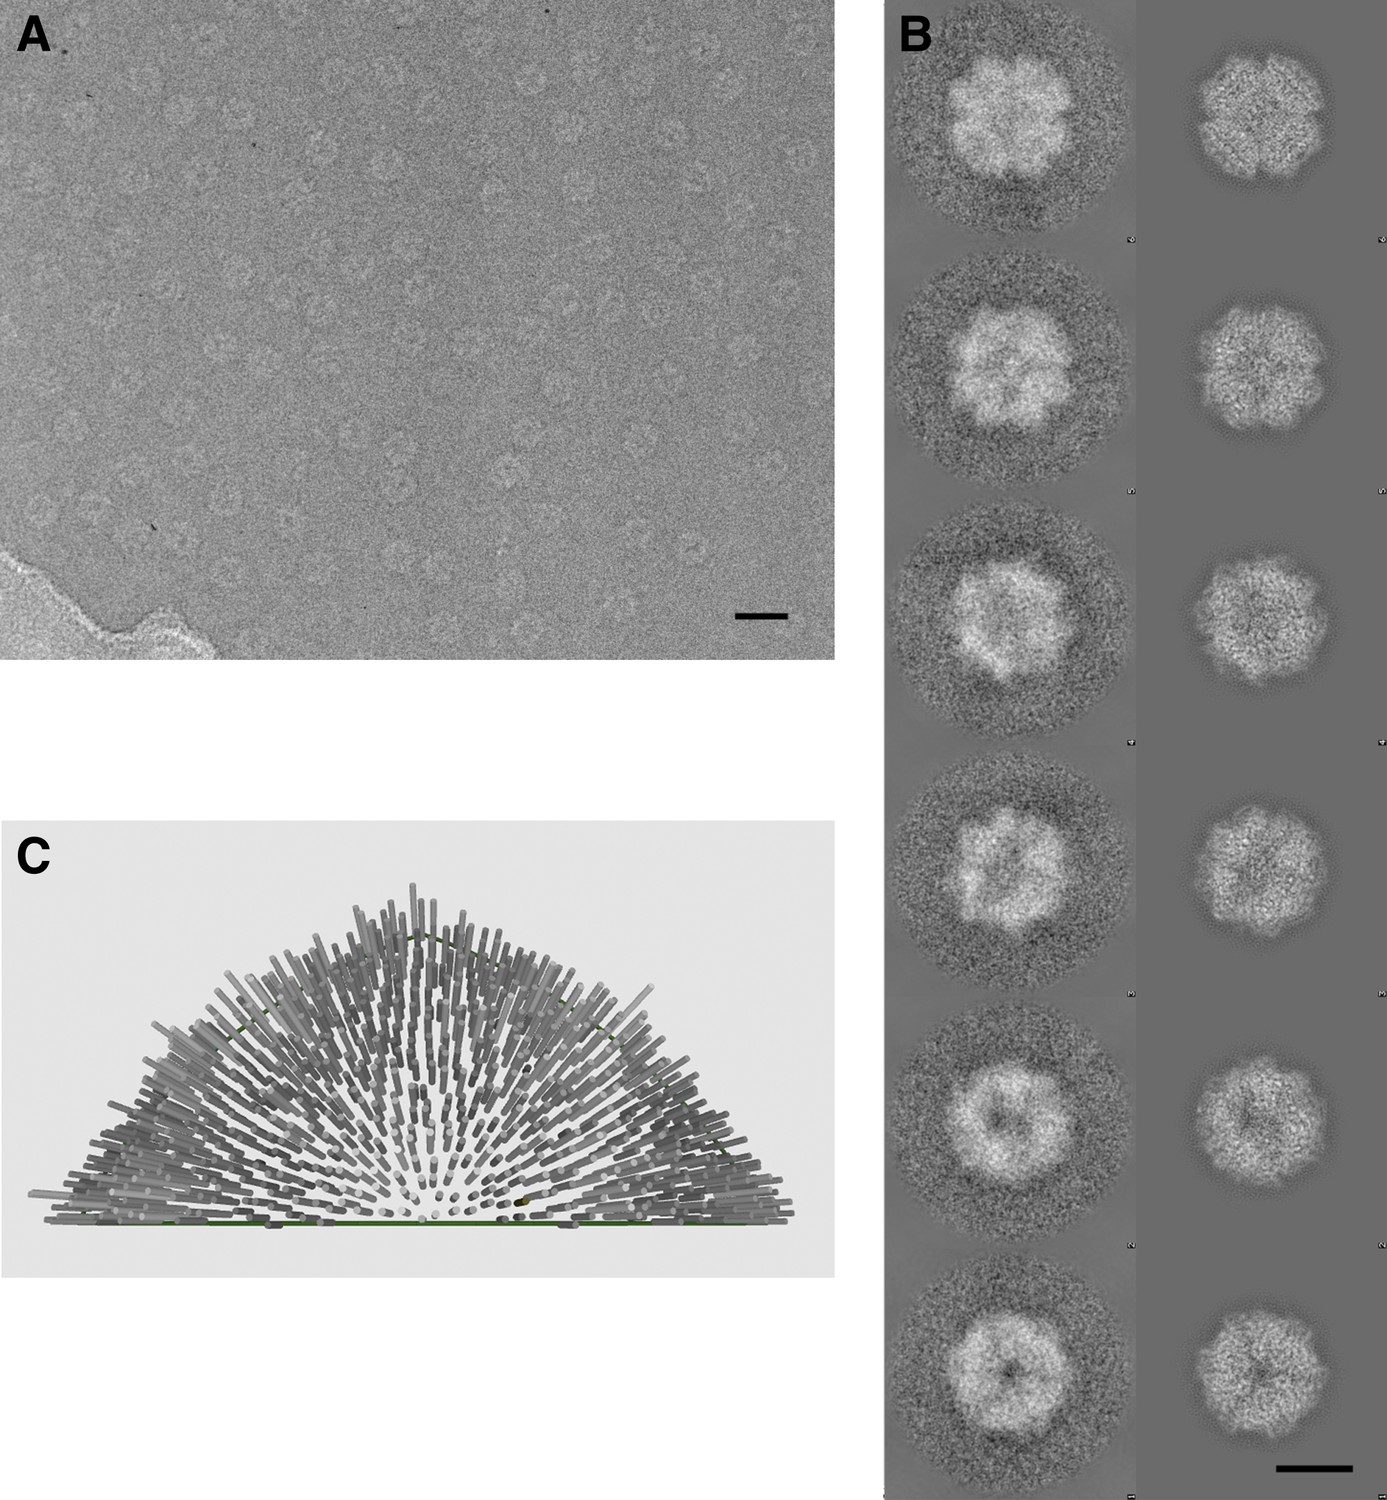
Cryo-electron microscopy and image processing.
(A) A representative area of an electron micrograph taken at 200 kV on an FEI Polara. The defocus was determined as 2.05 µm. The scale bar represents 25 nm. (B) Representative class averages and corresponding reprojections of the model for the final refinement iteration. The first and last images represent a view down the twofold and threefold axis of the tetrahedron, respectively. The scale bar represents 10 nm. (C) Euler angle distribution for the final reconstruction. Each cylinder represents one class average in the asymmetric triangle (1/12 of the tetrahedron); the height of the cylinder is proportional to the number of particles in the class. The equal distribution shows that there are no preferred orientations for the Frh complex.
Figure 2
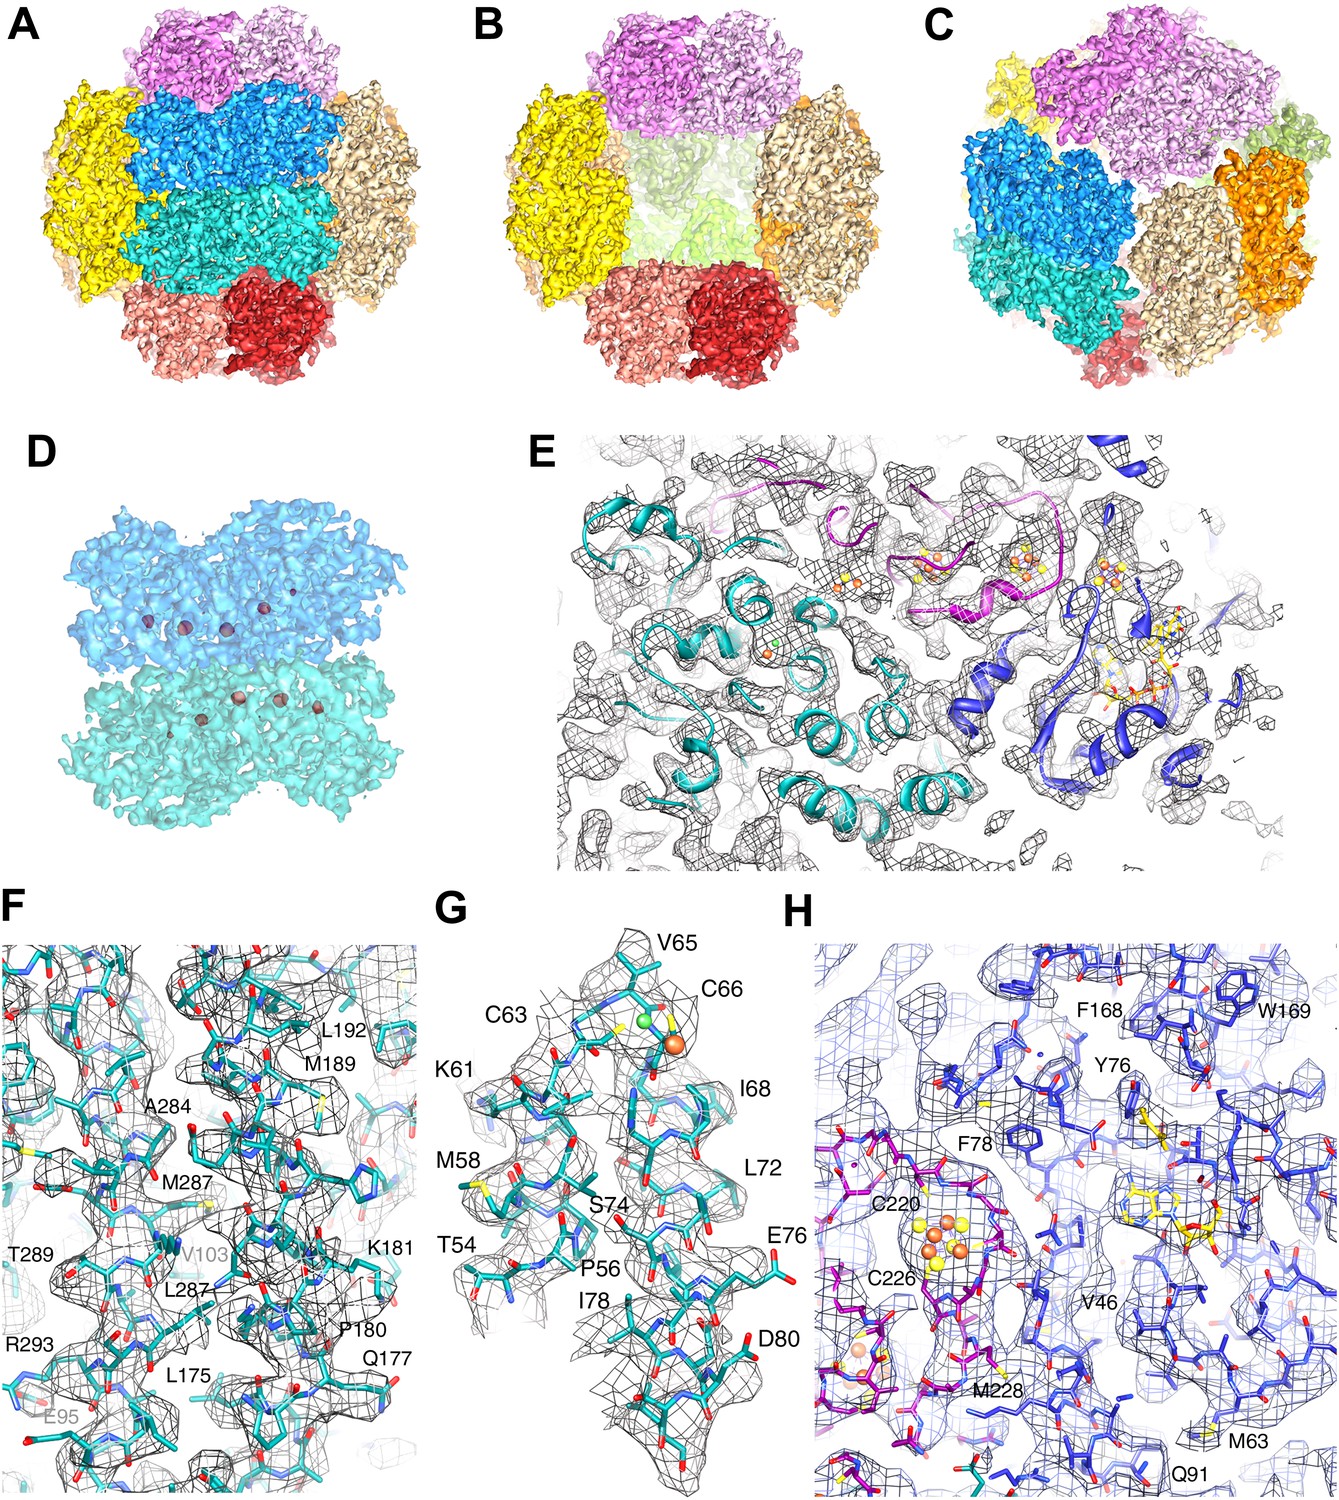
High-resolution cryo-EM map of Frh.
(A) view down the twofold axis. Each of the 12 FrhABG heterotrimers is shown in a different color. (B) The same view as (A) with the two trimers at the front removed, (C) view down the threefold axis. (D) Close-up of the front dimer in (A) shown as a transparent surface with the high densities of the metal centers in red. (E) A 10-Å thick slice of the map with a ribbon model for one FrhABG subunit (the green one in A and D) superimposed. In this and other figures, FrhA is green, FrhG purple, and FrhB slate-blue. At this level, a complete chain of cofactors can be seen: the [NiFe] cluster in FrhA (green and brown spheres), three FeS clusters in FrhG and one in FrhB (brown and yellow spheres), and the FAD in FrhB (yellow sticks). Details of the map with a full-atom model superimposed: (F) Part of the α-helix bundle in FrhA, (G) Helix hairpin in FrhA coordinating the [NiFe] center (green and brown balls), (H) Part of FrhG and FrhB showing an FeS cluster and FAD. In (E–H), the map was filtered at 4.5-Å resolution and sharpened using a B-factor of -54 Å2.
Figure 3
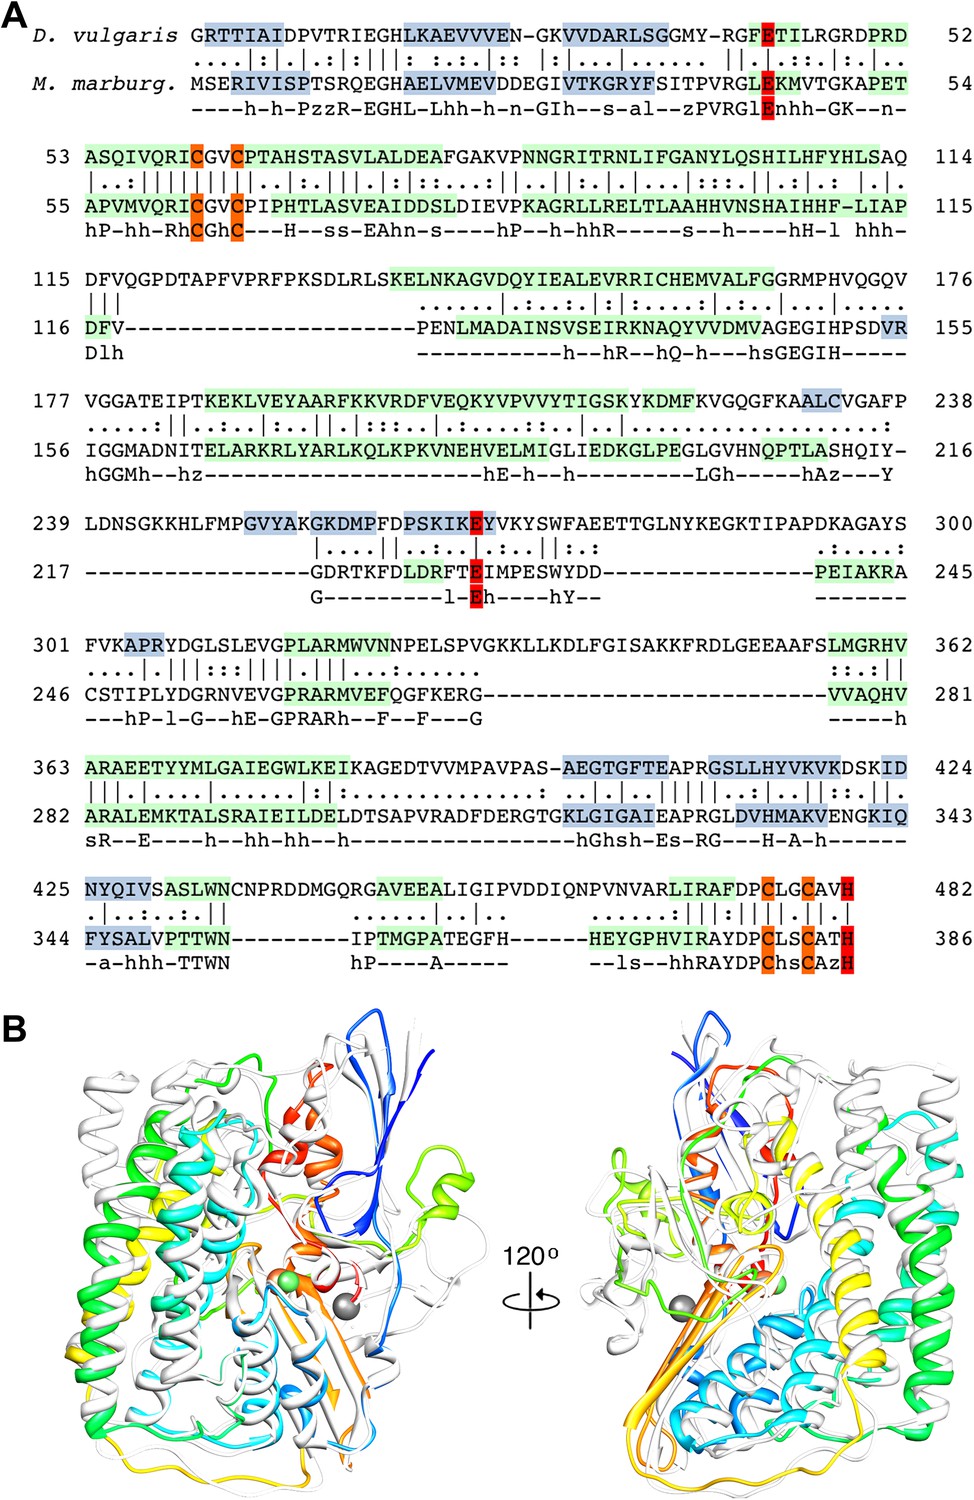
Sequence and secondary structure of FrhA and a comparison with homologous proteins.
(A) Alignment of the [NiFe]-hydrogenase large subunit from Desulfovibrio vulgaris Hildenborough (first line) with Methanothermobacter marburgensis FrhA (third line). The second line shows the identical (|) and similar (:) amino acids. The alignment was done with EMBOSS needle (http://www.ebi.ac.uk/Tools/psa/emboss_needle/) and manually adjusted after fitting the FrhA structure. The fourth line shows the consensus sequence of 19 archaeal FrhA species. Identical amino acids in capitals, similar ones in lower case (h: hydrophobic; s: small (GAS); l: large (LIFYHW); a: aromatic (FYWH); z: T or S; n: negative, D or E; p: positive, R or K). The α-helices are highlighted in green, β-strands in blue. The [NiFe] ligands are in orange in the ligands of the third ion in red. (B) Comparison of the FrhA model (rainbow coloring from blue to red) and the group 1 [NiFe]-hydrogenase large subunit from Desulfovibrio vulgaris Hildenborough (gray) (pdb 2wpn) (Marques et al., 2010) in two different orientations (left and right). The [NiFe] center and another ion (spheres) overlap as do the structural elements around them, as well as two 3-stranded β-sheets and the lower part of the four-helix bundle. Differences are confined to the periphery.
Figure 4
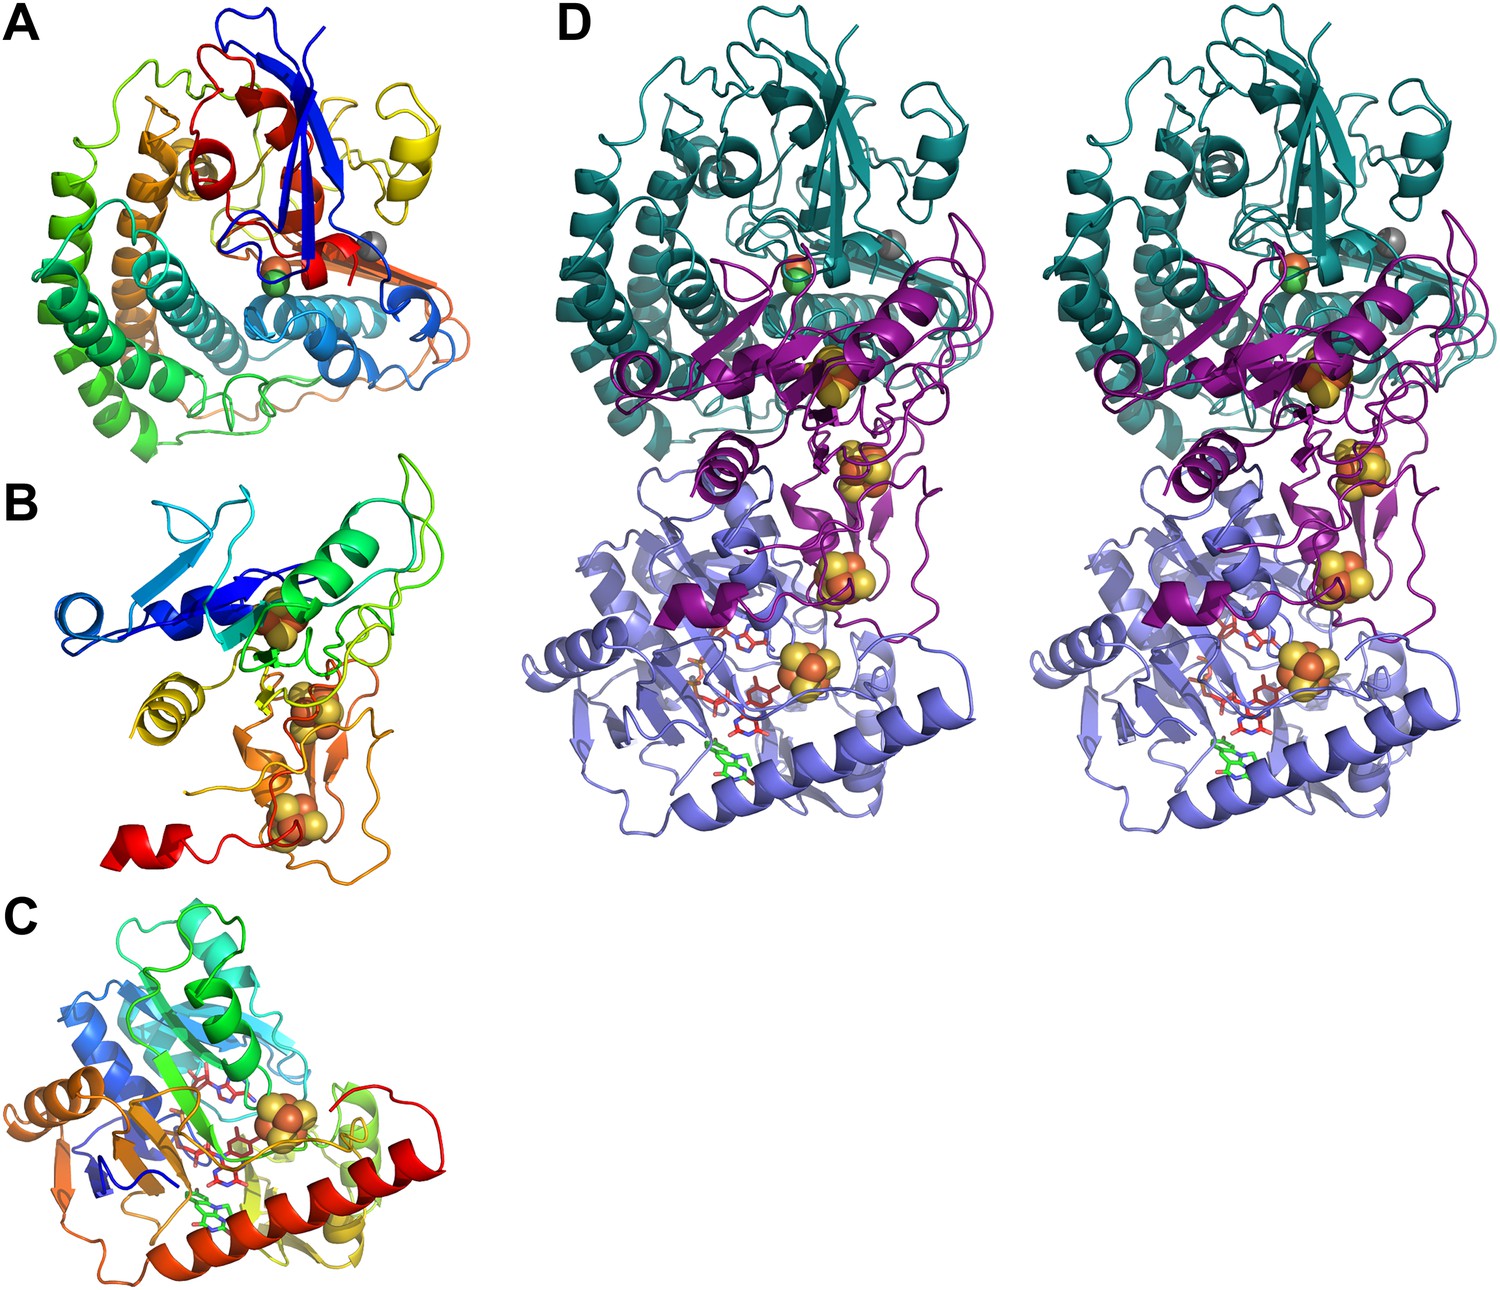
Models of Frh subunits.
(A) FrhA, (B) FrhG, and (C) FrhB in rainbow colors from blue (N-terminus) to red (C-terminus). (D) Stereo pair of the FrhABG heterotrimer with the string of four bound Fe-S clusters (orange/yellow), the [NiFe] binuclear center (green/orange) at the top, and the FAD (red) and F420 cofactors (green) below. FrhA is green, FrhG is purple, and FrhB is slate-blue.
Figure 5
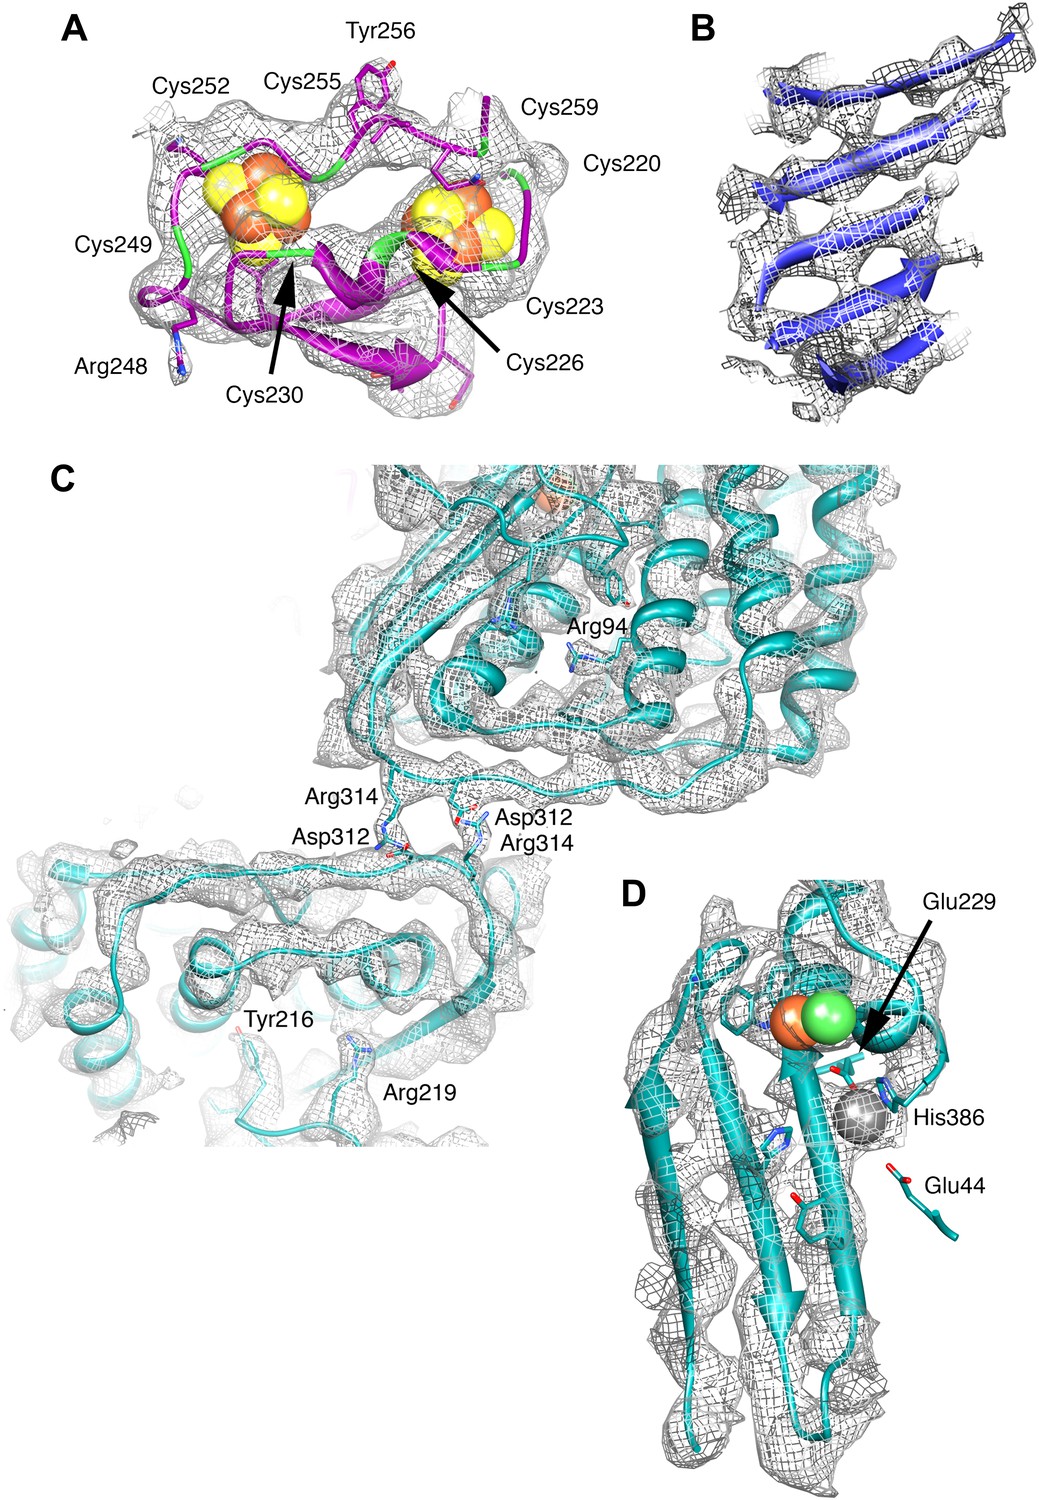
Details of the model and map.
(A) The ferredoxin domain of FrhG. The eight cysteine residues surrounding the two [Fe4S4] clusters are shown in green. (B) β-Sheet in FrhB. The strands are clearly separated. (C) The dimer interface of FrhA inside the particle with two salt bridges Asp312-Arg314. The two FrhA molecules are viewed from inside the complex. (D) The C-terminal three-stranded β-sheet in FrhA with the [NiFe] center (green and brown) and another ion (gray) near the C-terminal His386. The conserved residues Glu44, Glu229, and His386 coordinate the ion.
Figure 6

Sequence and secondary structure of FrhG and a comparison with homologous proteins.
(A) Alignment of the [NiFe]-hydrogenase small subunit from Desulfovibrio vulgaris Hildenborough (first line) with Methanothermobacter marburgensis FrhG (third line) and ferredoxin from Peptostreptococcus asaccharolyticus (pdb 1dur) (last line). The second and fourth lines show the identical (|) and similar (:) amino acids. The alignment was done with ClustalW. The α-helices are highlighted in green, β-strands in blue. Ligands of the proximal [4Fe4S] cluster are in yellow, of the medial cluster in orange, and of the distal cluster in red. Amino acids not seen in the Frh structure are in gray font. The first 38 amino acids of the FrhG sequence deduced from the M. marburgensis genome are probably not part of the protein (see main text) and are shown in light gray font. (B) Consensus sequence of archaeal FrhG species. Capitals: conserved residues; lower case: similar residues (h: hydrophobic; s: small (GAS); l: large (LIFYHW); a: aromatic (FYWH); z: T or S; n: D or E; p: R or K). (C) Comparison of the FrhG model (rainbow coloring from blue to red) and the [NiFe]-hydrogenase small subunit from Desulfovibrio vulgaris Hildenborough (pdb 2wpn) (gray) in two different orientations (left and right). The structure near the proximal [4Fe4S] cluster (blue-green) is conserved, but the periphery diverges. The ferredoxin domain (yellow to red) containing the medial and the distal iron-sulfur clusters is not homologous and the clusters do not overlap.
Figure 7
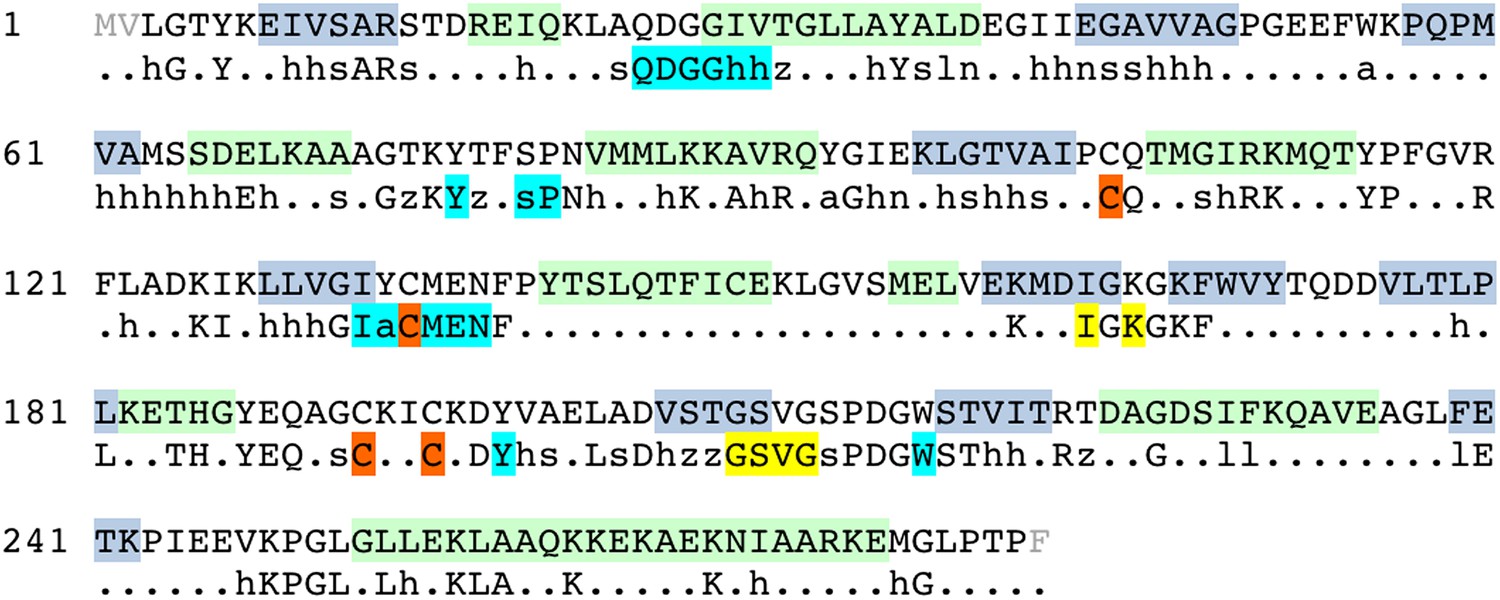
Sequence and secondary structure of FrhB.
Light gray font: No density; green highlight: α-helix; gray highlight: β-strand. Second line: Consensus sequence of FrhB species. Capitals: conserved residues; lower case: similar residues (h: hydrophobic; s: small [GAS]; l: large [LIFYHW]; a: aromatic [FYWH]; z: T or S; n: negative [D or E]; p: positive [R or K]). In the consensus sequence, the residues for coordination of the iron–sulfur cluster, FAD, and F420 are highlighted in orange, cyan, and yellow, respectively.
Figure 8
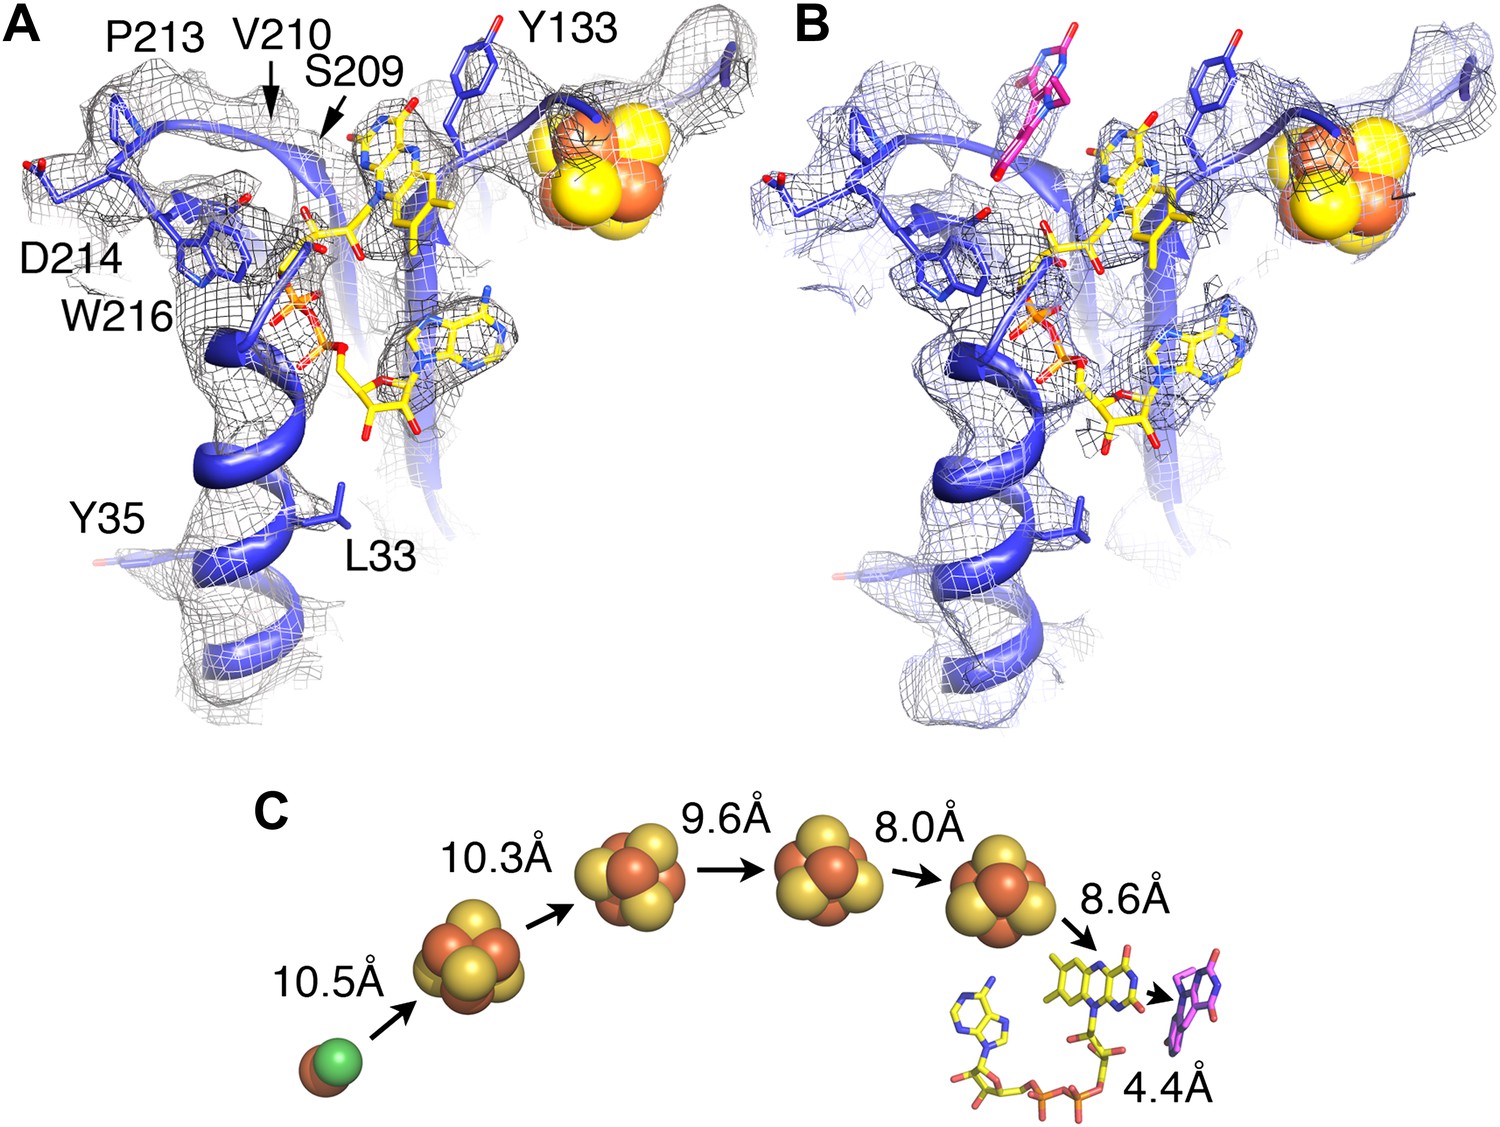
Electron-transfer chain and F420.
Maps in the absence (A) and presence (B) of the substrate F420 differ in a region near a conserved loop between two β-strands near the FAD (carbons in yellow). The isoalloxazine ring of F420 fitted into this density is shown in pink. (C) Electron transfer chain with minimal distances indicated.
Figure 9
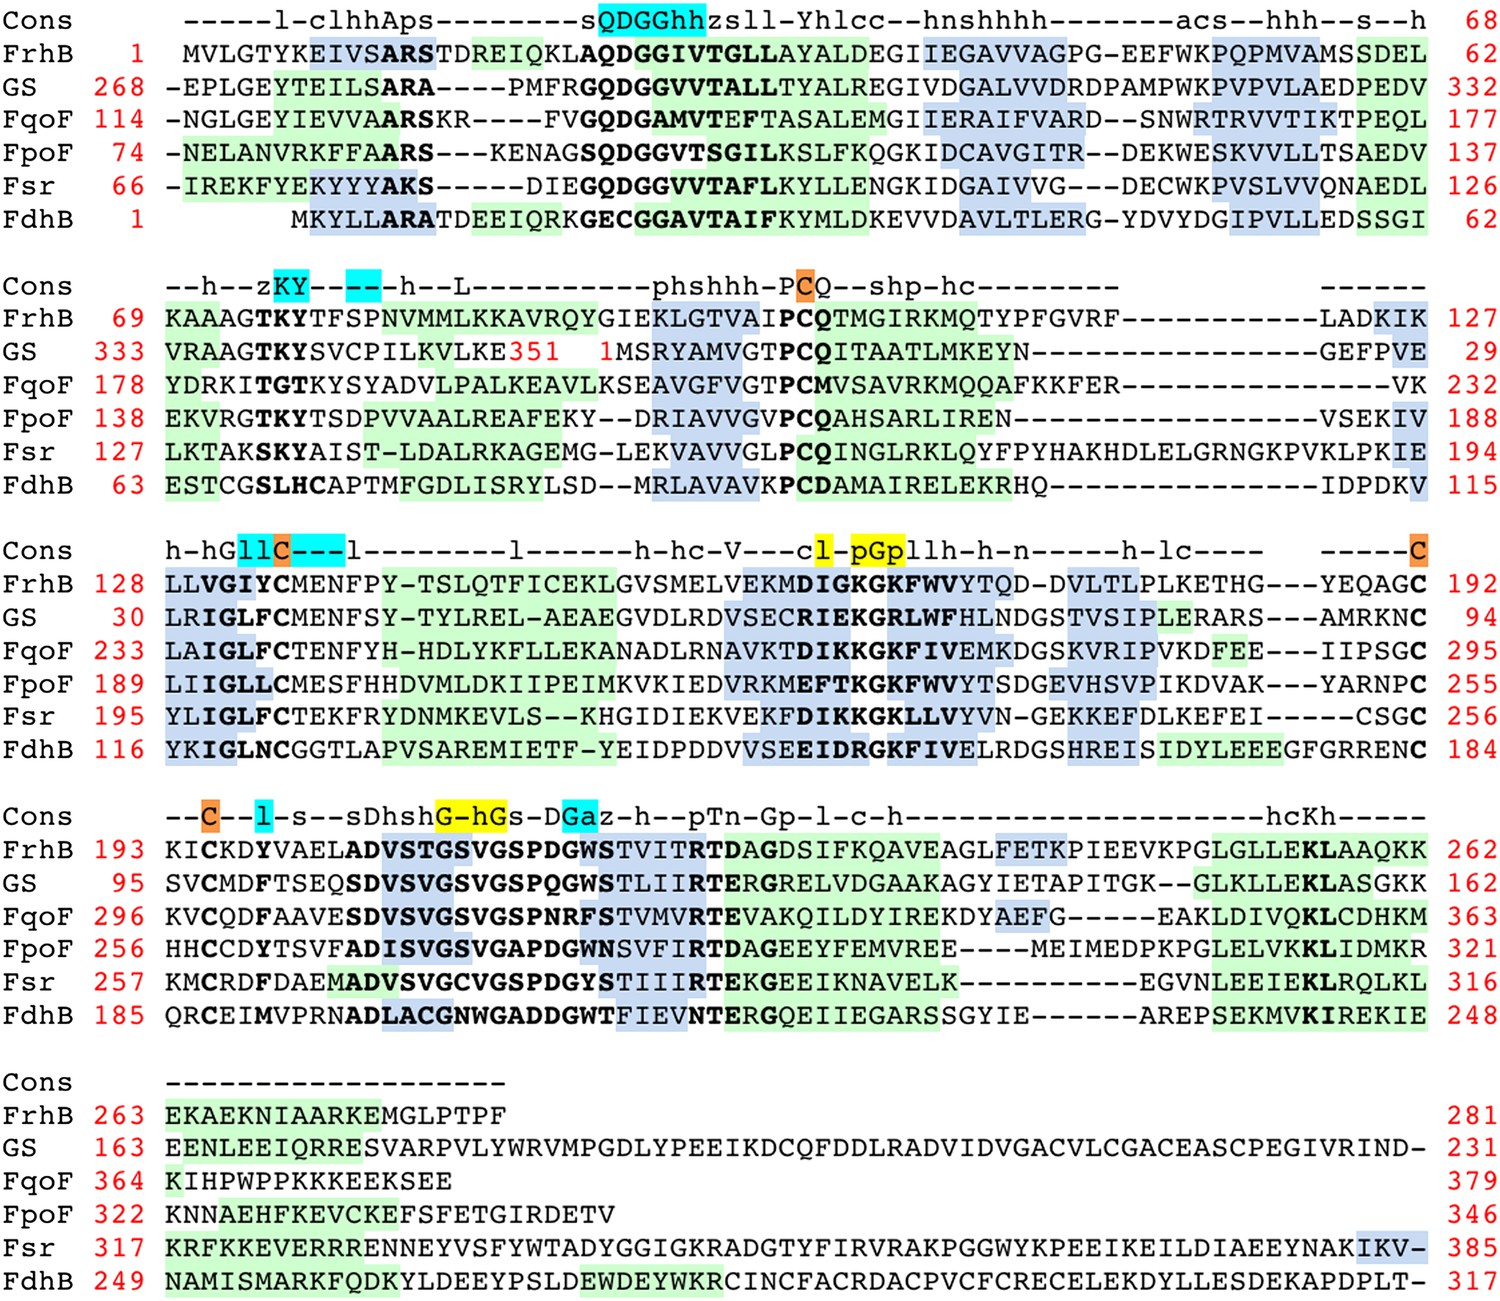
Alignment of the FrhB family of F420-binding proteins.
FrhB: FrhB of Methanothermobacter marburgensis DSM 2133; GS: F420-dependent glutamate synthase from M. marburgensis, ADL58239; FqoF: F420H2:quinone oxidoreductase subunit F from Archaeoglobus fulgidus DSM 4304, NP_070660; FpoF: F420H2:phenazine oxidoreductase subunit F from Methanosarcina barkeri str. Fusaro, YP_303819; Fsr: N-terminal domain of Fsr, F420-reducing sulfite reductase from Methanocaldococcus jannaschii DSM 2661, Y870_METJA; FdhB: beta subunit of formate dehydrogenase from M. marburgensis, YP_003850414. Cons: the consensus sequence of the FrhB family. Capitals: conserved residues; lower case: similar residues (h: hydrophobic; s: small [GAS]; l: large [LIFYHW]; a: aromatic [FYWH]; z: T or S; n: negative [D or E], p: positive [R or K], c: charged [D, E, R, K]). In the consensus sequence, residues indentified in the FrhB structure for coordination of the iron–sulfur cluster, FAD, and F420 are highlighted in orange, cyan, and yellow, respectively. Secondary structure prediction for each of the proteins was done with PSIPRED (http://bioinf.cs.ucl.ac.uk/psipred/): green highlight: α-helix; gray highlight: β-strand. Highly conserved amino acids are indicated in bold font. Amino acid numbers are shown in red; note that the C-terminal 83 residues of glutamate synthase (GS) align with the N-terminus of FrhB and the N-terminal 182 residues with the C-terminus of FrhB.
Figure 10
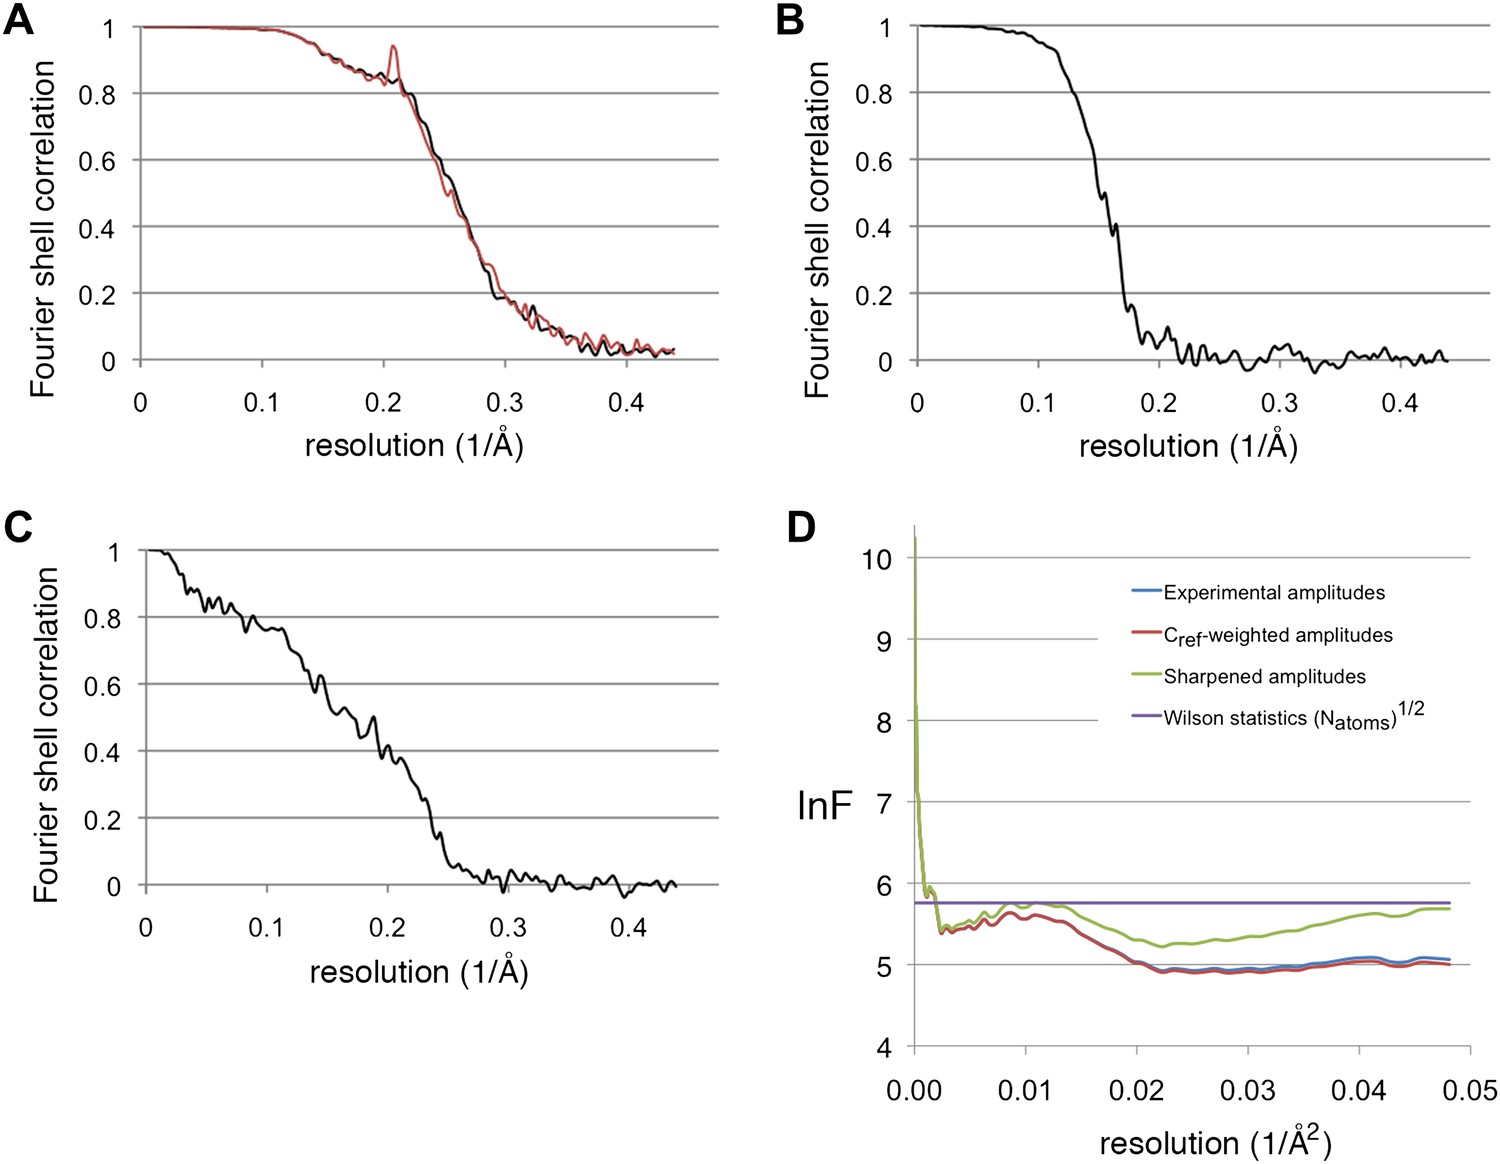
Resolution estimations and B-factor determination.
(A) Fourier shell correlation plot, showing the resolution for the substrate-free map (black) and the F420-containing map (red). At the 0.5 FSC criterion, the resolution is 3.9 and 4.0 Å, respectively. (B) Gold standard FSC between two half-data sets independently refined from a low-resolution model. The resolution at the 0.143 FSC criterion is 5.5 Å. (C) FSC between the map and model. At 0.5 FSC, the indicated resolution is 5.8 Å. (D) Plots of the natural logarithm of the spherically averaged structure factor amplitude as a function of the resolution (Å−2). Blue: experimental amplitudes; red: Cref-weighted amplitudes; green: amplitudes sharpened with a B-factor of −54 Å2, as determined by the program embfactor (Fernández et al., 2008) for the resolution zone 10–4.5 Å. The purple line shows the average scattering amplitude for the Frh complex (√Natoms).
Figure 11
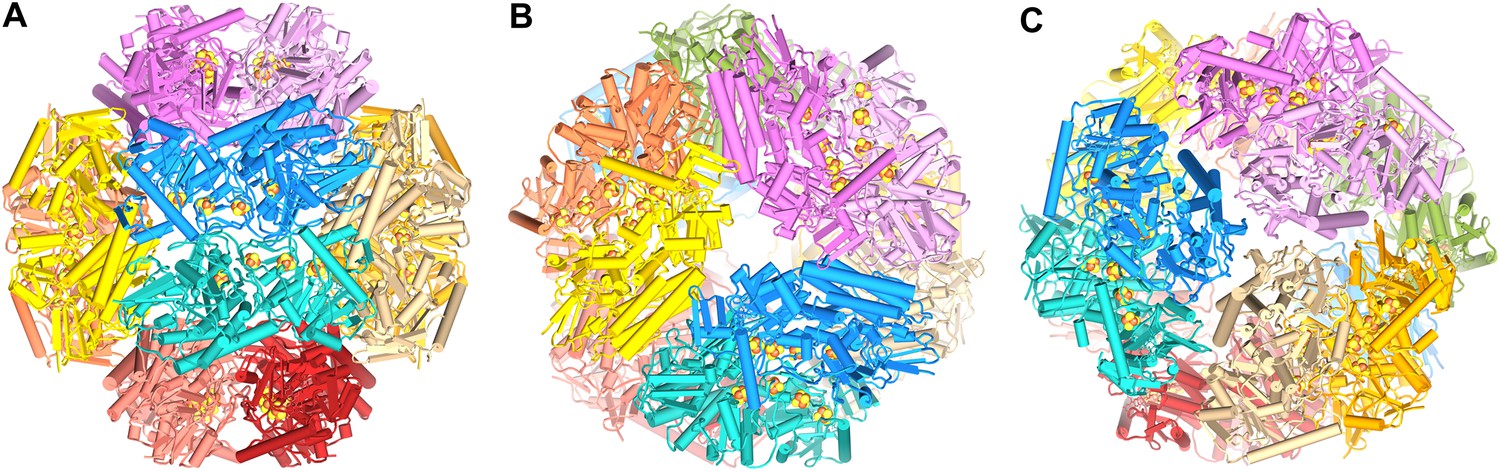
Model of the dodecameric Frh complex.
Each FrhABG heterotrimer is colored differently with the same color scheme as the map in Figure 1. (A) View down the twofold axis, (B) view of the FrhB trimer, and (C) view of the closely packed FrhA trimer as Figure 1C.
Figure 12
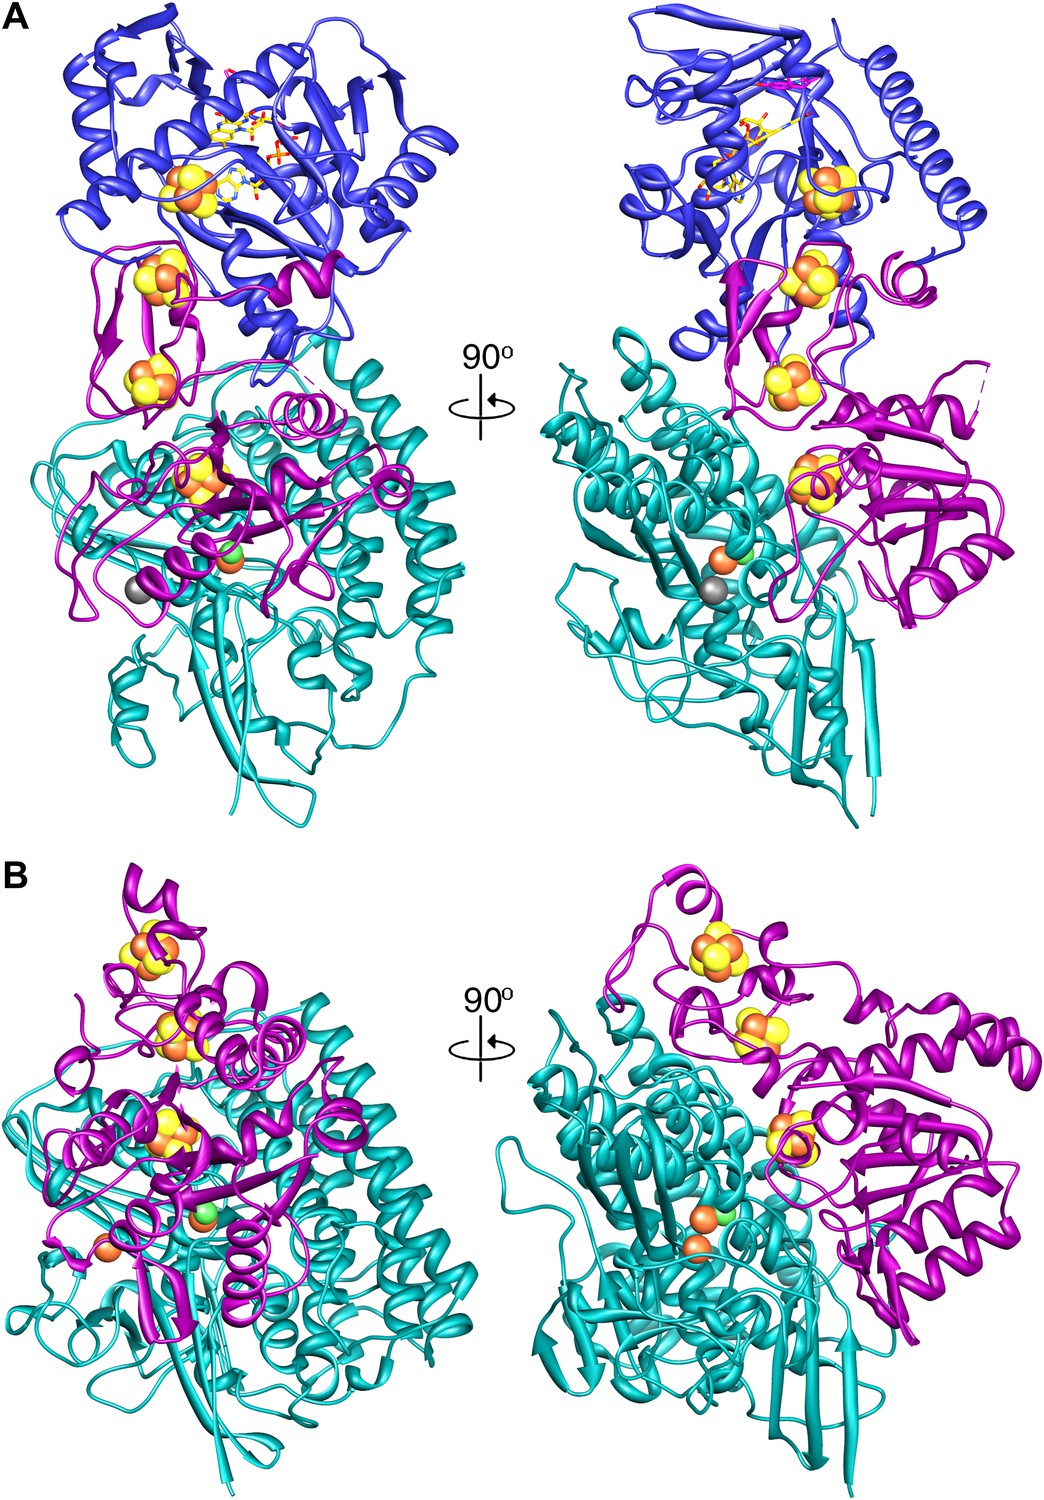
A comparison of (A) Frh and (B) the group I [NiFe] hydrogenase from Desulfovibrio gigas (2wpn) (Marques et al., 2010) shows a lower intersubunit contact area in the former. The large subunit/FrhA is shown in green, the small subunit/FrhG in magenta, and FrhB in blue. The left panel shows Frh in an orientation along the twofold axis of the complex, as seen from the outside, and the right panel a view 90° rotated, as seen from the dimer partner.
Videos
Video 1
The Frh map at different density levels.
The Frh map contains high densities corresponding to the metal clusters. The map, filtered to 5.5 Å for clarity, is shown at increasing isosurface levels. At density level 1 (gray), the whole complex is seen; levels 2 (yellow) and 3 (gold) show decreasing protein density. At level 4 (orange), only a string of five densities remains, corresponding to the four [4Fe4S] clusters and the [NiFe] cluster. The FeS clusters, but not the [NiFe], are still visible at level 5 and 6 (red).
Video 2
FrhA.
The model of FrhA is shown superimposed on the map.
Video 3
FrhG.
The model of FrhG is shown superimposed on the map.
Video 4
FrhB.
The model of FrhB is shown superimposed on the map.
Video 5
Conserved residues in FrhB.
The FrhB model is shown with conserved residues in red, similar residues in orange and unconserved residues in gray (see Figure 7 for sequence). FAD is yellow and F420 green. Highly conserved regions surround the FeS cluster and the FAD as well as the F420 isoalloxazine ring. An entrance pathway for F420 is suggested as well.
Video 6
The Frh dodecamer.
A model of the tetrameric Frh complex.
Download links
A two-part list of links to download the article, or parts of the article, in various formats.
Downloads (link to download the article as PDF)
Open citations (links to open the citations from this article in various online reference manager services)
Cite this article (links to download the citations from this article in formats compatible with various reference manager tools)
De novo modeling of the F420-reducing [NiFe]-hydrogenase from a methanogenic archaeon by cryo-electron microscopy
eLife 2:e00218.
https://doi.org/10.7554/eLife.00218


