Strong inter-population cooperation leads to partner intermixing in microbial communities
- Fred Hutchinson Cancer Research Center, United States
- Montana State University, United States
Figures
Figure 1 with 3 supplements
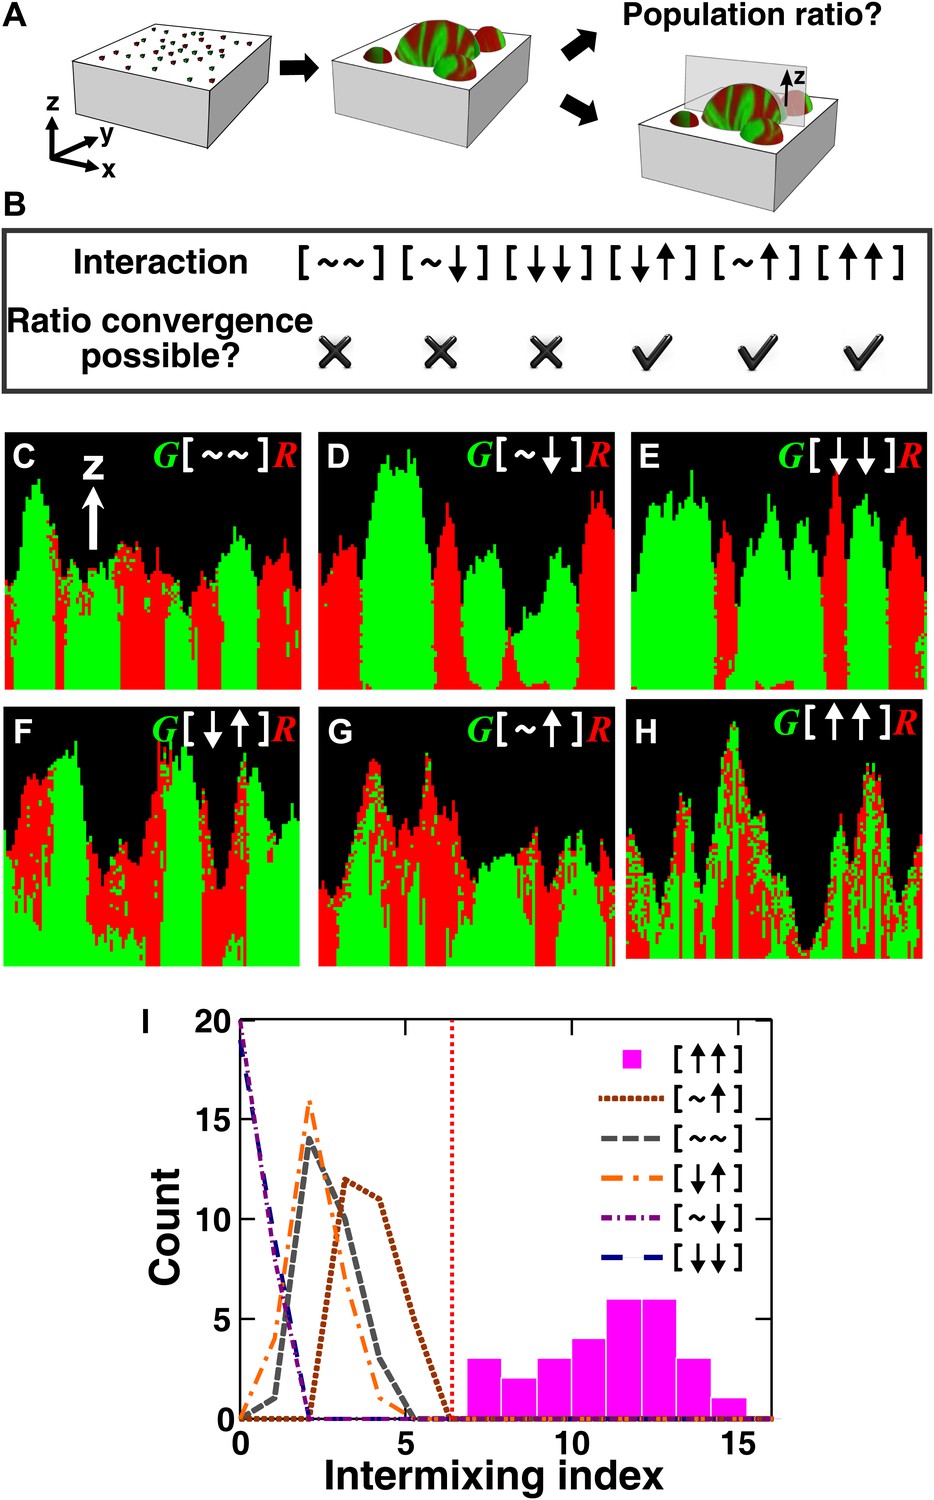
The fitness model generates two ecological patterning predictions.
(A) In all simulated and experimental communities (see ‘Materials and methods’), two populations of cells, marked in red and green, were initially randomly distributed on a surface unless otherwise stated. The two populations engaged in one of the six ecological interactions. Population ratios for the entire community and patterns of vertical cross sections were examined. (B) The fitness model predicts that strong interactions beneficial to at least one partner can potentially lead to the convergence of initially disparate population ratios (Figure 1—figure supplement 2). (C)–(H) Representative vertical cross-sections of simulated communities, each engaging in one of the six types of ecological interactions, are presented. The fitness effects of ↑and ↓are large compared to the non-zero basal fitness of the recipient (Figure 1—source data 1), and therefore [↑ ↑] is strong facultative cooperation. (I) Vertical cross-sections of single-cell thickness from cooperative communities show significantly more intermixing than those from other communities (n = 28 sections; p<0.01, Mann–Whitney U test). An intermixing index of 6 (red dotted line) or above separates cooperative from non-cooperative communities in our simulations. To reduce the correlation of sections sampled from the same community, nearest sections were separated by at least seven sections.
-
Figure 1—source data 1
Parameter values used in the fitness model.
- https://doi.org/10.7554/eLife.00230.004
Figure 1—figure supplement 1
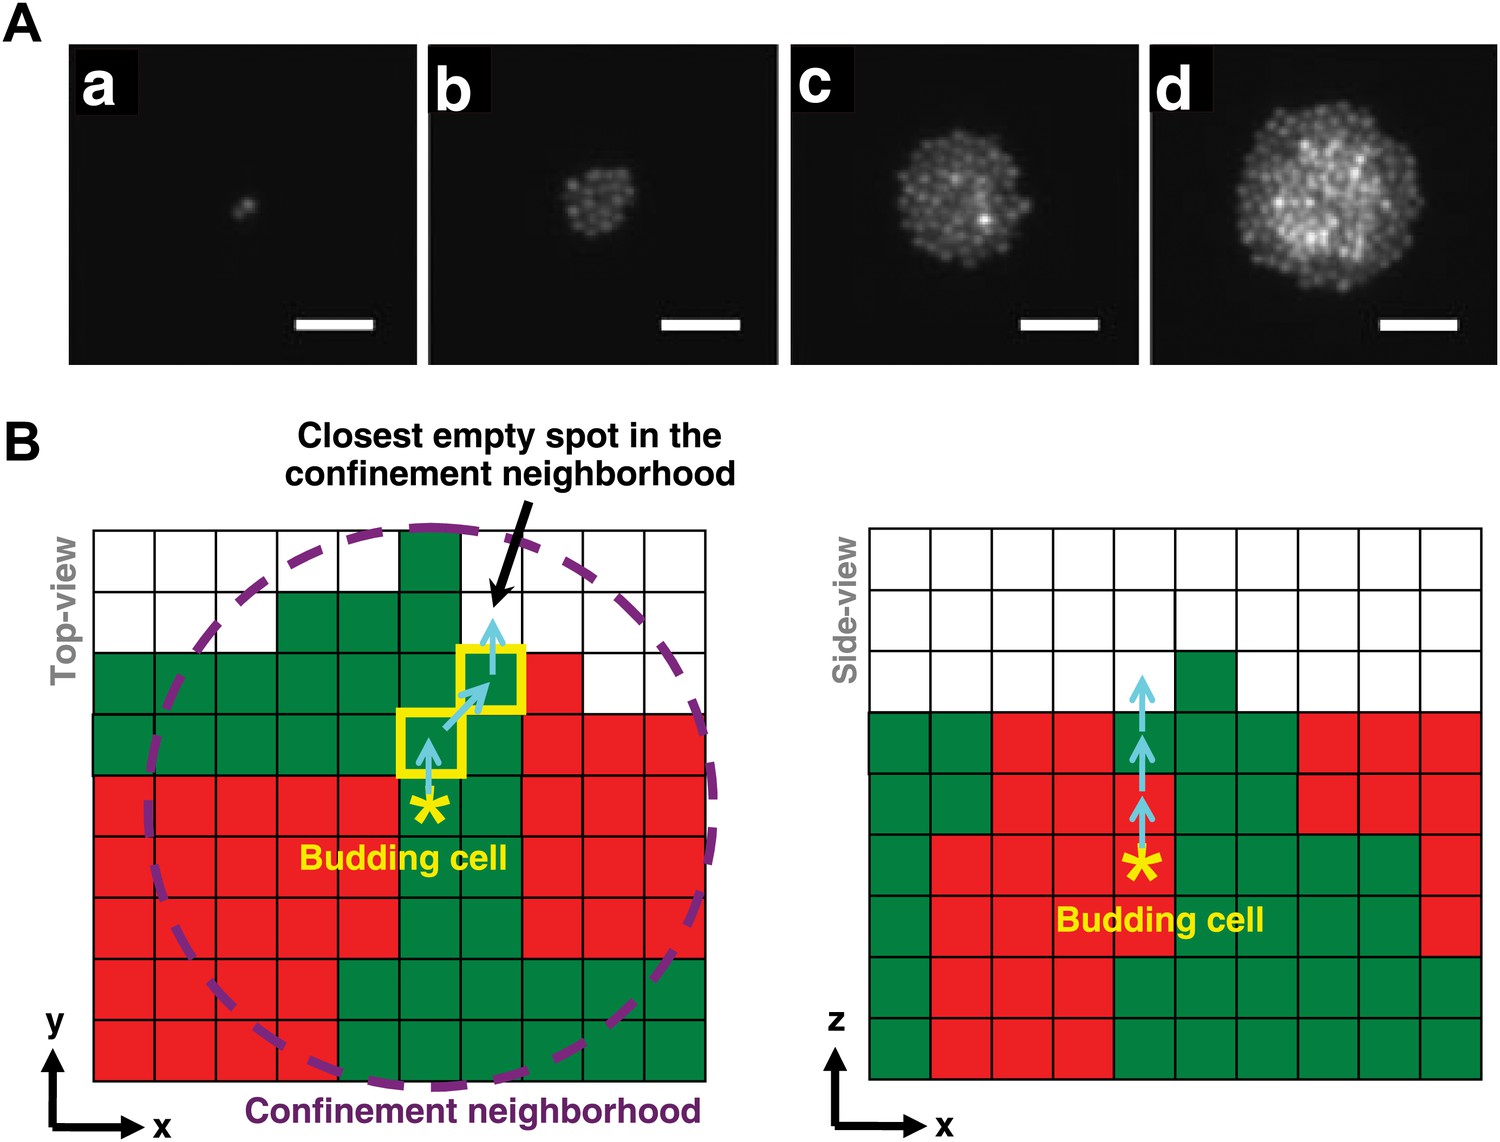
Cell rearrangement in simulations follows experimental observations on cells that are not actively motile.
(A) To incorporate realistic assumptions about cell rearrangement in three-dimensional communities, we monitored the growth of a single fluorescent yeast cell into a microcolony on top of solid agarose (Video 1). Starting from one budding cell (a, hour 0.5), cells initially divided and pushed other cells to the side such that all cells remained in the same plane (b, hour 9). When the group of cells reached approximately 5-cell radius (c, hour 14), cells in the center could no longer push other cells to the side and instead budded upward, as indicated by higher intensities in the fluorescence images. Continued growth of microcolony forced more cells in the middle to send their progeny to upper layers, while cells close to the edge could still push other cells to the side and remained on the agarose surface (d, hour 17.5). Scale bars are 20 μm. (B) In simulations of the diffusion and fitness models, a focal budding cell (star) was assumed to bud toward the nearest empty space within its coplanar (x,y) confinement neighborhood of n-cell radius (left panel, magenta circle). If the nearest empty space was not unique, a random choice was made. Cells along the path (yellow rim) to the nearest empty space shifted positions (left panel, cyan arrows) to accommodate the new cell. During rearrangement, if a cell moved to a new position with no cells immediately below it, the cell was lowered until it landed on another cell or the agarose surface. If the confinement neighborhood was filled, the cell budded upward and pushed up all cells above it (right panel).
Figure 1—figure supplement 2
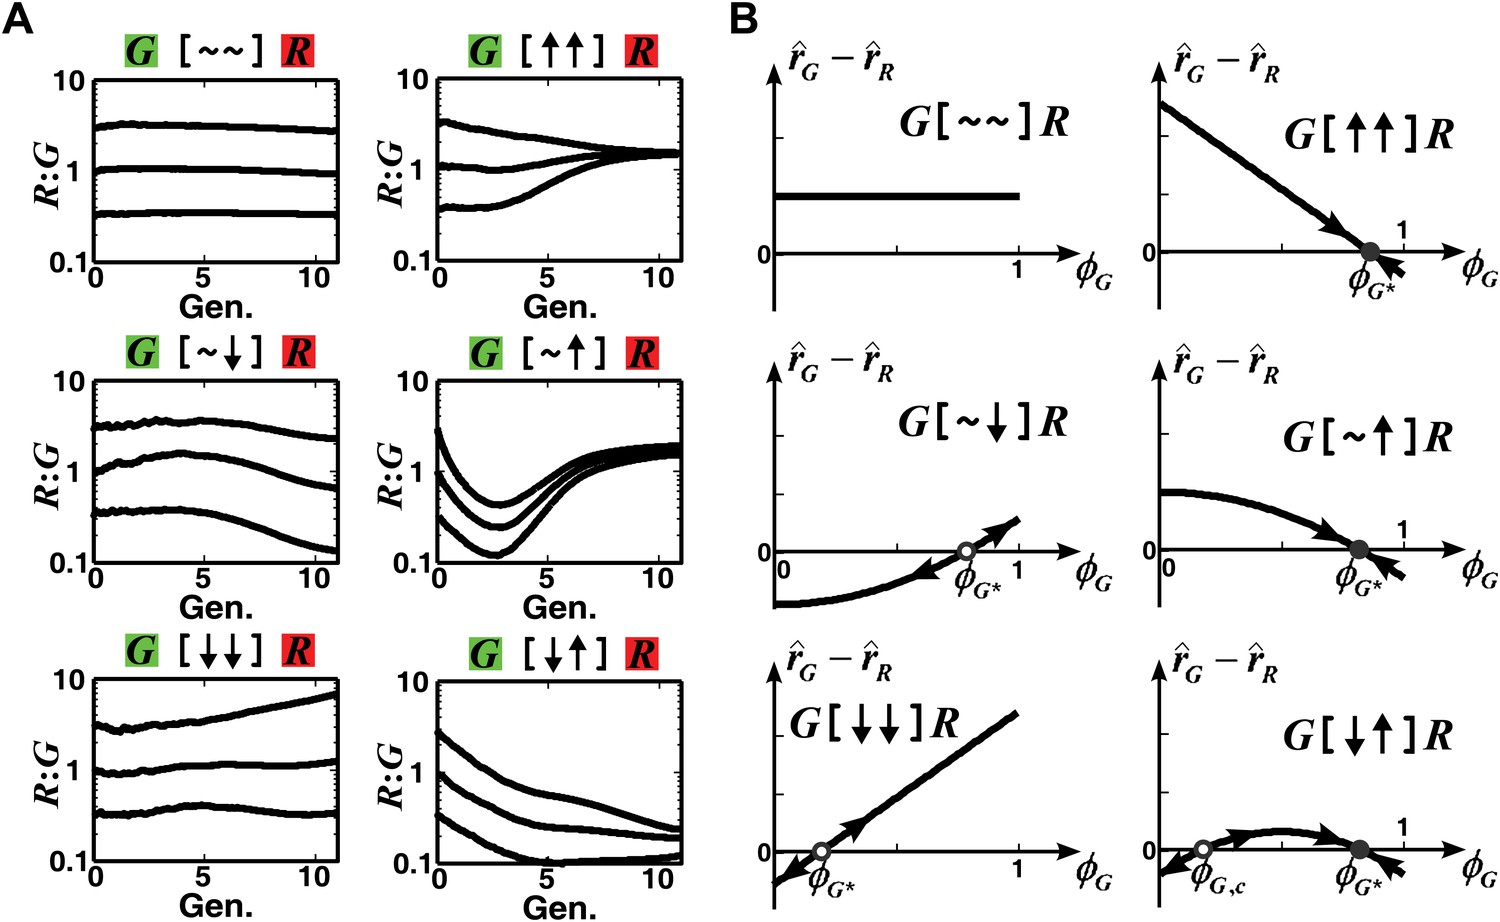
The fitness model predicts that convergence of population ratios is possible when an interaction benefits at least one partner.
(A) The fitness model demonstrated that interactions conferring large benefit to at least one partner could lead to ratio convergence. Simulation parameters are listed in Figure 1—source data 1. (B) We explored conditions for community ratio convergence (‘Requirements for steady-state ratios in the six types of communities’ in ‘Materials and methods’) by looking for the existence of stable steady states in which the two partners in an interaction neighborhood would reach identical fitness (solid circles). Open and solid circles denote unstable and stable steady states, respectively. Here, is the steady state fraction occupancy of G so that : is the steady state ratio.
Figure 1—figure supplement 3
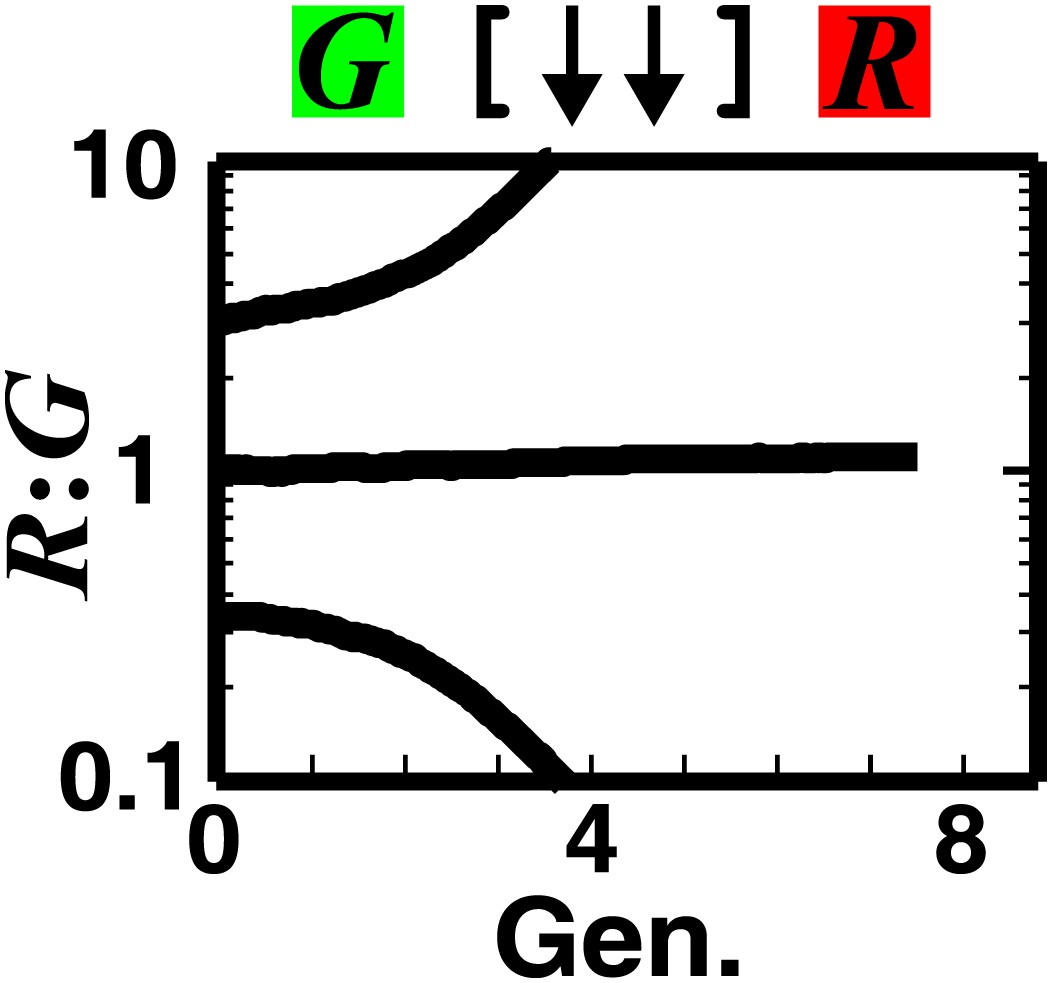
Strong mutual antagonism can lead to rapid divergence of population ratios.
The fitness model shows that if two partner populations inhibit each other sufficiently strongly compared to their basal fitness, population ratios may diverge rapidly.
Figure 2 with 4 supplements
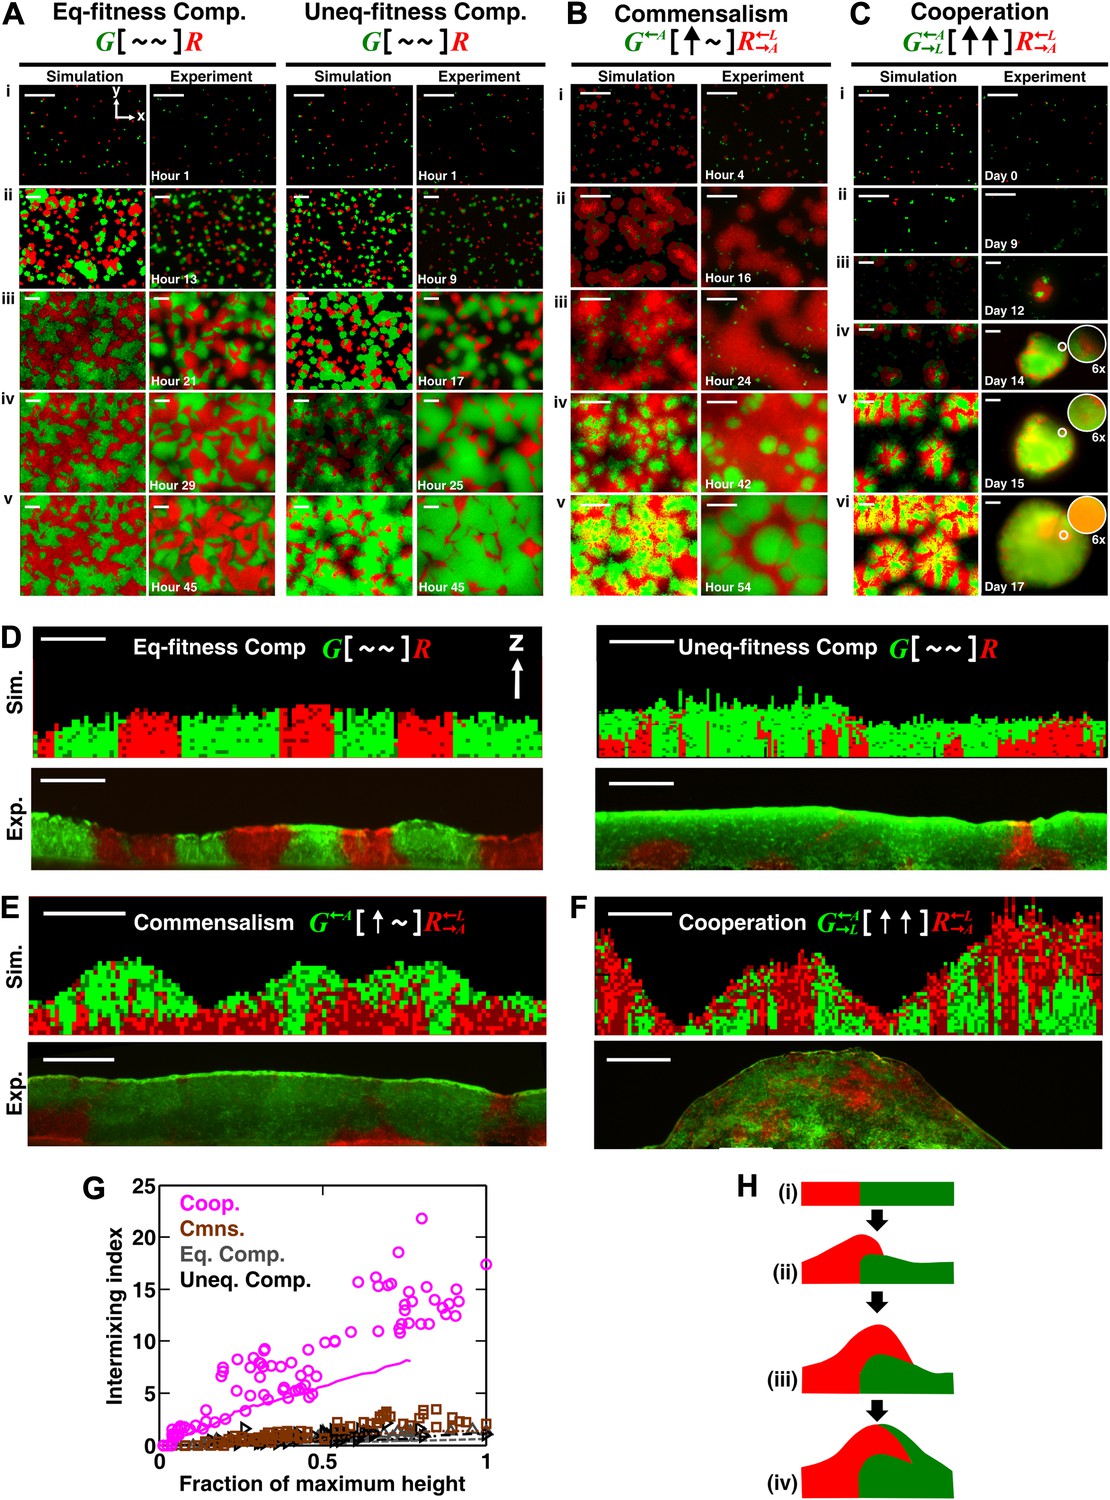
Obligatory cooperation, but not competition or obligatory commensalism, results in substantial partner intermixing in engineered yeast communities and in communities simulated using the diffusion model.
Competitive communities of strains with equal fitness (equal-fitness competition, abbreviated as ‘Eq-fitness Comp.’) showed population segregation as suggested by static late-stage top-views (A, left) and columnar cross-section patterns (D, left). When competing strains had different fitnesses (unequal-fitness competition, abbreviated as ‘Uneq-fitness Comp.’), the fitter population G expanded during growth, as evident in top views (A, right) and vertical cross-sections (D, right). In obligatory commensal communities, since one supplier could support the birth of multiple consumers, consumers eventually overgrew and covered suppliers (top-views in B and vertical cross-sections in E). Obligatory cooperative communities showed substantial population intermixing as suggested by alternating cell types in top-views (C, 6× magnification insets in experiments) and patchy cross-section patterns (F). Top views of communities from the diffusion model integrate intensity and color over height such that brighter colors represent higher cell numbers and yellowness indicates the simultaneous presence of green and red. Scale bar: 100 μm. All communities started from total 500 cells/mm2 and R:G = 1:1. (G) Quantification of intermixing in experimental (symbols) and diffusion-model (lines) communities showed that while the intermixing index remained low for commensal (brown) and competitive (grey and black) communities, it increased linearly with community height in obligatory cooperative (magenta) communities. Results from the diffusion model underestimated intermixing indexes because a confined cell was modeled to divide strictly vertically upward (Figure 1—figure supplement 1) without allowing cell movements in horizontal directions (Figure 3—figure supplement 1F). (H) A conceptual model illustrates the development of intermixing over time in a strongly cooperative community with 1:1 steady-state population ratio. Local deviations from the steady-state ratio result from asymmetric partner properties and/or stochastic fluctuations in cell numbers (i). The under-abundant population (red) grows faster than its neighboring over-abundant partner (green). Due to the spatial localization of large cooperative benefits, cells near population borders grow faster than those farther away. Consequently, cells from the initially under-abundant red population at the border divide the fastest. Progeny that pile on the green partner have more access to cooperative benefits than those who do not (ii), which favors intermixing. When the previously over-abundant partner becomes under-abundant (iii), piling-up in the opposite direction occurs (iv, green on red).
-
Figure 2—source data 1
Definitions and values of parameters used in the diffusion model.
- https://doi.org/10.7554/eLife.00230.010
Figure 2—figure supplement 1
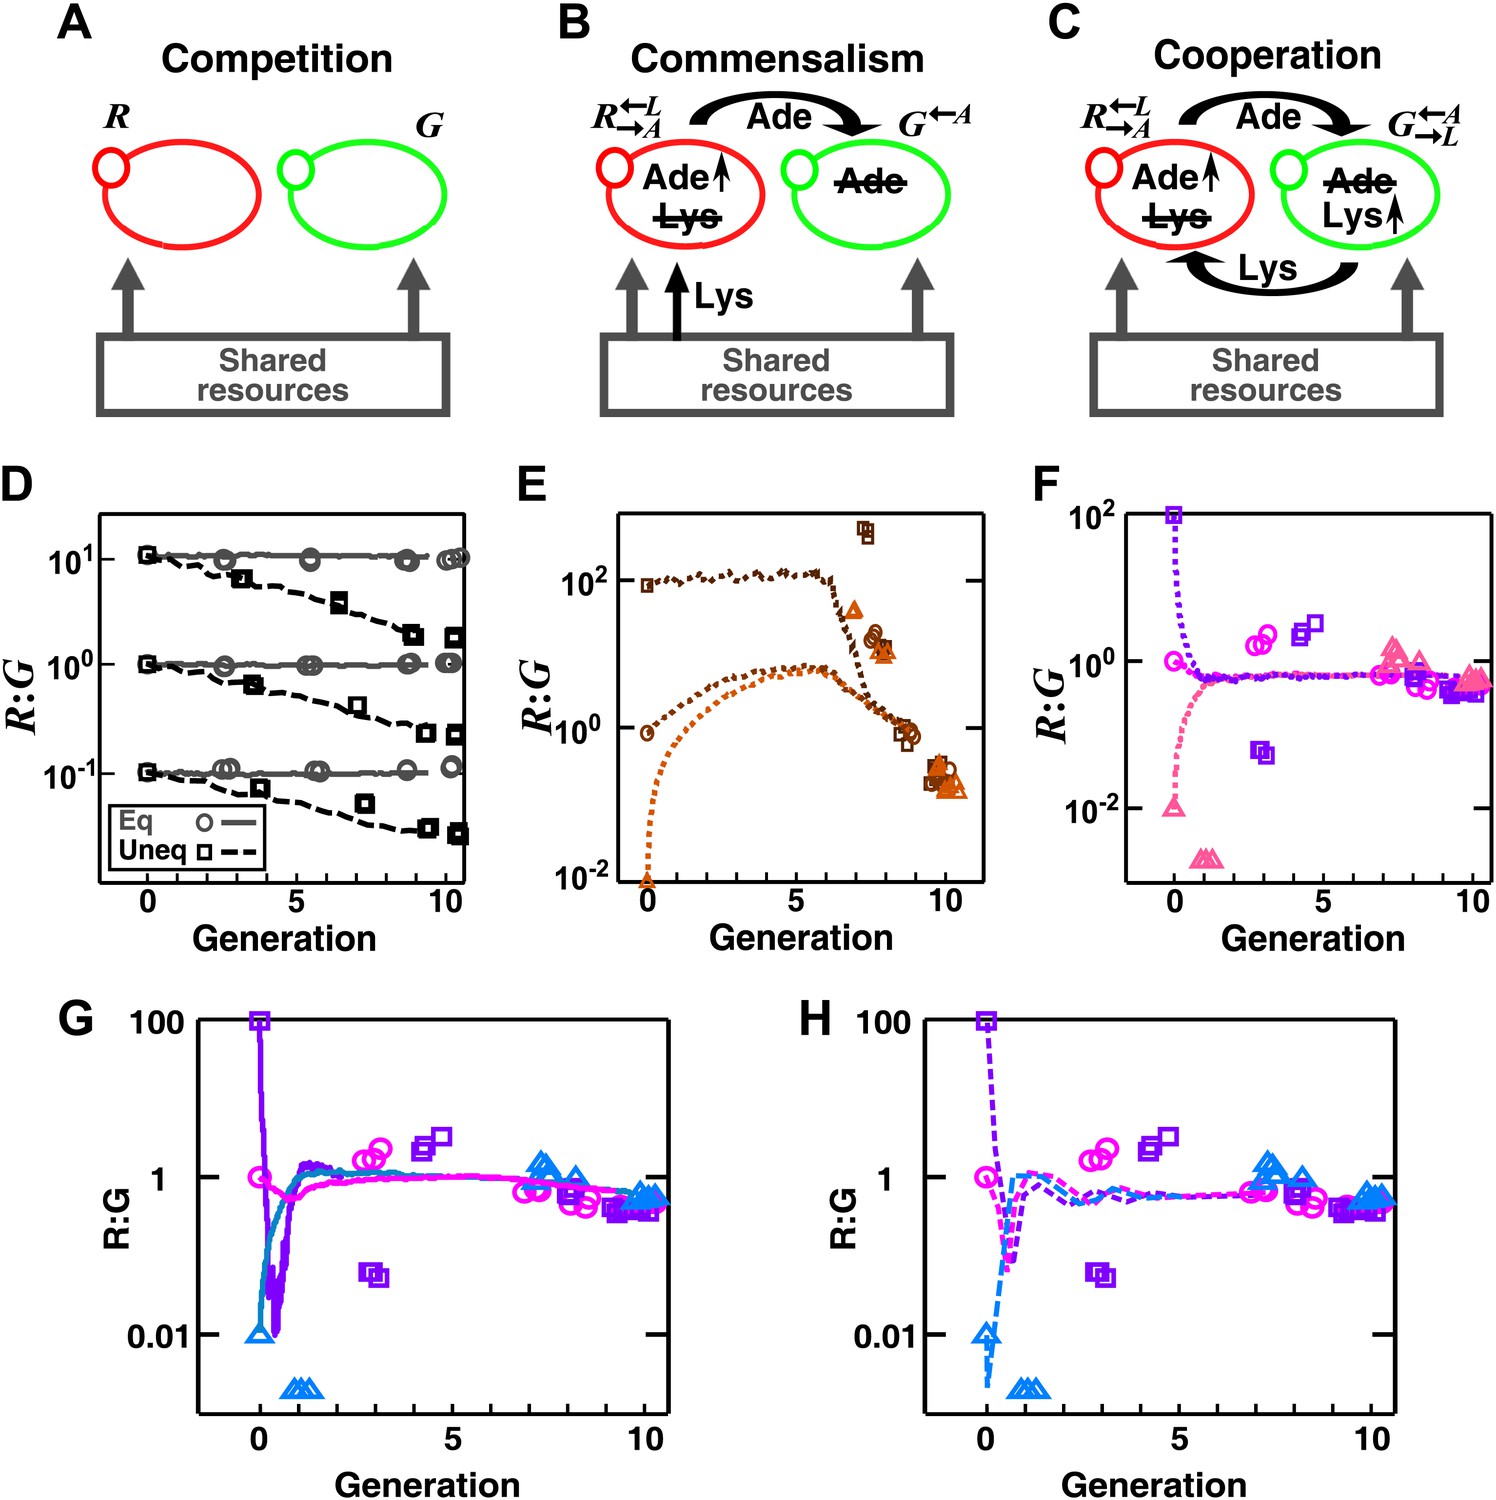
In engineered yeast communities, obligatory cooperation and obligatory commensalism allow initially different partner ratios to converge over time.
Engineered yeast communities consisted of two non-mating fluorescent strains of yeast, G and R, engaged in a metabolic interaction. (A) In competitive communities, two prototrophic strains engaged in equal-fitness or unequal-fitness competition for shared resources. (B) In obligatory commensal communities, took in lysine from the media and overproduced adenine to feed . (C) In obligatory cooperative communities, overproduced adenine and required lysine while overproduced lysine and required adenine. (D)–(H) Symbols: experiments; lines: results from the diffusion model. (D) In competitive communities, the ratio between two equally-fit populations remained steady (grey), whereas the ratio between two populations with unequal fitness (G 20% fitter than R) changed monotonically (black) in favor of the fitter population. Population ratios of obligatory commensal (E) and obligatory cooperative (F) communities converged regardless of their initial values (different colors representing different initial conditions). (G–H) Ratio fluctuations observed in experimental cooperative communities were better recapitulated in diffusion models that incorporated additional specifics of the yeast system. (G) Incorporating a slower diffusion constant in the community (∼20 μm2/s) than that in agarose (360 μm2/s) allowed ratio convergence to more closely resemble experimental data. (H) Incorporating experimental observations, such as better starvation tolerance of adenine-requiring cells compared to lysine-requiring cells and the consequent delay in lysine release compared to adenine release (Shou et al., 2007), allowed ratio convergence to more closely resemble experimental data. All communities were initiated at 3000 cells/mm2 on top of a 24-mm-high column of agarose. Population ratios in experiments were measured using flow cytometry (see ‘Materials and methods’). As predicted by the fitness model, population ratios converged as time progressed in obligatory cooperative and obligatory commensal but not competitive communities both in the experiments and the diffusion model.
Figure 2—figure supplement 2
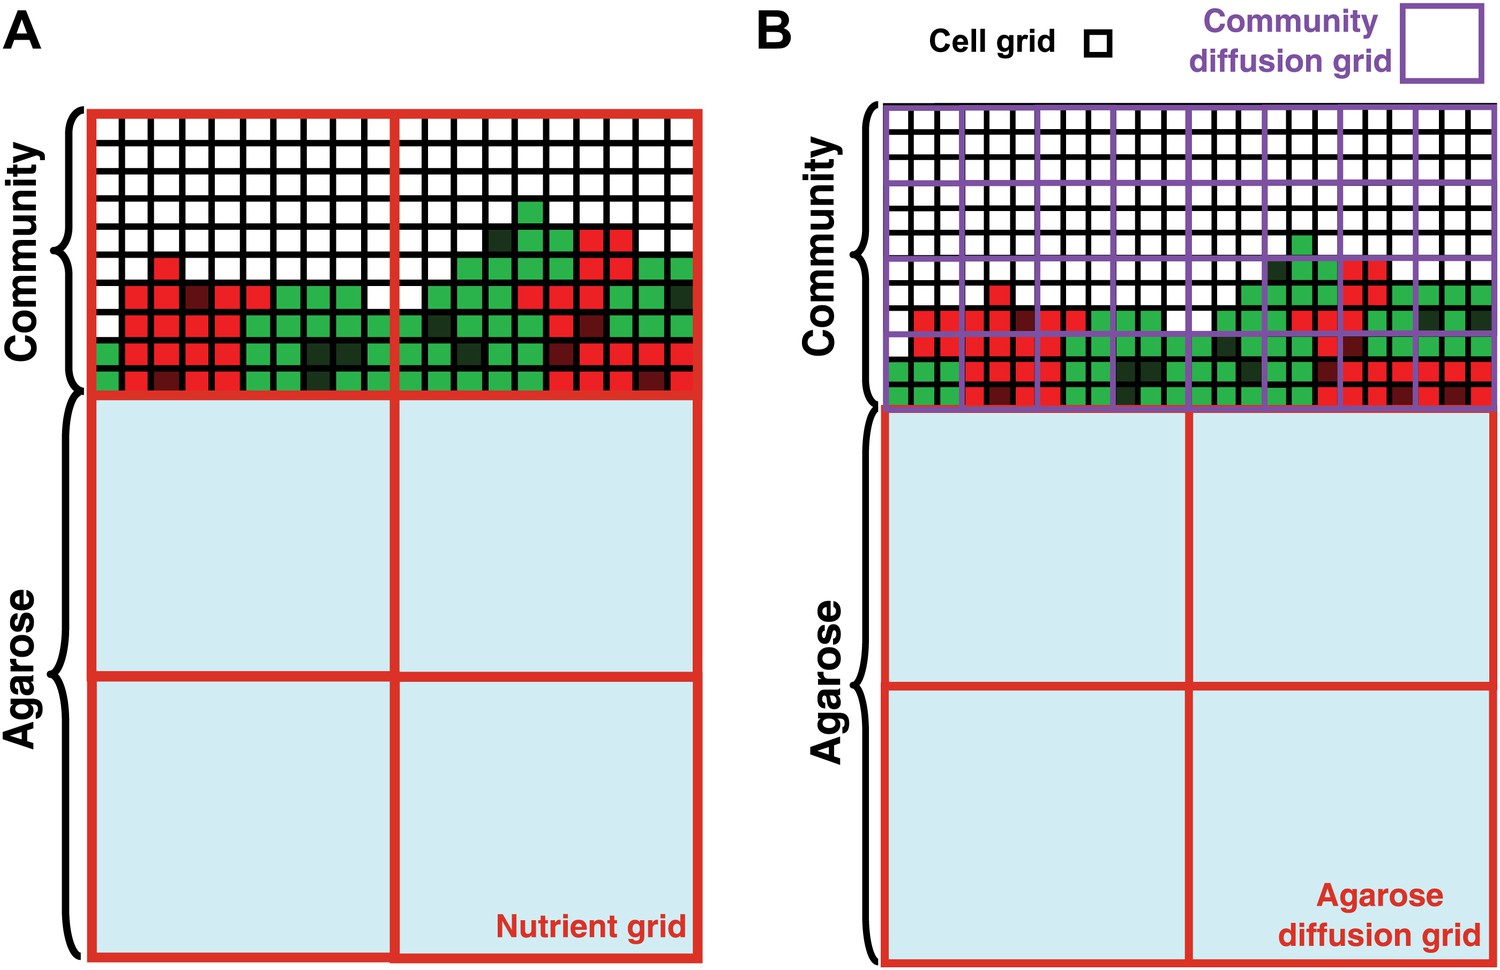
Basic assumptions in the diffusion model.
In the diffusion model, community grew on the top surface of an agarose column (light blue). Cell grids (black borders) represented cells at different states: live R (light red), live G (light green), dead R (dark red), dead G (dark green), and no cells (white). (A) When the diffusion constants of nutrients in the yeast community were assumed to equal those in agarose (360 μm2/s), nutrient grids (orange) were used to simulate the distribution of nutrients. (B) When the diffusion constants of nutrients in the yeast community were modeled to be that of the fluorescent dye Sulforhodamine 101 (∼20 μm2/s; Figure 2—figure supplement 1G), we implemented community diffusion and agarose diffusion grids of 3- and 12-cell grid width, respectively, to accommodate two diffusion constants.
Figure 2—figure supplement 3
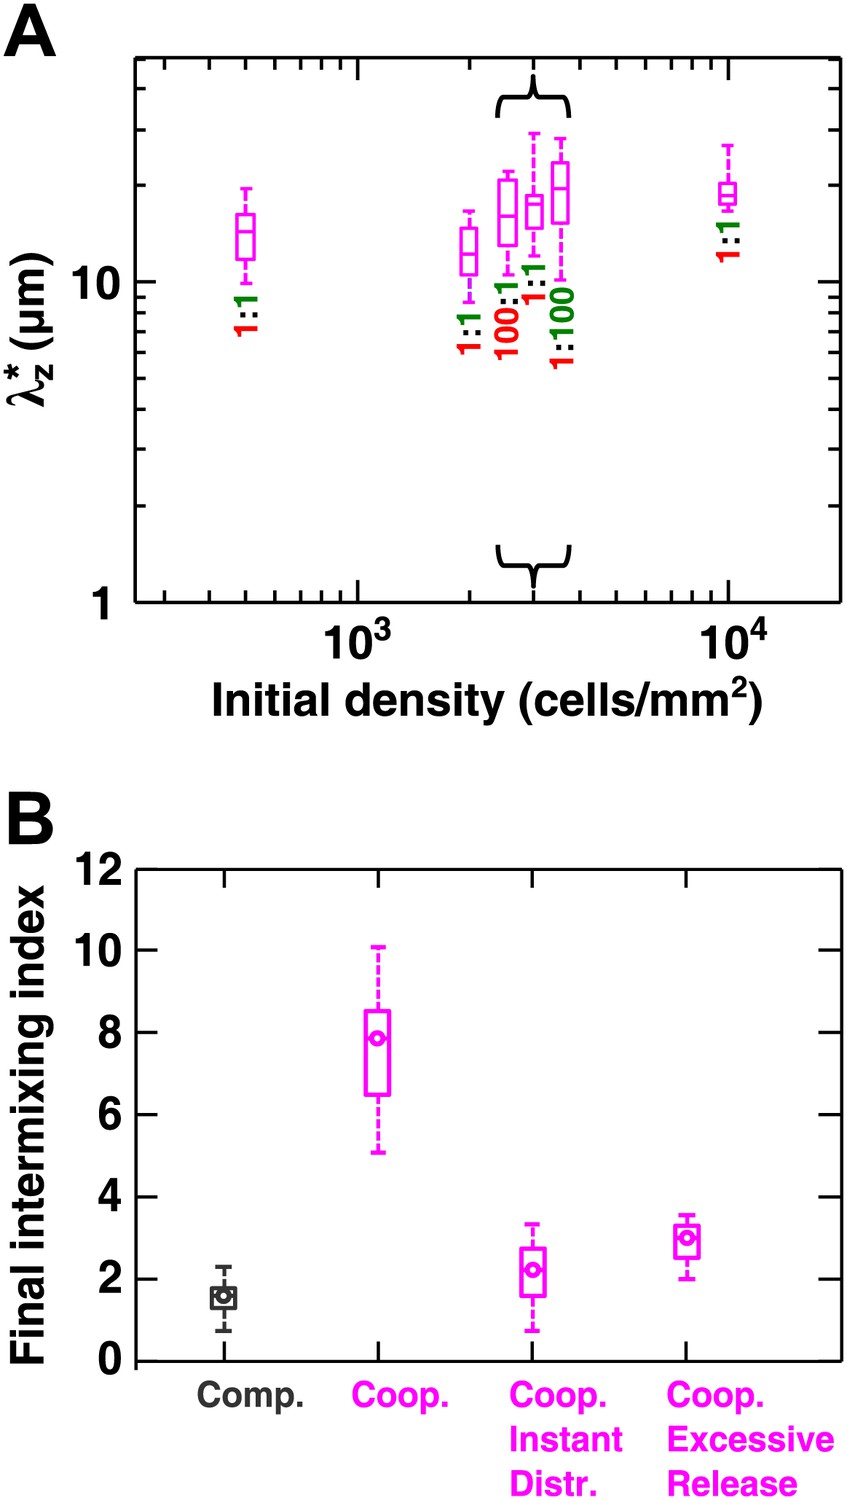
Cooperative communities exhibit a characteristic patch size associated with the spatial localization of benefits.
(A) Starting from densities and ratios spanning orders of magnitude, experimental obligatory cooperative yeast communities developed a consistent characteristic vertical patch size of ∼10 to 20 μm. (B) The diffusion model shows that when both released nutrients were instantly and uniformly distributed throughout a community (‘Coop. Instant Distr.’), intermixing was diminished compared to when nutrients diffused in the community (360 µm2/s, ‘Coop.’). Excessive release of nutrients (200× compared to typical values in Figure 2—source data 1) also significantly reduced population intermixing (‘Coop. Excessive Release’), since the benefits exceeded the uptake capacity of partner cells and therefore no longer remained localized. All simulations started with 2000 total cells/mm2 and 1:1 population ratio. Box plots show the 25th to 75th percentile range, with the median marked with a line and whiskers extending to the 95% confidence interval.
Figure 2—figure supplement 4
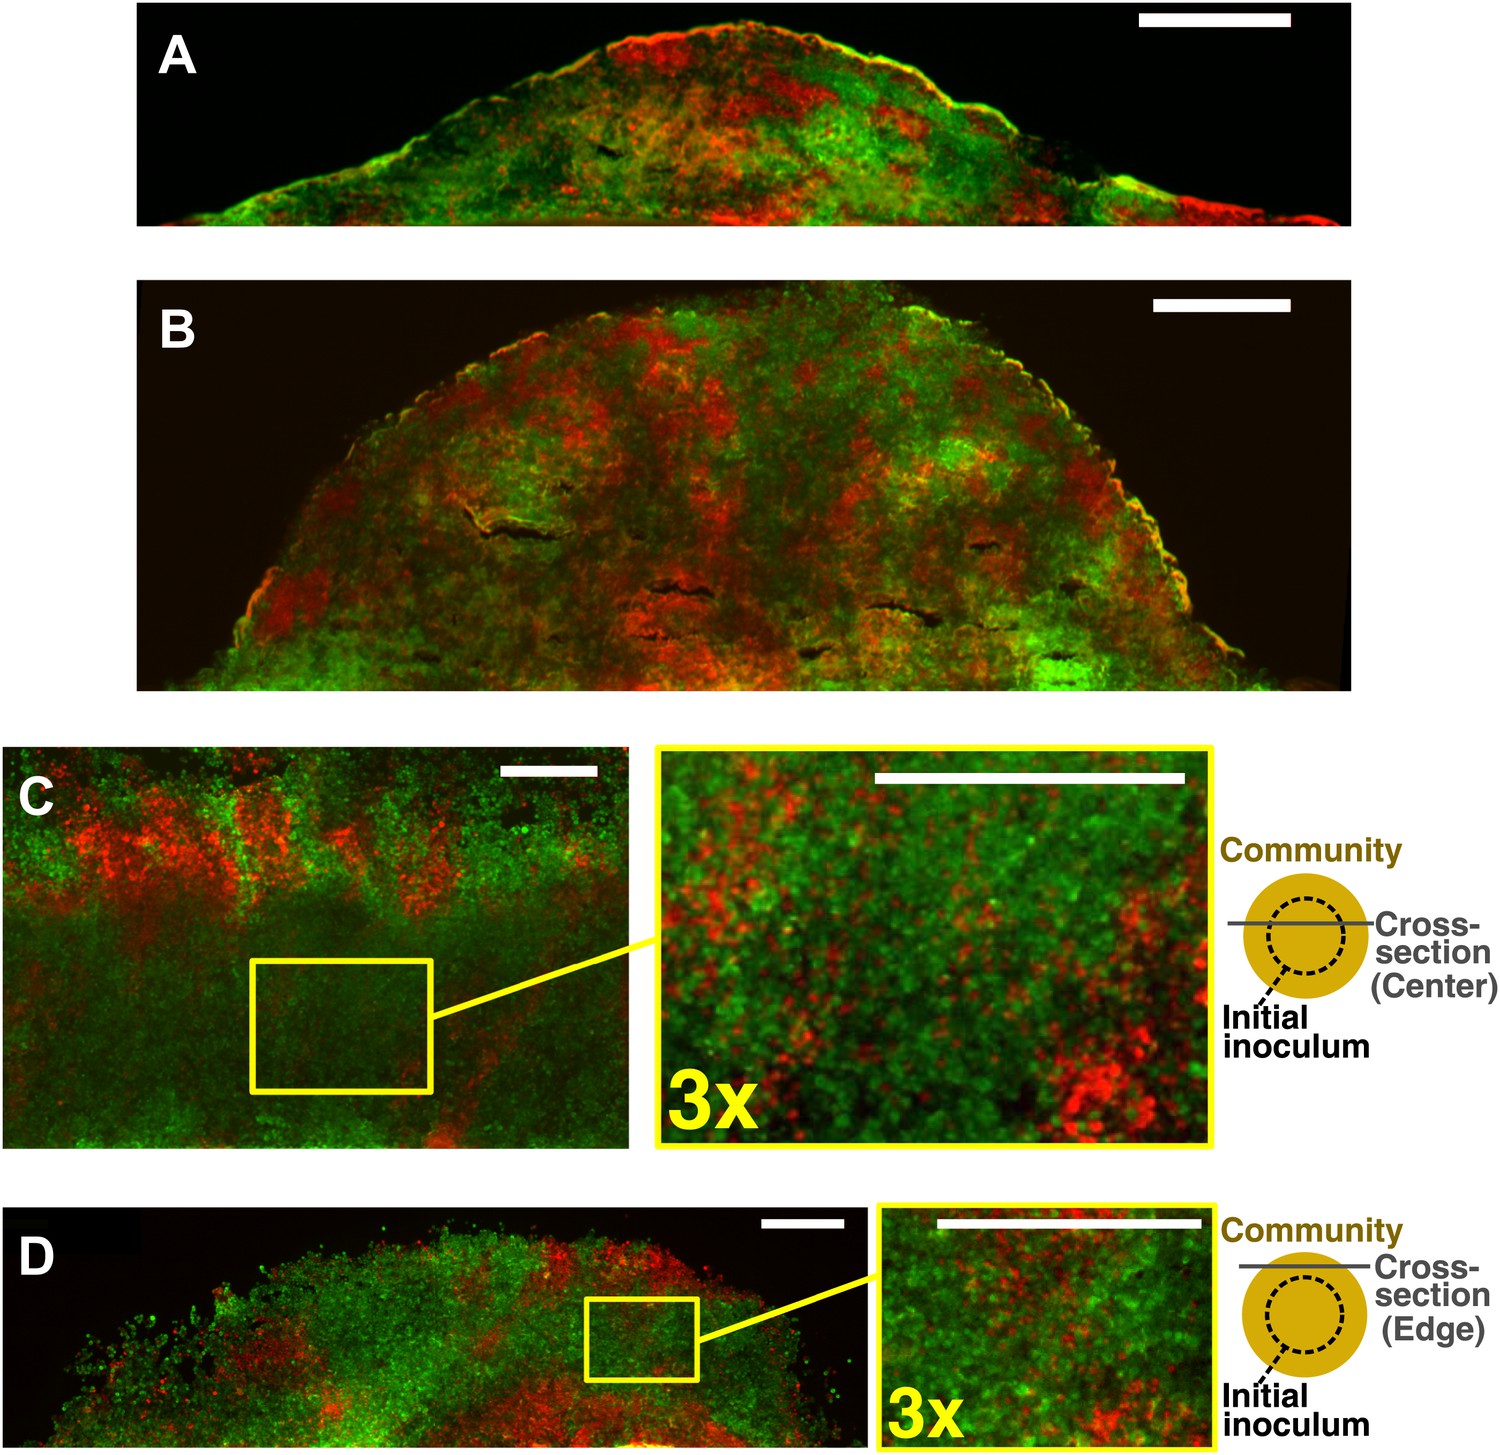
Obligatory cooperative yeast partners intermix.
Vertical cross-sections in (A) and (B) were from different growth stages of obligatory cooperative yeast communities starting at total 500 cells/mm2 and 1:1 population ratio. Vertical cross-section in (C) and (D) were respectively from the center and the edge of an obligatory cooperative yeast community started from a high-density inoculum and allowed to expand to new territories. Areas enclosed in the yellow boxes were 3× magnified in the right panels to show details of intermixing. The top-view schematic insets in (C) and (D) show the relative position of the corresponding cross-section with regard to the initial inoculum (dashed line). All scale bars are 100 µm.
Figure 3 with 1 supplement

Strongly cooperating populations intermix under a wide range of conditions.
(A) In engineered yeast communities, even though both obligatory cooperative and non-cooperative communities directly above the high-density inoculation spot showed high population intermixing (‘Center’), edge sections (‘Edge’) of obligatory cooperative communities showed significantly more intermixing than those from non-cooperative communities (Mann–Whitney U test, p<5 × 10⁻⁵). A total of 106 R and G cells at a 1:1 ratio were deposited in an inoculation spot of ∼2 mm2, corresponding to 10 cell layers. Communities were allowed to grow and expand beyond the inoculation spot on a 4-mm-tall agarose pad of 500 mm2 area. Vertical sections from the edges were taken at a height approximately half of the maximum community height at the center. Box plots show the 25th to 75th percentile range, with the median marked with a line and whiskers extending to the 95% confidence interval. (B) In simulations using the fitness model, facultative cooperation conferring smaller fitness benefits required greater community heights to exhibit a significant level of intermixing. The strength of facultative cooperation is shown as the ratio of fitness benefit received from each cooperative partner cell in the interaction neighborhood to the basal fitness of the focal cell. Simulation parameters can be found in Figure 3—source data 1. Error bars indicate 95% confidence interval.
-
Figure 3—source data 1
Parameter values used in the fitness model in Figure 3B.
- https://doi.org/10.7554/eLife.00230.020
Figure 3—figure supplement 1
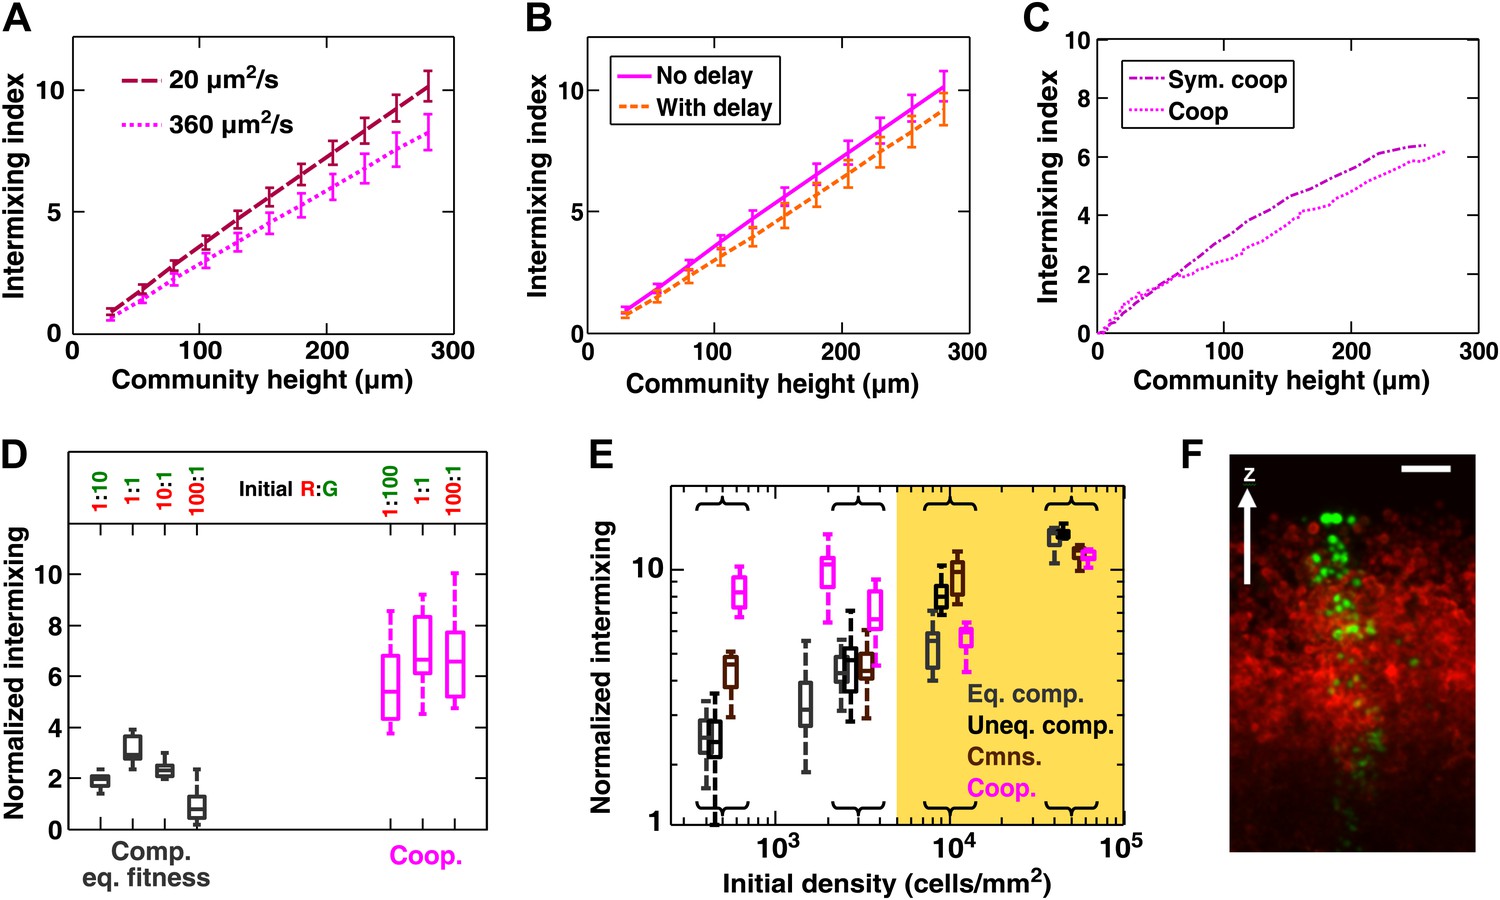
Intermixing is observed in obligatory cooperative communities over a wide range of conditions.
(A) Partner intermixing is insensitive to diffusion constants. In the diffusion model, obligatory cooperative communities with diffusion constants ranging from 20 to 360 µm2/s (corresponding to the diffusion constants of Sulforhodamine 101 in yeast community and agarose, respectively) both showed significant partner intermixing during growth. (B) Partner intermixing is insensitive to the kinetics of interactions. With or without incorporating details such as significantly better starvation tolerance in adenine-requiring cells compared to lysine-requiring cells and the consequent delay in lysine release compared to adenine release (Shou et al., 2007), the diffusion model (lines) yielded substantial population intermixing. Diffusion constant within the community was assumed to be 20 μm2/s. In both (A) and (B), communities started from 3000 total cells/mm2 at 1:1 population ratio. (C) Intermixing does not depend on asymmetry between cooperating partners. We examined symmetric obligatory cooperation by assuming that for the two partners, all live cells released nutrients at a constant and identical rate without delay, and that other properties such as rates of growth, death, and nutrient consumption were also identical. Partner intermixing in this symmetric obligatory cooperative system (Sym. coop) was similar to that in asymmetric obligatory yeast cooperative system (Coop). Simulated communities started from total 500 cells/mm2 at 1:1 population ratio. (D) Cooperative intermixing is insensitive to initial ratios. Engineered yeast communities were initiated at a total cell density of 3000 cells/cm2 and grown to near the carrying capacity of the agarose column. Box plots show 25th to 75th percentile values of the intermixing index, with the median marked with a line and whiskers extending to 95% confidence interval. To facilitate comparisons, intermixing indexes in communities with different heights were linearly normalized to correspond to a height of ∼40 cell layers (200 µm). (E) Experimental obligatory cooperative communities (magenta) showed more intermixing than obligatory commensal (brown), equal-fitness competitive (grey), and unequal-fitness competitive (black) communities, except when the initial cell densities exceeded 10% confluence (yellow shading). Large intermixing indexes at high initial cell densities were due to the fact that the budding direction of a cell under spatial confinement was not exactly vertical (F). To facilitate comparisons, intermixing indexes in communities with different heights were linearly normalized to correspond to a height of ∼30 cell layers (150 µm). Communities were initiated at R:G = 1:1 and grown until near the carrying capacity of the agarose. Box plots show the 25th to 75th percentile range, with the median marked with a line and whiskers representing 95% confidence intervals. (F) An equal-fitness competitive community was initiated at confluent density (50000 cells/mm2) and R:G = 100:1 to ensure that single green cells were laterally confined by red cells. Cross-sections showed that the early progeny of a single cell was distributed in a division zone of ∼3-cell rather than 1-cell width. Lateral budding by late progeny further widens the zone to ∼5-cell diameter in a mature community. Scale bar is 20 µm.
Figure 4

Obligatory cooperation through redox-coupling leads to partner intermixing.
(A) In the absence of sulfate and hydrogen, the bacterium Desulfovibrio vulgaris (Dv) and the archaeon Methanococcus maripaludis (Mm) cooperate through redox coupling. Dv ferments lactate and produces mainly acetate, CO2, and H2. However, this reaction is not thermodynamically favorable unless H2 is kept at very low concentrations. H2 is used by Mm to reduce CO2 to methane. (B) In cooperative biofilms of Dv (green) and Mm (red), the intermixing index increased with height. Cell identification relied on FISH (see ‘Materials and methods’). Scale bar: 20 µm.
Figure 5 with 1 supplement
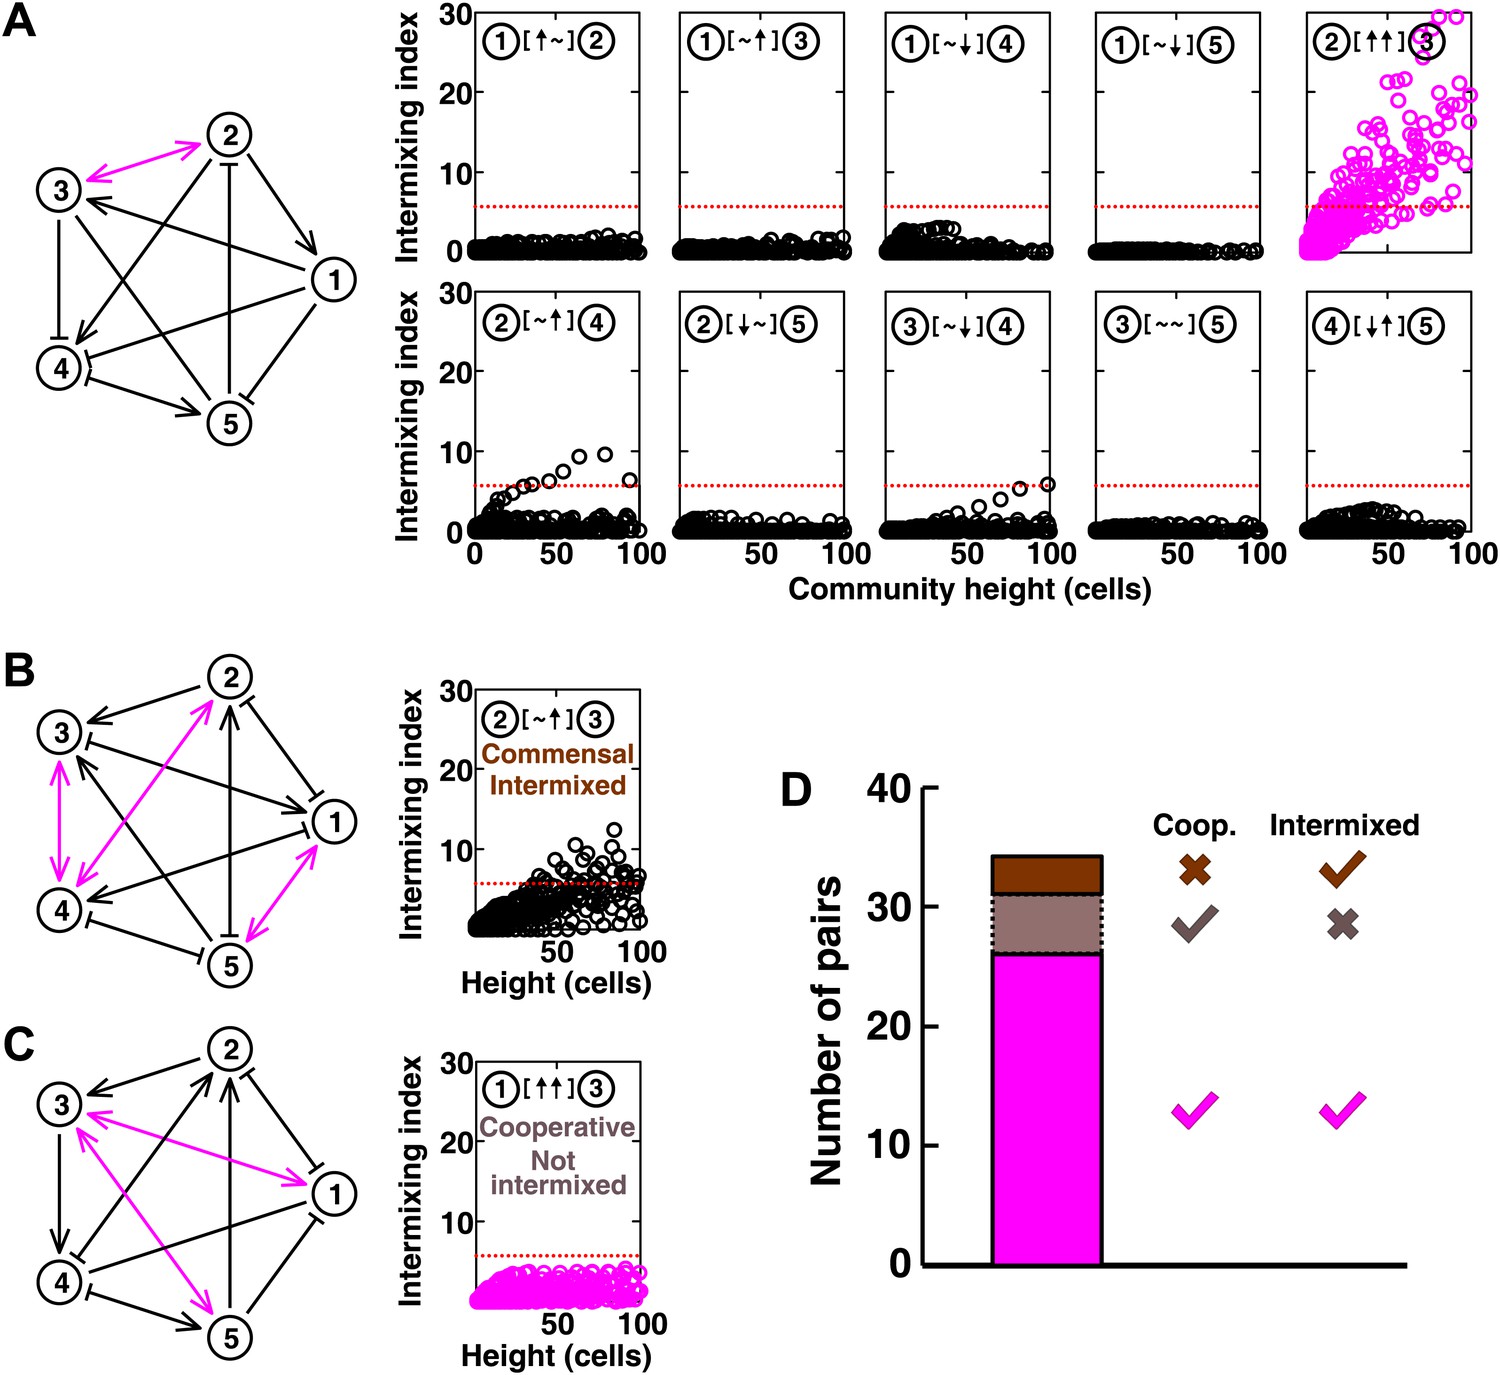
Most of the strongly-cooperative pairs intermixed in simulated five-species communities.
(A-C) Examples of networks in which cooperative pairs intermixed (A), non-cooperative pairs intermixed (B), or cooperative pairs did not intermix (C) are shown. In the schematic network diagrams, line termini of →, ⊣, and — represent ↑, ↓, and ∼, respectively; cooperative pairs are highlighted in magenta. Simulations were performed using the fitness model. The basal fitness for each population was chosen randomly from a range spanning 0.03–0.05/hr. The fitness effect from each partner cell in the interaction neighborhood was either 0 for ∼, or otherwise randomly chosen to be approximately 2–3% of basal fitness to achieve strong interaction. Initial population ratios were randomly assigned such that no population was initially lower than 5% of the total population. Simulations were run for 10 generations, and vertical cross-sections of the final communities were examined for intermixing. We considered intermixing index exceeding a threshold of 6 (Figure 1I) as significant (red dotted lines). The remaining nine panels in Figure 5B and C are provided in Figure 5—figure supplement 1. (D) Quantifying intermixing in a total of 240 interactions from 24 independent communities showed that most of the cooperative pairs intermixed (magenta). Indirect interactions through other community members could make cooperative pairs not intermixed (grey) or non-cooperative (commensal) pairs intermixed (brown).
Figure 5—figure supplement 1
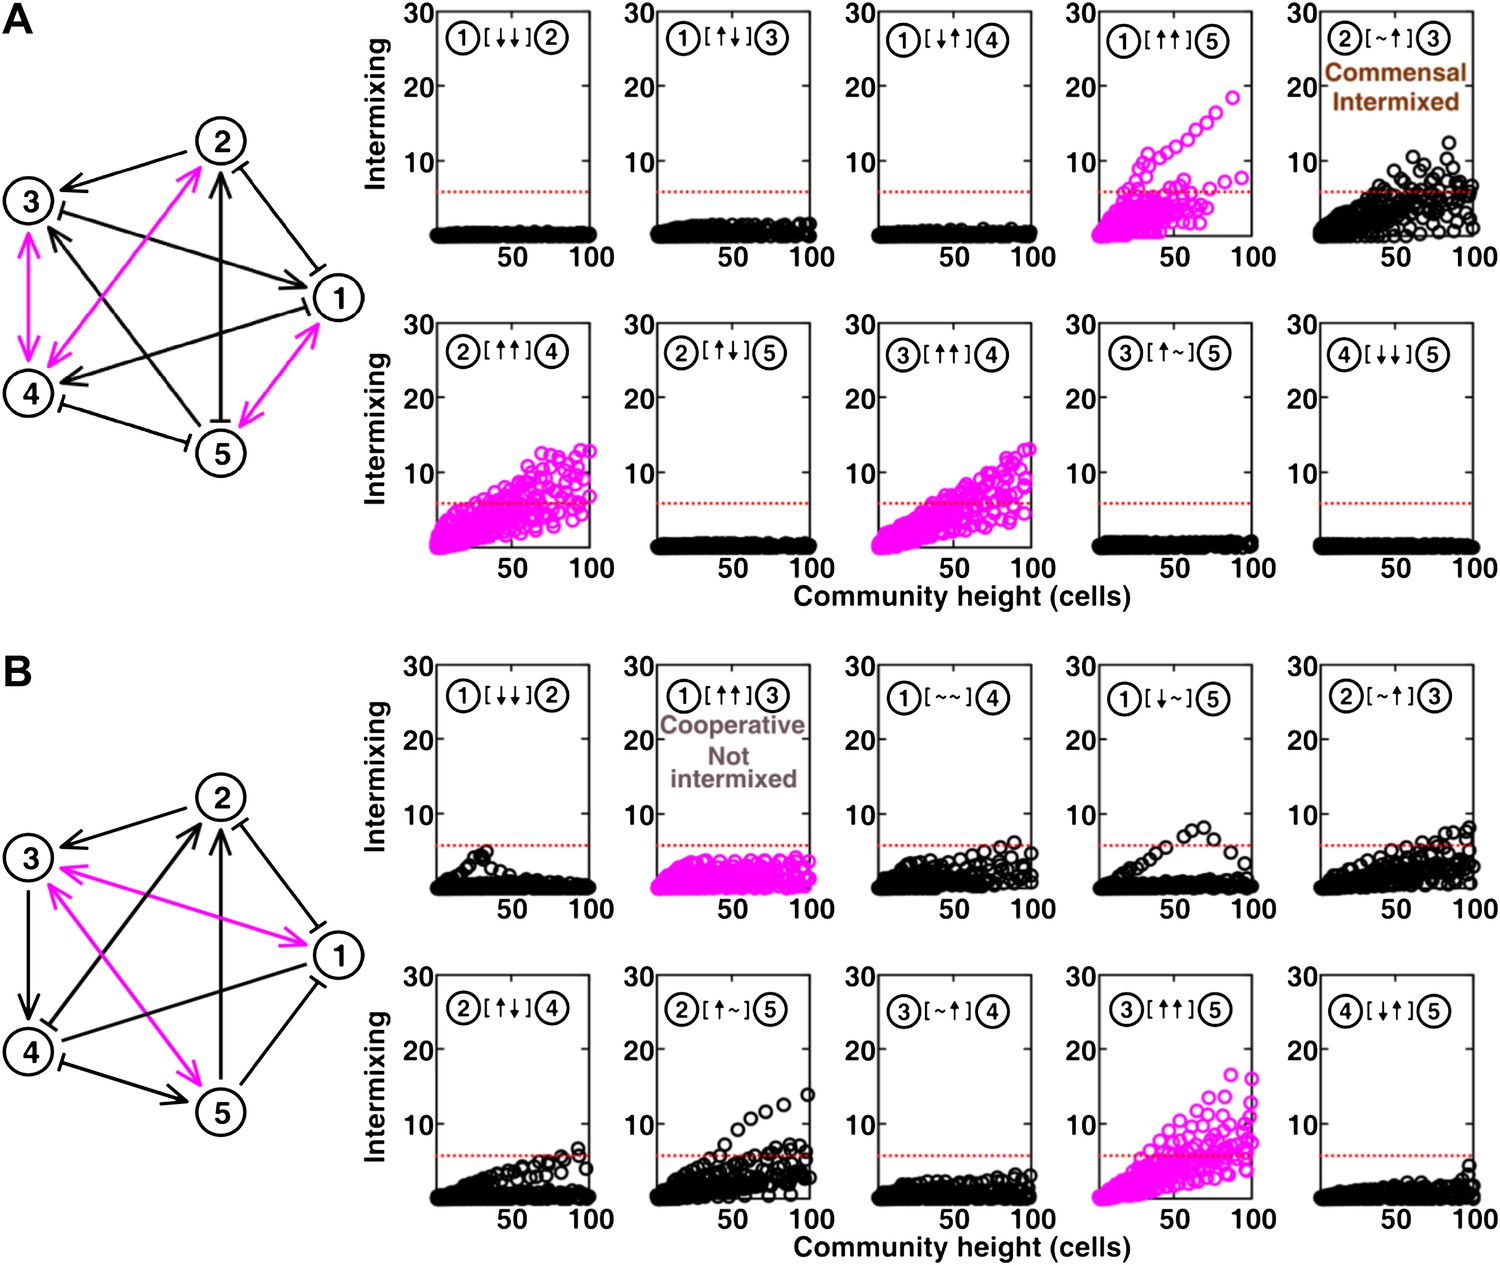
The complete results of Figure 5B and C (panel A and B, respectively).
https://doi.org/10.7554/eLife.00230.024Videos
Video 1
Yeast cells bud to the sides when there is available space and bud upward when sufficiently confined (corresponding to Figure 1—figure supplement 1A). To infer the process of cell rearrangement in three-dimensional communities, we monitored how single YFP-fluorescent yeast cells grew into microcolonies on top of solid agarose. Initially, dividing cells pushed other cells to the side such that all cells remained in the same plane. When a cell was sufficiently confined from the sides by other cells (approximately within a 5-cell radius), it could no longer bud to the side and instead budded upward, as indicated by higher intensities in the fluorescence images. Continued growth of microcolony forced more cells in the middle to send their progeny to upper layers, while cells close to the edge could still push other cells to the side and remain on the agarose surface. All images are taken with the same exposure time. Scale bar is 20 μm.
Video 2
Top views of an equal-fitness competitive community suggest population segregation (corresponding to Figure 2A, left). Competitive communities of strains with equal fitness showed population segregation as suggested by static late-stage top-views. The community started from a uniform distribution of total 500 cells/mm2 and R:G = 1:1. Intensities of both fluorescent channels in images at different times were normalized to the same maximum value for better representation of patterns throughout growth. Blanks in the video were due to removal of the dish to sample other replicate communities for flow-cytometry or sectioning. Scale bar is 100 μm.
Video 3
In unequal-fitness competition, the fitter population gradually covers the less fit population (corresponding to Figure 2A, right). Here, G is fitter than R. The community started from a uniform distribution of total 500 cells/mm2 and R:G = 1:1. Intensities of both fluorescent channels in images at different times were normalized to the same maximum value for better representation of patterns throughout growth. Scale bar is 100 μm.
Video 4
Top views of an obligatory commensal community suggest population layering (corresponding to Figure 2B). For a detailed explanation of the growth kinetics of the community (), please refer to the main text. The community started from a uniform distribution of total 500 cells/mm2 and :. Intensities of both fluorescent channels in images at different times were normalized to the same maximum value for better representation of patterns throughout growth. Blanks in the video were due to removal of the dish to sample other replicate communities for flow-cytometry or sectioning. Scale bar is 100 μm.
Video 5
Top views of an obligatory cooperative community suggest populations intermixing (corresponding to Figure 2C). For a detailed explanation of the growth kinetics of the community (), please refer to the main text. The community started from a uniform distribution of total 500 cells/mm2 and :. Intensities of both fluorescent channels in images at different times were normalized to the same maximum value for better representation of patterns throughout growth. Blanks in the video were due to removal of the dish to sample other replicate communities for flow-cytometry or sectioning. The video started at ∼300 hr, after the formation of microcolonies. Scale bar is 100 μm.
Tables
Table 1
Summary of steady-state occupancy, conditions to achieve steady-state, and the stability of steady-state for six types of ecological interactions.
| Interaction | Steady-state occupancy | Steady-state condition | Stability |
|---|---|---|---|
| G[∼∼]R | Any | Only when | Unstable |
| G[↑ ↑]R | Globally stable | ||
| G[∼↓]R | Unstable | ||
| G[∼↑]R | Globally stable | ||
| G[↓↓]R | Unstable | ||
| G[↓↑]R | Locally stable (when ; see Figure 1—figure supplement 2) |
Additional files
-
Source code 1
MATLAB code for simulating cooperative communities in the fitness model.
Other ecological interactions can be simulated by changing the values of the interaction parameters r12 and r21.
- https://doi.org/10.7554/eLife.00230.026
-
Source code 2
MATLAB code for simulating cooperative communities in the diffusion model.
In this version, the diffusion constant inside the community is assumed to be similar to the diffusion constant of agarose (Figure 2—figure supplement 2A).
- https://doi.org/10.7554/eLife.00230.027
-
Source code 3
MATLAB code for simulating competitive communities in the diffusion model.
In this version, the diffusion constant inside the community is assumed to be smaller than the diffusion constant of agarose (Figure 2—figure supplement 2B).
- https://doi.org/10.7554/eLife.00230.028
-
Source code 4
MATLAB function for in-plane rearrangement of cells in both the fitness and the diffusion models.
- https://doi.org/10.7554/eLife.00230.029
Download links
A two-part list of links to download the article, or parts of the article, in various formats.
Downloads (link to download the article as PDF)
Open citations (links to open the citations from this article in various online reference manager services)
Cite this article (links to download the citations from this article in formats compatible with various reference manager tools)
Strong inter-population cooperation leads to partner intermixing in microbial communities
eLife 2:e00230.
https://doi.org/10.7554/eLife.00230


