Selection of distinct populations of dentate granule cells in response to inputs as a mechanism for pattern separation in mice
- The Salk Institute for Biological Studies, United States
- The Scripps Research Institute, United States
Figures
Figure 1 with 3 supplements
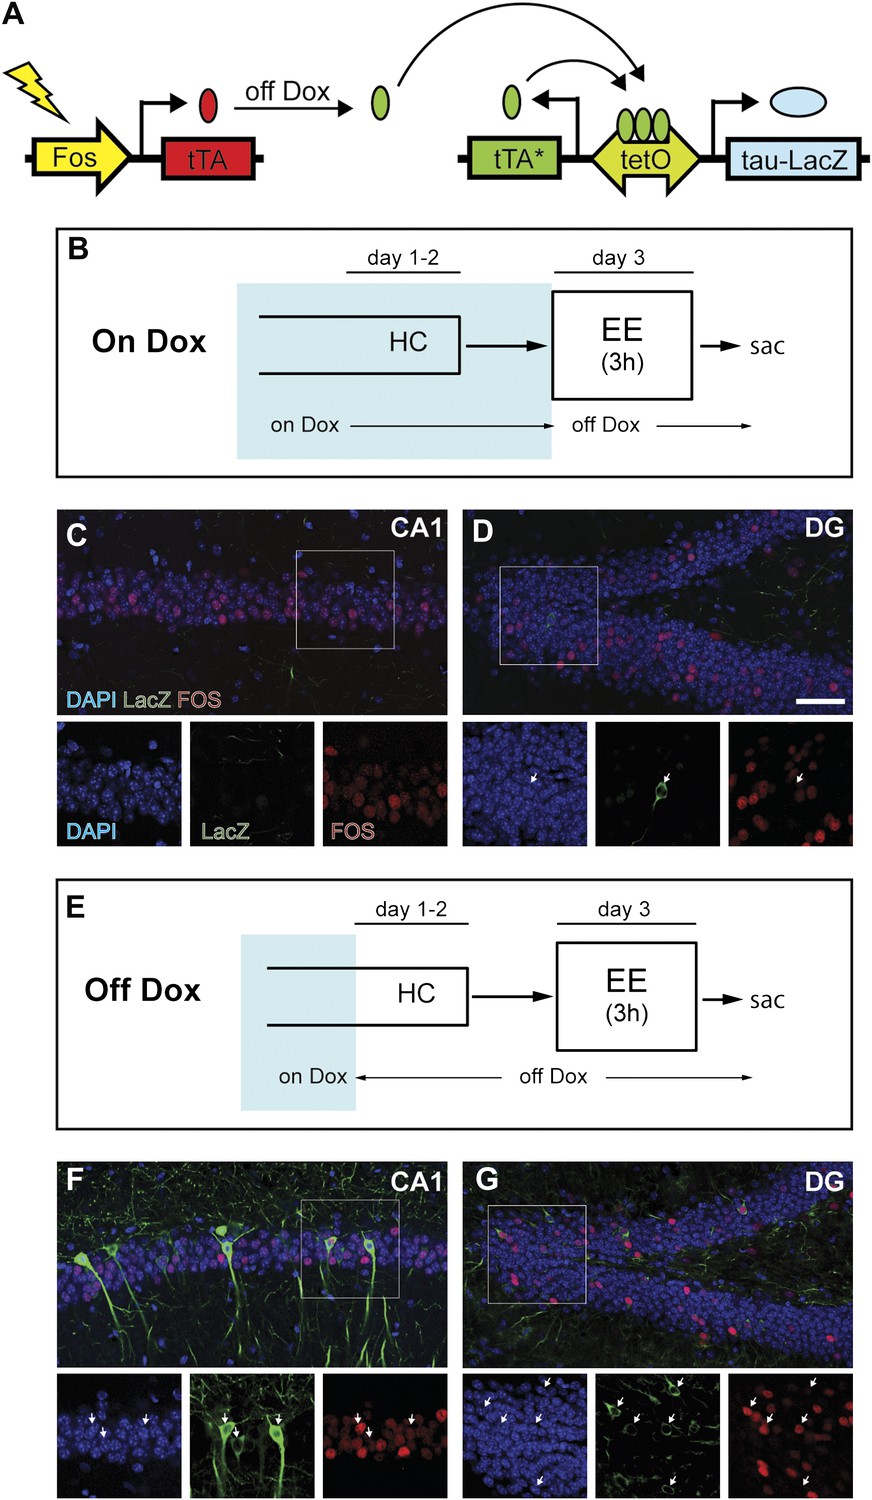
Induction of tag (tau-LacZ) expression by removing dox treatment.
(A) A brief cartoon illustrating the TetTag transgenic system. (B) and (E) Experimental designs. Dox treatment is illustrated by blue shading. (C) and (D) There are few neurons in either CA1 (C) or the DG (D) (outlined by DAPI [blue]) expressing LacZ marker (green) if mice are kept on a dox diet until enriched environment (EE) exposure. Samples are also stained with FOS (red). Each channel in the inset (outlined by the square) is presented below the corresponding overall image, with arrows indicating the LacZ-positive neurons. (F) and (G) In mice that were removed from dox treatment 2 days before EE exposure, many LacZ-positive neurons can be observed in both CA1 (F) and the DG (G). In both subregions, many tagged neurons are also co-stained with FOS. The scale bar in (D) represents 50 μm for (C, D, F, and G).
Figure 1—figure supplement 1
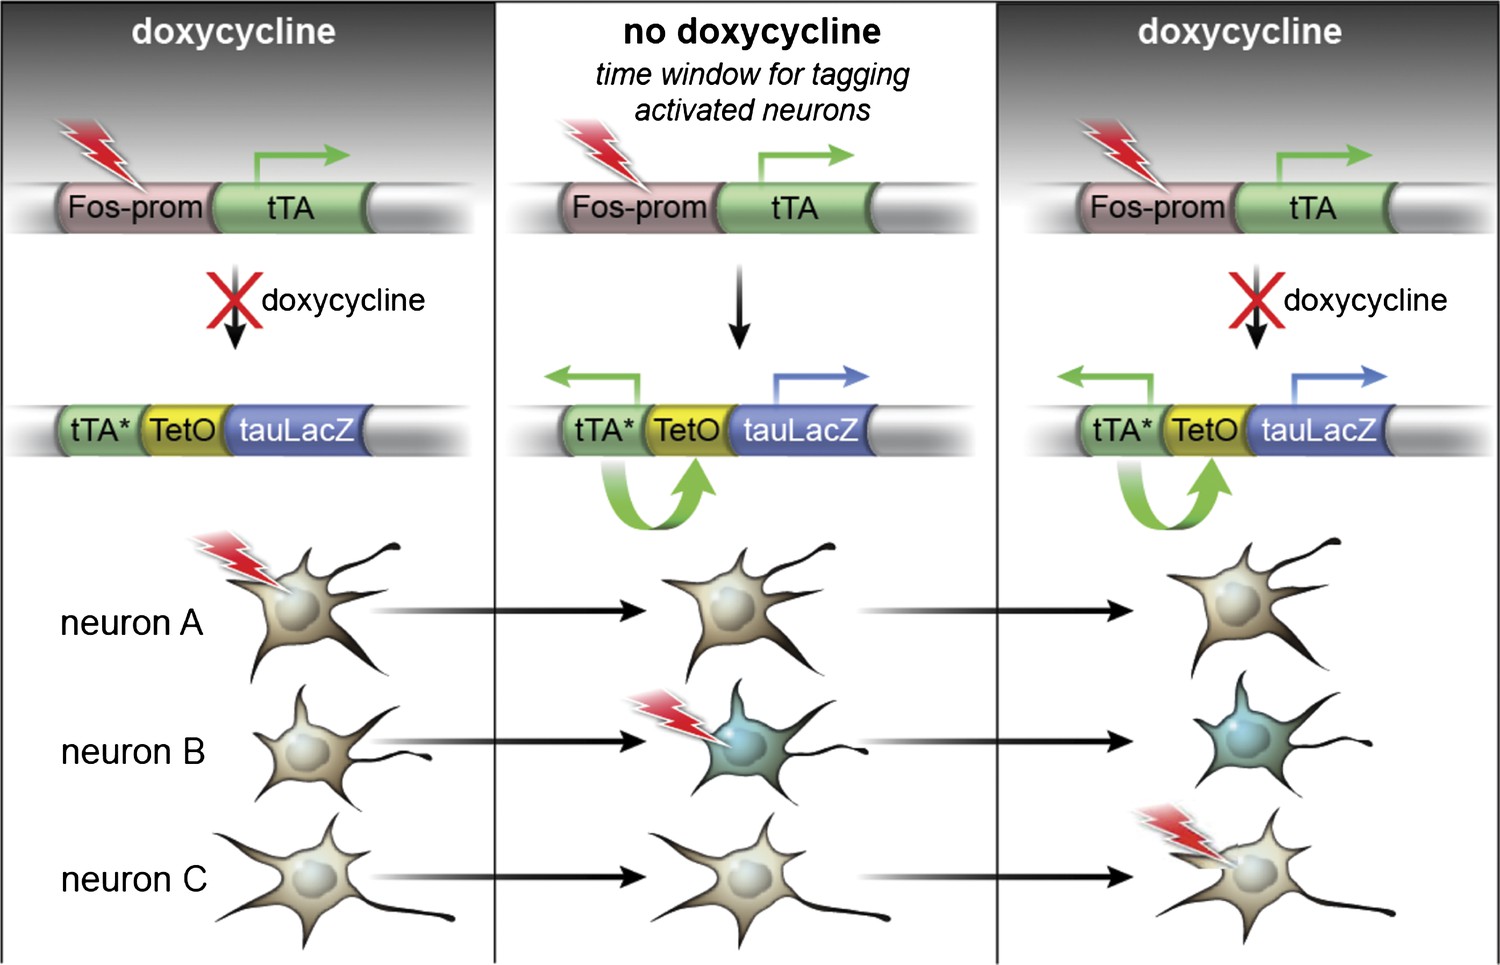
The TetTag system.
The TetTag transgenic mice contain two transgenes: one transgene expresses tTA by Fos promoter and the other transgene expresses dox-insensitive tTA* and tau-LacZ downstream of the tetO promoter. Neuronal activity can trigger activation of Fos promoter and lead to the expression of tTA, the transactivator of the tetO promoter. In the presence of dox (left panel), tTA cannot induce the expression of either tau-lacZ or tTA* (mutated tTA i.e. insensitive to dox) (see Neuron A as an example). When mice were removed from the dox diet (middle panel), tTA, whose expression is induced by neuronal activity, can bind to the tetO promoter to activate the expression of the tau-lacZ marker gene and tTA*. tTA* and tetO form a transcription feedback loop that can sustain the expression of tau-lacZ even after mice are put back on dox treatment (see Neuron B). Putting mice on dox food will close the time window to mark the activated neurons with tau-lacZ (Neuron C). (This Figure is adapted from Figure 1A in Reijmers et al., 2007).
Figure 1—figure supplement 2
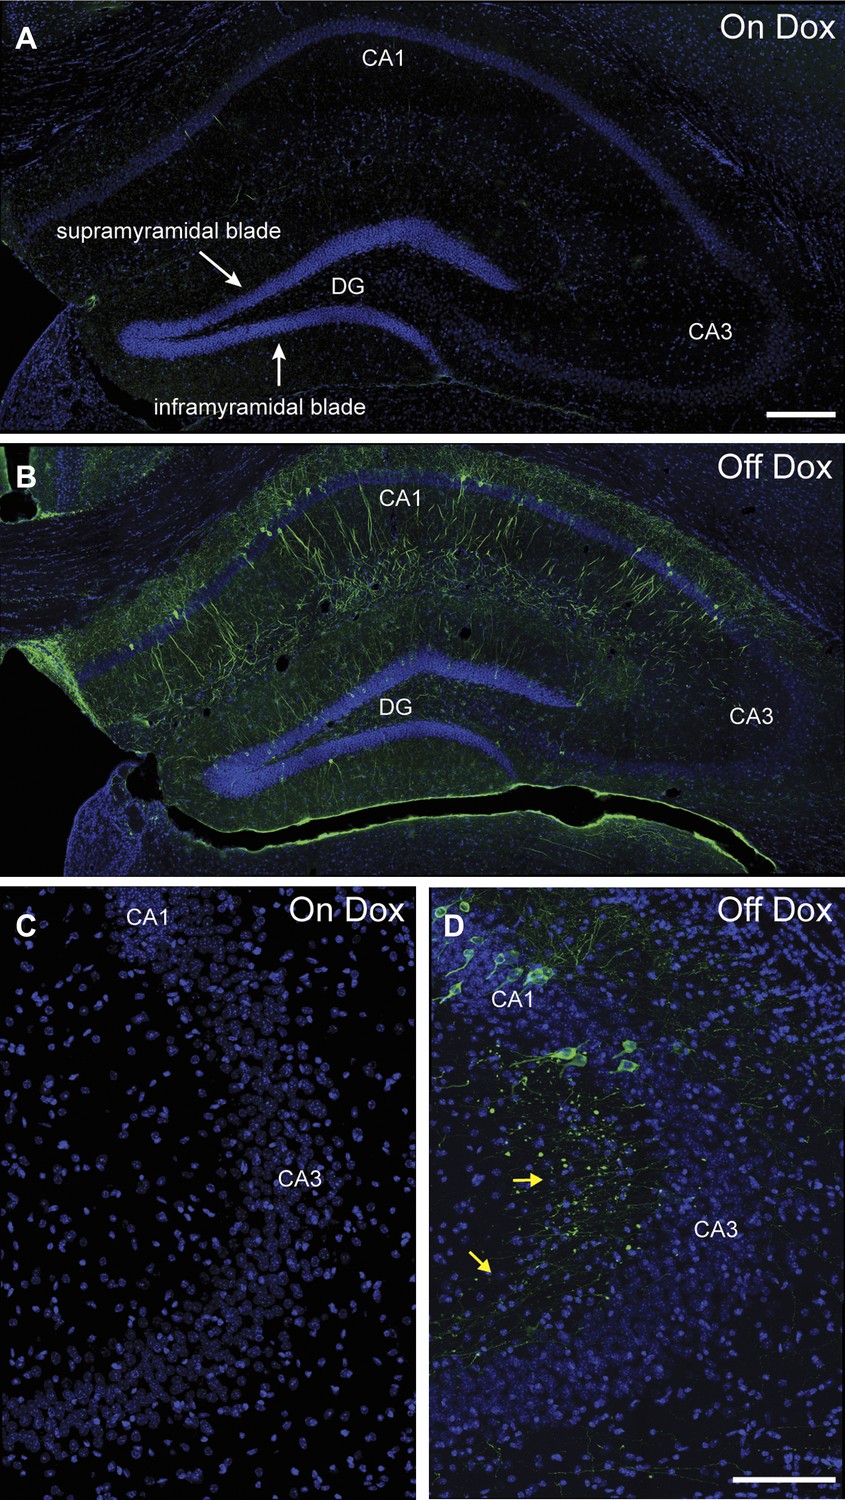
Induction of tau-LacZ expression in the hippocampus by removing mice from dox treatment.
(A) Very few neurons in the hippocampus are labeled by tau-LacZ (green) in mice maintained on dox diet. DAPI (blue) staining is used to show the anatomy of the hippocampus. The suprapyramidal blade and the infrapyramidal blade of the DG are labeled. (B) Removing mice from dox treatment effectively induces tau-LacZ expression in the DG and CA1 but not CA3 of the hippocampus. (C) and (D) Confocal images showing that few CA3 neurons are labeled by LacZ marker under either on Dox or off Dox conditions. The yellow arrows in (D) point to the LacZ-labeled mossy fibers, the axons of DGCs projecting to CA3. The scale bar in (A) denotes 200 μm for panels (A, B). The scale bar in (D) denotes 100 μm for panels (C, D).
Figure 1—figure supplement 3
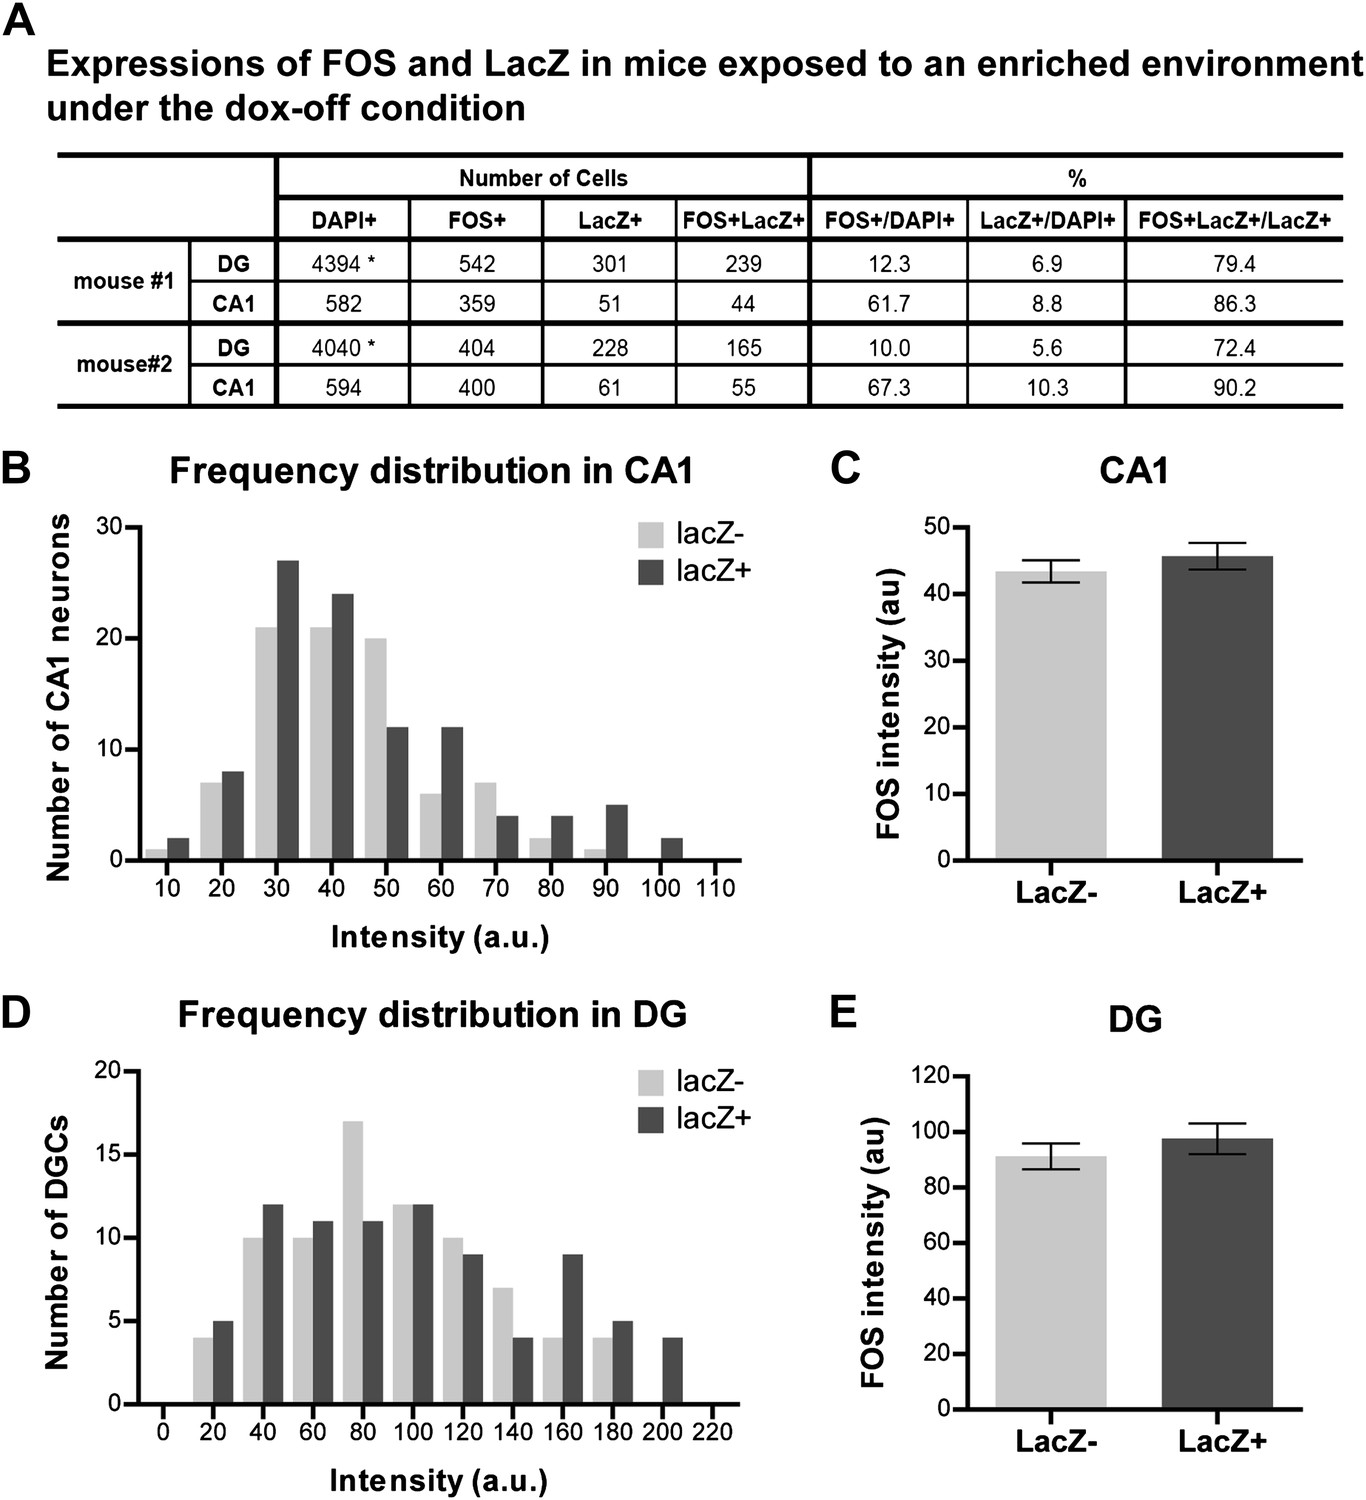
Quantification of activities and FOS intensity in mice exposed to an enriched environment during the dox-off window.
(A) Quantification the numbers of FOS-positive, LacZ-positive and FOS+LacZ double positive cells in CA1 and the DG. Asterisk indicates the numbers of DAPI-positive cells in the DG are estimated values (see 'Materials and methods'). (B) and (C) The intensity of FOS staining between LacZ-positive and LacZ-negative cells is not significantly different in CA1 (B: frequency distribution; C: t184 = 0.864, p>0.38). (D) and (E) The intensity of FOS staining between LacZ-positive and LacZ-negative cells is not significantly different in the DG (D: frequency distribution, E: t158 = 0.873, p>0.38).
Figure 2 with 1 supplement
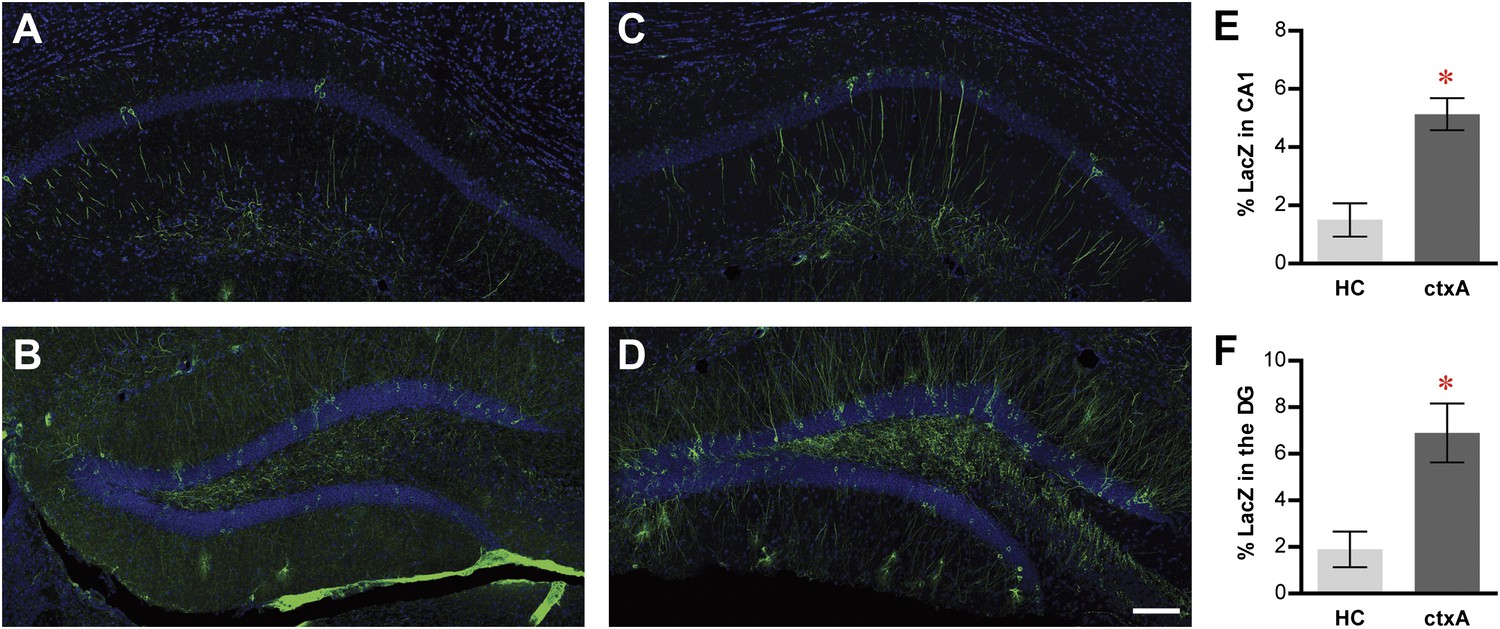
Activity-dependent induction of tag (tau-LacZ) expression.
(A) and (B) The expressions of LacZ marker (green) in CA1 (A) and DG (B) of the mice in the home cage (HC) group. The overall anatomies are highlighted by the DAPI staining (blue). (C) and (D) The expressions of LacZ marker in CA1 (C) and the DG (D) of the mice in the context A (ctxA) group. (E) and (F) Quantification demonstrates that the numbers of LacZ-positive neurons are significantly higher in the ctxA group compared to the HC group in both CA1 (E) and the DG (F). The scale bar in (D) represents 100 μm for panels (A–D). Asterisk indicates statistically significant difference between groups. Data are shown as mean ± SEM.
Figure 2—figure supplement 1
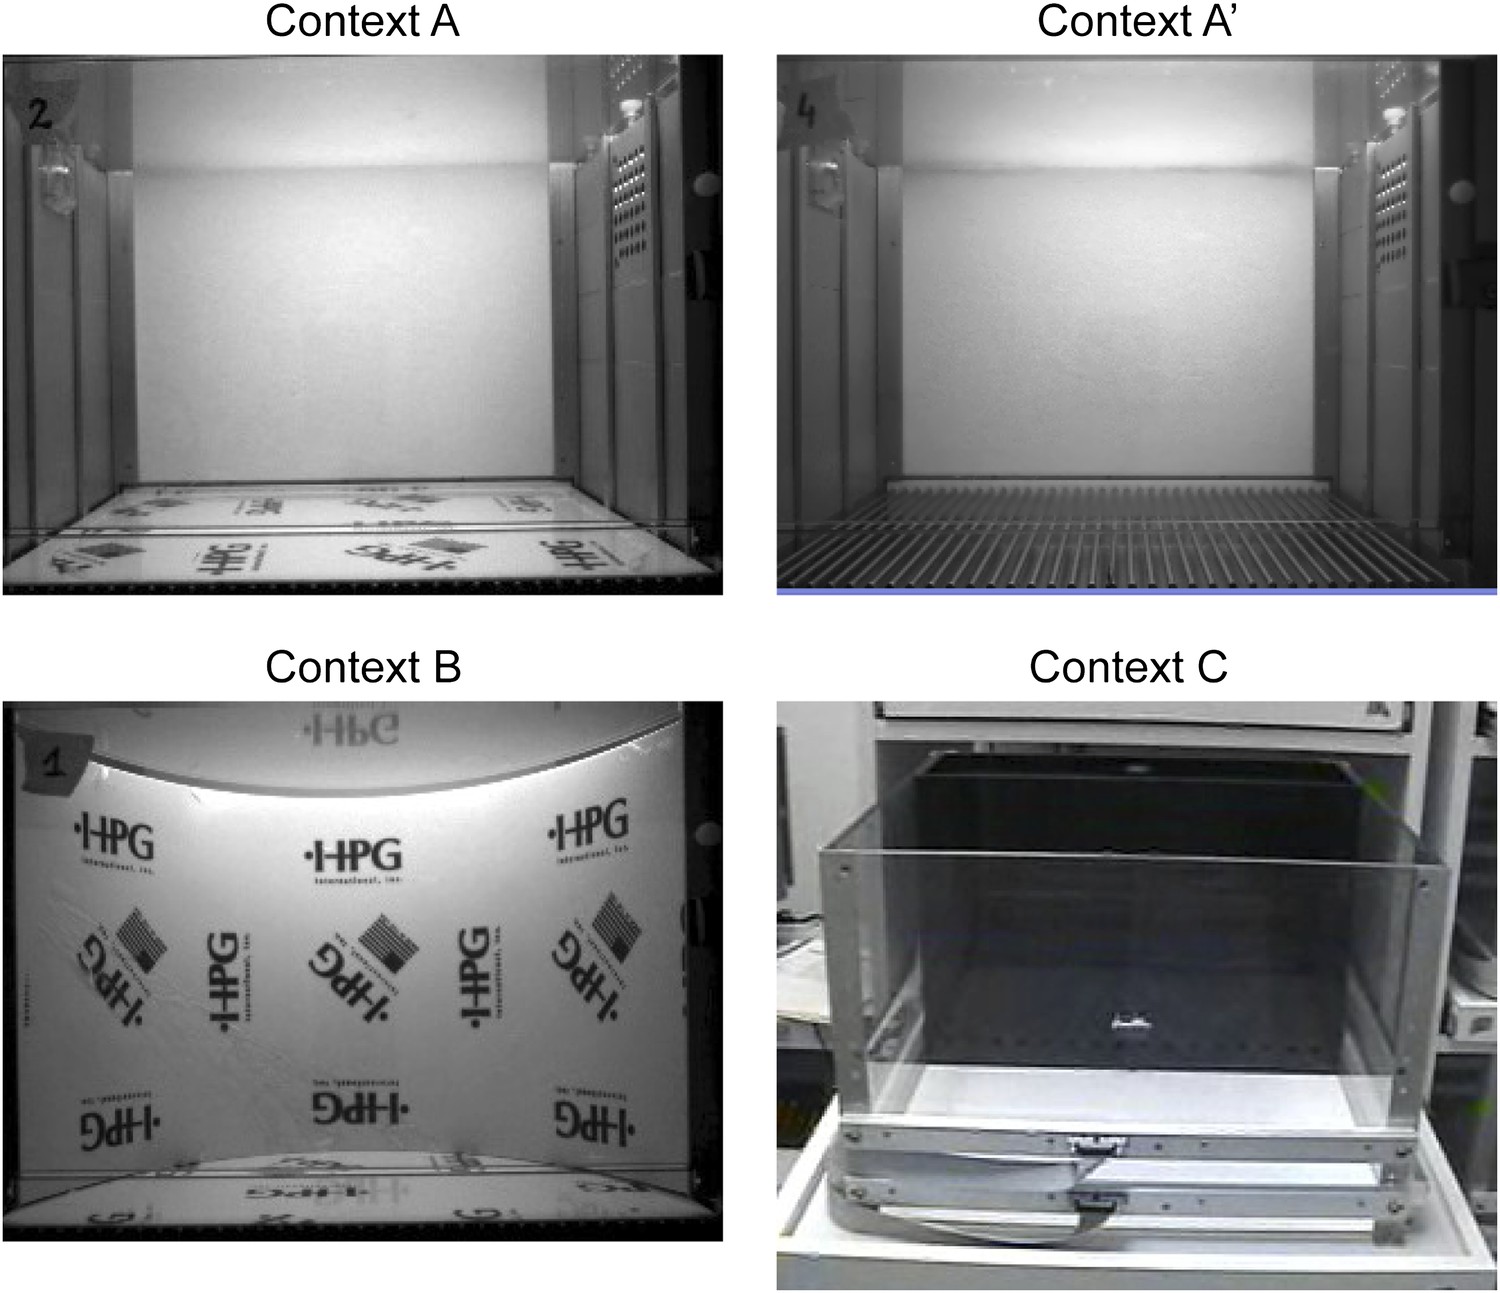
Contexts used for contextual fear conditioning.
Context A' and B are modified from context A. Context C is completely different from context A and is located in another test room.
Figure 3 with 2 supplements
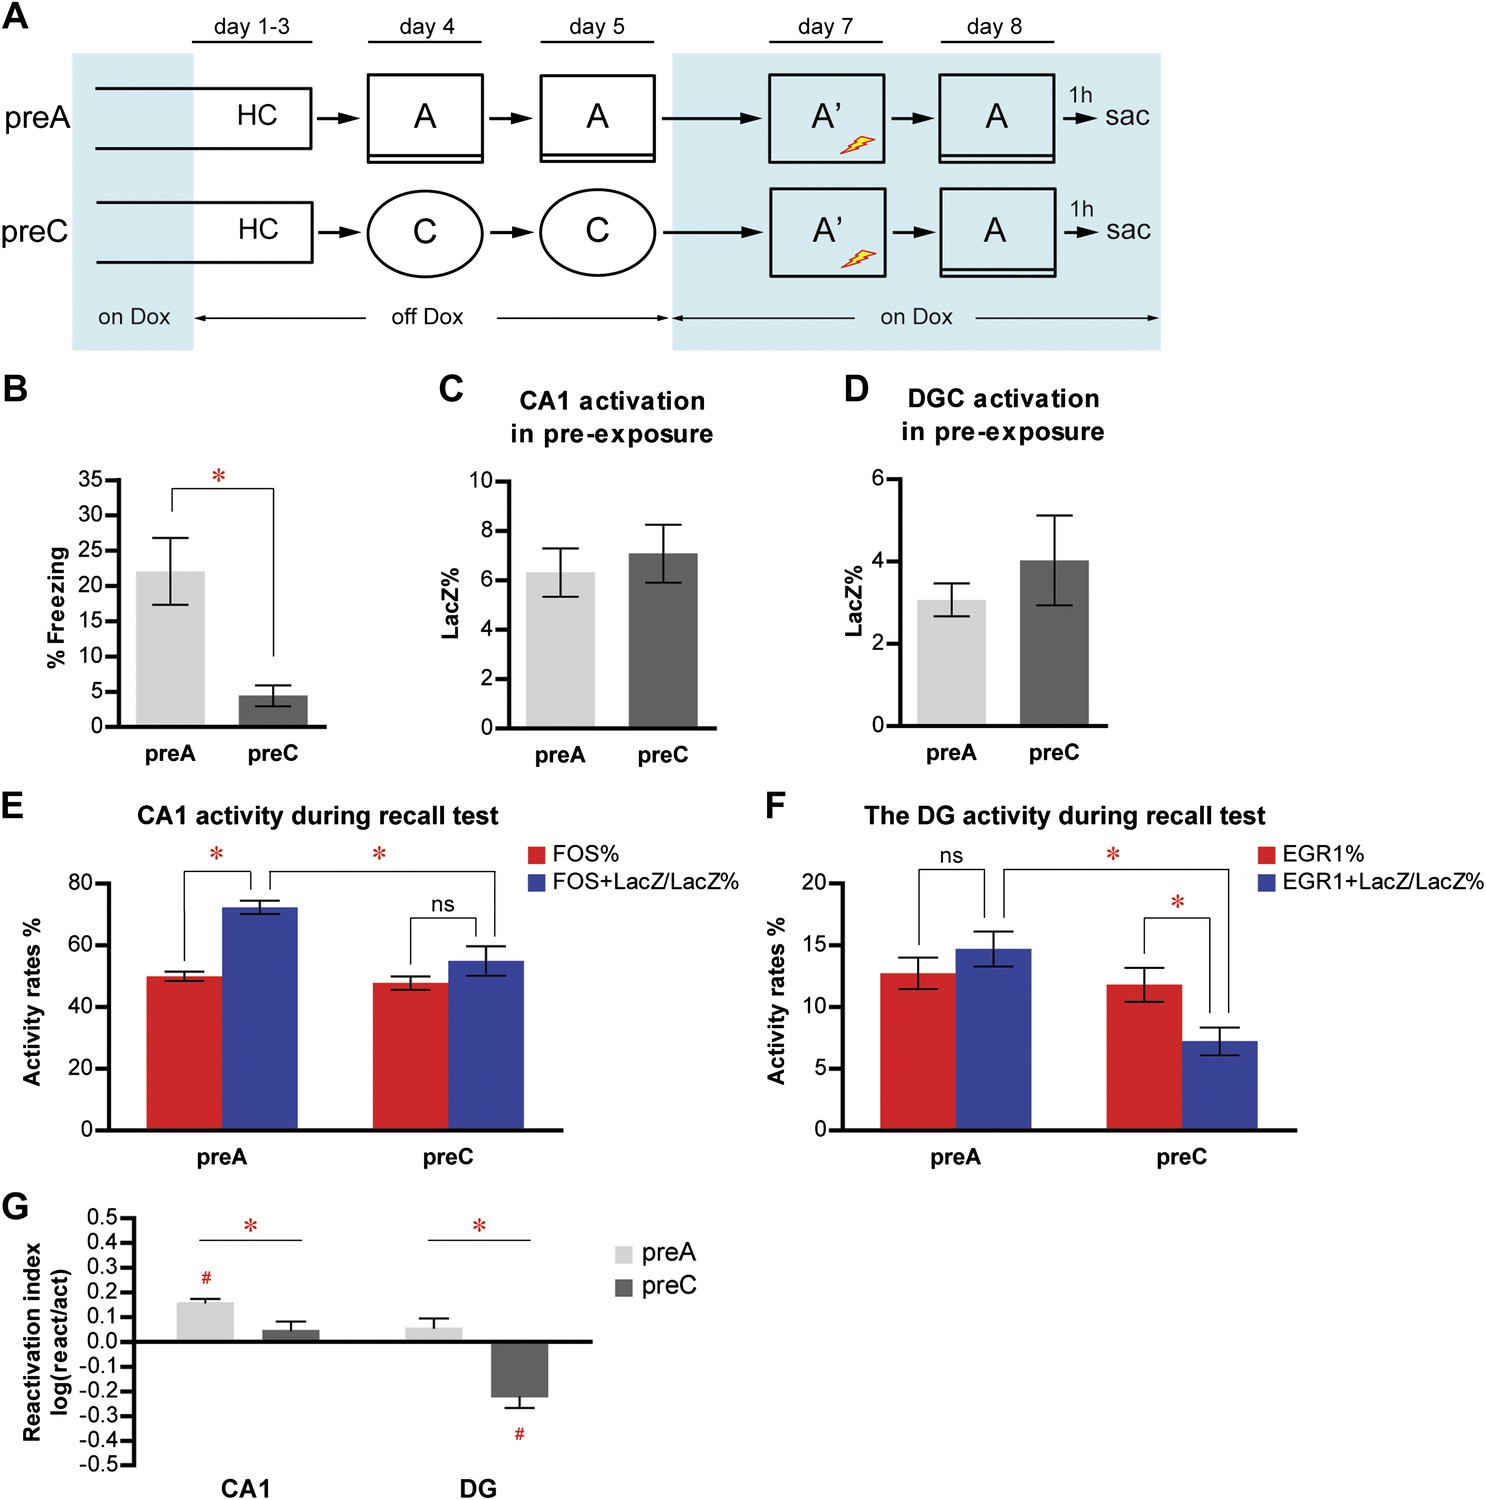
Memory recall preferentially reactivates the neuron population in response to learning in CA1 but not in the DG.
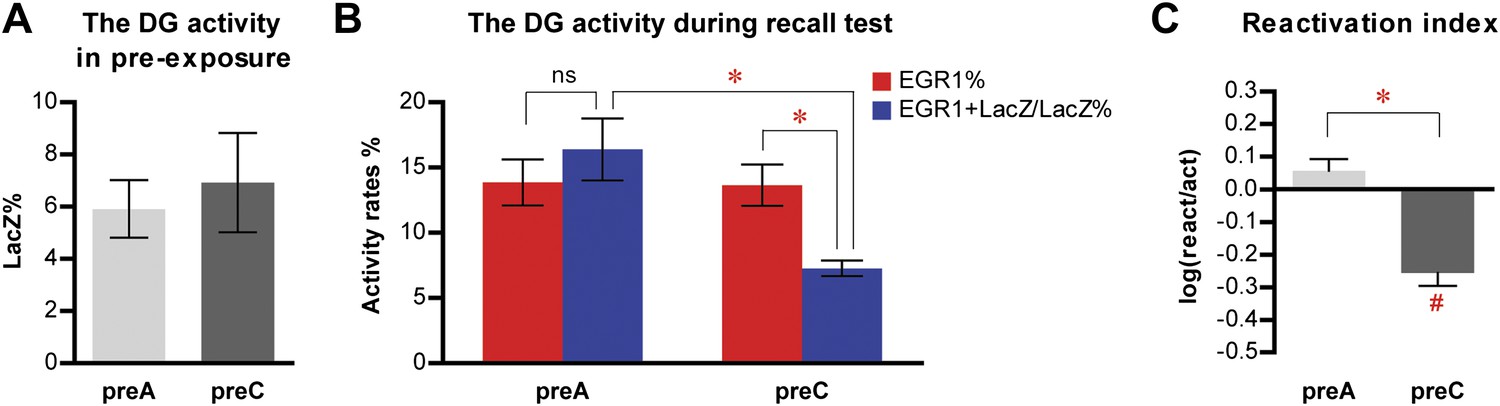
(A) The pre-exposure-immediate shock paradigm for contextual fear conditioning. Dox treatment is illustrated by blue shading. Contextual learning mainly takes place during pre-exposure in the absence of dox treatment. LacZ and IEGs (FOS or EGR1) are regarded as indicators of learning-induced activity and retrieval-induced activity, respectively. Dox treatment is illustrated by blue shading. (B) preA mice display significantly more freezing behavior than preC mice. (C) and (D) During pre-exposure, the proportions of LacZ-positive neurons in either CA1 (C) or the DG (D) are not significantly different between preA and preC mice. (E) During the retrieval test, preferential reactivation of the LacZ-positive population in CA1 is revealed by quantifying the percentage of FOS-positive neurons in the total population (activation rate) and the percentage of LacZ-FOS double-positive cells in the LacZ-positive population (reactivation rate). (F) There is no preferential reactivation of LacZ-positive DGCs in preA mice, whereas LacZ-positive DGCs are significantly less likely to be reactivated in preC mice compared to preA mice. The reactivation rate is not significantly different from the activation rate in preA mice but is significantly lower than the activation rate in preC mice. (G) Reactivation indexes suggesting the differential reactivations of learning-induced neuronal ensembles by recall in CA1 and the DG (ANOVA: region x group interaction, F1,1 = 5.016, p<0.037; main region effect, F1,21 = 24.49, p<0.0001; main group effect, F1,21 = 50.10, p<0.0001). Asterisk indicates statistically significant difference between groups. Hash indicates statistically significant difference from chance. Data are shown as mean ± SEM (ns: no significant difference; HC: home cage; sac: sacrifice).
Figure 3—figure supplement 1
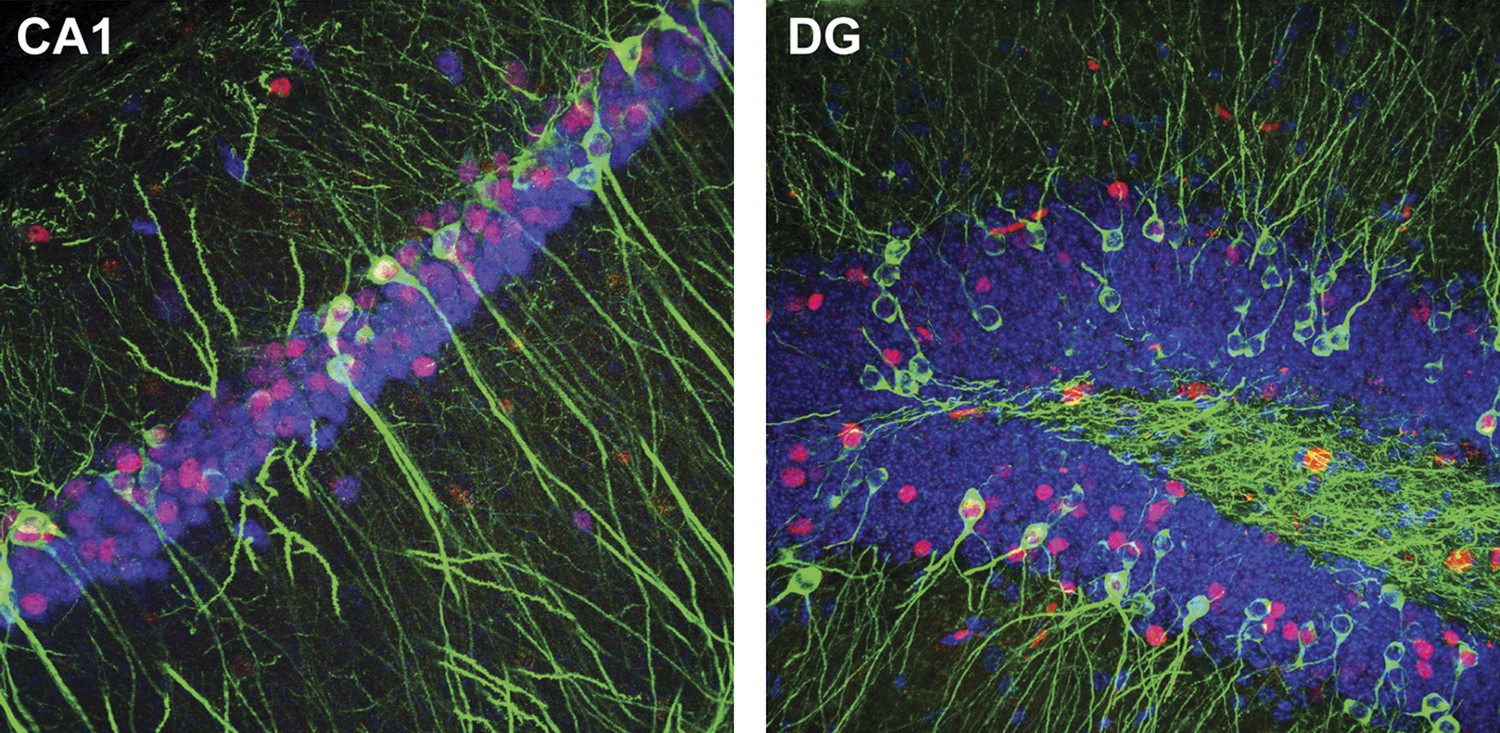
Representative confocal images illustrating the expression of IEGs and LacZ in CA1 (tau-LacZ in green, FOS in red, RBFOX3 in blue) and the DG (tau-LacZ in green, EGR1 in red, DAPI in blue).
https://doi.org/10.7554/eLife.00312.010
Figure 3—figure supplement 2
Quantification of the entire z-series of confocal images in the DG for the contextual fear conditioning experiment 1.
(A) The level of LacZ induction by pre-exposure is not significantly different between preA and preC mice (t21 = 0.4071, p>0.64). (B) During the recall test, there is no preferential reactivation of LacZ-positive DGCs in preA mice, whereas LacZ-positive DGCs are significantly less likely to be reactivated in preC mice (ANOVA: group x activity rates interaction, F1,1 = 22.40, p<0.0001; almost significant main effect of activity rates, F1,21 = 4.201, p=0.053; almost significant main effect of group, F1,21 = 4.183, p=0.053). The reactivation rate is not significantly different from the activation rate in preA mice but is significantly lower than the activation rate in preC mice (Bonferroni post hoc test, activation rate vs reactivation rate, p>0.05 for preA and p<0.001 for preC). In addition, the reactivation rate (EGR1+LacZ/LacZ%), but not the activation rate (EGR1%), in preC mice is significantly lower than that in preA mice (Bonferroni post hoc test, preA vs preC, p<0.01 for reactivation rates and p>0.05 for activation rates). (C) The reactivation index is significantly higher in preA mice compared to the preC group (t-test, t21 = 4.277, p<0.0001). Moreover, the reactivation index is not significantly different from chance in preA mice but is significantly below chance in preC mice (one sample t-test, chance = 0: preA, t11 = 1.582, p>0.14; preC, t10 = 6.316, p<0.0001).
Figure 4
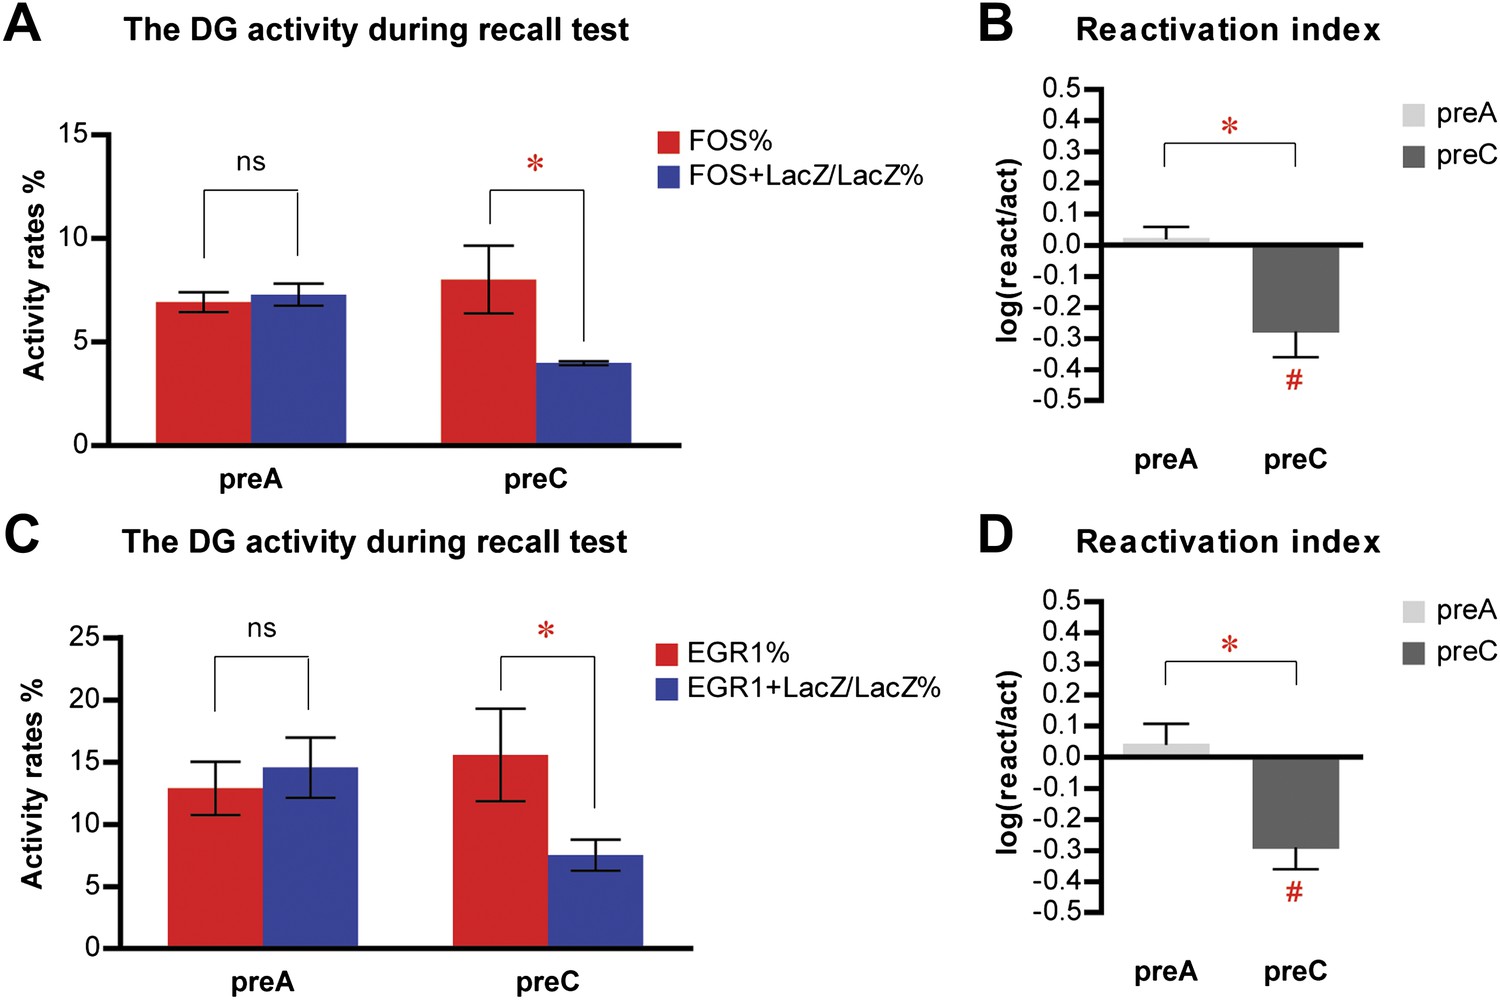
Similar results are obtained in the activity analysis of DGCs using either FOS or EGR1 as IEG markers in the same cohort of mice.
(A) Activity analysis using FOS as IEG marker and RBFOX3 as neuronal marker demonstrates the selection of different populations of DGCs to represent different environmental inputs (ANOVA: group x activity rate interaction, F1,1 = 9.038, p<0.017; Bonferroni post hoc test, reactivation rate vs activation rate, p>0.05 for preA mice, p<0.05 for preC mice; preA, n = 6; preC, n = 4). (B) Reactivation index calculated from the analysis using FOS as IEG marker. The index in preC is significantly smaller than preA (t-test, t8 = 3.911, p<0.0045) and the chance level (one sample t-test, chance = 0, t3 = 3.558, p<0.038), whereas the index in preA is not different from chance (one sample t-test, chance = 0, t5 = 0.6153, p>0.56). (C) Activity analysis using EGR1 as IEG marker in the same cohort of mice has similar activity pattern as those analyzed by FOS (ANOVA: group x activity rate interaction, F1,1 = 7.405, p<0.026; Bonferroni post hoc test, reactivation rate vs activation rate, p>0.05 for preA mice, p<0.05 for preC mice). The numbers of DGCs in the granule cell layers were quantified from DAPI images. (D) Reactivation index calculated from the analysis using EGR1 as IEG marker. The index in preC is significantly smaller than preA (t-test, t8 = 3.519, p<0.0079) and the chance level (one sample t-test, chance = 0, t3 = 4.403, p<0.022), whereas the index in preA is not different from chance (one sample t-test, chance = 0, t5 = 0.6815, p>0.52). Asterisk indicates statistically significant difference between groups. Hash indicates statistically significant difference from chance. Data are shown in mean ± SEM.
Figure 5
Neither home cage activity nor emotional value of context has a significant impact on reactivation patterns in CA1 and DG.
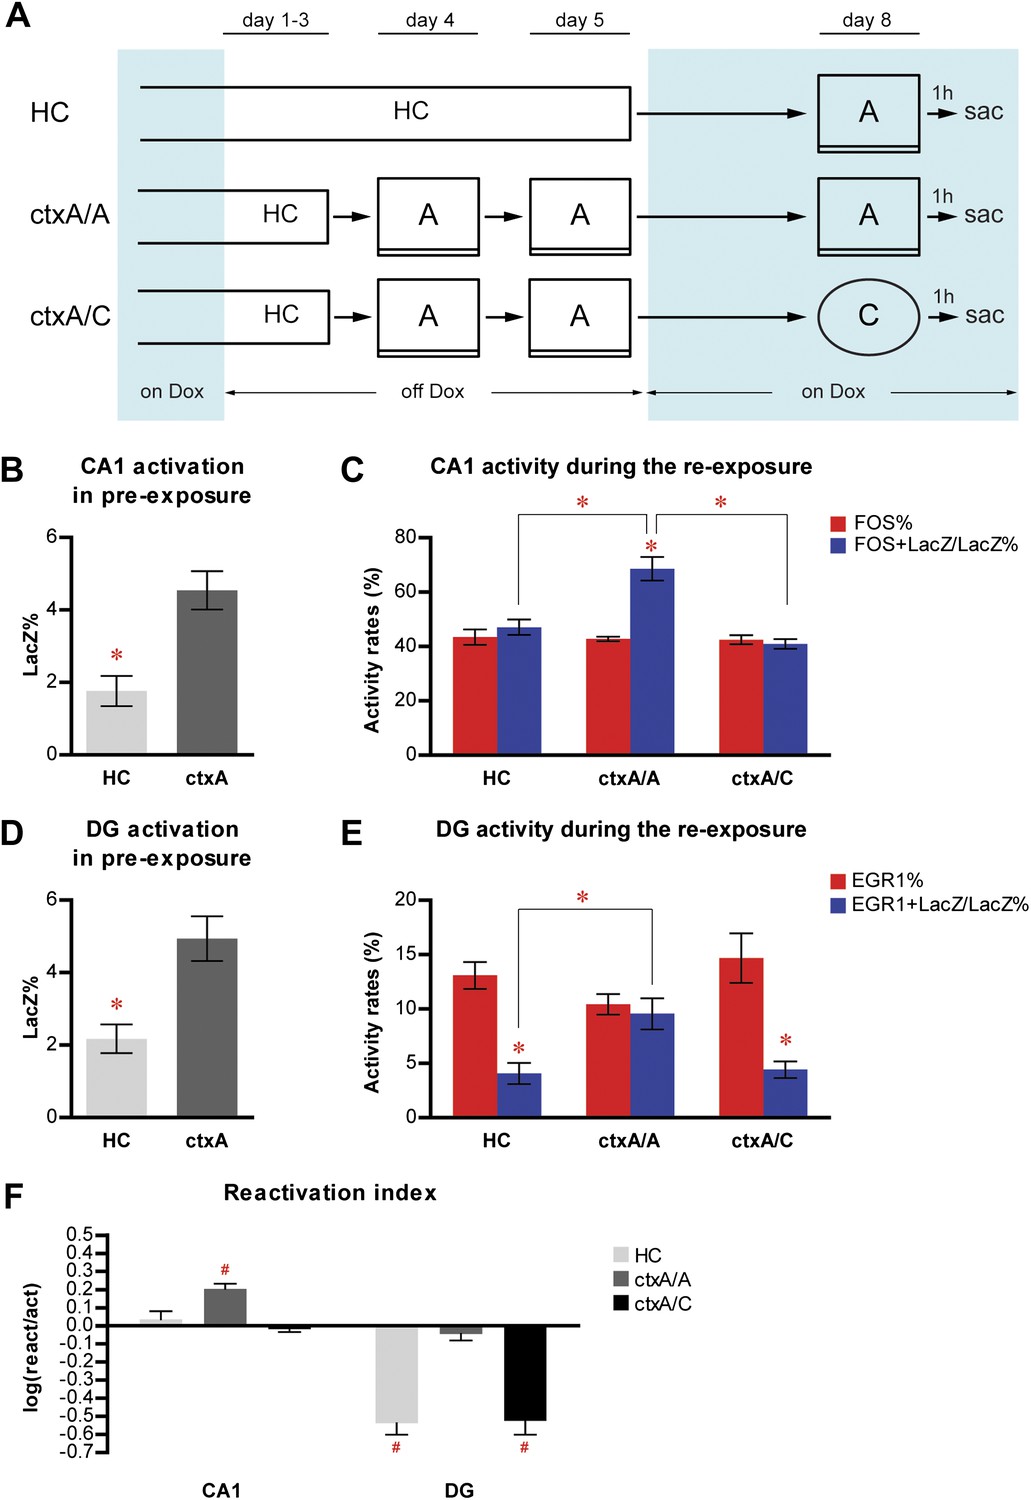
(A) The experimental design. Dox treatment is illustrated by blue shading. (B) HC mice have a significantly lower number of LacZ-positive cells in CA1 compared to ctxA mice. (C) Preferential reactivation of CA1 neurons responding to pre-exposure by re-exposure occurs only in ctxA/A mice but not HC or ctxA/C mice. (D) HC mice have a significantly lower number of LacZ-positive cells in the DG compared to ctxA mice. (E) In HC and ctxA/C mice but not ctxA/A, the reactivation rate is significantly lower than the corresponding activation rate in the DG, suggesting different populations of DGCs are selected in response to distinct experiences (F) reactivation indexes analysis. Asterisk indicates statistically significant difference between groups or rates. Hash indicates statistically significant difference from chance. Data are shown as mean ± SEM (HC: home cage; sac: sacrifice).
Figure 6
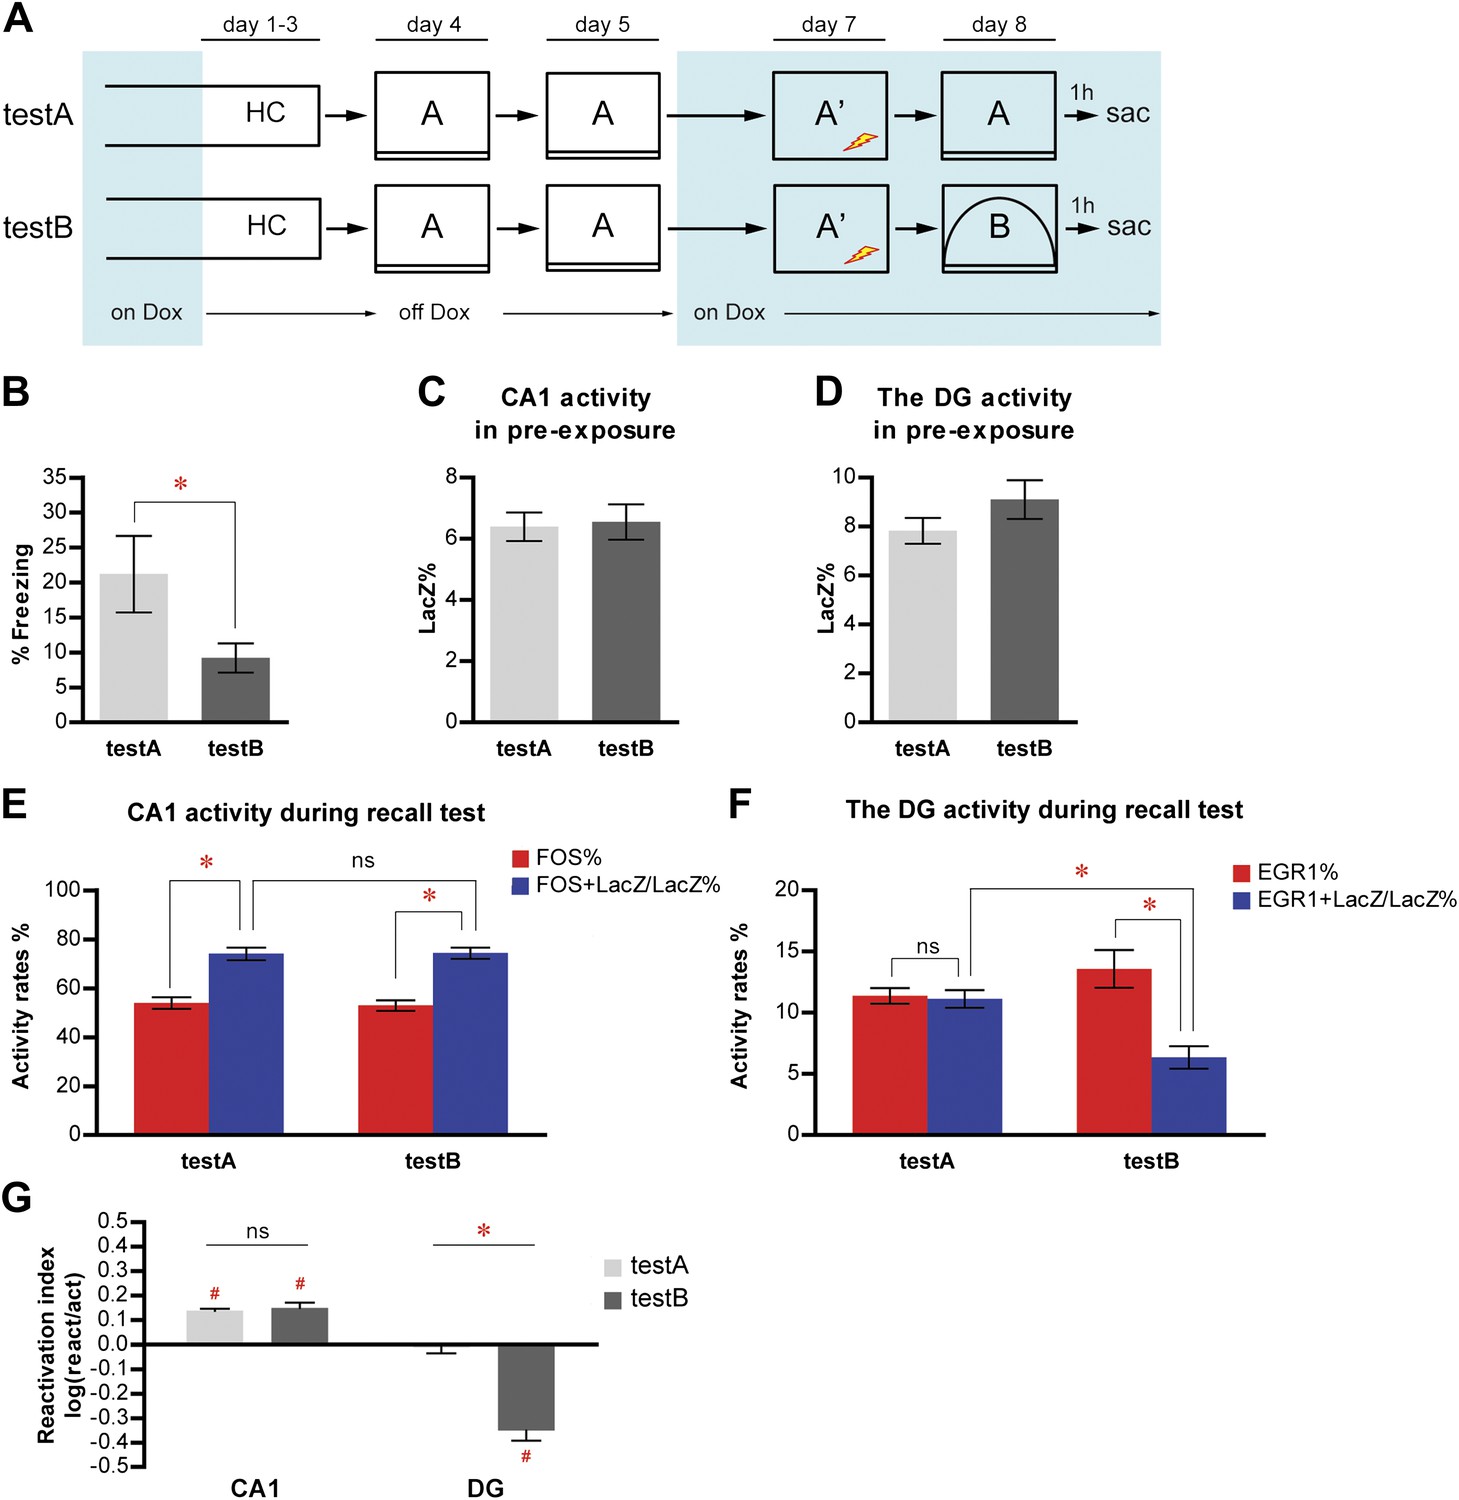
Population activities in the DG but not CA1 are sensitive to small changes in environmental inputs.
(A) Mice subjected to the pre-exposure-immediate shock paradigm in context A were tested for memory retrieval in either context A (testA) or context B (testB), which was modified from context A. Dox treatment is illustrated by blue shading. (B) testA mice display significantly more freezing behavior than testB mice. (C) and (D) During pre-exposure, the percentage of LacZ-positive neurons in total population is not significantly different between testA and testB mice in either CA1 (C) or the DG (D). (E) Activity of CA1 neurons during retrieval test. While neither activation rates nor reactivation rates are significantly different between groups, reactivation rates are significantly higher than the activation rates in both testA and testB mice. (F) During the retrieval test, there is no preferential reactivation of LacZ-positive DGCs in testA mice, whereas LacZ-positive DGCs are significantly less likely to be reactivated in testB mice compared to testA mice. The reactivation rate is significantly lower than the corresponding activation rate in testB mice but not in testA mice. (G) Reactivation indexes suggesting the differential reactivations of learning-induced neuronal ensembles by recall in CA1 and the DG (ANOVA: region x group interaction, F1,1 = 62.98, p<0.0001; main region effect, F1,19 = 215.4, p<0.0001; main group effect, F1,19 = 25.45, p<0.0001). Asterisk indicates statistically significant difference between groups. Hash indicates statistically significant different from chance. Data are shown as mean ± SEM (ns: no significant difference; HC: home cage; sac: sacrifice).
Figure 7
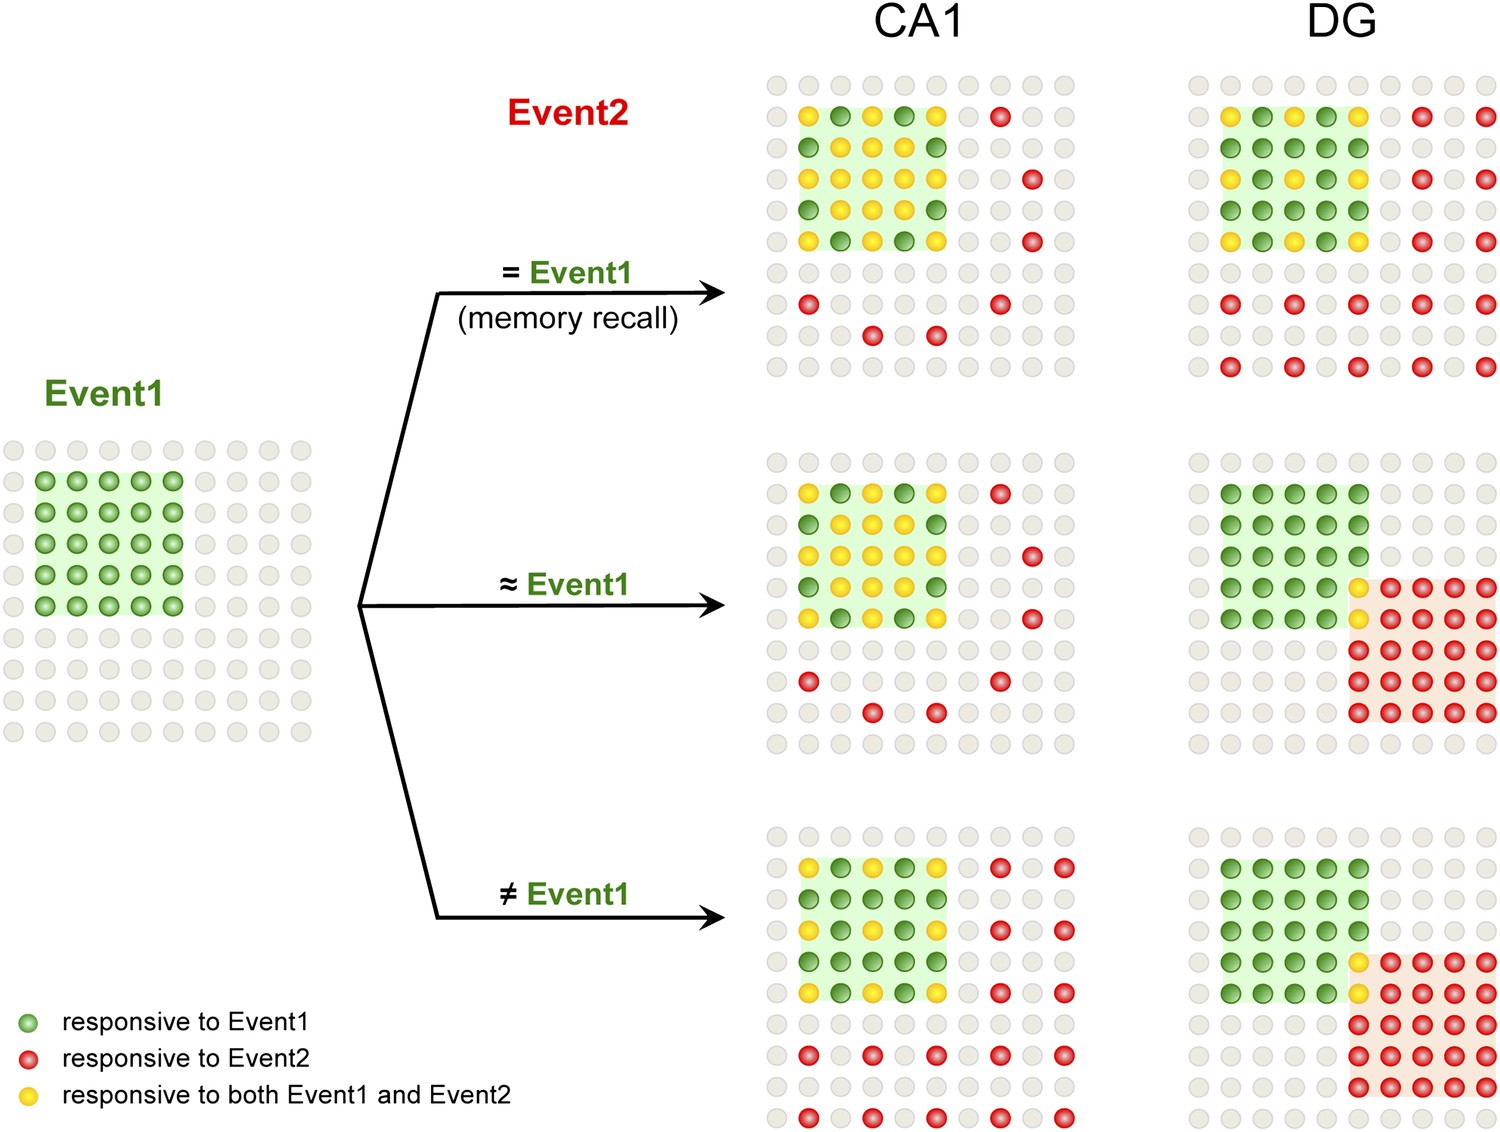
A model for population codes in CA1 and the DG during learning and memory.
Experience and learning of an event (event 1, green) evoke activities in ensembles of neurons in CA1 and the DG (green cells). When mice subsequently encounter the same event, which will most likely induce memory recall (event 2 = event 1), the population of CA1 neurons responding to event 1 is preferentially reactivated (red cells), whereas DGCs responding to event 1 are reactivated at chance level (event 1-responsive DGCs have neither an advantage nor a disadvantage to be reactivated compared to the total DGC population). Neurons that are responsive to both events are in yellow. When mice encounter a second event that is similar but not identical to event 1 (event 2 ≈ event 1), there is still a preference to activate the CA1 neurons that are activated by event 1. However, in the DG, another population of DGCs that does not respond to event 1 will likely be selected to respond to event 2. Hence, small changes in inputs can evoke a population code change in the DG but not CA1, providing a neural basis for the pattern separation function of the DG. When mice encounter a second event that is drastically different from event 1 (event 2 ≠ event 1), CA1 neurons responding to event 1 are activated at chance level, whereas DGCs that did not respond to event 1 are selected to encode event 2.
Figure 8
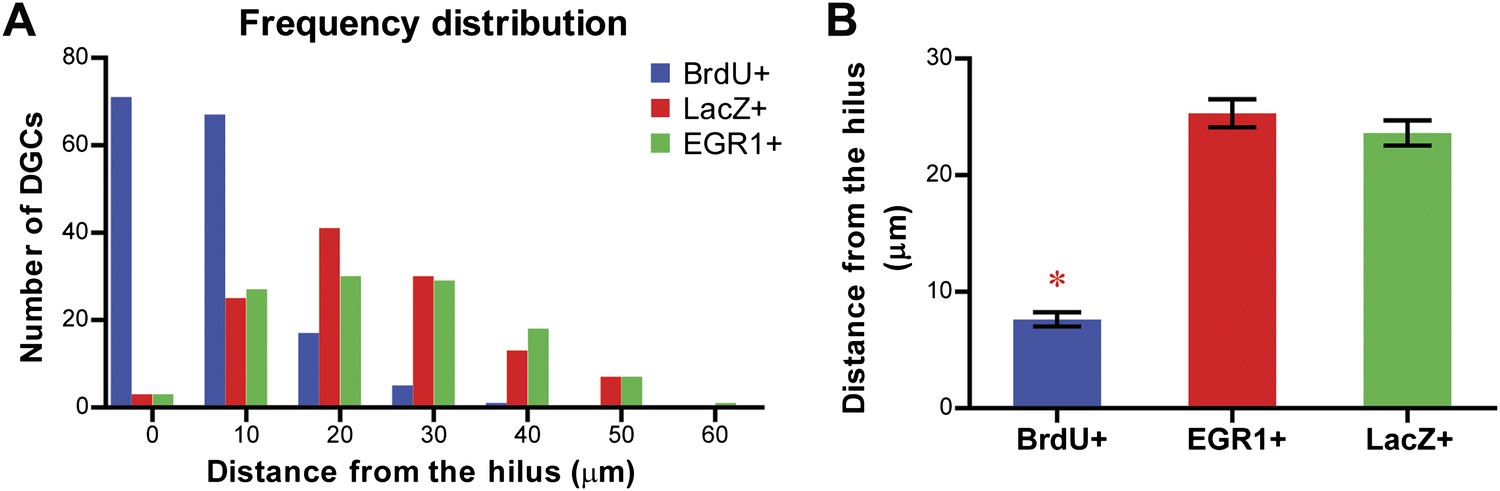
Comparison of the location of the LacZ-positive and EGR1-positive DGCs with that of adult-born granule cells in the granule cell layer of the DG.
The distance of each cell from the hilus was measured using Metamorph. Adult-born granule cells were labeled by treating mice with water containing BrdU for one week. Treated mice were perfused more than 6 weeks later for histological examination of the locations of BrdU-labeled cells in the granule cell layer. (A) Frequency distribution showing that the majority of the BrdU-positive cells are located close to the hilus, whereas both LacZ-positive and EGR1-positive populations were distributed across the granule cell layer. (B) The distance from the hilus is significantly shorter in BrdU-positive cells compared to that of the EGR1-positive or LacZ-positive cells (ANOVA: F2,392 = 120.6, p<0.0001; Bonferroni post hoc test, p<0.001).
Figure 9
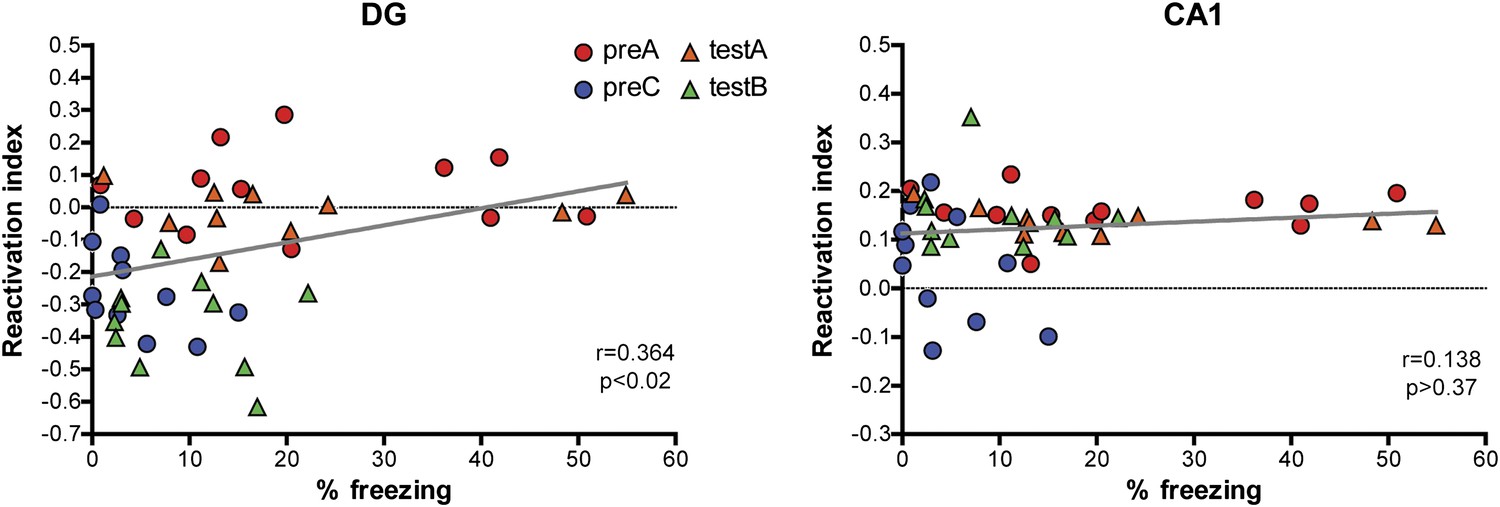
Correlations between reactivation indexes and behavioral performance in the contextual fear conditioning experiments.
A weak but significant correlation between behavioral performance and the reactivation index was detected in the DG (r = 0.3641, p<0.016) and no significant correlation was found in CA1 (r = 0.1379, p>0.37).
Tables
Table 1
Total numbers of neurons evaluated in experiments
| CFC experiment 1 | CFC experiment 2 | |||
| preA | preC | testA | testB | |
|---|---|---|---|---|
| n | 12 | 11 | 10 | 11 |
| CA1 | 486 ± 43 | 533 ± 26 | 544 ± 27 | 573 ± 20 |
| DG* | 4492 ± 222 | 4267 ± 345 | 2575 ± 177 | 2590 ± 102 |
-
*
Calculated number. CFC: contextual fear conditioning.
Download links
A two-part list of links to download the article, or parts of the article, in various formats.
Downloads (link to download the article as PDF)
Open citations (links to open the citations from this article in various online reference manager services)
Cite this article (links to download the citations from this article in formats compatible with various reference manager tools)
Selection of distinct populations of dentate granule cells in response to inputs as a mechanism for pattern separation in mice
eLife 2:e00312.
https://doi.org/10.7554/eLife.00312


