Feeding-induced rearrangement of green leaf volatiles reduces moth oviposition
- Max Planck Institute for Chemical Ecology, Germany
Figures
Figure 1
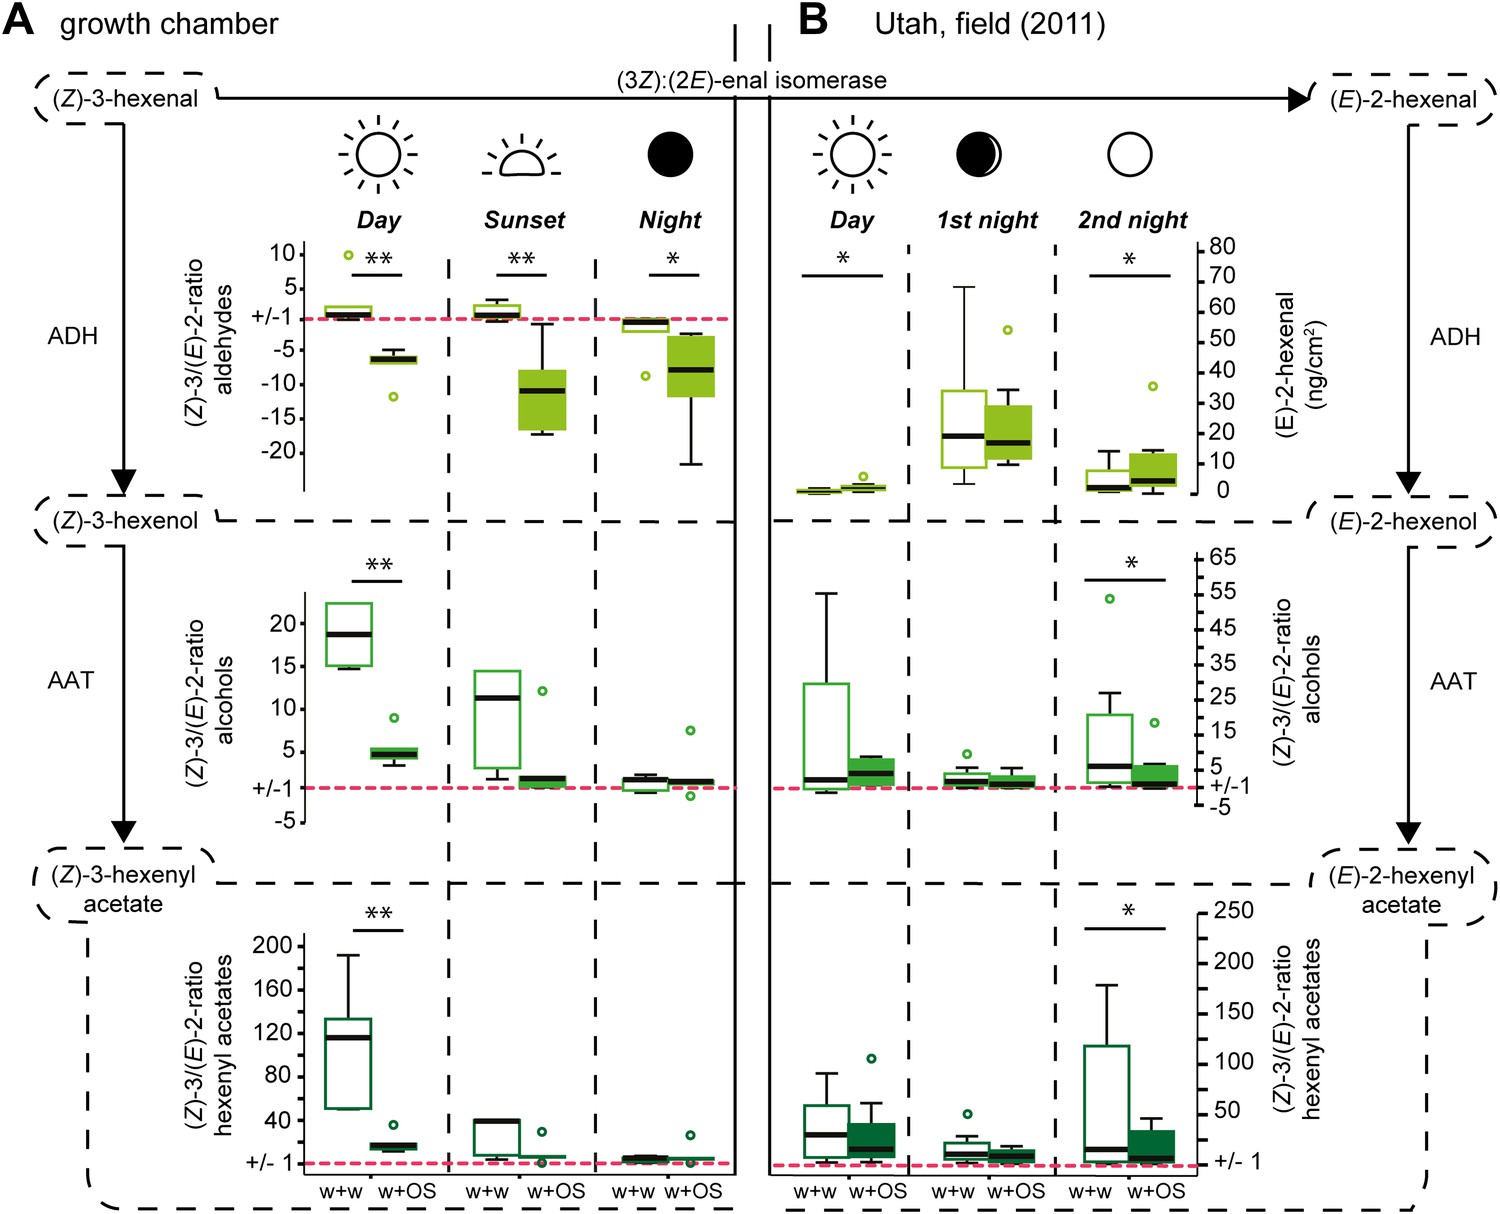
Diurnal changes in the emitted (Z)-3/(E)-2-ratios of GLVs in Datura wrightii plants.
(Z)-3/(E)-2-ratios of GLVs in Datura wrightii plants represented as box plots. (A) Growth chamber experiment: a single not yet fully developed leaf of each D. wrightii plant was mechanically wounded and treated with water (w + w) or M. sexta OS (w + OS) during three different light conditions to mimic day, sunset, and night. (B) Field experiment: Three single previously undamaged leaves per plant were chosen and randomly assigned to a treatment (control, w + w or w + OS). Values of the control leaf were subtracted from the values of treated leaves. As (Z)-3-hexenal was not detectable in any of the field samples (E)-2-hexenal values are displayed in ng*cm−2*2h−1 (adsorbents used in field collection are not accountable for the absence of (Z)-3-hexenal; Table 6). For visual simplifications (Z)-3/(E)-2-ratios <1 are represented as their negative reciprocal. Values above ‘1’ (red dotted line) thus represent treatment-groups that produced more of the (Z)-3-isomer and values below ‘1’ represent treatment-groups that produced more of the (E)-2-isomer. Asterisks indicate significant differences between treatments (A: Mann–Whitney U test, **p≤0.01, *p≤0.05; n = 5), (B: Wilcoxon signed-rank test, *p<0.05; n = 8). ADH: alcohol dehydrogenase; AAT: alcohol acyl-transferase. The median is represented as a line in each box, box outlines mark the 25% and 75% percentiles; outliers are depicted as circles (if value > 1.5× the interquartile range). For raw data, see F1AB_AllmannSpaethe2012_volatiles.xlsx (Dryad: Allmann et al., 2012).
Figure 2
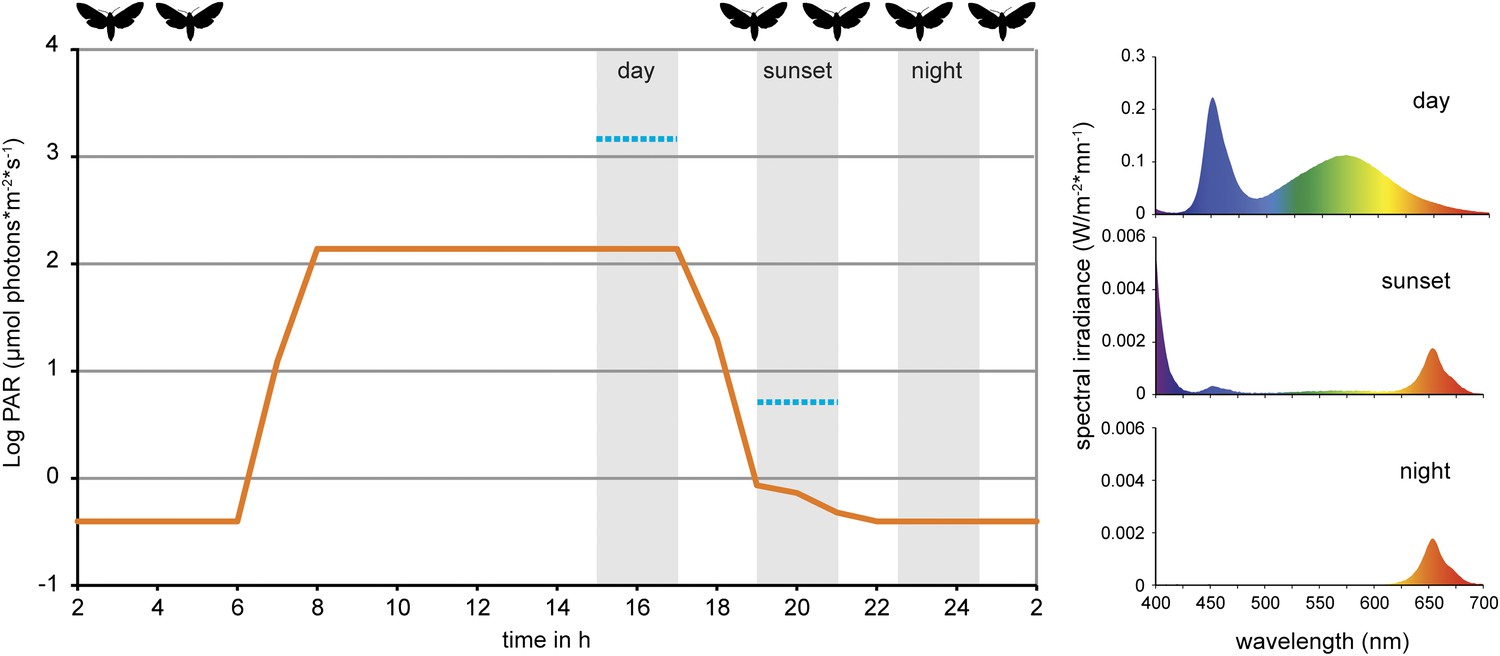
Light conditions during laboratory volatile collection.
Light composition and intensity changed within 24 hr to simulate day, sunset and night condition. Photosynthetically active radiation (PAR, μmol photons*m−2*s−1, orange line) was measured for every light composition and ranged from 0.39 ± 0.01 SE at night to 138.37 ± 0.09 SE at full day conditions. Blue lines denote PAR values measured in the field during the respective volatile collection event (during the night samplings, PAR was below detection limit). For the graph values were logarithmized. Grey areas denote volatile collection events; respective light spectra are shown on the right. For representational reasons time scale starts at 2 am. Flight activity, related to nectar feeding and oviposition (Madden and Chamberlin, 1945; Lingren et al., 1977), is indicated on top of the graph. For raw data, see F2_AllmannSpaethe2012_light.xlsx (Dryad: Allmann et al., 2012).
Figure 3
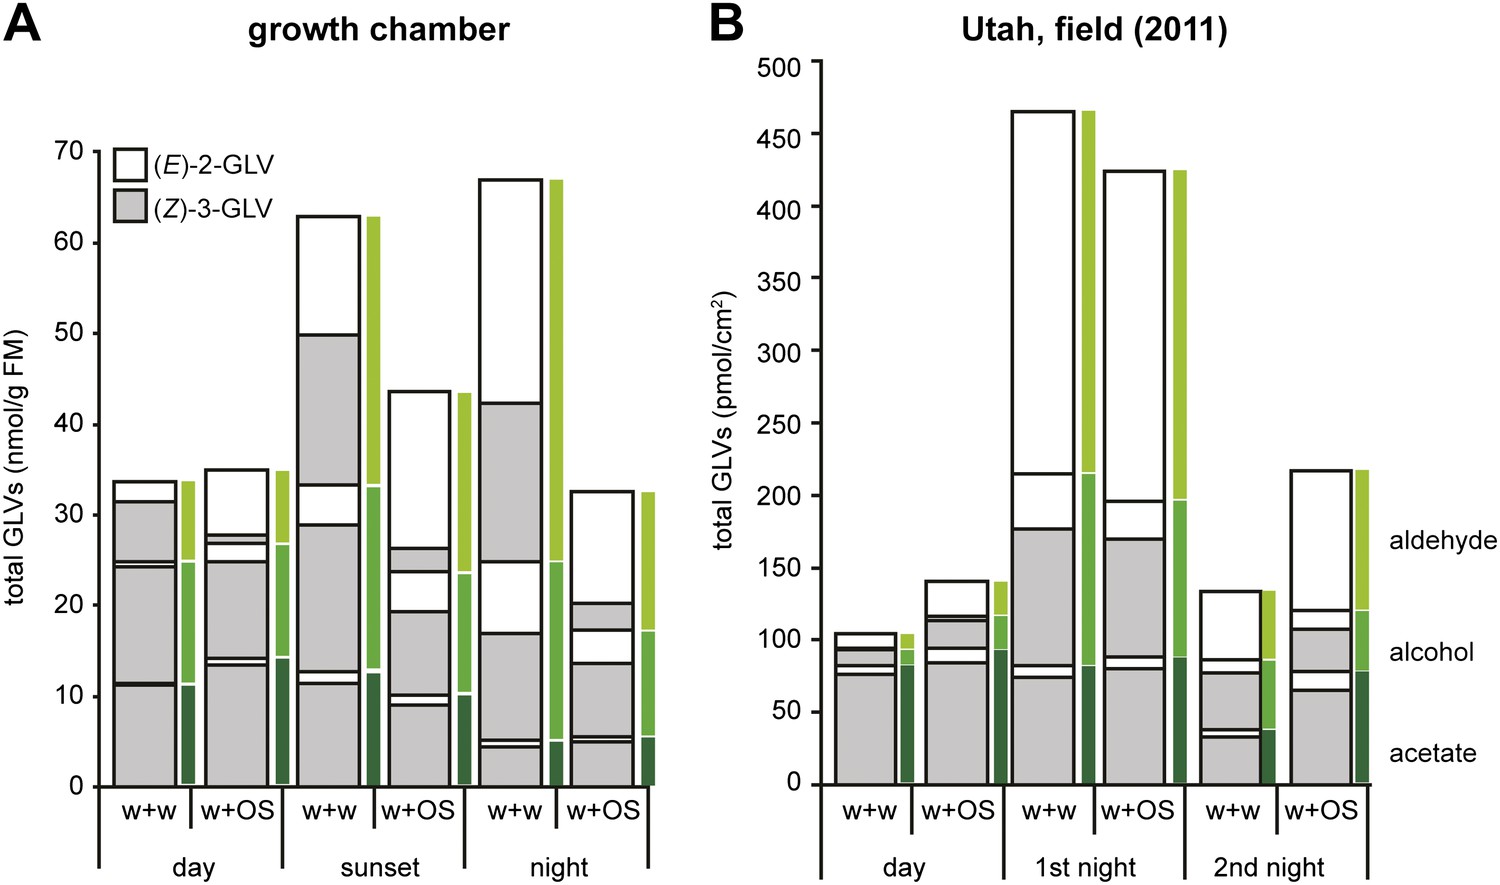
Total amounts of GLVs released from Datura wrightii plants at different times of the day in laboratory and field experiments.
Mean release of major GLVs from Datura wrightii plants at different times of the day and at different light intensities. Grey and white bars represent (Z)-3- and (E)-2-GLVs, respectively. Single leaves were mechanically damaged and volatiles were trapped for 2 hr immediately after wounds had been treated with either water (w + w) or with M. sexta’s OS (w + OS). (A) GLV emissions of D. wrightii plants under controlled light conditions in a growth chamber. Light conditions are explained in this figure. Quantities are given in nmol/g fresh mass (FM)/2 hr; n = 5. (B) GLV emissions of D. wrightii plants naturally grown in the field. Quantities are given in pmol/cm2/2 hr; n = 8. For an approximate comparison between (A) and (B): 50 cm2 leaf area ≈ 1 g FM. Colored bars mark the emission of aldehydes (light green), alcohols (green) and acetates (dark green). For raw data, see F1AB_AllmannSpaethe2012_volatiles.xlsx (Dryad: Allmann et al., 2012).
Figure 4
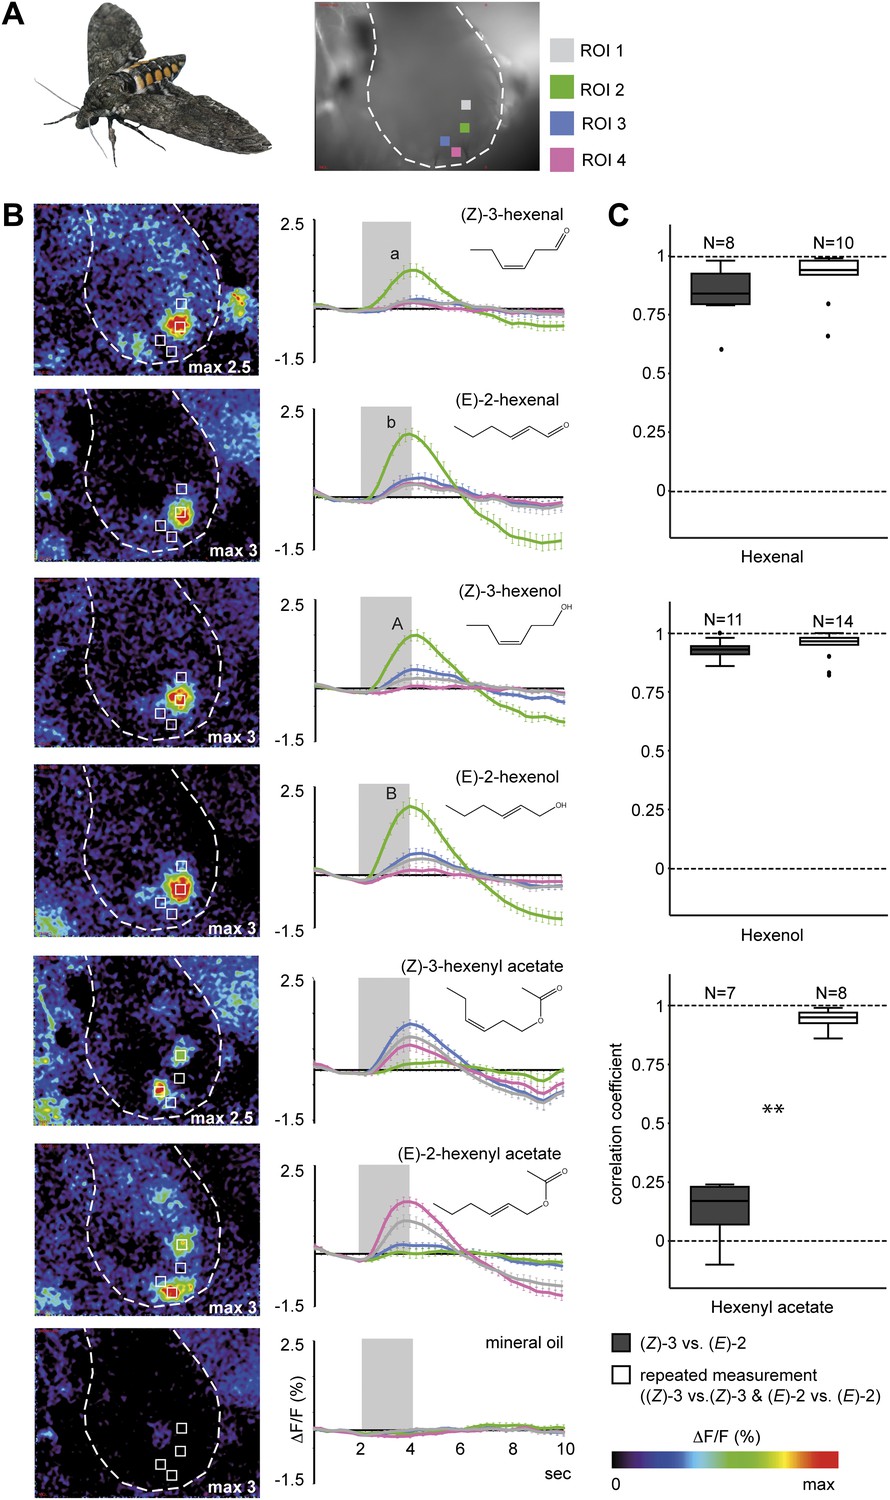
Calcium activity patterns of the (Z)-3- and (E)-2-isomers in the M. sexta antennal lobe (AL).
(A) View onto the AL (marked by outline) of a Manduca sexta female after bath application with the calcium-sensitive dye calcium-green-AM. Stimulations with the six tested GLVs resulted in the activation of four regions in the AL most probably corresponding to single glomeruli (four ROIs, regions of interest). (B) Representative false color-coded images show calcium responses in the AL after odor stimulation. Images are individually scaled to the strongest activation (given by the max value in each image). Time traces show activity of ROI 1, 2, 3 and 4 (n = 10) in response to odor stimulation (2 s; grey bar). Error bars represent standard errors of means. For hexenal and hexenol, stimulations with the (E)-2-isomers activated ROI 2 significantly stronger than did stimulations with the (Z)-3-isomers (Wilcoxon signed-rank test: hexenal: p<0.01, hexenol: p<0.05). ΔF: change in fluorescence; F: background fluorescence. For raw data, see F4B_AllmannSpaethe2012_timetracesGlvs.xlsx (Dryad: Allmann et al., 2012). (C) Comparison of response pattern similarity for repeated stimulations of one structural isomer ((Z)-3 vs (Z)-3 Or (E)-2 vs (E)-2, white boxes) and for both structural isomers ((E)-2 vs (Z)-3, grey boxes); sample size is given above the boxes (Mann–Whitney U test: hexenal: p>0.05; hexenol: p>0.05, hexenyl acetate: p<0.001). For raw data, see F4C_AllmannSpaethe2012_correlationcoefficientsGlvs.xlsx (Dryad: Allmann et al., 2012).
Figure 5
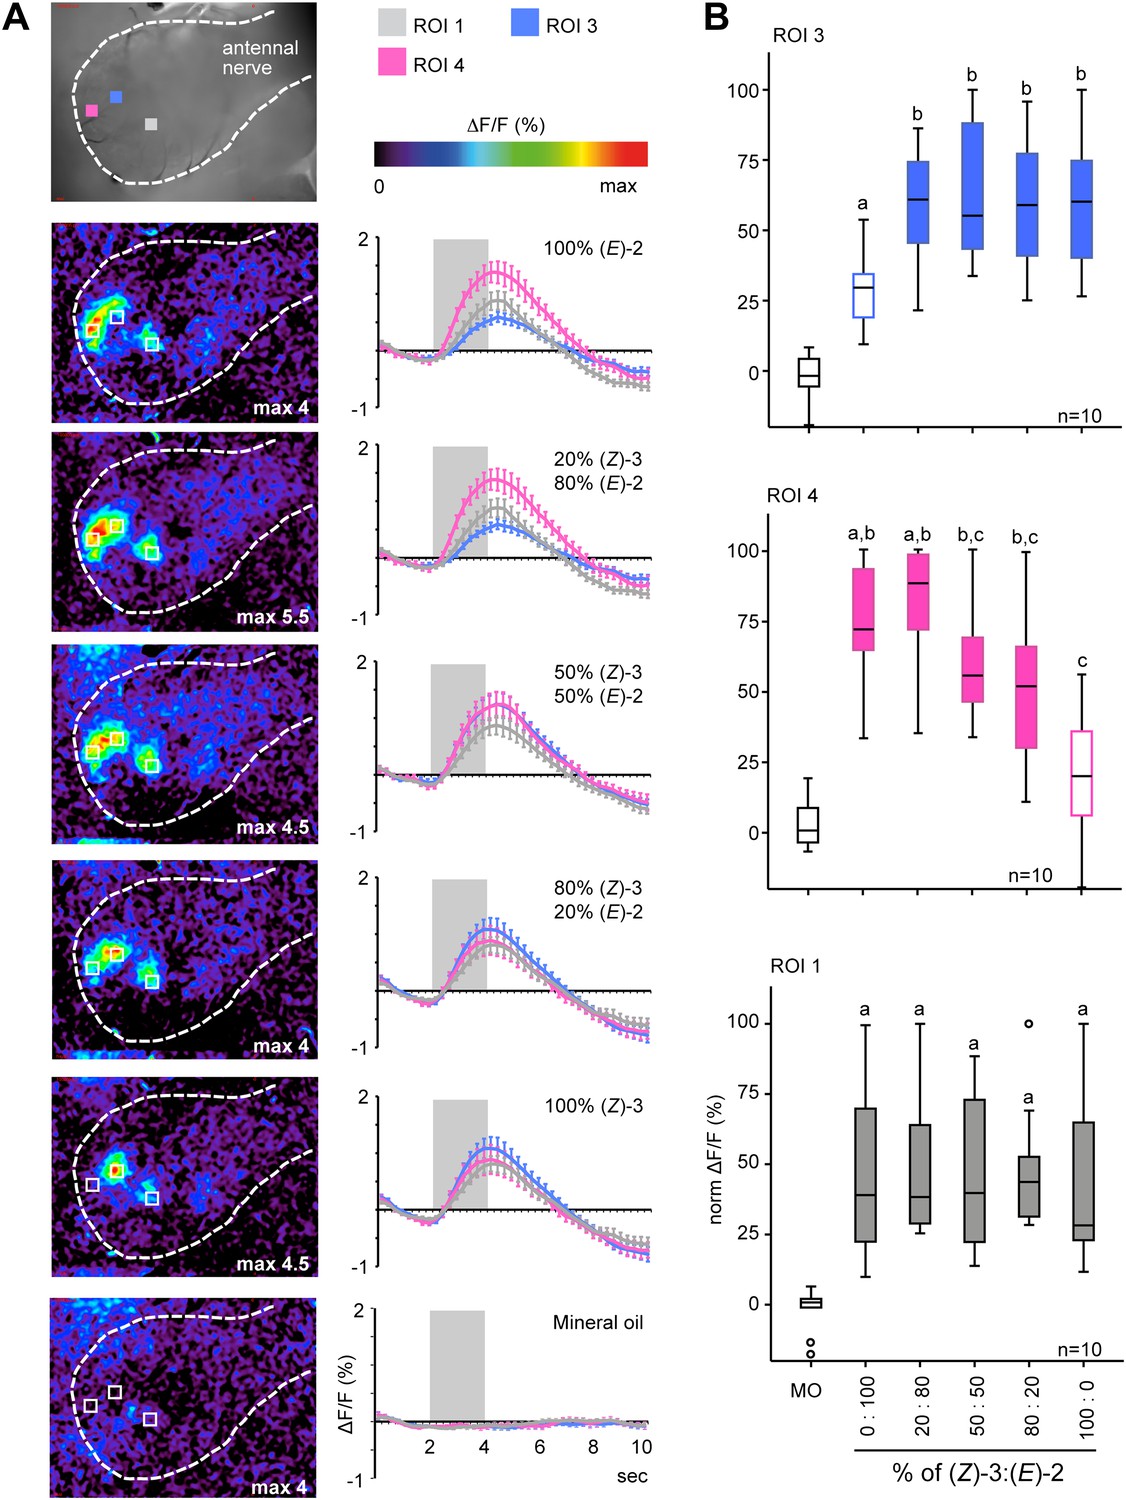
Female antennal lobe (AL) shows isomer-specific calcium responses to (Z)-3- and (E)-2-hexenyl acetate.
(A) Representative false color-coded images show calcium responses in the AL after odor stimulation with isomeric mixtures of a total dose of 250 ng. Images are individually scaled to the strongest activation (given by the max value in each image). Time traces show activity of ROI 1, 3 and 4 (n = 10) in response to odor stimulation (2 s; grey bar). Error bars represent standard error of mean. For raw data, see F5A_AllmannSpaethe2012_timetraceshexenylacetate.xlsx (Dryad: Allmann et al., 2012). (B) Change in fluorescence in ROI 1, 3 and 4 to the pure structural isomers and their mixtures, normalized to the highest activation in every animal. Filled boxes represent responses significantly different from the mineral oil (MO) control; different letters denote significantly different calcium responses (Kruskal–Wallis and Dunn’s multiple comparison test). For raw data, see F5BCE_AllmannSpaethe2012_imaginghexenylacetate.xlsx (Dryad: Allmann et al., 2012).
Figure 6
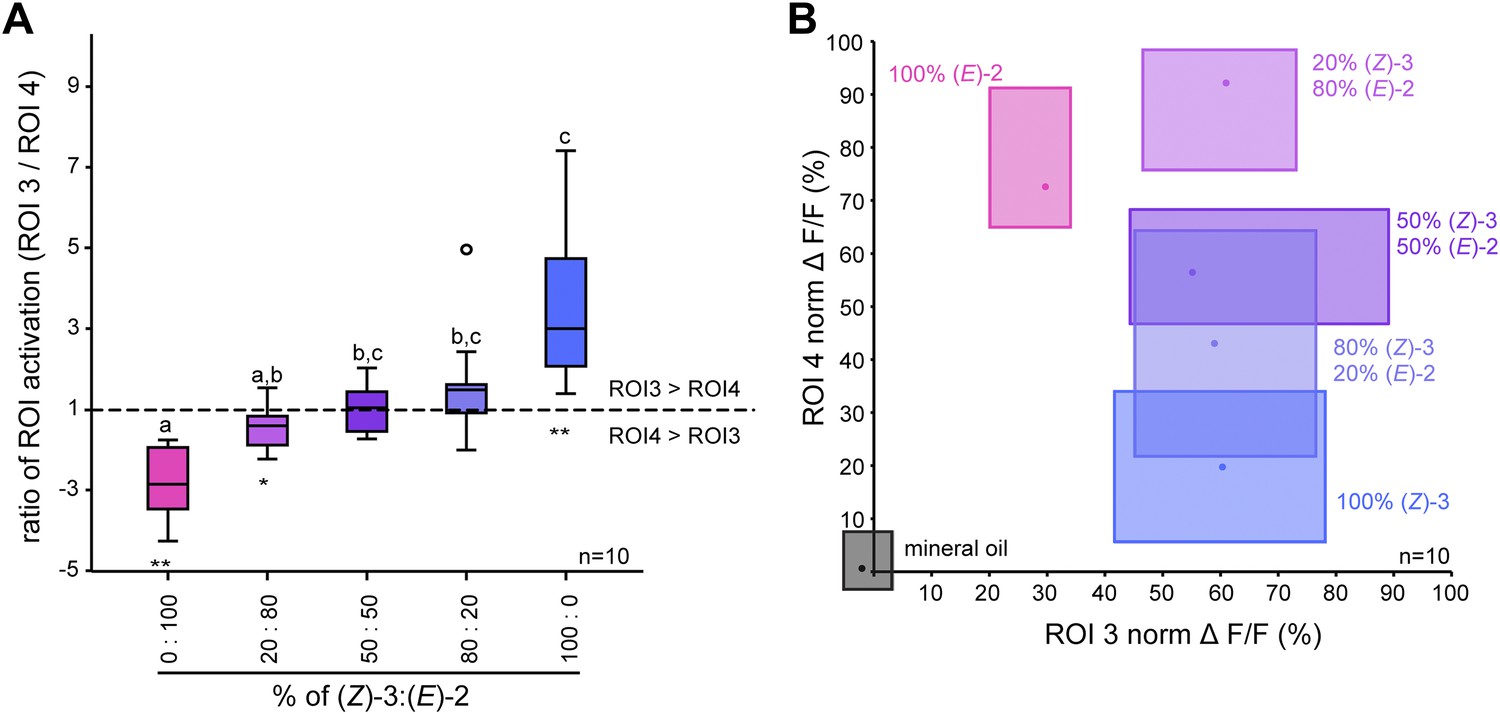
Isomer-specific regions show different response characteristics.
(A) Both isomer-specific regions ROI 3 and ROI 4 are shown as ratios of ROI activation (ROI 3/ROI 4; for ROI 4 > ROI 3: −1/ratio) at stimulations with 250 ng. Asterisks indicate significant differences from 1, the ratio at which activation would be equal for ROI 3 and 4 (Wilcoxon signed-rank test, 100/0, 0/100: p<0.01, 20/80: p<0.05). Structural isomers and their mixtures were tested with Kruskal–Wallis and Dunn’s multiple comparison test, different letters denote significantly different ratios. (B) Calcium signals of ROI 3 (x-axis) and ROI 4 (y-axis) (% norm ΔF/F, separated by axes) in response to odor stimulation (colored boxes) and the solvent mineral oil (grey box). Points denote the median values, box outlines mark the 25% and 75% percentiles. For raw data, see F5BCE_AllmannSpaethe2012_imaginghexenylacetate.xlsx (Dryad: Allmann et al., 2012).
Figure 7
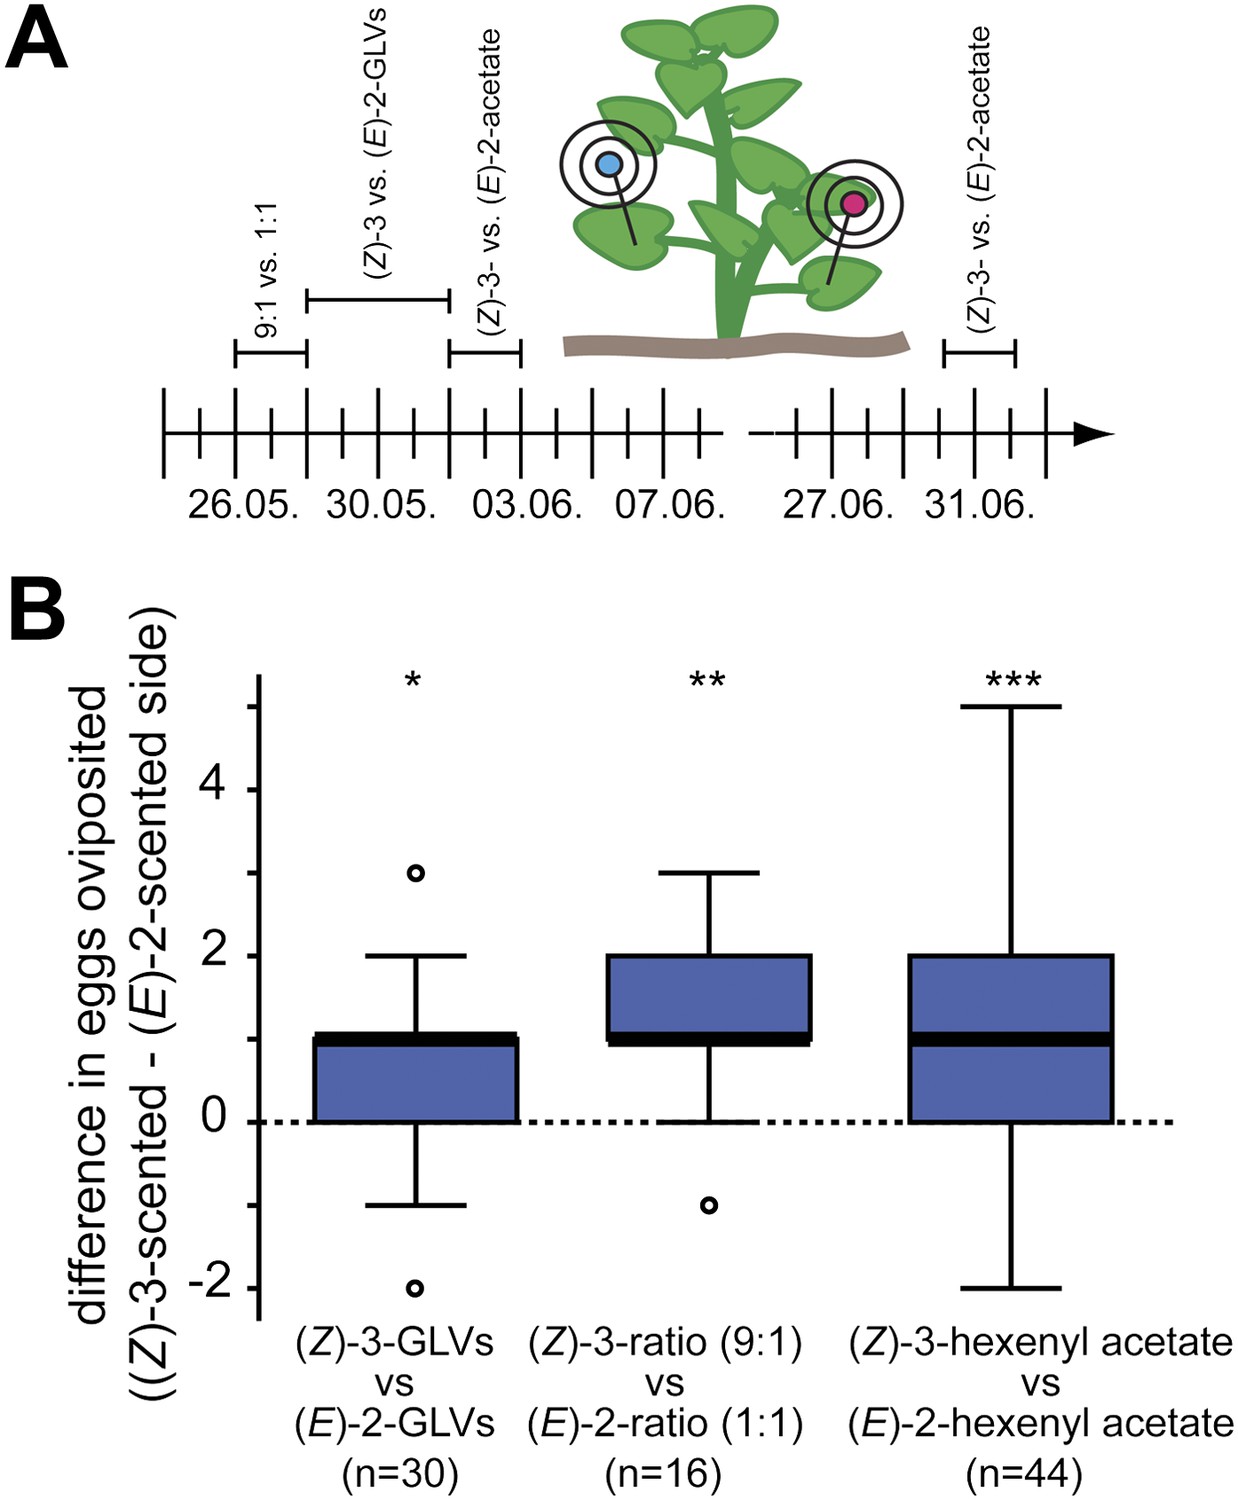
Manduca moths laid more eggs on the (Z)-3- than on the (E)-2-scented side of the plant.
(A) The effect of different GLV-mixes on the oviposition behavior of female Manduca moths was tested during the 2010 field season on native Datura wrightii plants. On each experimental day, two different mixes were tested in a paired design. Mixes used on different experimental days are plotted above the timeline. The detailed composition of each mixture is described in Table 3. (B) Difference in number of eggs oviposited per plant. Higher oviposition rates were observed for the (Z)-3-scented side of the D. wrightii plants. Treatment pairs with no oviposited eggs were excluded prior to the statistical analysis (Wilcoxon signed-rank test). The median is represented as a line in each box, box outlines mark the 25% and 75% percentiles; outliers are depicted as circles (if value > 1.5× the interquartile range). For raw data, see F6B_AllmannSpaethe2012_oviposition.xlsx (Dryad: Allmann et al., 2012).
Tables
Table 1
GLV emission of Datura wrightii plants in the growth chamber during the first 2 hr after w + w or w + OS treatment with 100% light (day), 20–10% light (sunset) or 0% light (night)
| Class | Common name | RT | volatile release in µg / g leaf fresh mass | ||
| w + w | w + OS | ||||
| Day | Aldehyde | (Z)-3-hexenal | 8.54 | 0.64 ± 0.293 | 0.097 ± 0.027 |
| (E)-2-hexenal | 10.49 | 0.22 ± 0.109 | 0.7 ± 0.17 | ||
| Alcohol | (Z)-3-hexenol | 14.98 | 1.30 ± 0.511 | 1.06 ± 0.275 | |
| (E)-2-hexenol | 15.57 | 0.058 ± 0.034 | 0.195 ± 0.034 | ||
| Hexenylester | (Z)-3-hexenyl acetate | 13.28 | 1.59 ± 0.442 | 1.92 ± 0.244 | |
| (E)-2-hexenyl acetate | 13.75 | 0.017 ± 0.004 | 0.105 ± 0.018 | ||
| (Z)-3-hexenyl butyrate | 17.07 | 0.028 ± 0.009 | 0.051 ± 0.016 | ||
| (E)-2-hexenyl butyrate | 17.44 | 0.01 ± 0.002 | 0.017 ± 0.004 | ||
| Sunset | Aldehyde | (Z)-3-hexenal | 8.54 | 1.62 ± 0.5 | 0.26 ± 0.118 |
| (E)-2-hexenal | 10.49 | 1.28 ± 0.775 | 1.69 ± 0.697 | ||
| Alcohol | (Z)-3-hexenol | 14.98 | 1.62 ± 0.433 | 0.93 ± 0.308 | |
| (E)-2-hexenol | 15.57 | 0.45 ± 0.315 | 0.44 ± 0.183 | ||
| Hexenylester | (Z)-3-hexenyl acetate | 13.28 | 1.62 ± 0.431 | 1.28 ± 0.511 | |
| (E)-2-hexenyl acetate | 13.75 | 0.18 ± 0.12 | 0.158 ± 0.067 | ||
| (Z)-3-hexenyl butyrate | 17.07 | 0.039 ± 0.011 | 0.031 ± 0.003 | ||
| (E)-2-hexenyl butyrate | 17.44 | 0.013 ± 0.004 | 0.01 ± 0.001 | ||
| Night | Aldehyde | (Z)-3-hexenal | 8.54 | 1.71 ± 0.732 | 0.28 ± 0.118 |
| (E)-2-hexenal | 10.49 | 2.43 ± 0.521 | 1.22 ± 0.697 | ||
| Alcohol | (Z)-3-hexenol | 14.98 | 1.18 ± 0.35 | 0.81 ± 0.308 | |
| (E)-2-hexenol | 15.57 | 0.79 ± 0.14 | 0.37 ± 0.183 | ||
| Hexenylester | (Z)-3-hexenyl acetate | 13.28 | 0.63 ± 0.268 | 0.71 ± 0.511 | |
| (E)-2-hexenyl acetate | 13.75 | 0.093 ± 0.04 | 0.083 ± 0.067 | ||
| (Z)-3-hexenyl butyrate | 17.07 | 0.036 ± 0.002 | 0.033 ± 0.003 | ||
| (E)-2-hexenyl butyrate | 17.44 | 0.01 ± 0.002 | 0.014 ± 0.001 | ||
-
Mean (±SEM; n = 5) release of GLVs in D. wrightii plants. A single not yet fully developed leaf of each plant was mechanically wounded and treated with water (w + w) or M. sexta OS (w + OS) during the day (A, 100% light), sunset (B, 20–10% light) and night (C, 0% light). Volatiles are listed by chemical classes and in order of their retention time.
Table 2
GLV emission of native Datura wrightii plants in the field (2011) during the first 2 hr after w + w or w + OS treatment; during day (1:30–3:30 pm), first or second night (0–2 am)
| Class | Common name | RT | Volatile release in ng/cm2 leaf | |||
| Control | w + w | w + OS | ||||
| Day | Aldehyde | (E)-2-hexenal | 10.87 | 0.062 ± 0.006 | 1.02 ± 0.233 | 2.43 ± 0.597 |
| Alcohol | (Z)-3-hexenol | 15.38 | 0.137 ± 0.067 | 1.21 ± 0.28 | 2.07 ± 0.465 | |
| (E)-2-hexenol | 15.97 | 0.248 ± 0.035 | 0.368 ± 0.088 | 0.57 ± 0.148 | ||
| Hexenylester | (Z)-3-hexenyl acetate | 13.66 | 0.26 ± 0.083 | 11.1 ± 1.881 | 12.3 ± 2.067 | |
| (E)-2-hexenyl acetate | 14.13 | 0.01 ± 0.002 | 0.87 ± 0.396 | 1.34 ± 0.564 | ||
| (Z)-3-hexenyl butyrate | 17.44 | 0.011 ± 0.002 | 0.22 ± 0.181 | 0.19 ± 0.142 | ||
| (E)-2-hexenyl butyrate | 17.8 | 0.004 ± 0.001 | 0.007 ± 0.002 | 0.006 ± 0.001 | ||
| First night | Aldehyde | (E)-2-hexenal | 10.87 | 0.103 ± 0.013 | 24.6 ± 7.844 | 22.5 ± 5.312 |
| Alcohol | (Z)-3-hexenol | 15.38 | 0.032 ± 0.006 | 9.6 ± 2.028 | 8.2 ± 3.734 | |
| (E)-2-hexenol | 15.97 | 0.296 ± 0.023 | 4.12 ± 0.955 | 2.89 ± 0.855 | ||
| Hexenylester | (Z)-3-hexenyl acetate | 13.66 | 0.165 ± 0.028 | 10.7 ± 3.621 | 11.53 ± 4.291 | |
| (E)-2-hexenyl acetate | 14.13 | 0.009 ± 0.001 | 1.14 ± 0.371 | 1.15 ± 0.306 | ||
| (Z)-3-hexenyl butyrate | 17.44 | 0.007 ± 0.001 | 0.022 ± 0.008 | 0.04 ± 0.022 | ||
| (E)-2-hexenyl butyrate | 17.8 | 0.002 ± 0 | 0.006 ± 0.002 | 0.007 ± 0.003 | ||
| Second night | Aldehyde | (E)-2-hexenal | 10.87 | 0.055 ± 0.009 | 4.7 ± 1.877 | 9.5 ± 4.009 |
| Alcohol | (Z)-3-hexenol | 15.38 | 0.034 ± 0.018 | 4.0 ± 1.225 | 2.94 ± 0.522 | |
| (E)-2-hexenol | 15.97 | 0.177 ± 0.021 | 0.99 ± 0.427 | 1.47 ± 0.554 | ||
| Hexenylester | (Z)-3-hexenyl acetate | 13.66 | 0.089 ± 0.024 | 4.8 ± 2.114 | 9.4 ± 4.708 | |
| (E)-2-hexenyl acetate | 14.13 | 0.01 ± 0.002 | 0.74 ± 0.505 | 1.77 ± 0.972 | ||
| (Z)-3-hexenyl butyrate | 17.44 | bld. | 0.032 ± 0.019 | 0.039 ± 0.013 | ||
| (E)-2-hexenyl butyrate | 17.8 | bld. | 0.005 ± 0.003 | 0.007 ± 0.002 | ||
-
Mean (±SEM; n = 5) release of GLVs in D. wrightii plants in nature. A single not yet fully developed leaf of each plant was mechanically wounded and treated with water (w + w) or M. sexta OS (w + OS) during the day (A, 1:30–3:30 pm) and during night (B, first night, C, second night, 0–2 am). Volatiles are listed by chemical classes and in order of their retention time; bld.: below the limit of detection.
Table 3
GLV-mixtures used for oviposition assay in the field
| Compounds (common names) | (Z)-3/(E)-2-mix 1:1; ≈ w + OS (µg/µl lanolin) | (Z)-3/(E)-2-mix 9:1; ≈ w + w (µg/µl lanolin) | |
| (Z)-3-GLVs | (Z)-3-hexenal (50% in triacetin) | 5.0 | 9.0 |
| (Z)-3-hexenol | 5.0 | 9.0 | |
| (Z)-3-hexenyl acetate | 0.05 | 0.09 | |
| (Z)-3-hexenyl butyrate | 0.05 | 0.09 | |
| (E)-2-GLVs | (E)-2-hexenal | 5.0 | 1.0 |
| (E)-2-hexenol | 5.0 | 1.0 | |
| (E)-2-hexenyl acetate | 0.05 | 0.01 | |
| (E)-2-hexenyl butyrate | 0.05 | 0.01 | |
| Triacetin per 10 mL mix (derived from (Z)-3-hexenal), μl | 51.25 | 92.2 | |
| Triacetin added per 10 mL mix, μl | 40.95 | 0 | |
| Total amount of triacetin per 10 mL mix, μl | 92.2 | 92.2 | |
| Compounds (common names) | Only (Z)-3-mix (µg/µl lanolin) | Only (E)-2-mix (µg/µl lanolin) | |
| (Z)-3-GLVs | (Z)-3-hexenal (50% in triacetin) | 10.0 | 0.0 |
| (Z)-3-hexenol | 10.0 | 0.0 | |
| (Z)-3-hexenyl acetate | 0.1 | 0.0 | |
| (Z)-3-hexenyl butyrate | 0.1 | 0.0 | |
| (E)-2-GLVs | (E)-2-hexenal | 0.0 | 10.0 |
| (E)-2-hexenol | 0.0 | 10.0 | |
| (E)-2-hexenyl acetate | 0.0 | 0.1 | |
| (E)-2-hexenyl butyrate | 0.0 | 0.1 | |
| Triacetin per 10 ml mix (derived from (Z)-3-hexenal), μl | 102.5 | 0 | |
| Triacetin added per 10 ml mix, μl | 0 | 102.5 | |
| Total amount of triacetin per 10 ml mix, μl | 102.5 | 102.5 | |
| Compounds (common names) | (Z)-3-hexenyl acetate (µg/µl lanolin) | (E)-2-hexenyl acetate (µg/µl lanolin) | |
| (Z)-3-hexenyl acetate | 5.0 | 0.0 | |
| (E)-2-hexenyl acetate | 0.0 | 5.0 |
Table 4
Average (±SD) GLV emissions of GLV-mixtures used for the field bioassays (cotton swab, after Allmann and Baldwin, 2010) and of native Datura wrightii plants in the field during the first 2 hr after w + w or w + OS treatment; second night (0–2 am)
| Common names | Volatile release in µg/30 min | |||
| Cotton swab (after Allmann and Baldwin, 2010) | D. wrightii leaf | |||
| 9:1 GLV mix | 1:1 GLV mix | w+w | w+OS | |
| (Z)-3-hexenol | 9.8 ± 13.21 | 7.1 ± 9.71 | 0.20 ± 0.17 | 0.15 ± 0.07 |
| (Z)-3-hexenyl acetate | 0.18 ± 0.21 | 0.15 ± 0.18 | 0.24 ± 0.30 | 0.47 ± 0.67 |
| (E)-2-hexenal | 1.3 ± 2.14 | 4.3 ± 7.20 | 0.24 ± 0.27 | 0.48 ± 0.57 |
| (E)-2hexenol | 1.3 ± 1.84 | 8 ± 11.39 | 0.05 ± 0.06 | 0.07 ± 0.08 |
| (E)-2-hexenyl acetate | 0.06 ± 0.07 | 0.16 ± 0.20 | 0.04 ± 0.07 | 0.09 ± 0.14 |
Table 5
Average (Z)-3/(E)-2-ratios of GLV-mixtures used for the field bioassays (cotton swab, after Allmann and Baldwin, 2010) and of native Datura wrightii plants in the field during the first 2 hr after w+w or w+OS treatment; 2nd night (0–2am)
| Common names | (Z)-3/(E)-2-ratio of emitted GLVs | |||
| Cotton swab (after Allmann and Baldwin, 2010) | D. wrightii leaf | |||
| 9:1 GLV mix | 1:1 GLV mix | w + w | w + OS | |
| Hexenol | 8.37 | 1.07 | 4.44 | 2.38 |
| Hexenyl acetate | 3.24 | 0.90 | 25.94 | 15.67 |
-
Emissions of D. wrightii were adjusted from leaf surface (cm2) to fresh mass (g) scale by the rough estimate of 50 cm2 = 1 g and represent the emission of two medium sized leaves.
Table 6
Comparison of trapping capability of adsorbents used in laboratory (SuperQ) and field volatile collections
| Compound name | Peak area × 106 ± SD | ||
| RT | Activated charcoal | SuperQ | |
| (Z)-3-hexenal | 2.40 | 0.90 ± 0.13 | 5.4 ± 1.01 |
| (E)-2-hexenal | 3.57 | 9.3 ± 3.33 | 6.9 ± 1.21 |
| (Z)-3-hexenol | 3.35 | 10.1 ± 3.07 | 7.6 ± 1.49 |
| (E)-2-hexenol | n.d. | n.d. | |
| (Z)-3-hexenyl acetate | 12.25 | 0.56 ± 0.28 | 0.47 ± 0.22 |
| (E)-2-hexenyl acetate | 12.68 | 0.52 ± 0.03 | 0.59 ± 0.04 |
-
Mean (±SD; n = 6) peak areas of GLVs emitted from N. attenuata plants in the glass house. Of each plant two equally sized leaves were mechanically wounded. Subsequently, volatiles were collected for 1 hr with traps filled with either SuperQ or activated charcoal. Traps were eluted with 250 μl Dichloromethane and measured on a GC-MS equipped with a BR-5ms column (Bruker, 15 m, 0.25 mm ID, 25 μm).
Download links
A two-part list of links to download the article, or parts of the article, in various formats.
Downloads (link to download the article as PDF)
Open citations (links to open the citations from this article in various online reference manager services)
Cite this article (links to download the citations from this article in formats compatible with various reference manager tools)
Feeding-induced rearrangement of green leaf volatiles reduces moth oviposition
eLife 2:e00421.
https://doi.org/10.7554/eLife.00421


