Decoding the neural mechanisms of human tool use
- Queen’s University, Canada
- University of Western Ontario, Canada
- Brain Imaging Center, University of Missouri, United States
Figures
Figure 1
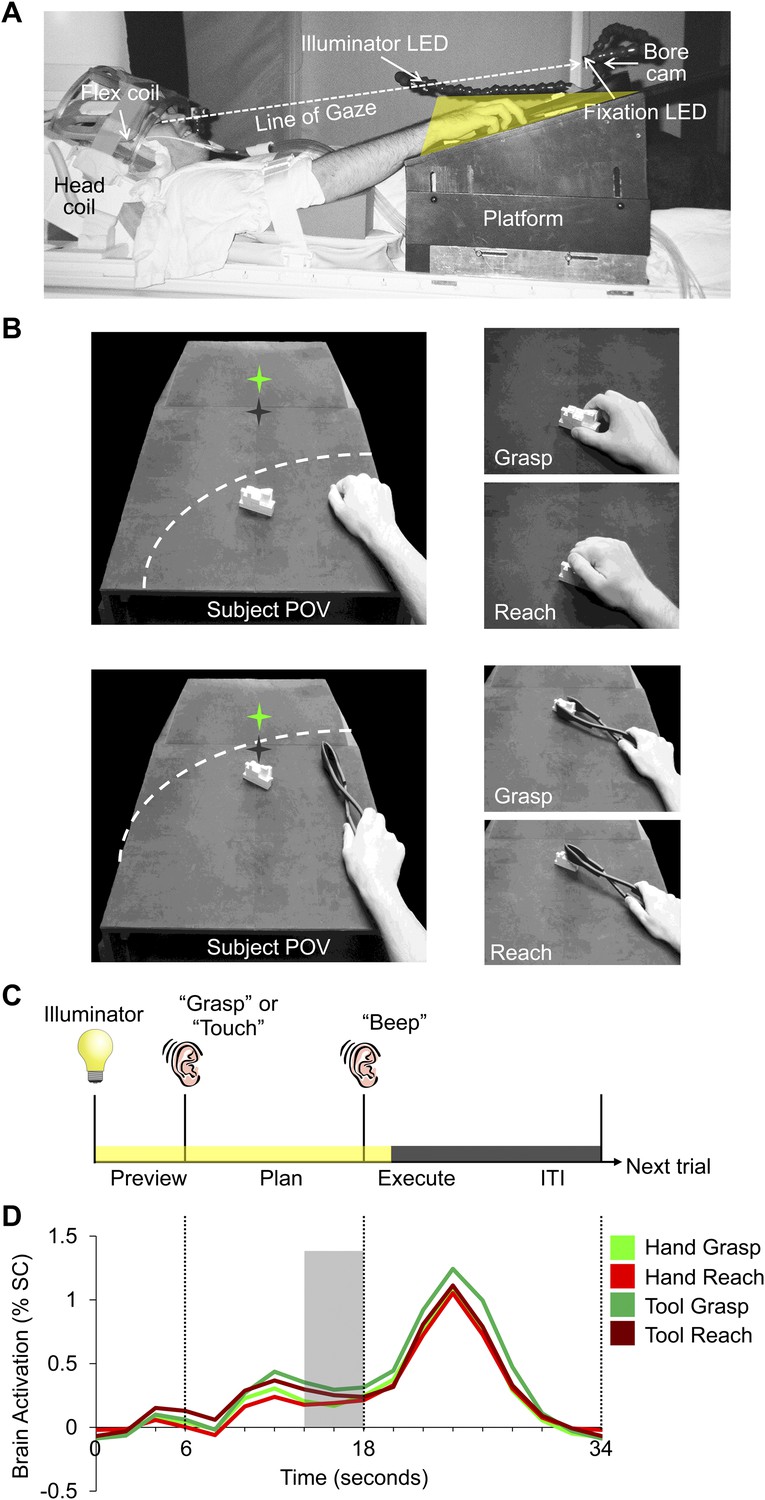
Experimental methods and evoked neural activity.
(A) Subject setup shown from side view. (B) (Left) experimental apparatus and target object shown from the subject’s point of view for experimental runs where either the hand (top) or reverse tool (bottom) were used. The location of the target object (white block) was switched between run types but did not change its position from trial-to-trial within a imaging run. Dashed line represents the participant’s arc of reachability for each run type. In both cases (left panels), the hand is shown at its starting location. Green star with dark shadow represents the fixation LED and its location in depth. (Right) Hand and tool positions during movements performed by the subject. (C) Timing of each event-related trial. Trials began with the 3D object being illuminated while the subject maintained fixation (Preview phase; 6 s). Subjects were then instructed via headphones to perform one of two movements: Grasp the object (‘Grasp’) without lifting it or Touch the object (‘Touch’), initiating the Plan phase portion of the trial. Following a fixed delay interval (12 s), subjects were cued (by an auditory ‘beep’) to perform the instructed movement (initiating the Execute phase) and then return to the starting location. 2 s after the Go cue, vision of the workspace was extinguished and participants waited for the following trial to begin (14-s intertrial interval, ITI). (D) Averaged fMRI activity from left dorsal premotor (PMd) cortex, time-locked to trial length. MVPA was performed using single fMRI trials in two ways: 1) based on the % signal change (SC) BOLD activation evoked for each single time point in the trial (time-resolved decoding), allowing us to pinpoint when predictive movement information was available and 2) based on a windowed average of the % SC BOLD activation in the 4 s (2 imaging volumes) prior to movement initiation (denoted by the gray shaded bar).
Figure 2

Frontoparietal brain areas selected for movement plan decoding.
Cortical areas that exhibited larger responses during movement preparation and/or execution than the preceding visual phase [(Plan + Execute) > 2*(Preview)] are shown as orange/yellow activation. Results calculated across all subjects (Random Effects GLM) are displayed on one representative subject’s inflated cortical hemispheres. The general locations of the selected ROIs are outlined in circles (actual ROIs were anatomically defined separately in each subject). Linked to each ROI is the corresponding % SC BOLD activity averaged across voxels, trials, and subjects within each ROI and plotted according to trial length. This time course activity clearly delineates the sustained preparatory responses that form prior to movement onset in each area. Vertical lines correspond to the onset of the Plan and Execute phases of each trial (from left to right). Sulcal landmarks are denoted by white lines (stylized according to the corresponding legend). ROI acronyms are spelled out in main text.
Figure 3 with 1 supplement
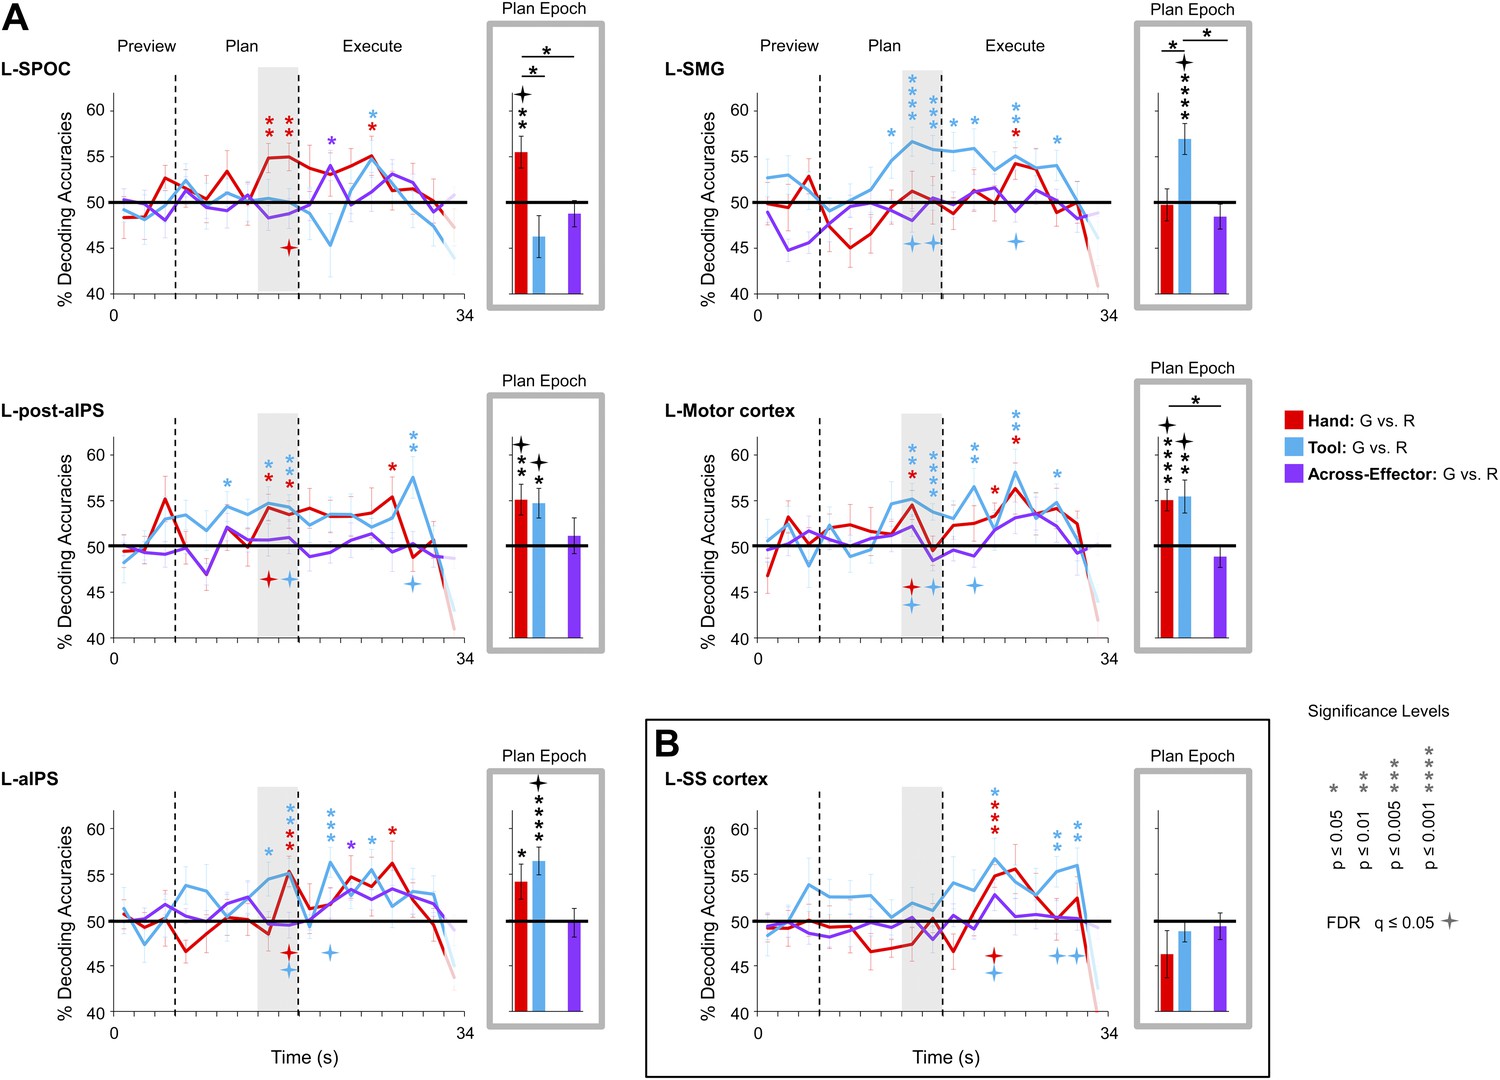
Separate movement plans for the hand and tool decoded from frontoparietal cortex.
Decoding accuracies are shown for each time point in the trial (time-resolved decoding) and for the Plan-epoch only, the latter based on a windowed average of the spatial activity patterns denoted by the gray shaded bars in the time-resolved decoding plots. In the time-resolved decoding plots, vertical lines correspond to the onset of the Plan and Execute phases of each trial (from left to right). For decoding accuracies discriminating grasp vs reach actions with the Hand (in red) and Tool (in blue) classifier training and testing was done using a single trial N-1 cross-validation approach. Across-effector decoding accuracies (in purple) were computed using all the available data and from training classifiers on Hand-G vs Hand-R trials and testing on Tool-G vs Tool-R trials and then averaging these values with the opposite train-and-test ordering, within each subject. (A) Areas of frontoparietal cortex that could decode movement plans with the hand and/or with the tool but not between hand and tool (i.e., no Across-effector decoding). (B) Decoding accuracies from the sensory control region, SS-cortex. Note that SS-cortex significantly decodes movements only following action onset (and not during planning). Error bars represent standard error of the mean (SEM) across subjects. Solid black horizontal lines are chance accuracy level (50%). Asterisks assess statistical significance with two-tailed t-tests across subjects with respect to 50%. Four-pointed stars assess statistical significance based on a false discovery rate (FDR) correction of q ≤ 0.05. Note also that in the time-resolved decoding plots, the color of each asterisk/star denotes which specific pair-wise discrimination is significant at each point in time. G: grasp; R: reach.
Figure 3—figure supplement 1
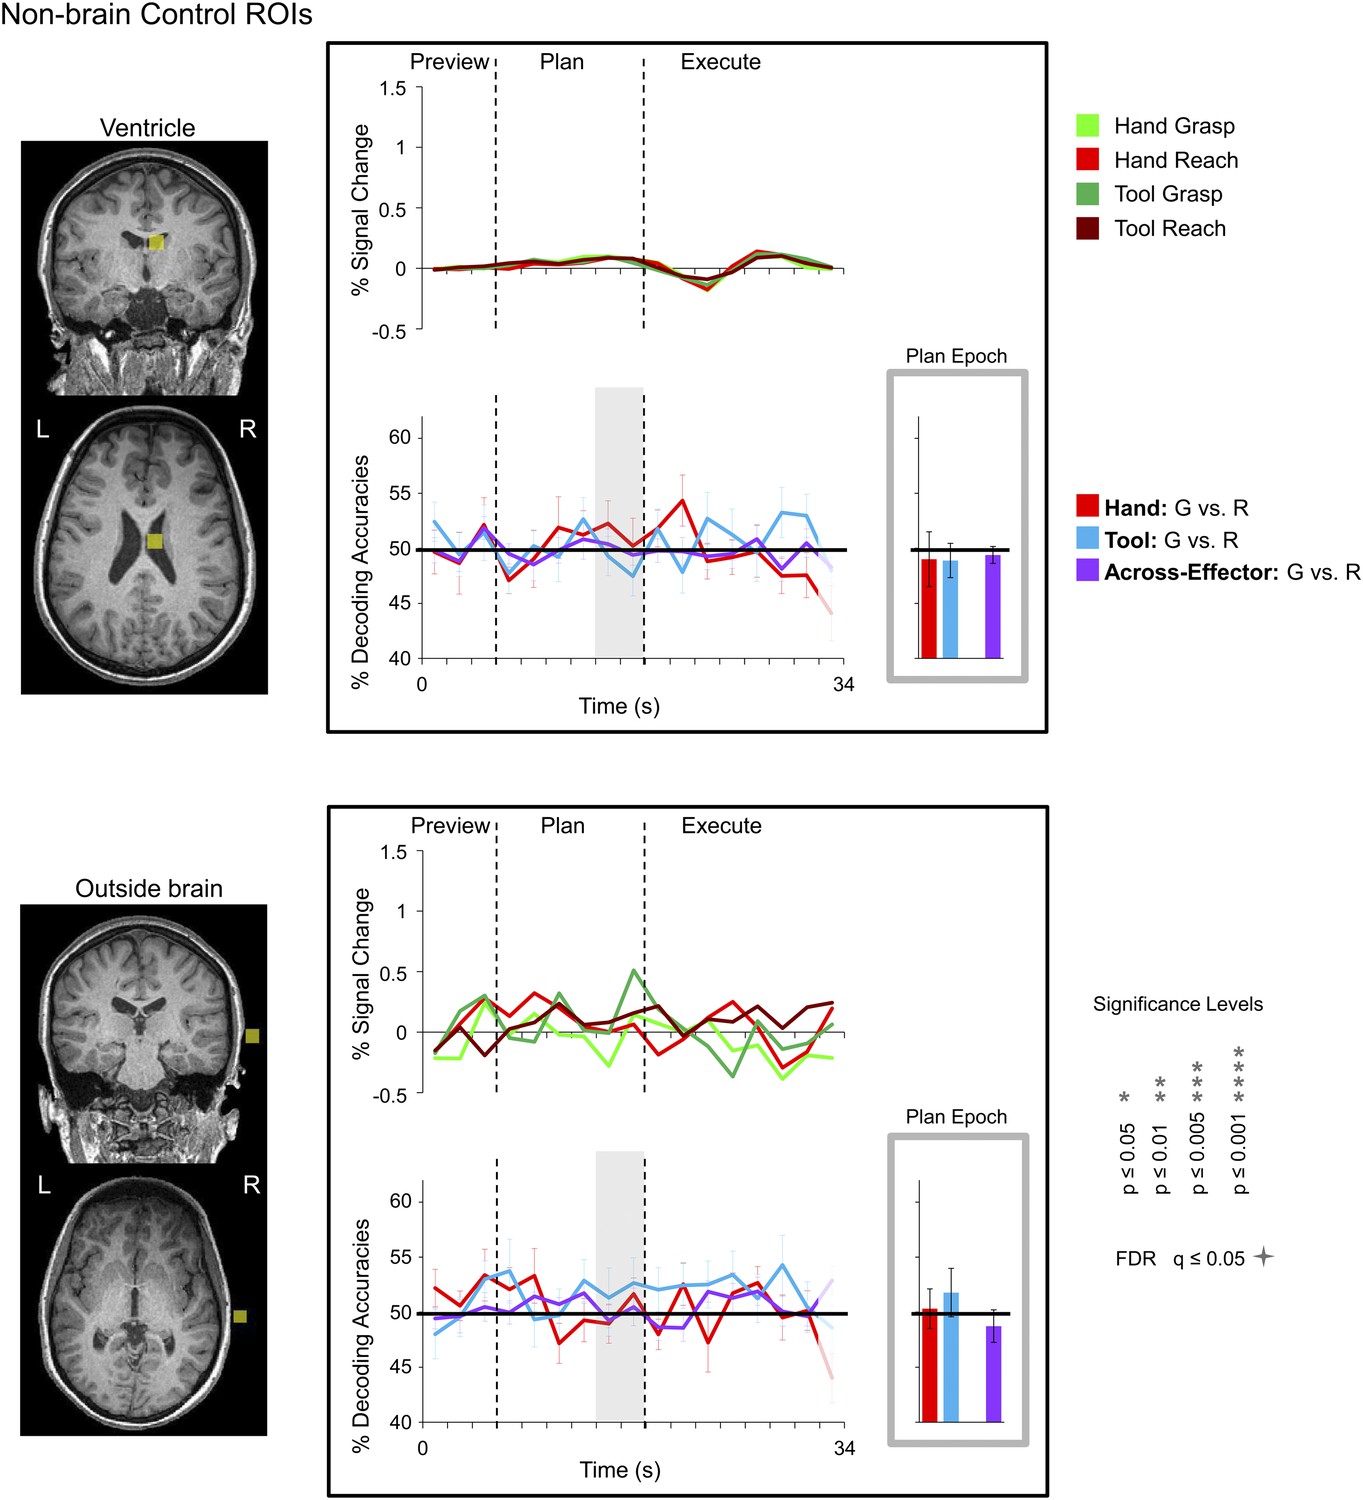
Classifier decoding accuracies in non-brain control regions.
(Left) Non-brain control ROIs defined in each subject (denoted in light yellow; example subject shown). (Right) Linked to each ROI is the % SC time-course activity and the time-resolved and plan-epoch decoding accuracies (computed and plotted the same as in Figure 3). Error bars represent standard error of the mean (SEM) across subjects. Solid black lines are chance accuracy level (50%). Note that no significant differences at any point in the trial were found with respect to 50% chance.
Figure 4 with 3 supplements
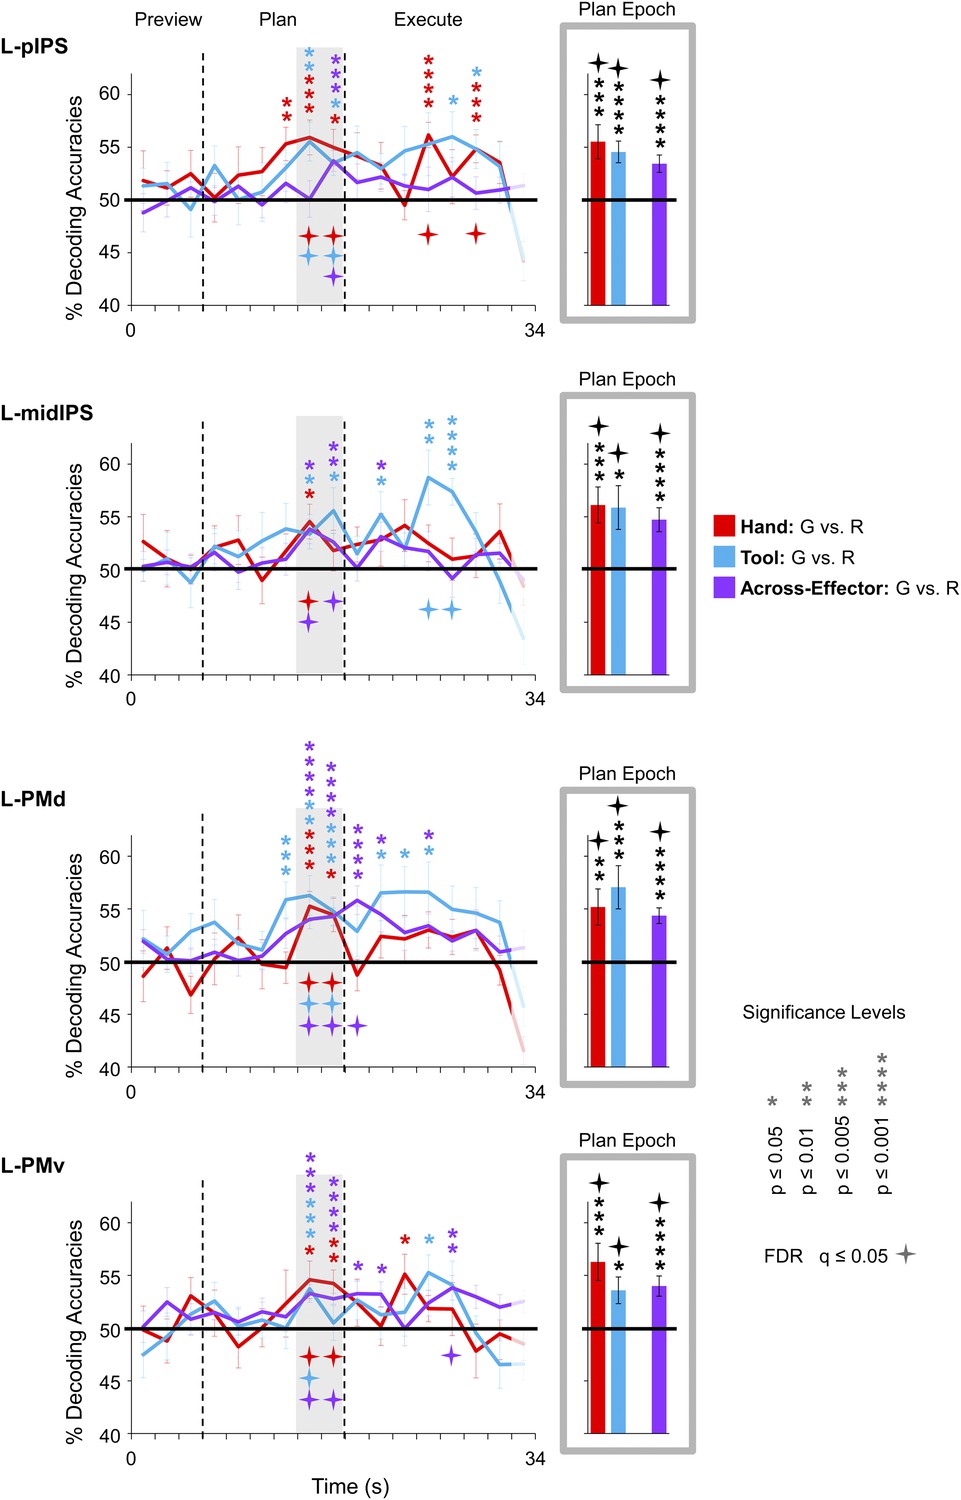
Shared movement plans for the hand and tool decoded from frontoparietal cortex.
Decoding accuracies are plotted and computed the same as in Figure 3. Significant across-effector decoding (purple traces) shows where and when the movement action (Grasp vs Reach) is being represented with some invariance to the acting effector (Hand vs Tool). See Figure 3 caption for format.
Figure 4—figure supplement 1

Time-resolved and plan-epoch decoding accuracies for across-effector classification, separated according to the direction of classifier training and testing.
Pink traces and bars denote accuracies that were computed by training classifiers to discriminate hand trials (Hand-G vs Hand-R) and testing on tool trials (Tool-G vs Tool-R). Light blue traces and bars denote accuracies that were computed by training classifiers to discriminate tool trials and testing on hand trials. As in Figures 3–6, across-effector accuracies were computed using all the available data. Error bars represent standard error of the mean (SEM) across subjects. Solid black horizontal lines are chance accuracy level (50%). Asterisks assess statistical significance with two-tailed t-tests across subjects with respect to 50%. Four-pointed stars assess statistical significance based on a FDR correction of q ≤ 0.05.
Figure 4—figure supplement 2
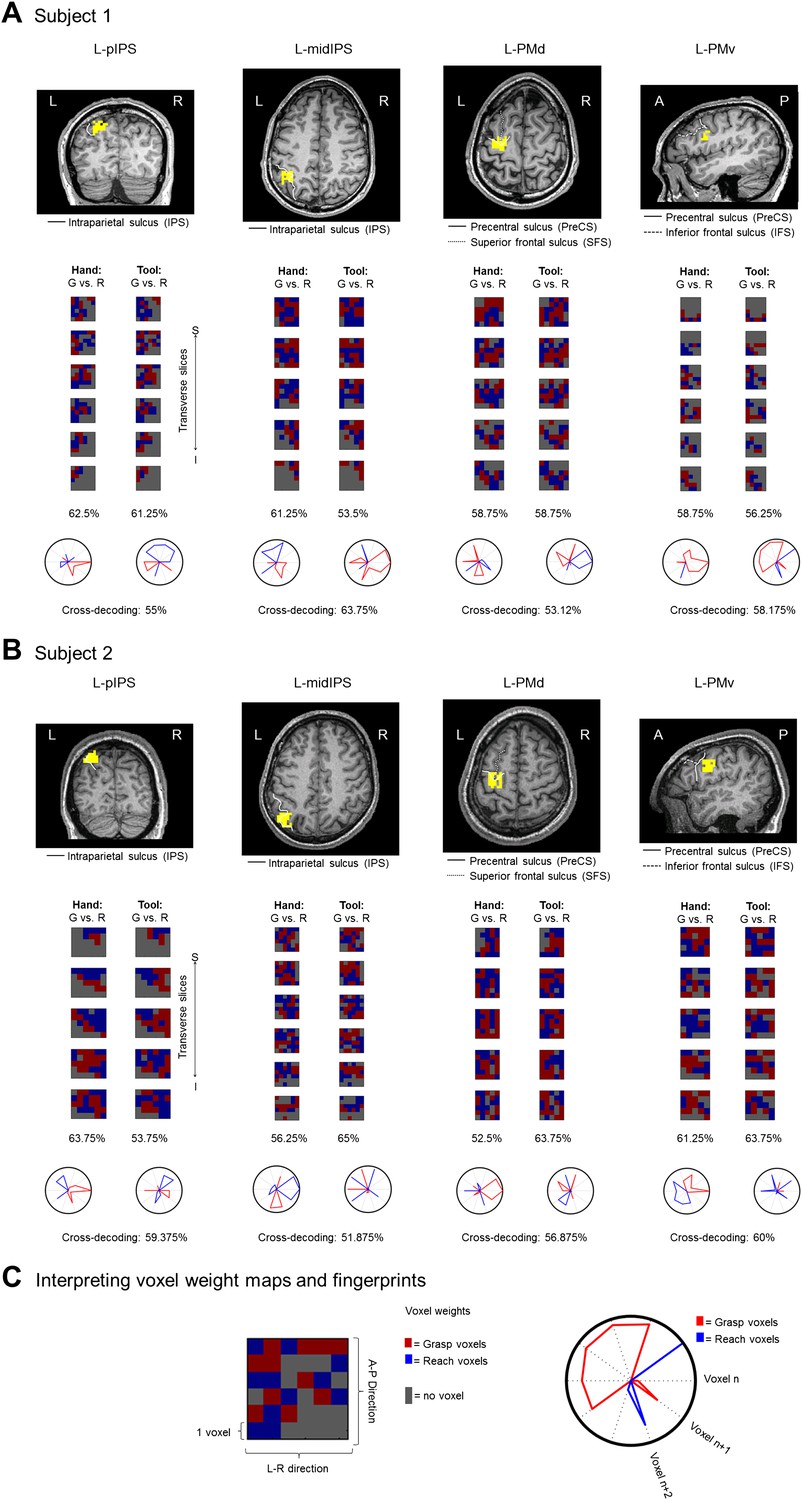
Voxel weight analyses for the plan-epoch activity in the cross-decoding ROIs (L-pIPS, L-midIPS, L-PMd, and L-PMv), shown for two representative subjects (in A and B).
(Top of A and B) ROIs (in yellow) overlayed on the transverse slices of subjects 1 (A) and 2 (B). (Below) Voxel weights for the trained SVM classifier for the plan-epoch (2 imaging volumes prior to movement initiation). Voxel weights are based on the single-shot train iterations using all the available data. Each column of boxes corresponds to one of the two pair-wise comparisons and each row of boxes corresponds to a transverse slice (3 mm thickness) through the ROI (see expanded box at bottom in (C) for legend; voxel size = 3 mm × 3 mm × 3 mm). The color of each voxel in each box denotes its relationship (weight) with the class label (as determined by the trained SVM discriminant function; see scale at bottom in (C) for voxel weight color coding). Positive and negative values (red and blue colors, respectively) denote a stronger weighting of a particular voxel towards one planned action vs the other (red = grasp-selective voxels, blue = reach-selective voxels). Gray patches denote the borders of the ROI. Accuracies below each column denotes the test accuracy for that specific pair-wise comparison in the subject (when averaged across the N train-and-test iterations) and shown at the very bottom, the test accuracies for the specific cross-decoding case (based on all the available data). The spatial arrangement of grasp- and reach-selective voxels indicates considerable local variability. (Bottom of A and B) Voxel weight fingerprints for the 10 most discriminative voxels within a ROI. For each ROI, the raw voxel weights across the two pair-wise comparisons were ordered and the top 10 voxels were selected (i.e., the same 10 discriminative voxels are shown in each plot for each ROI). Within each pair-wise comparison, voxel weights for the common voxel set were normalized to 1 and their magnitudes were plotted around the polar axis (each axis of the polar plot represents a single voxel). The direction of the voxel weights is encoded by the line color: Positive (grasp-specific) voxel weights are plotted in red and the negative (reach-specific) weights are plotted in blue, congruent with the ROI voxel weight maps. L: left; R: right; A: anterior; P: posterior; S: superior; I=inferior.
Figure 4—figure supplement 3
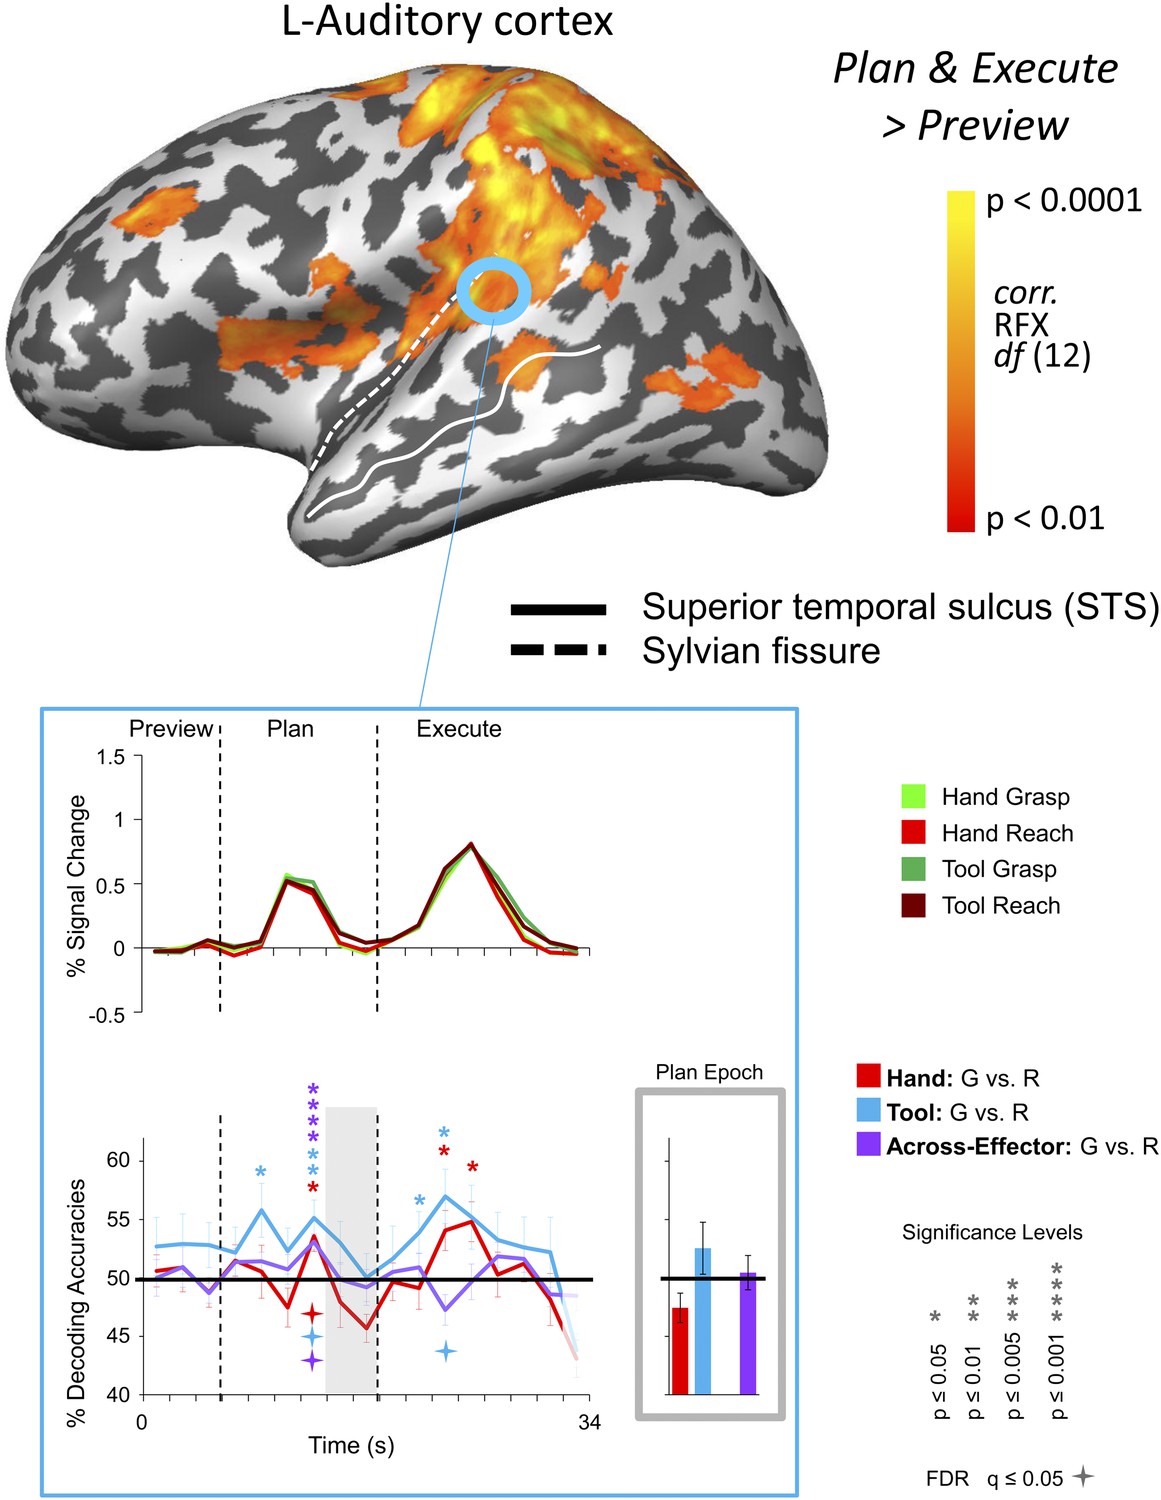
Movement instructions decoded from transient (but not sustained) responses in auditory cortex.
(Top) Left auditory cortex activity localized by the same contrast used to identify the frontoparietal sensorimotor network [(Plan + Execute) > 2*(Preview)]. Results calculated across all subjects (Random Effects GLM) are displayed on one representative subject's inflated left hemisphere. The general location of Heschl's gyrus is outlined in a blue circle (actual ROIs were anatomically defined separately in each subject according to stringent anatomical criteria, see main manuscript text). (Below) % SC time-course activity and the time-resolved and plan-epoch decoding accuracies from left auditory cortex. Error bars represent standard error of the mean (SEM) across subjects. Solid black lines are chance accuracy level (50%). Asterisks assess statistical significance with two-tailed t-tests across subjects with respect to 50%. Four-pointed stars assess statistical significance based on a FDR correction of q ≤ 0.05. Note that above chance auditory cue decoding transiently arises halfway through the Plan-phase (consistent with a discrimination of the ‘Grasp’ and ‘Touch’ auditory commands delivered to subjects via headphones at the onset of the Plan-phase) but, importantly, not during the pre-defined plan-epoch (denoted by gray bar).
Figure 5

Hand and Tool movement plans decoded from the localizer-defined t-aIPS.
(A) Block-design protocol and experimental timing of the Bodies, Objects, and Tools (BOT) localizer. (B) Overlay of tool and anterior parietal ROIs. The Motor experiment-defined anterior parietal ROIs (post. aIPS and aIPS; defined by the [(Plan + Execute) > 2*(Preview)] contrast) and the Localizer experiment-defined anterior parietal ROI (t-aIPS; defined by the [(Tools > Scrambled) AND (Tools > Bodies) AND (Tools > Objects)] conjunction contrast) are superimposed on the transverse anatomical slices of three representative subjects. Across all subjects we found a reasonable degree of overlap between the Motor and Localizer experiment-defined anterior parietal ROIs. (C) % SC time-course activity and time-resolved and plan-epoch decoding accuracies from t-aIPS. See Figure 3 caption for format.
Figure 6
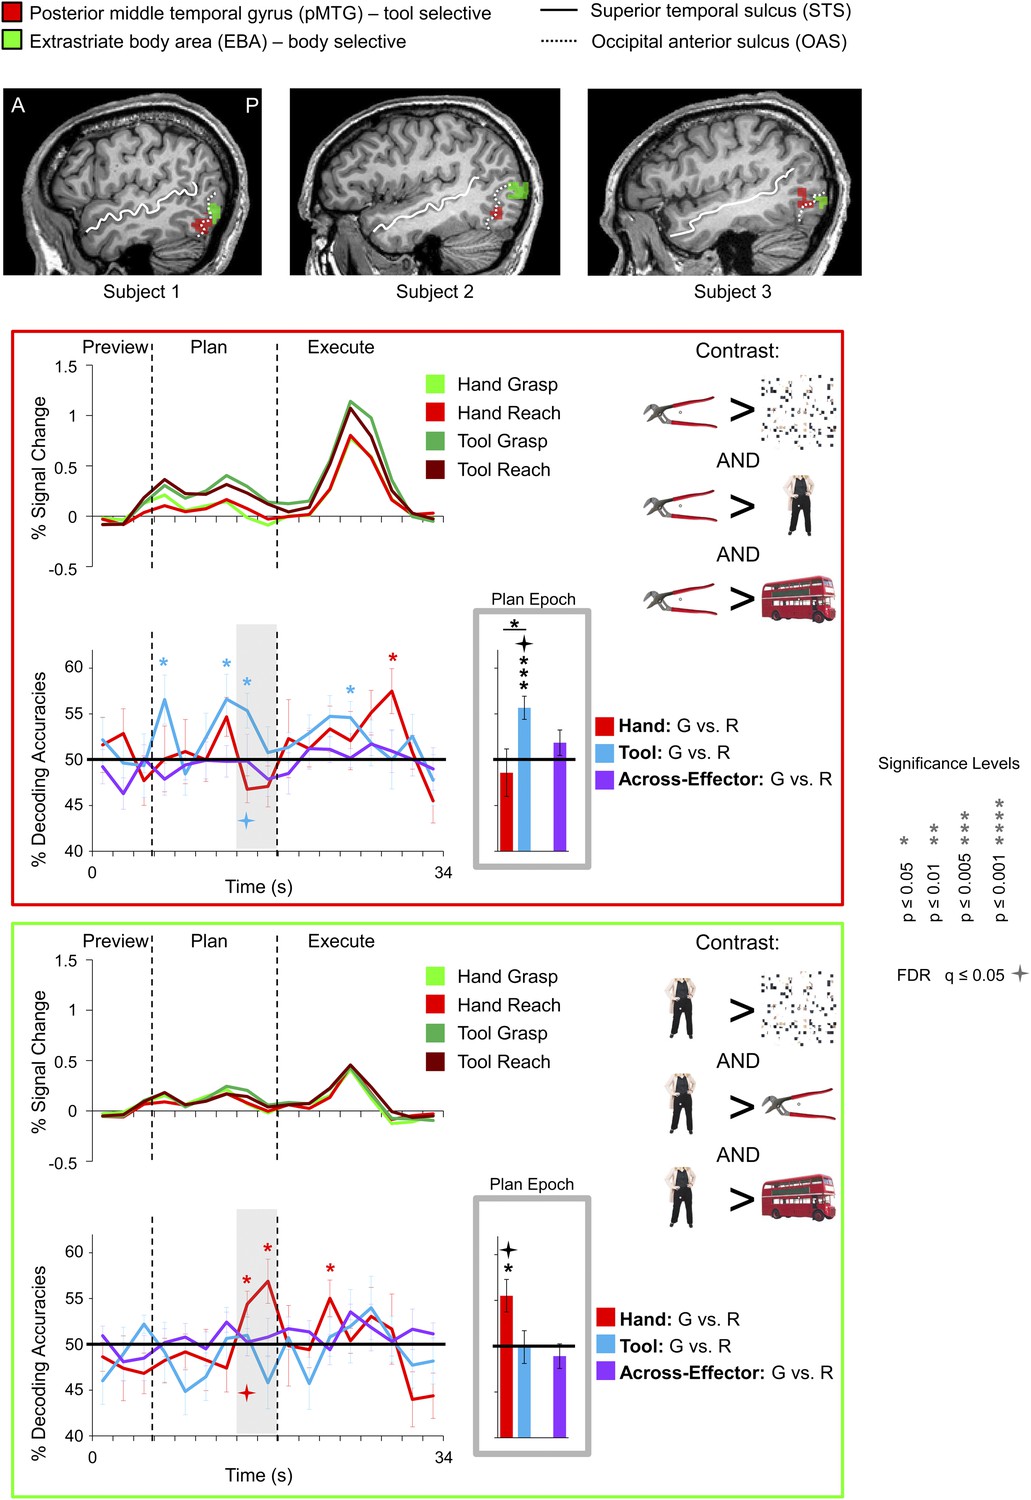
Tool and hand movement plans decoded from the localizer-defined pMTG and EBA, respectively.
(Top) The pMTG (in red) and EBA (in green) are shown in the same three representative subjects as in Figure 5. pMTG was defined using the conjunction contrast of [(Tools > Scrambled) AND (Tools > Bodies) AND (Tools > Objects)] in each subject. EBA was defined using the conjunction contrast of [(Bodies > Scrambled) AND (Bodies > Tools) AND (Bodies > Objects)]. (Below) % SC time-course activity and time-resolved and plan-epoch decoding accuracies shown for pMTG (bordered in red) and EBA (bordered in green). See Figure 3 caption for format.
Figure 7
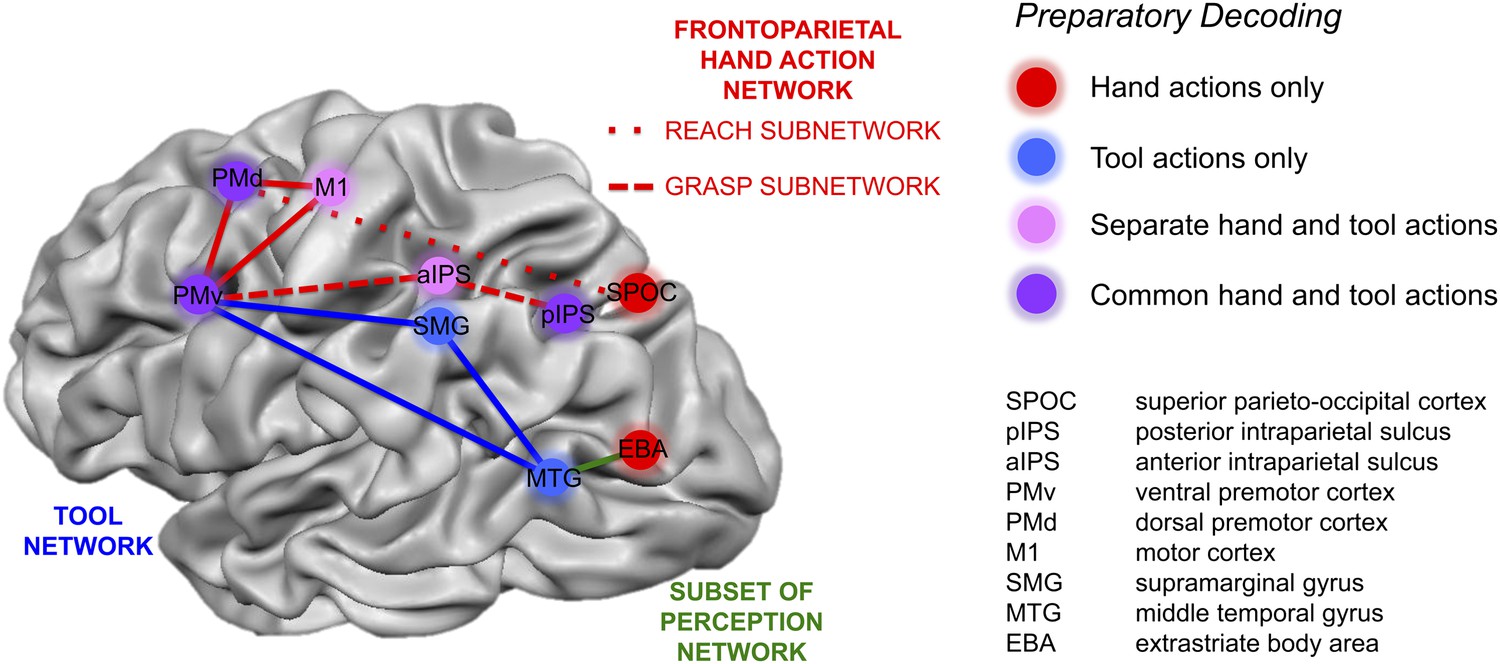
Summary of action plan decoding in the human brain for hand and tool movements.
Pattern classification revealed a wide range of activity profiles across motor and sensory cortices within networks implicated in hand actions, tool understanding, and perception. Some regions (SPOC and EBA) coded planned actions with the hand but not the tool (areas in red). Some regions (SMG and MTG) coded planned actions with the tool but not the hand (areas in blue). Other regions (aIPS and M1) coded planned actions with both effectors (areas in pink) but did so using different neural representations. A final set of brain areas (pIPS, PMd and PMv) instead coded the final type of action to be performed with invariance as to whether the hand or tool was to be used (areas in purple).
Author response image 1
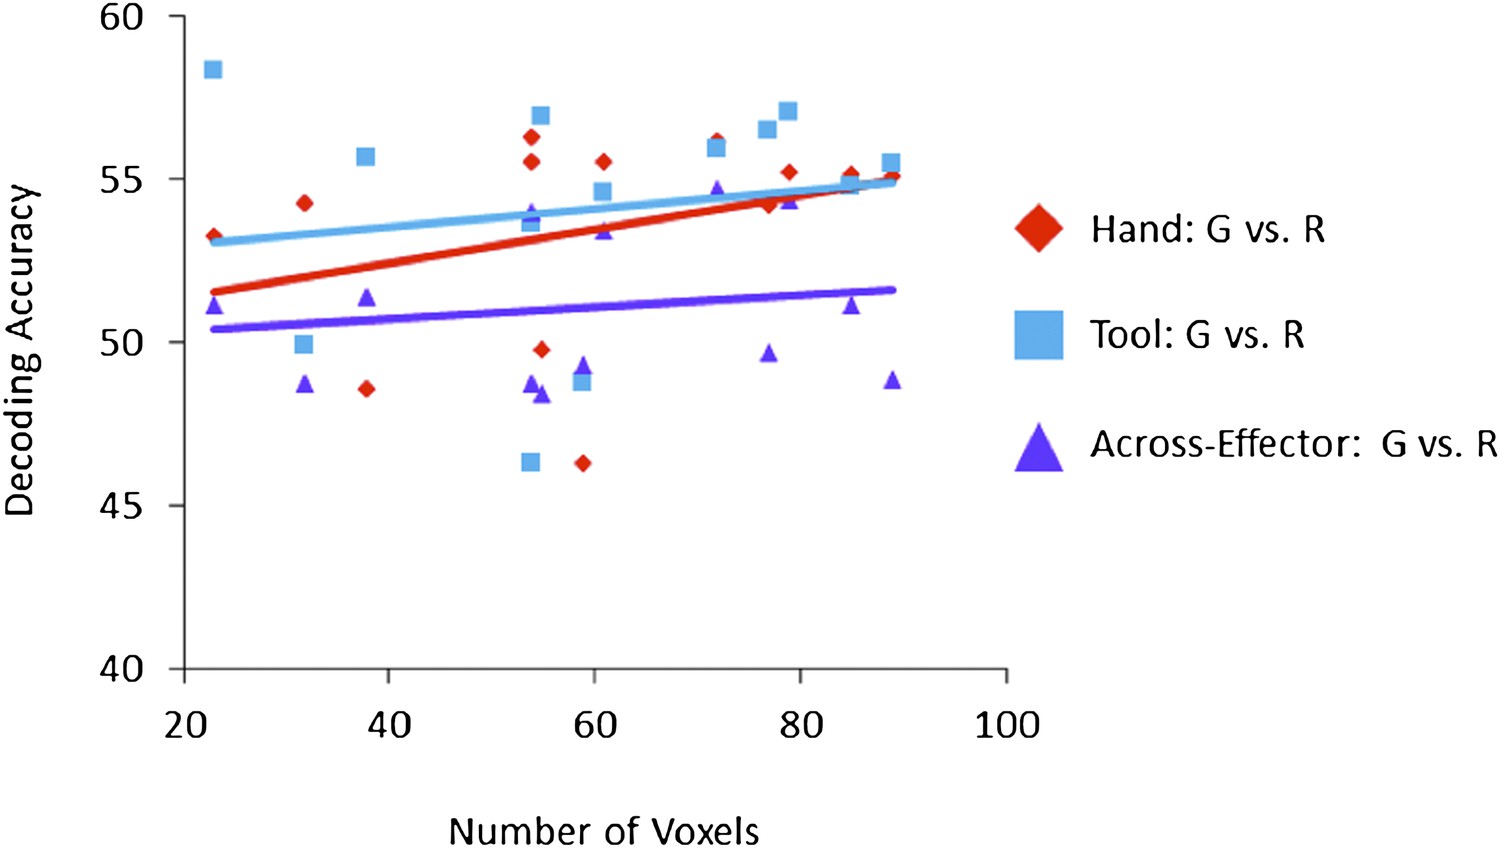
Correlation between mean Voxel Number and resulting mean Decoding Accuracy (shown for each ROI (N=13) and each of the three pair-wise comparisons for the Plan-Epoch).
Pearson correlation between Voxel Number and Hand Plan Epoch decoding accuracies (red diamond symbols): r2=0.108, p=0.272; Pearson Correlation between Voxel Number and Tool Plan Epoch decoding accuracies (blue square symbols): r2=0.025, p=0.602; Pearson Correlation between Voxel Number and Across-Effector Plan Epoch decoding accuracies (purple triangle symbols): r2=0.026, p=0.598.
Tables
Table 1
ROIs with corresponding Talairach coordinates (mean x, y, and z centre of mass and standard deviations) and sizes
| ROI name | Tailarach coordinates | ROI size | ||||||
|---|---|---|---|---|---|---|---|---|
| x | y | z | std x | std y | std z | mm3 | Nr voxels | |
| Parieto-frontal ROIs | ||||||||
| L Superior parieto-occipital cortex (SPOC) | −8 | −75 | 29 | 2.4 | 2.9 | 3.6 | 1469 | 54 |
| L Posterior intraparietal sulcus (pIPS) | −22 | −68 | 45 | 3.4 | 3.7 | 4.1 | 1640 | 61 |
| L Middle intraparietal sulcus (midIPS) | −32 | −56 | 46 | 4.4 | 4 | 3.9 | 1943 | 72 |
| L Posterior anterior intraparietal sulcus (post. aIPS) | −42 | −49 | 43 | 3.6 | 4.3 | 3.9 | 2290 | 85 |
| L Anterior intraparietal sulcus (aIPS) | −42 | −40 | 42 | 4.2 | 4.3 | 4.2 | 2067 | 77 |
| L Supramarginal gyrus (SMG) | −56 | −35 | 33 | 3.7 | 3.7 | 4 | 1479 | 55 |
| L Motor cortex | −38 | −29 | 48 | 4.3 | 4.3 | 4.3 | 2407 | 89 |
| L Dorsal premotor (PMd) cortex | −26 | −14 | 52 | 4.2 | 3.8 | 4.1 | 2135 | 79 |
| L Ventral premotor (PMv) cortex | −52 | 3 | 15 | 3.3 | 3.8 | 3.1 | 1460 | 54 |
| L Somatosensory (SS) cortex | −39 | −40 | 48 | 2.8 | 2.8 | 2.9 | 1592 | 59 |
| Localizer-defined ROIs | ||||||||
| L tool-anterior intraparietal sulcus (t-aIPS) | −41 | −42 | 46 | 3.3 | 3.4 | 4.2 | 1038 | 38 |
| L Posterior middle temporal gyrus (pMTG) | −53 | −57 | −3 | 4.1 | 3.1 | 3.3 | 621 | 23 |
| L Extrastriate body area (EBA) | −49 | −72 | 1 | 2.8 | 3.6 | 3.7 | 851 | 32 |
-
Mean ROI sizes across subjects from ACPC data (in mm3 and functional voxels). Std = standard deviation.
Download links
A two-part list of links to download the article, or parts of the article, in various formats.
Downloads (link to download the article as PDF)
Open citations (links to open the citations from this article in various online reference manager services)
Cite this article (links to download the citations from this article in formats compatible with various reference manager tools)
Decoding the neural mechanisms of human tool use
eLife 2:e00425.
https://doi.org/10.7554/eLife.00425


