Structural analyses at pseudo atomic resolution of Chikungunya virus and antibodies show mechanisms of neutralization
- Purdue University, United States
- National Institute of Allergy and Infectious Diseases, National Institutes of Health, United States
- Washington University School of Medicine, United States
Figures
Figure 1
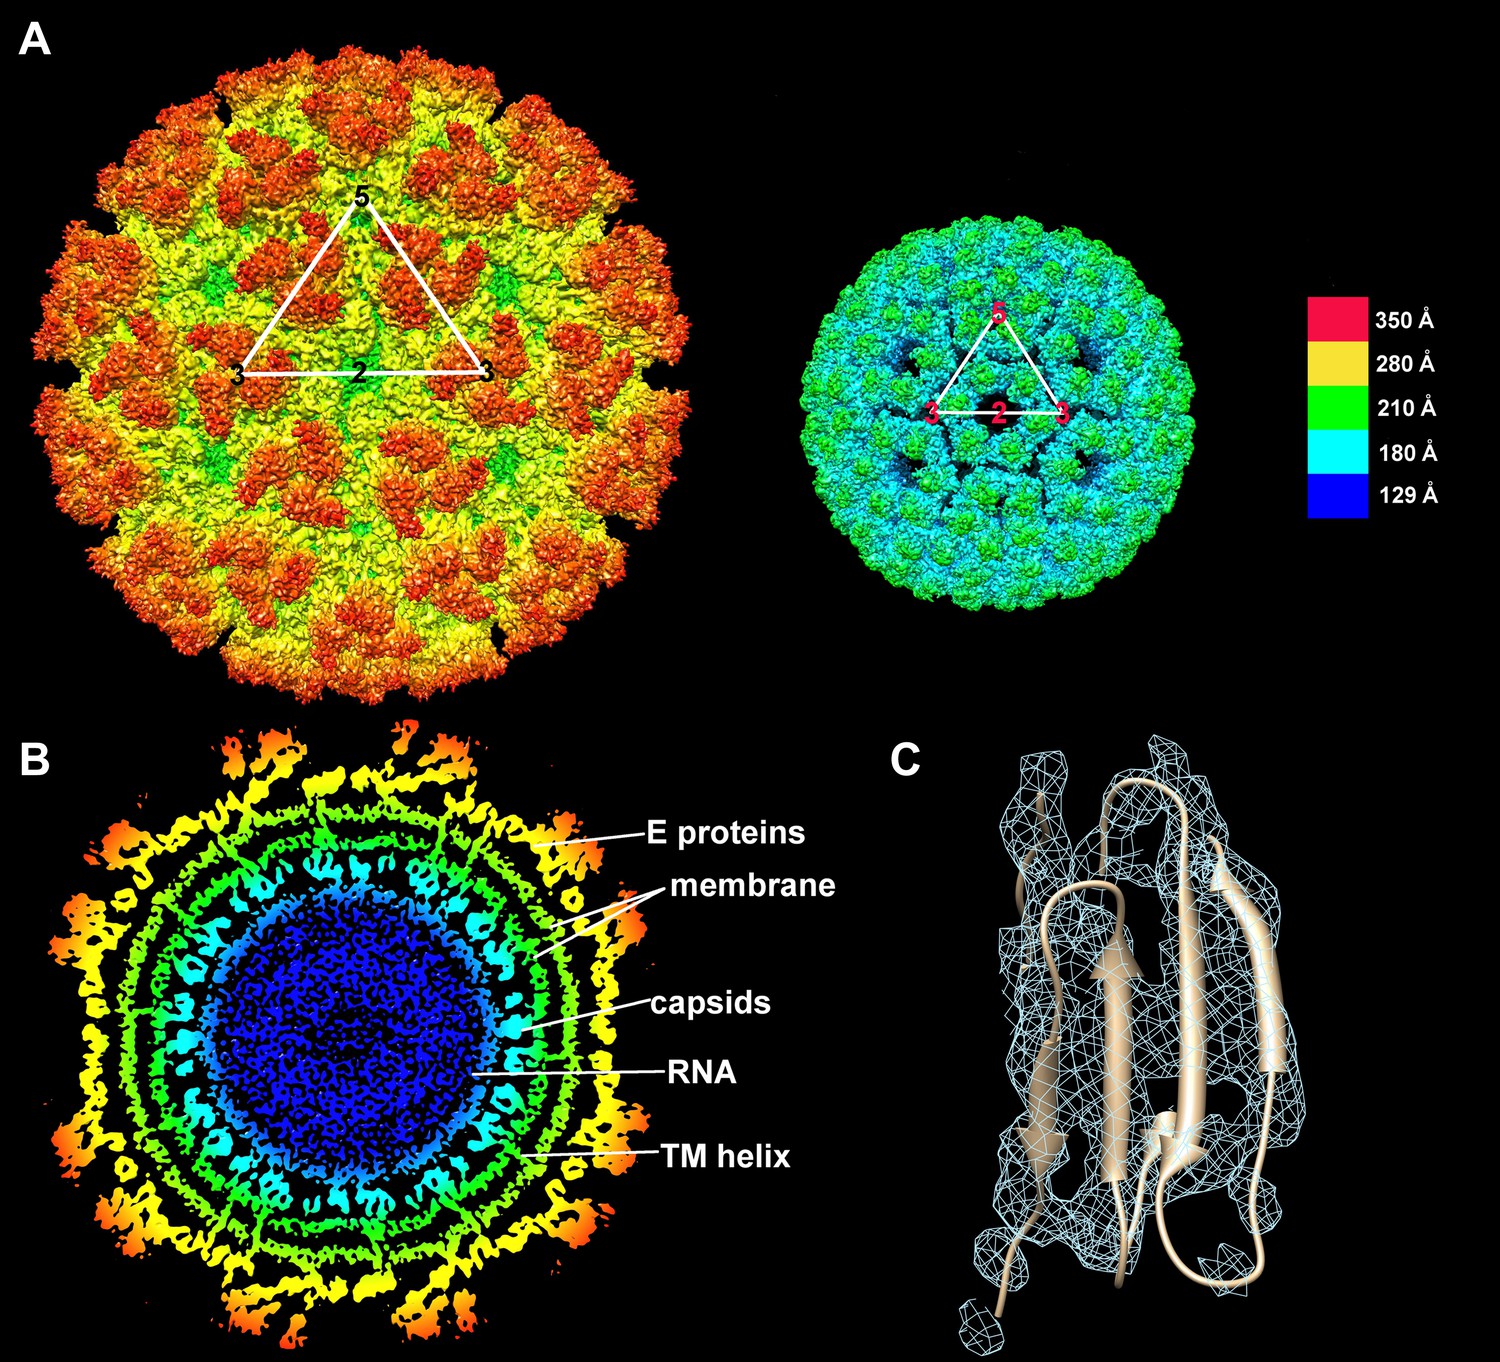
Structure of the CHIK VLPs.
(A) Surface-shaded figure of ectodomain (left) and surface-shaded figure of nucleocapsid (right), colored according to the radial distance from the center of the virus. White triangles indicate one icosahedral asymmetric unit. (B) Cross-section of the virus showing density above 1.5 σ also colored according to the radial distance from the center of the virus. (C) Resolution of β-strands in the E1 domain III.
Figure 2

Diagrammatic representation of contacts between amino acid residues in adjacent subunits.
(A) Diagrammatic organization of the E1 and E2 subunits according to T = 4 icosahedral symmetry. The white numbers show the sequence in which the four independent subunits were generated. The black capital letters indicate the sequence of generating seven of the icosahedral asymmetric units. Icosahedral symmetry elements are shown as filled triangles and ellipses. Quasi-symmetry elements are shown as red outlined triangles and ellipses. (B) Contacts between the E1 (blue) and E2 (green) molecules. (C) Contacts between NCPs. (B) and (C) show the number of contacts between the indicated molecules. The quasi T = 4 related positions #1, #2, #3 and #4 are indicated, prefixed by their icosahedral symmetry identification A, B, C and D. The center of the “i3” icosahedral spike is indicated by a filled red triangle and the center of the “q3” quasi-3-fold spike is indicated by an outlined red triangle.
Figure 3
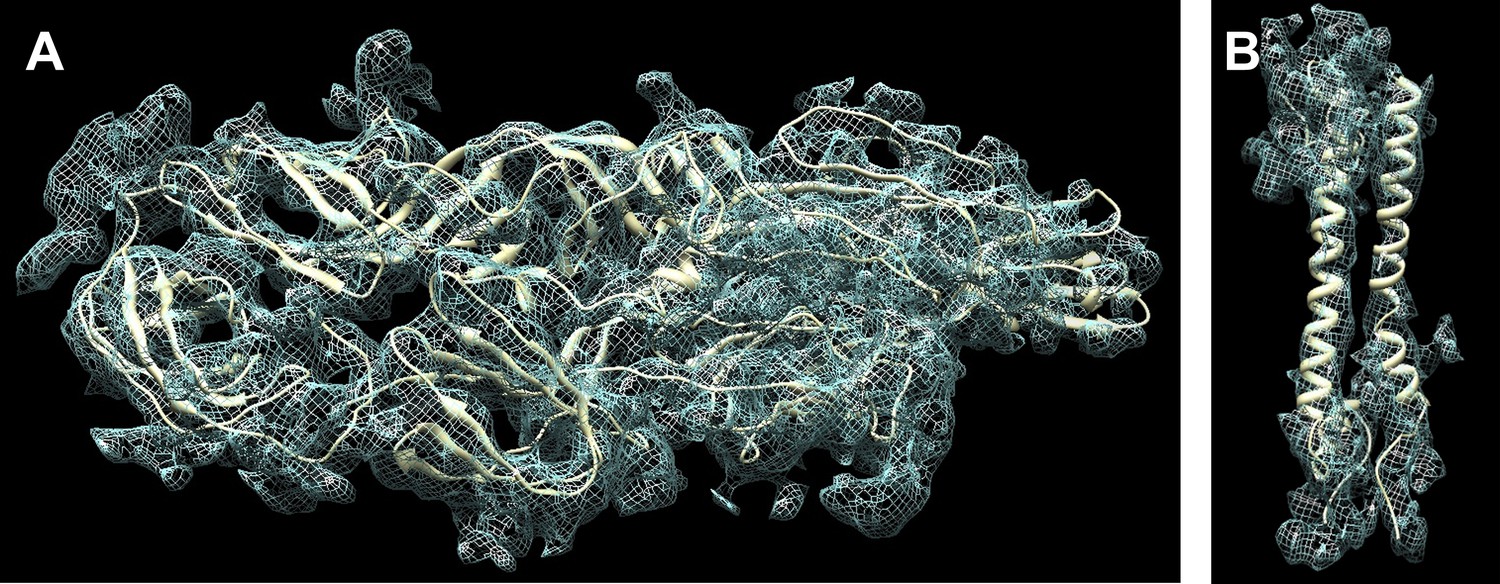
Fit of the atomic structure into the cryoEM density.
(A) Fit of the E1E2 heterodimer, (B) Fit of the capsid protein. The quasi equivalent subunit closest to the icosahedral 5-fold axis was chosen for display.
Figure 4
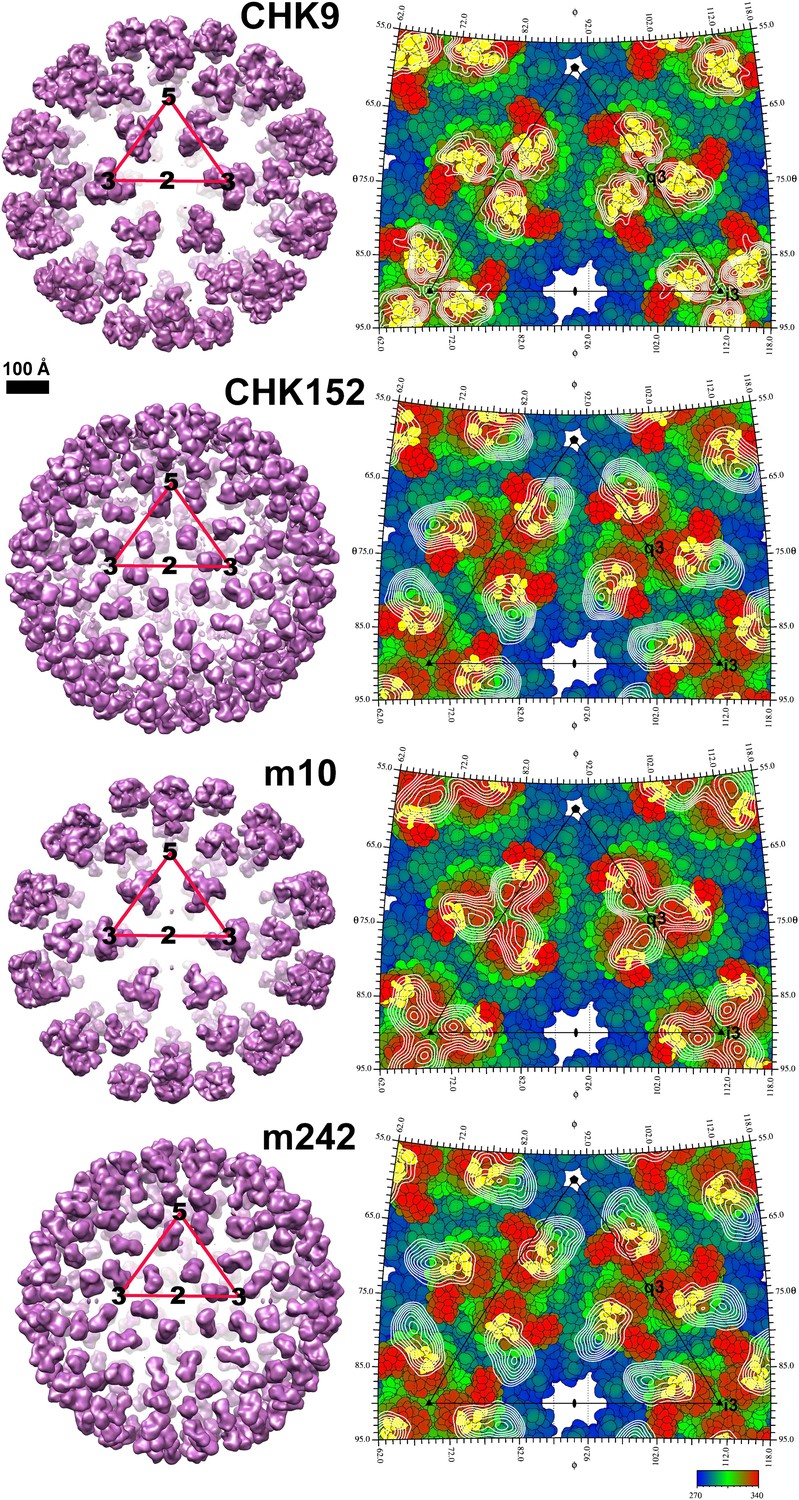
CHIKV VLP Fab complexes.
Right: “Difference maps” showing the surface structure of the Fab molecules. The difference maps were produced by setting all density within 1.7 Å of an atom in the VLP structure to zero. Left: “Road maps” showing the projected surfaces of the VLP-Fab complexes for one (triangular) icosahedral asymmetric unit. The coloring is according to the radial distance of the surface from the center of the VLP. The footprints of the Fabs are shown in yellow. The radial projection of the whole Fab molecules onto the surface of the VLP is shown with white contours representing the height of the projected density. The mosaic background shows the amino acids that form the viral surface.
Figure 5

Inhibition of CHIKV by IgG and Fab fragments.
Neutralizing activity of intact MAb and Fab fragments against CHIKV is shown for (A) CHK-9, (B) CHK-152, (C) m10 and (D) m242, as determined by the reduction in the number of focus-forming units (FFU) on Vero cells. MAbs and Fab fragments were mixed with 100 FFU of infectious CHIKV (strain La Reunion 2006 OPY-1) for one hour at 37°C before infecting Vero cells. Each data point is the average of three independent experiments performed in triplicate. Error bars represent standard deviations.
Figure 6

Fit of the Fab structures (blue) into the cryoEM density “difference” maps (hatched grey surface) calculated as described for Figure 4.
Shown also is how the Fab molecules bind to the E1(red)-E2 (green) heterodimer.
Figure 7
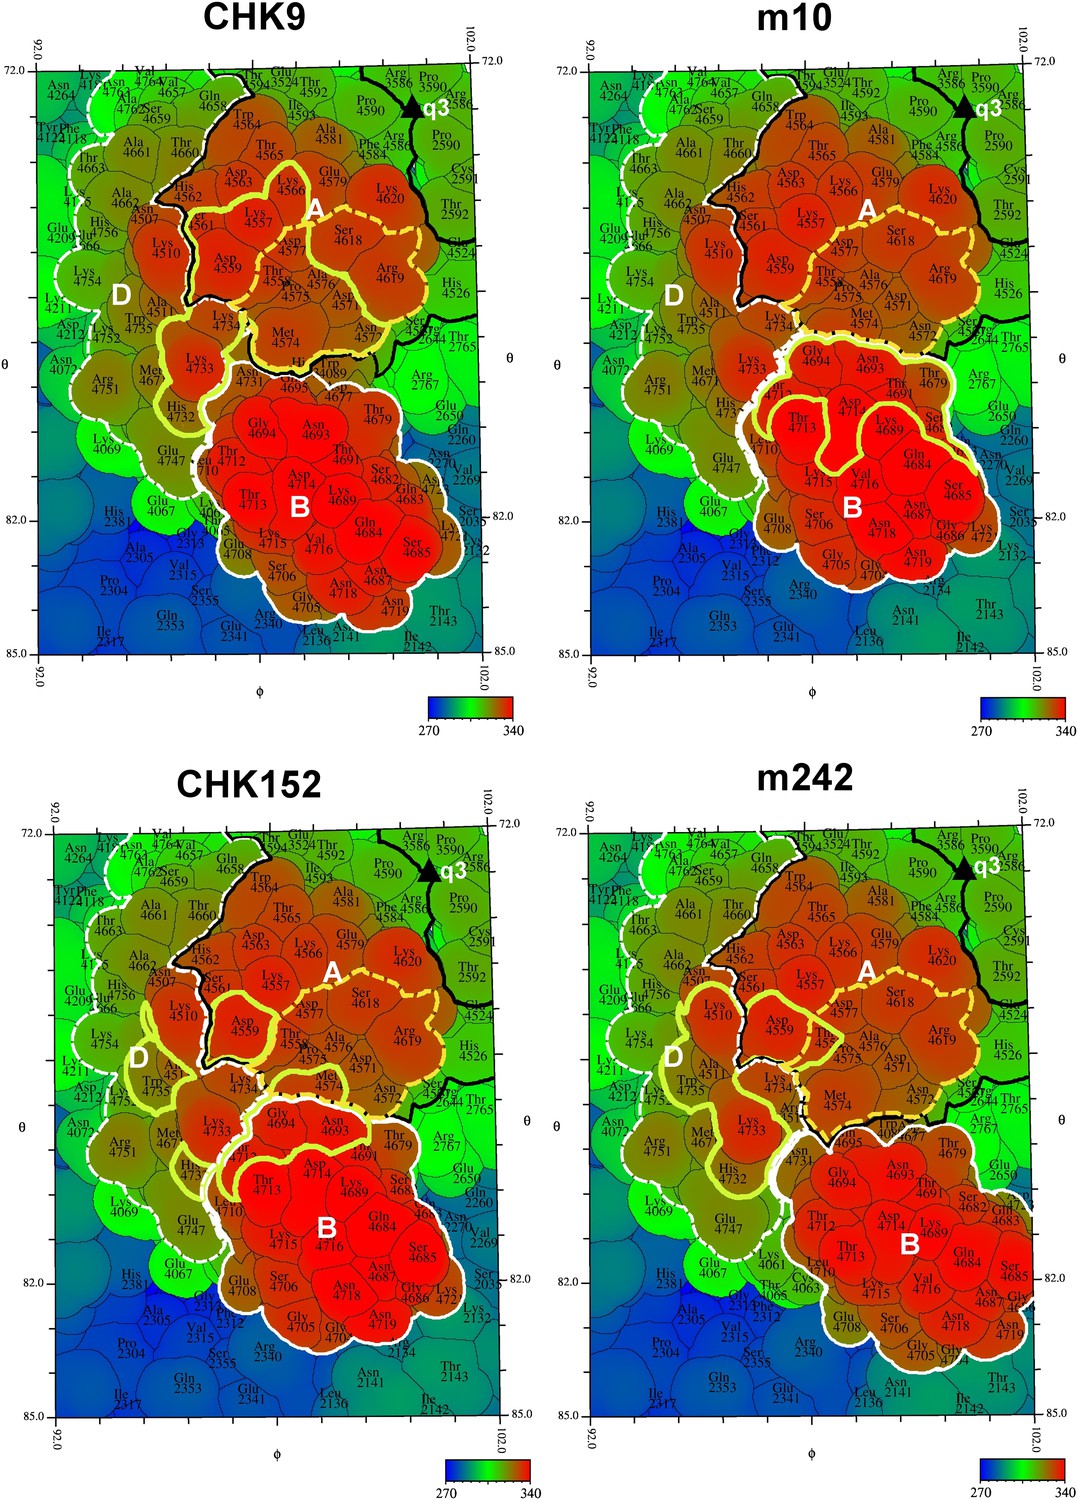
“Road maps” showing footprint of four neutralizing Fabs on the VLP surface at position #3 as defined in Figure 2.
In order to differentiate between amino acids in different quasi 3-fold related subunits, their identity is defined as the amino acid sequence number in E1 + 2000, 3000, and 4000, and in E2 + 2500, 3500, and 4500 for positions #2, 3, and 4, respectively (see Figure 2). The surface is colored according to radial distance from the center of the VLP. The A, B, and D domains of E2 are bounded by a black, white and dashed white line, respectively. Residues in the putative receptor binding site on domain A of E2 are bounded by a yellow dashed line. The footprint of the Fabs onto the VLP surface is outlined in yellow.
Tables
Table 1
Quality of fitting the atomic structural fragments into the cryoEM density
| A) Average height of the densities at the atomic positions (sumf) (Rossmann et al., 2001) on fitting the E1E2 heterodimer CHIKV structure into the cryoEM map at four quasi equivalent positions | |||||||||||
| All atoms | T = 4 fitting | Independent domain fitting | |||||||||
| #1 | #2 | #3 | #4 | Average | #1 | #2 | #3 | #4 | Average | ||
| E1* | I | 16.1 | 15.8 | 17.0 | 17.7 | 16.6 | 18.2 | 17.0 | 18.5 | 19.9 | 18.5 |
| II | 15.7 | 17.2 | 18.8 | 16.7 | 17.0 | 18.0 | 18.6 | 19.0 | 18.5 | 18.6 | |
| III | 15.7 | 14.2 | 15.2 | 18.0 | 15.7 | 18.7 | 15.9 | 18.2 | 20.7 | 18.3 | |
| E2* | A | 15.5 | 18.0 | 19.0 | 17.5 | 17.4 | 18.8 | 17.8 | 19.9 | 19.4 | 18.8 |
| B | 10.0 | 9.4 | 9.6 | 9.6 | 9.8 | 10.9 | 11.3 | 11.7 | 12.4 | 11.7 | |
| C | 15.3 | 15.4 | 19.0 | 19.1 | 16.8 | 21.0 | 19.9 | 20.2 | 22.4 | 20.5 | |
| D | 13.3 | 16.4 | 15.8 | 16.1 | 15.4 | 16.4 | 17.2 | 16.0 | 16.8 | 16.5 | |
| Average | 14.9 | 15.8 | 17.0 | 16.8 | 16.1 | 17.8 | 17.3 | 18.2 | 19.0 | 18.1 | |
| Main chain atoms only | T = 4 fitting | Independent domain fitting | |||||||||
| #1 | #2 | #3 | #4 | Average | #1 | #2 | #3 | #4 | Average | ||
| E1* | I | 20.5 | 18.4 | 21.5 | 22.9 | 20.8 | 23.2 | 21.6 | 22.6 | 26.3 | 23.4 |
| II | 17.0 | 20.9 | 23.0 | 20.2 | 20.3 | 21.7 | 23.3 | 23.5 | 22.8 | 22.8 | |
| III | 18.9 | 15.3 | 17.5 | 22.3 | 18.5 | 22.3 | 17.9 | 22.6 | 26.6 | 22.4 | |
| E2* | A | 16.5 | 21.1 | 22.2 | 19.4 | 19.8 | 22.0 | 20.3 | 23.4 | 22.6 | 22.1 |
| B | 10.7 | 9.4 | 9.9 | 10.1 | 10.0 | 10.8 | 11.2 | 13.0 | 13.4 | 12.1 | |
| C | 18.7 | 19.5 | 27.4 | 26.9 | 23.1 | 27.7 | 27.1 | 27.4 | 30.8 | 28.3 | |
| D | 13.4 | 18.7 | 18.5 | 18.5 | 17.3 | 19.4 | 19.8 | 19.1 | 19.0 | 19.3 | |
| Average | 16.5 | 17.6 | 20.0 | 20.0 | 18.5 | 21.0 | 20.2 | 21.7 | 23.1 | 21.5 | |
| B) Average height of the densities at the atomic positions (sumf) (Rossmann et al., 2001) on fitting the CHIKV homology model of the capsid protein into the cryoEM map at the four quasi equivalent positions | |||||||||||
| All atoms | T = 4 fitting | Independent domain fitting | |||||||||
| #1 | #2 | #3 | #4 | Average | #1 | #2 | #3 | #4 | Average | ||
| D1† | 14.9 | 13.3 | 13.9 | 16.1 | 14.6 | 16.1 | 14.6 | 15.4 | 17.3 | 15.8 | |
| D2† | 17.0 | 17.4 | 18.1 | 18.1 | 17.6 | 18.3 | 19.1 | 17.4 | 19.0 | 18.6 | |
| Average | 16.0 | 15.4 | 16.0 | 17.2 | 16.1 | 17.4 | 17.1 | 16.5 | 18.2 | 17.3 | |
| Main chain atoms only | T = 4 fitting | Independent domain fitting | |||||||||
| #1 | #2 | #3 | #4 | Average | #1 | #2 | #3 | #4 | Average | ||
| D1† | 18.5 | 16.5 | 17.8 | 18.9 | 17.9 | 20.4 | 16.9 | 19.2 | 22.7 | 19.8 | |
| D2† | 21.3 | 21.5 | 21.4 | 23.2 | 21.9 | 22.8 | 24.2 | 20.4 | 25.3 | 23.2 | |
| Average | 19.9 | 19.0 | 19.6 | 21.1 | 19.9 | 21.8 | 21.0 | 19.9 | 24.1 | 21.6 | |
| C) Average height of the densities at the atomic positions (sumf) (Rossmann et al., 2001) on fitting the CHIKV model of the transmembrane protein into the cryoEM map at the four quasi equivalent positions | |||||||||||
| All atoms | T = 4 fitting | Independent domain fitting | |||||||||
| #1 | #2 | #3 | #4 | Average | #1 | #2 | #3 | #4 | Average | ||
| E1‡ | 13.7 | 14.6 | 13.2 | 18.6 | 15.0 | 13.9 | 14.4 | 14.7 | 17.5 | 15.1 | |
| E2‡ | 14.7 | 12.8 | 11.8 | 17.5 | 14.2 | 15.1 | 14.1 | 13.7 | 18.9 | 15.5 | |
| Average | 14.4 | 13.5 | 12.3 | 17.9 | 14.6 | 14.5 | 14.2 | 14.2 | 18.2 | 15.3 | |
| Main chain atoms only | T = 4 fitting | Independent domain fitting | |||||||||
| #1 | #2 | #3 | #4 | Average | #1 | #2 | #3 | #4 | Average | ||
| E1‡ | 16.2 | 17.6 | 16.0 | 24.1 | 18.5 | 15.7 | 17.3 | 16.7 | 23.9 | 18.4 | |
| E2‡ | 16.7 | 15.0 | 13.6 | 20.7 | 16.5 | 17.7 | 16.7 | 15.8 | 23.7 | 18.5 | |
| Average | 16.5 | 16.0 | 14.4 | 22.0 | 17.5 | 16.7 | 17.0 | 16.2 | 23.8 | 18.4 | |
-
*
Domain definition: E1 I (residues 1-36, 132-168, 273-293), II (residues 37-131, 169-272), III (residues 294-393). E2 A (residues 16-134), B (residues 173-231), C (residues 269-342), D (residues 7-15, 135-172, 232-268).
-
†
Domain definition: D1(residues 119 to 183), D2(residues 184 to 267).
-
‡
Domain definition: E1 (residues 394-439), E2(residues 343-423).
Table 2
Distances in Å between N and C termini of fitted domains before regularization
| Quasi equivalent positions | |||||
| Domains | #1 | #2 | #3 | #4 | |
| E1 | I 36 to II 37 | 4.6 | 5.6 | 5.5 | 3.5 |
| II 131 to I 132 | 4.8 | 4.1 | 4.4 | 4.1 | |
| I 168 to II 169 | 2.8 | 6.4 | 5.4 | 5.1 | |
| II 272 to I 273 | 5.8 | 4.7 | 3.9 | 2.1 | |
| I 293 to III 294 | 5.4 | 6.9 | 3.7 | 5.0 | |
| E2 | D 15 to A 16 | 3.8 | 6.3 | 5.7 | 5.9 |
| A134 to D135 | 3.1 | 5.0 | 4.4 | 2.3 | |
| D172 to B173 | 3.4 | 8.8 | 3.0 | 5.7 | |
| B231 to D232 | 6.2 | 7.7 | 5.9 | 7.2 | |
| NCP | D268 to C269 | 5.1 | 5.2 | 4.1 | 4.0 |
| (D1)183 to (D2)184 | 1.2 | 2.2 | 1.6 | 1.6 | |
Table 3
Hinge angle change between domains in different heterodimers
| Hinge angle change in E1 between domain I and domain II (in degrees) | ||||
| Position #1 | Position #2 | Position #3 | Position #4 | |
| Crystal structure | -14.4 | -6.6 | 7.5 | -8.3 |
| Position #1 | 8.0 | 9.3 | 6.8 | |
| Position #2 | 3.1 | 2.1 | ||
| Position #3 | -3.3 | |||
| Hinge angle change in E1 between domain I and domain III (in degrees) | ||||
| Position #1 | Position #2 | Position #3 | Position #4 | |
| Crystal structure | -7.3 | -8.0 | -9.4 | 2.1 |
| Position #1 | -3.5 | 10.3 | 7.7 | |
| Position #2 | 13.0 | 9.2 | ||
| Position #3 | 7.6 | |||
| Hinge angle change in E2 between domain A and domain B (in degrees) | ||||
| Position #1 | Position #2 | Position #3 | Position #4 | |
| Crystal structure | -8.4 | 10.4 | 22.2 | -22.3 |
| Position #1 | -14.1 | 25.5 | -29.7 | |
| Position #2 | 26.6 | -28.6 | ||
| Position #3 | -26.3 | |||
| Hinge angle change in E2 between domain A and domain C (in degrees) | ||||
| Position #1 | Position #2 | Position #3 | Position #4 | |
| Crystal structure | -11.5 | -10.4 | -7.6 | -17.1 |
| Position #1 | -4.8 | -8.6 | -7.3 | |
| Position #2 | 7.2 | 8.3 | ||
| Position #3 | -14.8 | |||
Table 4
RMS deviation in Å between quasi equivalent Cα atoms
| E1 | #1 | #2 | #3 | #4 | Xtal |
| #1 | 0.00 | 1.21 | 1.25 | 1.08 | 1.69 |
| #2 | 0.00 | 1.28 | 1.27 | 1.52 | |
| #3 | 0.00 | 1.10 | 1.68 | ||
| #4 | 0.00 | 1.17 | |||
| Xtal | 0.00 | ||||
| E2 | #1 | #2 | #3 | #4 | Xtal |
| #1 | 0.00 | 2.18 | 1.79 | 1.90 | 1.50 |
| #2 | 0.00 | 2.34 | 2.38 | 2.17 | |
| #3 | 0.00 | 2.28 | 1.84 | ||
| #4 | 0.00 | 1.92 | |||
| Xtal | 0.00 | ||||
| E1&E2 | #1 | #2 | #3 | #4 | Xtal |
| #1 | 0.00 | 1.94 | 1.65 | 1.68 | 2.28 |
| #2 | 0.00 | 2.16 | 2.14 | 2.24 | |
| #3 | 0.00 | 1.87 | 2.37 | ||
| #4 | 0.00 | 1.88 | |||
| Xtal | 0.00 | ||||
| Capsid | #1 | #2 | #3 | #4 | Xtal |
| #1 | 0.00 | 0.49 | 0.73 | 0.71 | 0.48 |
| #2 | 0.00 | 1.09 | 0.94 | 0.71 | |
| #3 | 0.00 | 0.63 | 0.56 | ||
| #4 | 0.00 | 0.52 | |||
| Xtal | 0.00 |
Table 5
Correlation between amino acid sequence and cryoEM density
| A) Correlation between cryoEM densities in the four quasi equivalent positions of the E1 and E2 glycoproteins. | ||||||||||
| All atoms | T = 4 fitting | Independent domain fitting | ||||||||
| 1 | 2 | 3 | 4 | B | 1 | 2 | 3 | 4 | B | |
| 1 | 1.00 | 0.17 | 0.23 | 0.08 | 0.22 | 1.00 | 0.40 | 0.44 | 0.40 | 0.21 |
| 2 | 1.00 | 0.28 | 0.38 | 0.30 | 1.00 | 0.41 | 0.30 | 0.28 | ||
| 3 | 1.00 | 0.40 | 0.28 | 1.00 | 0.36 | 0.28 | ||||
| 4 | 1.00 | 0.19 | 1.00 | 0.15 | ||||||
| B | 1.00 | 1.00 | ||||||||
| Main chain atoms only | T = 4 fitting | Independent domain fitting | ||||||||
| 1 | 2 | #3 | 4 | B | 1 | 2 | 3 | 4 | B | |
| 1 | 1.00 | 0.11 | 0.20 | 0.11 | 0.19 | 1.00 | 0.40 | 0.41 | 0.41 | 0.22 |
| 2 | 1.00 | 0.31 | 0.30 | 0.30 | 1.00 | 0.36 | 0.32 | 0.26 | ||
| 3 | 1.00 | 0.41 | 0.27 | 1.00 | 0.37 | 0.26 | ||||
| 4 | 1.00 | 0.16 | 1.00 | 0.12 | ||||||
| B | 1.00 | 1.00 | ||||||||
| B) Correlation between cryoEM densities of the four quasi equivalent capsid proteins. | ||||||||||
| All atoms | T = 4 fitting | Independent domain fitting | ||||||||
| #1 | #2 | #3 | #4 | #1 | #2 | #3 | #4 | |||
| #1 | 1.00 | 0.41 | 0.18 | 0.17 | 1.00 | 0.20 | 0.19 | 0.30 | ||
| #2 | 1.00 | 0.26 | 0.25 | 1.00 | 0.45 | 0.42 | ||||
| #3 | 1.00 | 0.13 | 1.00 | 0.41 | ||||||
| #4 | 1.00 | 1.00 | ||||||||
| Main chain atoms only | T = 4 fitting | Independent domain fitting | ||||||||
| #1 | #2 | #3 | #4 | #1 | #2 | #3 | #4 | |||
| #1 | 1.00 | 0.37 | 0.16 | 0.26 | 1.00 | 0.22 | 0.17 | 0.33 | ||
| #2 | 1.00 | 0.31 | 0.27 | 1.00 | 0.34 | 0.43 | ||||
| #3 | 1.00 | 0.15 | 1.00 | 0.31 | ||||||
| #4 | 1.00 | 1.00 | ||||||||
| C) Correlation between cryoEM densities of the four quasi equivalent E1&E2 TM and endodomain regions. | ||||||||||
| All atoms | T = 4 fitting | Independent domain fitting | ||||||||
| #1 | #2 | #3 | #4 | #1 | #2 | #3 | #4 | |||
| #1 | 1.00 | 0.43 | 0.17 | 0.41 | 1.00 | 0.37 | 0.34 | 0.35 | ||
| #2 | 1.00 | 0.24 | 0.38 | 1.00 | 0.44 | 0.34 | ||||
| #3 | 1.00 | 0.20 | 1.00 | 0.46 | ||||||
| #4 | 1.00 | 1.00 | ||||||||
| Main chain atoms only | T = 4 fitting | Independent domain fitting | ||||||||
| #1 | #2 | #3 | #4 | #1 | #2 | #3 | #4 | |||
| #1 | 1.00 | 0.28 | 0.08 | 0.27 | 1.00 | 0.23 | 0.11 | 0.26 | ||
| #2 | 1.00 | 0.17 | 0.43 | 1.00 | 0.40 | 0.36 | ||||
| #3 | 1.00 | 0.14 | 1.00 | 0.50 | ||||||
| #4 | 1.00 | 1.00 | ||||||||
Table 6
Inter-molecular contacts (See methods for descriptions)
| Spike position | Total | Hydrophobic | Possible H bonds | Possible salt bridges | |
| A) Number of atom-to-atom contacts between E1-E2 in heterodimer | |||||
| i3 | #1 | 234 | 99 (42%) | 34 (13%) | 0 |
| q3 | #2 | 254 | 112 (44%) | 25 (10%) | 0 |
| #3 | 179 | 59 (33%) | 33 (18%) | 0 | |
| #4 | 302 | 118 (39%) | 39 (13%) | 4 (1%) | |
| Crystal | 86 | 1 (1%) | 32 (37%) | 1 (1%) | |
| B) Number of atom-to-atom contacts of E2 with other E2s within a spike | |||||
| i3 | #1 | 229 | 46 (20%) | 30 (13%) | 82 (36%) |
| q3 | #2 | 70 | 8 (11%) | 10 (14%) | 33 (47%) |
| #3 | 47 | 14 (30%) | 6 (13%) | 10 (21%) | |
| #4 | 74 | 118 (23%) | 24 (46%) | 7 (9%) | |
| C) Number of atom-to-atom contacts between glycoprotein spikes | |||||
| q3 to q3 | A#3 - D #4 | 123 | 42 (34%) | 21 (17%) | 7 (5%) |
| A#4 - D#4 | 130 | 52 (40%) | 18 (14%) | 1 (1%) | |
| i3 to q3 | A#2 - B#1 | 58 | 27 (47%) | 7 (12%) | 0 |
| A#1 - A#2 | 88 | 29 (33%) | 19 (22%) | 0 | |
| A#1 - A#3 | 11 | 8 (73%) | 2 (8%) | 0 | |
| D) Number of atom-to-atom contacts between E1 and E2 within the spikes. | |||||
| q3 | A#2 - A#3 | 30 | 16 (34%) | 5 (17%) | 0 |
| A#3 - A#4 | 20 | 8 (40%) | 3 (14%) | 0 | |
| i3 | A#4 - A#2 | 56 | 25 (47%) | 11 (12%) | 0 |
| A#1 - B#1 | 224 | 112 (50%) | 21 (9%) | 22 (10%) | |
| E) Number of atom-to-atom contacts between capsid proteins* | |||||
| A#2 - B#1 | 79 | 20 (25%) | 13 (16%) | 15 (19%) | |
| A#1 - A#3 | 11 | 3 (27%) | 1 (9%) | 3 (27%) | |
| A#3 - D#2 | 183 | 51 (28%) | 22 (12%) | 38 (21%) | |
| A#4 - D#4 | 19 | 5 (26%) | 2 (11%) | 8 (42%) | |
| A#1 - B#1 | 20 | 9 (45%) | 2 (10%) | 2 (10%) | |
| F) Number of atom-to-atom contacts between E1 & E2 in TM region | |||||
| #1 | 100 | 60 (60%) | 3 (3%) | 0 | |
| #2 | 82 | 43 (52%) | 8 (10%) | 0 | |
| #3 | 20 | 12 (60%) | 1 (5%) | 0 | |
| #4 | 28 | 24 (86%) | 0 | 0 | |
-
*
See Figure 2.
Table 7
Spike radii of gyration
| Distance from particle center (Å) | Radii of gyration (Å) | # of atoms | ||||
| i3 | q3 | SINV* crystal | i3 | q3 | SINV* crystal | |
| 255 | 58.3 | 61.0 | 63.3 | 42 | 34 | 62 |
| 265 | 53.5 | 57.3 | 54.9 | 131 | 126 | 118 |
| 275 | 41.1 | 46.9 | 42.6 | 125 | 122 | 101 |
| 285 | 30.1 | 33.1 | 30.1 | 84 | 90 | 80 |
| 295 | 33.2 | 34.2 | 33.8 | 85 | 80 | 91 |
| 305 | 33.3 | 31.9 | 31.3 | 90 | 89 | 82 |
| 315 | 30.7 | 31.2 | 24.5 | 70 | 80 | 92 |
| 325 | 26.7 | 25.9 | 41 | 47 | ||
| 335 | 31.0 | 29.0 | 1 | 1 | ||
| Overall | 40.5 | 42.4 | 41.9 | 669 | 669 | 626 |
-
*
Sindbis virus (SINV)
Table 8
Comparison between VEEV and CHIK VLPs.
| E1-E2 | TM | Capsid | ||||||||||
| A1 | A2 | A3 | A4 | A1 | A2 | A3 | A4 | A1 | A2 | A3 | A4 | |
| d in Å | 2.6 | 3.5 | 3.5 | 2.2 | 4.8 | 2.3 | 2.1 | 3.0 | 9.6 | 7.7 | 9.0 | 9.7 |
| κ in degrees | 2.3 | 3.6 | 3.7 | 3.4 | 5.4 | 8.2 | 10.4 | 10.0 | 9.7 | 8.0 | 10.0 | 11.7 |
| dCα in Å | 2.7 | 2.5 | 2.4 | 2.1 | 2.6 | 2.2 | 2.5 | 2.0 | 1.1 | 1.2 | 1.2 | 1.2 |
| num | 696 | 680 | 709 | 714 | 115 | 100 | 99 | 101 | 149 | 149 | 149 | 149 |
| % identity | E1 = 56%, E2 = 34% | TM = 24% | Capsid = 62% | |||||||||
-
Differences between the positions of the centers of mass (d) and orientation (κ) relative to the icosahedral symmetry axes of the (E1-E2) heterodiners, the trans membrane (TM) helices and capsid proteins at positions A1, A2, A3 and A4 (see Figure 2). The RMS distances (dCα) are given between the number (num) of equivalent Cα positions of the superimposed molecules A1 to A4. The percentage of identical amino acids in the aligned proteins is given on the last line of the table
Table 9
Data collection and refinement statistics for the m242 and CHK-9 Fab molecules
| Fab m242 | Fab CHK9 | |
| Data collection | ||
| X-ray source | 23-ID-B | 23-ID-B |
| Wavelength (Å) | 1.03 | 1.03 |
| Resolution (Å) | 3.1 | 3 |
| Space group | P21212 | C2 |
| Unit cell (Å) | a = 137.0, b = 89.1, c = 94.4 | a = 87.9, b = 57.7, c = 118.1 |
| Unique reflections | 21,115 | 35,876 |
| Average redundancy | 3.7 | 5.8 |
| I/σ* | 17.5 (4.9) | 25.0 (5.0) |
| Completeness (%) | 98.3 (96.4) | 99.6 (99.9) |
| Rmerge (%)† | 10.1 (23.4) | 5.5 (39.2) |
| Refinement | ||
| Resolution (Å) | 3.1 | 1.8 |
| Rworking (%)‡ | 29.3 (34.5) | 18.7 (23.3) |
| Rfree (%)§ | 33.1 (34.3) | 22.0 (27.7) |
| rmsd bonds (Å) | 0.005 | 0.01 |
| rmsd angels (°) | 0.85 | 0.91 |
| # of residues Ramachandran disallowed | 0 | 1 |
-
*
Values in parentheses throughout the table correspond to the outermost resolution shell
-
†
Rmerge = Σ| I - <I> | / Σ I, where I is the measured intensity of reflections
-
‡
Rworking = Σ||Fobs| -|Fcalc|| / Σ|Fobs|
-
§
Rfree has the same formula as Rworking except that calculation was made with the structure factors from the test set
Download links
A two-part list of links to download the article, or parts of the article, in various formats.
Downloads (link to download the article as PDF)
Open citations (links to open the citations from this article in various online reference manager services)
Cite this article (links to download the citations from this article in formats compatible with various reference manager tools)
Structural analyses at pseudo atomic resolution of Chikungunya virus and antibodies show mechanisms of neutralization
eLife 2:e00435.
https://doi.org/10.7554/eLife.00435


