Cohabiting family members share microbiota with one another and with their dogs
- University of Colorado, Boulder, United States
- Stanford University School of Medicine, United States
- Northern Arizona University, United States
- Institute for Genomics and Systems Biology, United States
- University of Minnesota, United States
- BioTechnology Institute, University of Minnesota, United States
- Howard Hughes Medical Institute, University of California, San Francisco, United States
- Washington University School of Medicine, United States
- Howard Hughes Medical Institute, University of Colorado, Boulder, United States
- Biofrontiers Institute, University of Colorado, Boulder, United States
Figures
Figure 1
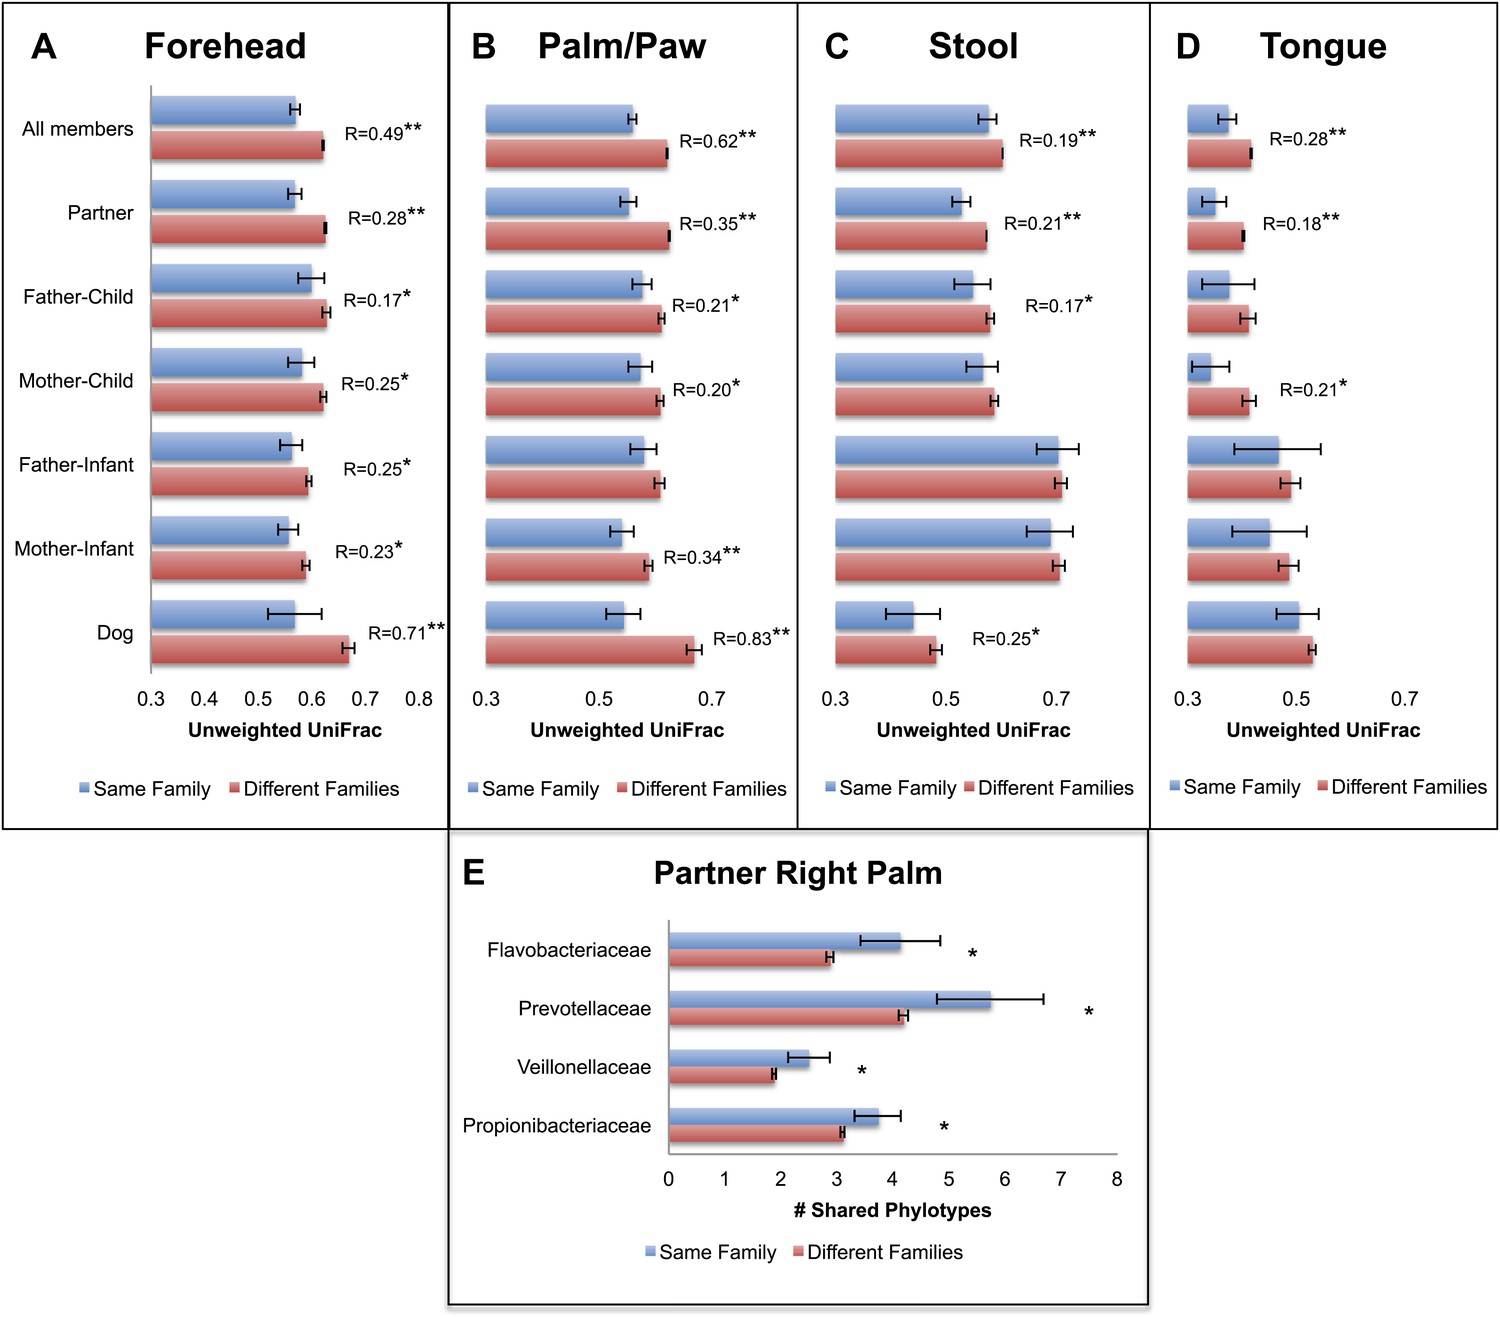
Community similarity within and between families across body sites, and taxa contributing to these differences.
Panels (A–D) show average unweighted UniFrac distances between family members (blue) and between members of different families (red). ‘Child’ refers to all offspring aged 3–18 years who cohabit with the parents. ‘Infants’ were considered to be individuals aged 0–12 months. Palm/Paw refers to the right palm in the human comparisons and the back left paw in the dog comparison. Although there are distinguishable differences between the left and right palm communities within and across individuals (Fierer et al., 2008), the same analysis using the left palms showed a similar pattern (Table 2) and neither composition nor diversity were different enough between palms or among the four dog paws to affect the overall patterns. Mean ± 95% CI and R values (ANOSIM) are shown. *p<0.05 and **p<0.001 based on 10,000 permutations. Panel (E) shows the families of bacteria that exhibit the greatest differences in the number of phylotypes (OTUs) shared within and between adult partners on the right palm. Bars represent the average number of shared phylotypes for a given bacterial family within partners from the same family (blue) and between partners of different families (red). Mean ± 95% CI shown. *p<0.05 after Bonferroni correction (Wilcoxon test).
Figure 2
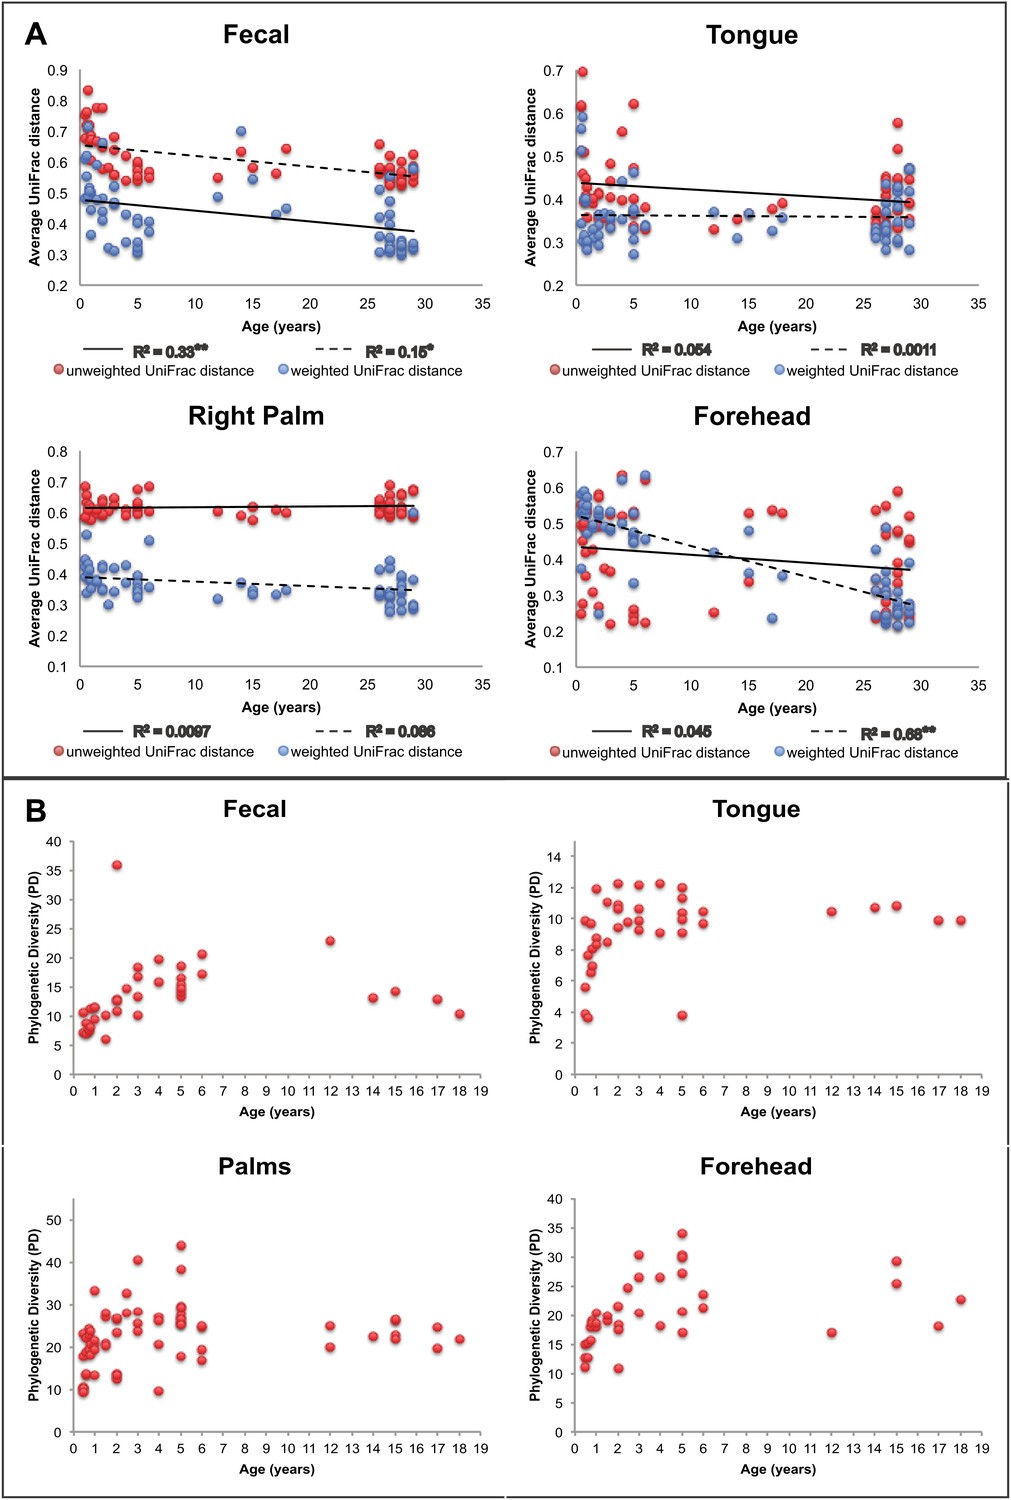
Approach towards or departure from the ‘adult’ state in each body site with age.
(A) Each point represents the average distance (unweighted UniFrac in red; weighted UniFrac in blue) between each participant and all other participants in the ‘adult’ age bracket. Here we define baseline ‘adult’ as 30–45 years in age (the results are not sensitive to this threshold). R2 values (linear regression model) are shown. *p<0.01, **p<0.001. (B) Phylogenetic diversity (PD) of the communities on each body site is plotted for all of the offspring in the study (aged 0–18 years).
Figure 3
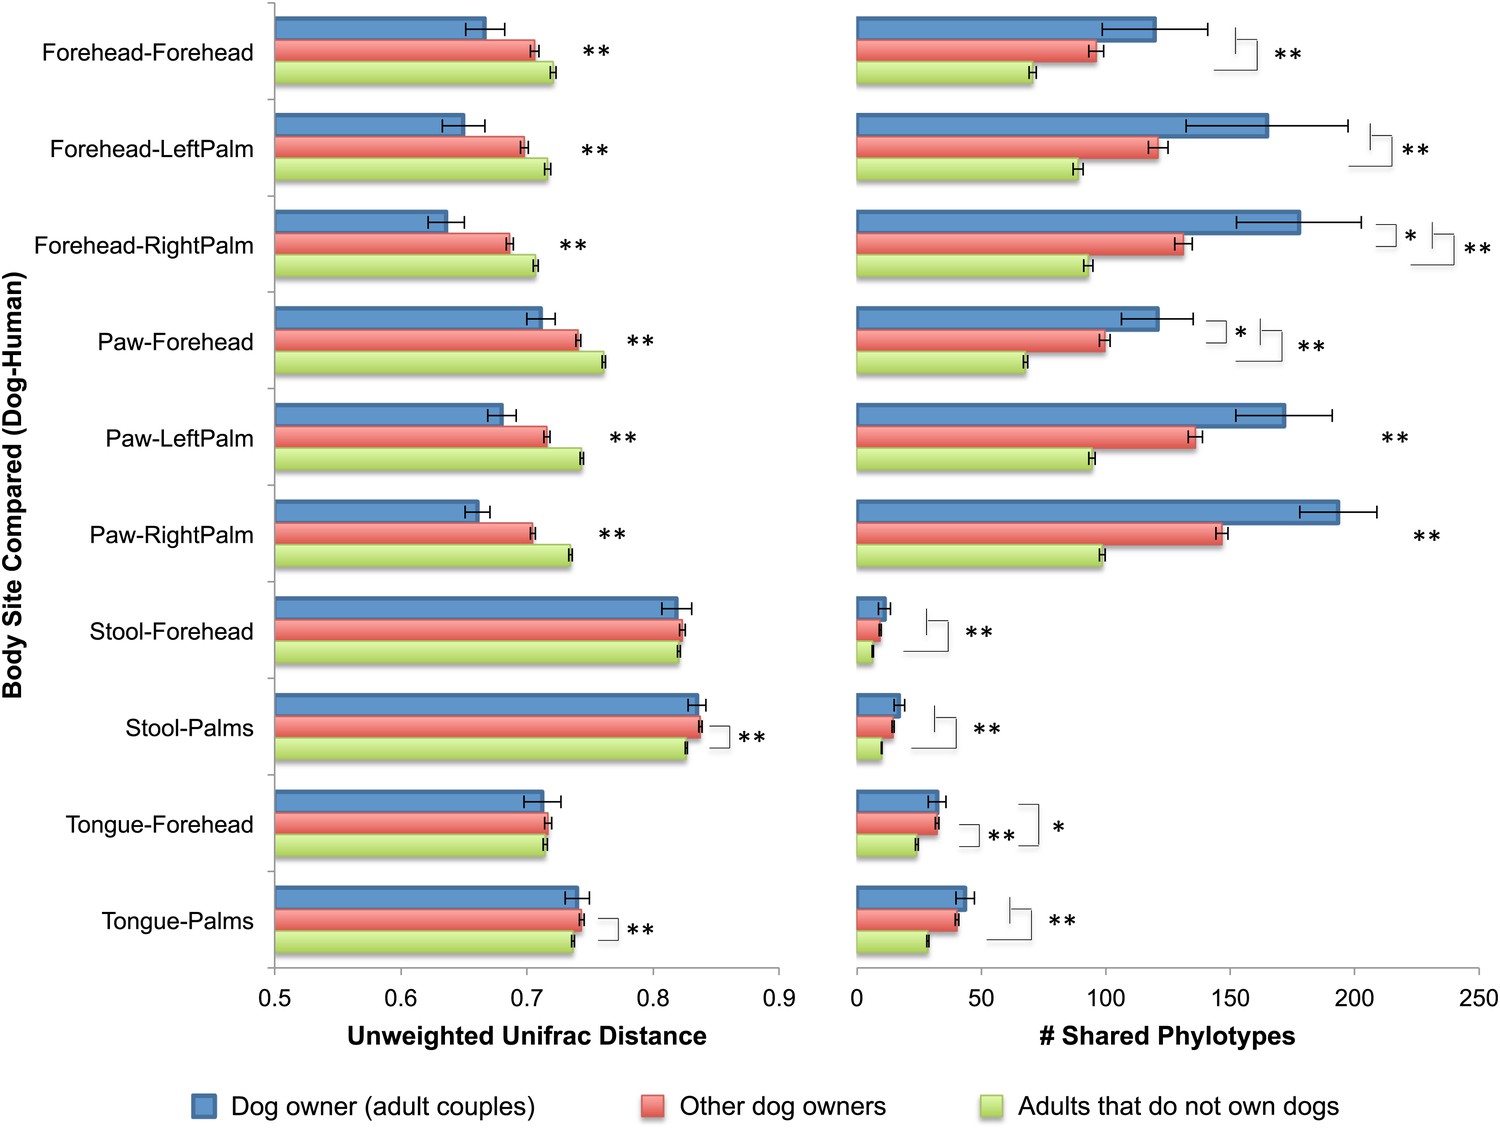
Community similarity and phylotype sharing between dogs-owners and their dogs.
The left panel shows the average unweighted UniFrac distance between adult dog-owners and their dogs (blue), between dog-owners and other (not their own) dogs (red), and between adults who do not own dogs and dogs (green). The right panel shows the number of phylotypes shared for the same categories. Comparisons are labeled on the y-axis such that the first body site listed corresponds to the dog and the second site corresponds to the human. Mean ± 95% CI shown. The presence of asterisks lacking brackets indicates that all pairwise comparisons within that group are significant. Generally, dog-owners tend to share more similar communities and more phylotypes with their own dogs than with other dogs. *p<0.05, **p<0.001 after Bonferroni correction (Wilcoxon test).
Figure 4
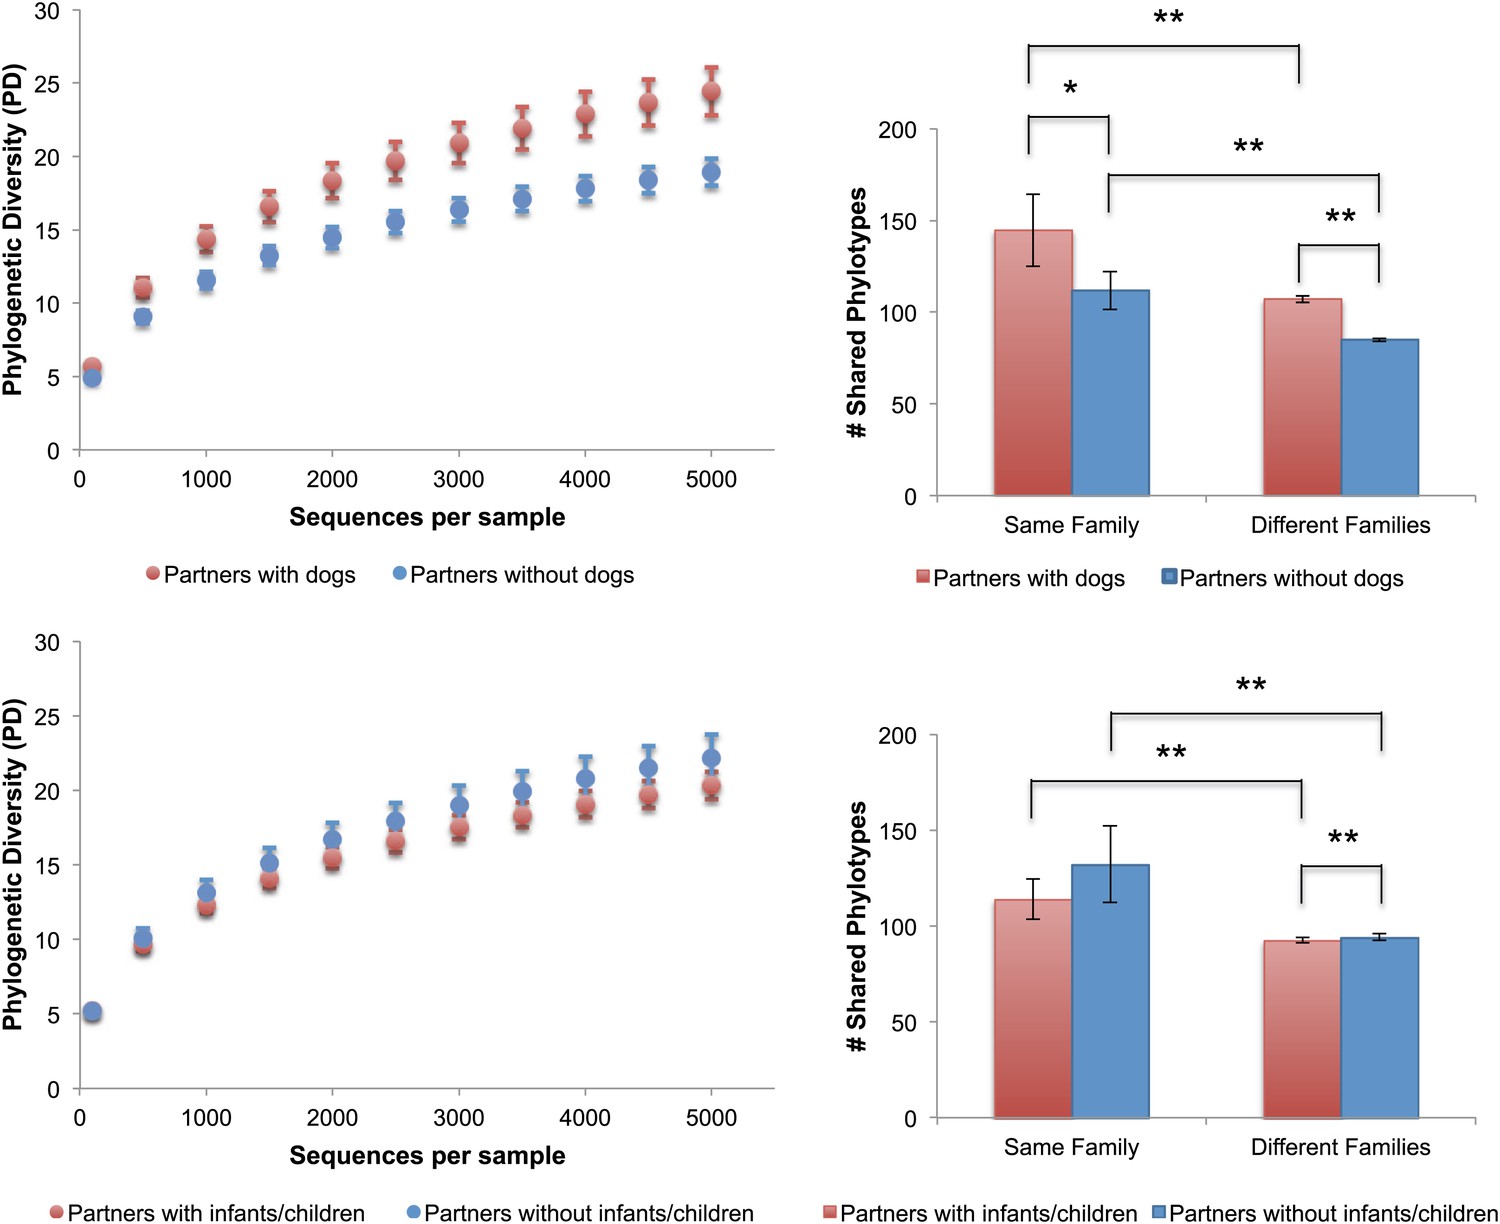
Alpha diversity and shared phylotypes in couples with and without dogs and children.
The left panels show rarefaction curves for skin communities of couples (including seniors) who have dogs (top, in red), those without dogs (top, in blue), couples (excluding seniors) with infants/children (bottom, in red), and those without infants/children (bottom, in blue). Mean ± 95% CI shown. The right panels show the average number of phylotypes shared among individuals from the same categories shown in the left panels. Mean ± 95% CI shown. *p<0.05, **p<0.001 after Bonferroni correction (Wilcoxon test).
Figure 5
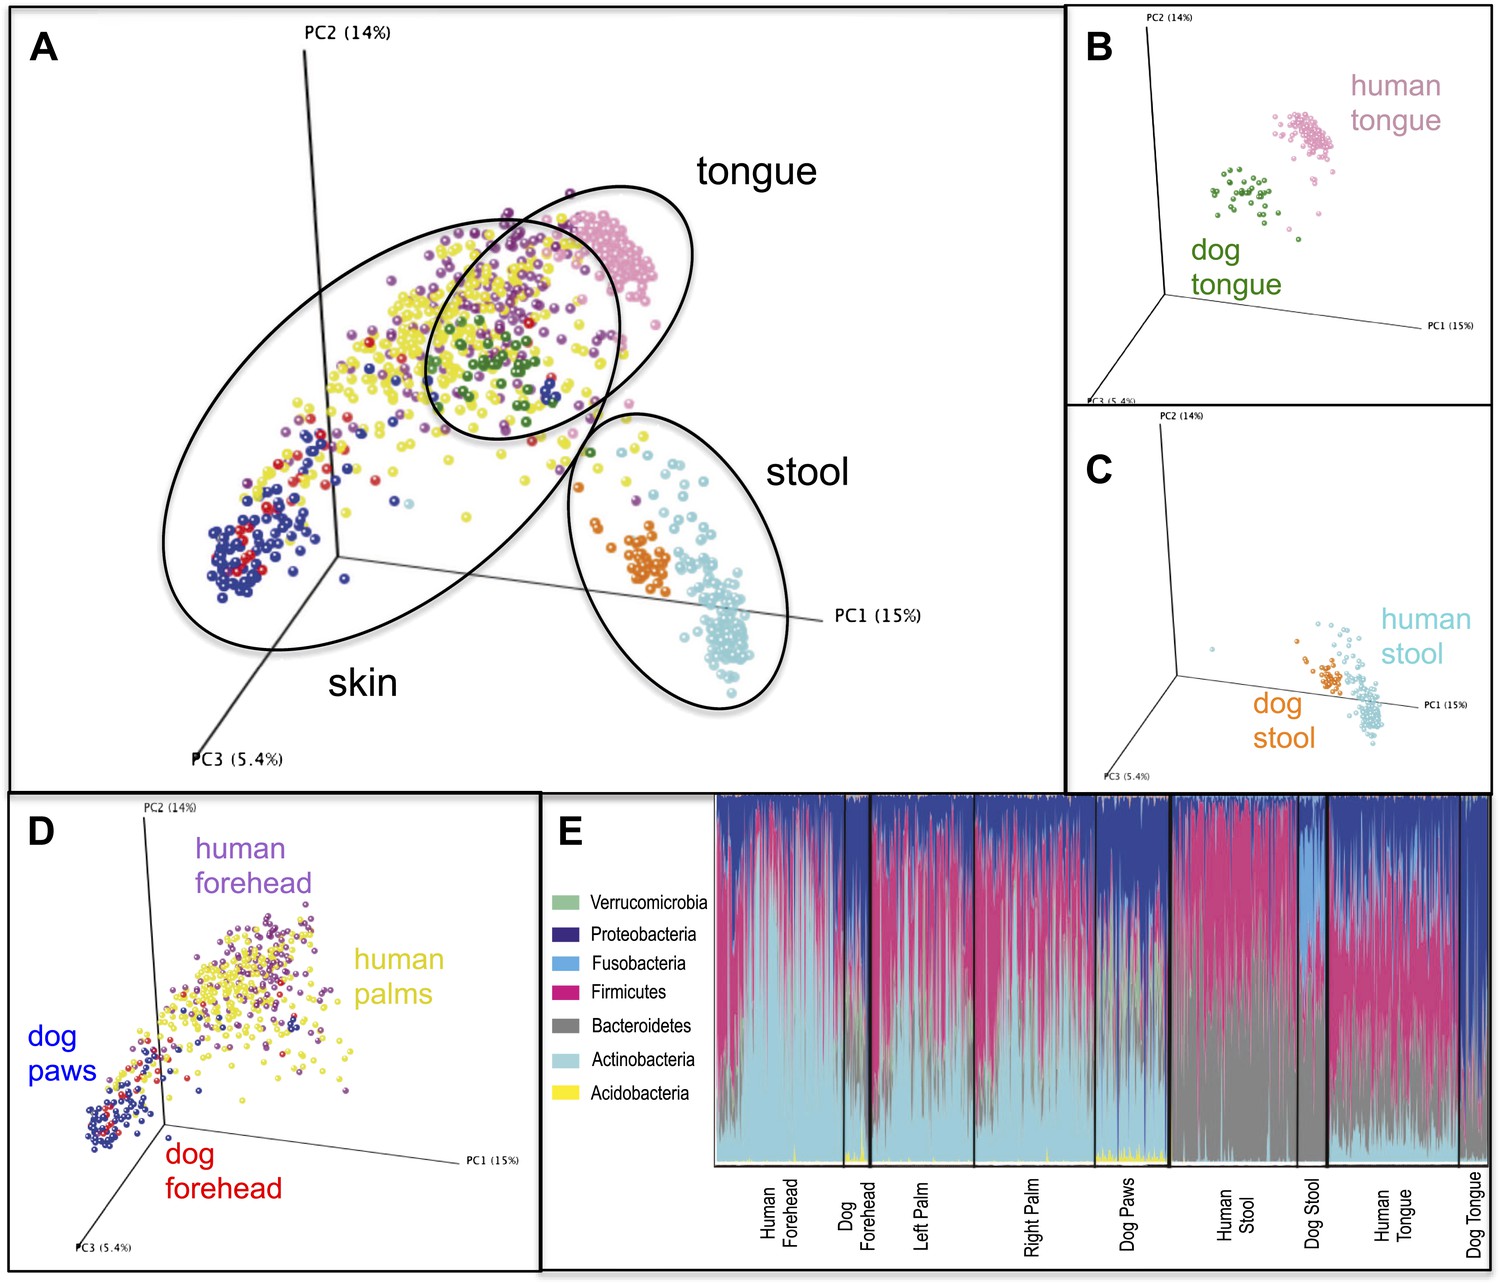
Variation within and between the communities of skin, oral, and fecal samples from humans and dogs.
Panel (A) shows a PCoA plot of all the body habitats, using unweighted UniFrac distances of human and dog samples, rarefied at 5000 sequences/sample. Panels (B–D) show select body habitats from the full plot. Panel (E) shows a summary of the taxa shaded by relative abundance at the phylum level broken down by specific body habitat; the seven most abundant taxa are shown in the legend.
Tables
Table 1
Summary of the number, age classification, and gender of humans surveyed in each family and the number and types of animals in families with pets
| Adults (Sex) | Infants (Sex) | Adolescents (Sex) | Seniors (Sex) | Dogs (breed) | Other pets |
| 2 (M, F) | 1 (F) | 1 (F) | Cat | ||
| 2 (M, F) | 1 (Unknown) | ||||
| 2 (M, F) | Cats | ||||
| 2 (M, F) | 1 (F) | ||||
| 2 (M, F) | 2 (Unknown) | ||||
| 2 (M, F) | 1 (F) | 2 (Unknown) | |||
| 2 (M, F) | 1 (F) | 1 (M) | |||
| 2 (M, F) | Cats, guinea pigs | ||||
| 2 (M, F) | |||||
| 2 (M, F) | 2 (Unknown) | ||||
| 2 (M, F) | 3 (Unknown) | ||||
| 2 (M, F) | 1 (Unknown) | ||||
| 2 (M, F) | |||||
| 2 (M, F) | 1 (F) | Cat, fish | |||
| 2 (M, F) | 1 (M) | Cat | |||
| 2 (M, F) | |||||
| 2 (M, F) | |||||
| 2 (M, F) | Fish | ||||
| 2 (M, F) | 1 (F) | 1 (Jack Russell Terrier) | Cat | ||
| 2 (M, F) | 1 (Australian Cattle mix) | ||||
| 2 (M, F) | 2 (M, F) | Cat, tarantula | |||
| 2 (M, F) | 1 (Labrador/Golden mix) | Cat | |||
| 2 (M, F) | 1 (Springer Spaniel) | Cat | |||
| 2 (M, F) | 1 (M) | 1 (M) | Cat | ||
| 2 (M, F) | Cats | ||||
| 2 (M, F) | Reptiles, amphibians | ||||
| 2 (M, F) | Cat | ||||
| 2 (M, F) | Cats | ||||
| 2 (M, F) | Fish | ||||
| 2 (M, F) | 1 (F) | 2 (M, M) | |||
| 2 (M, F) | 2 (M, F) | Cat | |||
| 2 (M, F) | 1 (F) | ||||
| 3 (M, F, M) | 1 (M) | Cat | |||
| 2 (M, F) | 1 (Border Collie) | ||||
| 2 (M, F) | 2 (Kelpie, Standard Poodle) | ||||
| 2 (M, F) | 1 (F) | 1 (Border Collie mix) | |||
| 2 (M, F) | 1 (M) | 2 (Boxer, Boxer) | |||
| 2 (M, F) | 2 (Labrador, Labrador) | ||||
| 2 (M, F) | |||||
| 2 (M, F) | 2 (English Setter, Labrador) | ||||
| 2 (M, F) | 2 (Labrador, Australian Shepherd/Spaniel mix) | Chickens | |||
| 2 (M, F) | 2 (M, M) | Cats, rabbit, reptiles | |||
| 2 (M, F) | 1 (F) | ||||
| 2 (M, F) | 1 (F) | 1 (German Shepherd mix) | |||
| 2 (M, F) | 1 (Bernese Mountain) | ||||
| 2 (M, F) | 2 (M, F) | ||||
| 2 (M, F) | 1 (M) | 1 (M) | Cat | ||
| 2 (M, F) | 3 (F, M, F) | 1 (German Shepherd/Malamute mix) | |||
| 2 (M, F) | 1 (F) | 1 (F) | |||
| 2 (M, F) | 2 (Australian Shepherd, Australian Shepherd) | ||||
| 2 (M, F) | 1 (M) | 2 (Border Collie/German Shepherd mix, Labrador mix) | |||
| 2 (M, F) | 1 (M) | Cat | |||
| 1 (F) | 1 (M) | Cat | |||
| 2 (M, F) | 1 (F) | 2 (Siberian Husky, Greater Swiss Mountain) | |||
| 2 (M, F) | |||||
| 2 (M, F) | Cat | ||||
| 2 (M, F) | 1 (Unknown)* | ||||
| 2 (M, F) | |||||
| 2 (M, F) | 1 (Unknown)* | ||||
| 2 (M, F) | |||||
| 106 | 12 | 26 | 15 | 36* |
-
*
These dogs were not sampled and thus not included in the total number of dogs.
-
Each row is one family and the last row contains the total for each column. Infants were considered to be individuals aged 0–12 months, children/adolescents as 1–17 years, adults as 18–59 years and seniors as ≥60 years
Table 2
Summary of the optimal linear mixed model explaining microbial phylogenetic diversity of body sites in relation to the main factors
| Age group | Body site | Term | Type | Estimate | SE | %Variability |
| All | Palms (L&R) | NoDog | Fixed | −0.19 | 0.06 | |
| Family | Random | 38.98 | ||||
| Age | Random | 17.14 | ||||
| Plate | Random | 4.34 | ||||
| FamSize | Random | 0.38 | ||||
| Lane | Random | 0 | ||||
| BS | Random | 0 | ||||
| Residual | 39.16 | |||||
| Forehead | Family | Random | 24.85 | |||
| Age | Random | 15.41 | ||||
| Lane | Random | 8.50 | ||||
| FamSize | Random | 7.81 | ||||
| Plate | Random | 6.33 | ||||
| Residual | 37.10 | |||||
| Fecal | Age | Random | 45.64 | |||
| Plate | Random | 7.15 | ||||
| FamSize | Random | 3.08 | ||||
| Family | Random | 2.24 | ||||
| Lane | Random | 2.97 × 10⁻⁹ | ||||
| Residual | 41.88 | |||||
| Oral | Age | Random | 35.92 | |||
| Family | Random | 14.54 | ||||
| Lane | Random | 3.64 | ||||
| Plate | Random | 4.60 × 10⁻¹⁰ | ||||
| FamSize | Random | 0 | ||||
| Residual | 45.90 | |||||
| Adults | Palms (L&R) | NoDogs | Fixed | −0.22 | 0.068 | |
| Male | Fixed | −0.11 | 0.031 | |||
| Family | Random | 46.90 | ||||
| Plate | Random | 2.77 | ||||
| FamSiz | Random | 5.17 × 10⁻¹¹ | ||||
| Lane | Random | 2.16 × 10⁻¹² | ||||
| BS | Random | 0 | ||||
| Residual | 50.33 | |||||
| Forehead | NoDogs | Fixed | −0.27 | 0.087 | ||
| Family | Random | 34.91 | ||||
| FamSize | Random | 9.08 | ||||
| Plate | Random | 0.80 | ||||
| Lane | Random | 0 | ||||
| Residual | 55.21 | |||||
| Fecal | Family | Random | 20.20 | |||
| Lane | Random | 9.77 | ||||
| FamSize | Random | 0 | ||||
| Plate | Random | 0 | ||||
| Residual | 70.03 | |||||
| Oral | Family | Random | 26.16 | |||
| FamSize | Random | 14.59 | ||||
| Lane | Random | 3.43 | ||||
| Plate | Random | 3.42 | ||||
| Residual | 52.40 |
-
The model takes into account the variability between age groups (Age), families (Family), family sizes (FamSize), sequencing lanes (Lane), and primer plates (Plate). Variability between left and right palms (BS) is also controlled for in the palm model. The table gives parameter estimates and standard errors for the significant terms in the model and the percentage of explained variability for each of the random effects ordered from highest to lowest.
Table 3
Summary of a permutational analysis of variance (PERMANOVA) assessing the effect of family membership on unweighted UniFrac distances between families
| Body site | Source of variation | Df | MS | Pseudo-F | P | |
| Palms (L&R) | Family membership | 69 | 0.3274 | 2.0702 | 0.001 | 0.21 |
| Residual | 210 | 0.15815 | 0.40 | |||
| Forehead | Family membership | 70 | 0.23758 | 1.4603 | 0.001 | 0.18 |
| Residual | 91 | 0.1627 | 0.40 | |||
| Fecal | Family membership | 66 | 0.212 | 1.2759 | 0.001 | 0.14 |
| Residual | 92 | 0.16615 | 0.41 | |||
| Oral | Family membership | 68 | 0.12544 | 1.6803 | 0.001 | 0.15 |
| Residual | 96 | 0.07465 | 0.27 |
-
are the estimates of the components of variance for the factors. Statistically significant effects are in bold.
Table 4
Summary of ANOSIM analyses of the differences between within-family and between-family community comparisons using unweighted (unwtd) and weighted (wtd) UniFrac
| Comparison | Body site | Fam (N) | Ind (N) | R (unwtd) | p | R (wtd) | p |
| Families | Forehead | 60 | 151 | 0.49 | <0.0001 | 0.010 | 0.39 |
| Right palm | 60 | 141 | 0.62 | <0.0001 | 0.18 | 0.0008 | |
| Left palm | 56 | 122 | 0.61 | <0.0001 | 0.30 | <0.0001 | |
| Fecal | 59 | 151 | 0.19 | <0.0001 | 0.068 | 0.056 | |
| Oral | 59 | 155 | 0.28 | <0.0001 | 0.32 | <0.0001 | |
| Spouses | Forehead | 60 | 114 | 0.28 | <0.0001 | 0.091 | 0.0048 |
| Right palm | 59 | 105 | 0.35 | <0.0001 | 0.11 | 0.0042 | |
| Left palm | 55 | 91 | 0.31 | <0.0001 | 0.13 | 0.002 | |
| Fecal | 59 | 114 | 0.21 | <0.0001 | 0.077 | 0.0032 | |
| Oral | 59 | 117 | 0.18 | <0.0001 | 0.18 | <0.0001 | |
| Father–Child | Forehead | 14 | 31 | 0.17 | 0.025 | 0.026 | 0.36 |
| Right palm | 14 | 31 | 0.21 | 0.0085 | 0.11 | 0.096 | |
| Fecal | 14 | 33 | 0.17 | 0.053 | 0.066 | 0.20 | |
| Oral | 14 | 33 | 0.07 | 0.069 | 0.23 | 0.0051 | |
| Mother–Child | Forehead | 14 | 31 | 0.25 | 0.0024 | 0.018 | 0.41 |
| Right palm | 14 | 30 | 0.20 | 0.013 | 0.0019 | 0.51 | |
| Fecal | 14 | 33 | 0.10 | 0.11 | 0.10 | 0.095 | |
| Oral | 14 | 33 | 0.21 | 0.0047 | 0.26 | 0.0012 | |
| Father-Infant | Forehead | 12 | 24 | 0.25 | 0.0034 | 0.030 | 0.99 |
| Right Palm | 12 | 21 | 0.16 | 0.016 | 0.0063 | 0.96 | |
| Fecal | 12 | 23 | 0.057 | 0.96 | −0.10 | 0.97 | |
| Oral | 12 | 24 | 0.061 | 0.61 | −0.0086 | 0.70 | |
| Mother–Infant | Forehead | 12 | 23 | 0.23 | 0.0025 | −0.025 | 0.99 |
| Right palm | 12 | 21 | 0.34 | <0.0001 | 0.012 | 0.87 | |
| Fecal | 12 | 23 | 0.066 | 0.94 | −0.036 | 0.86 | |
| Oral | 12 | 24 | 0.092 | 0.23 | 0.074 | 0.42 | |
| Dogs | Forehead | 12 | 22 | 0.71 | 0.0002 | 0.56 | <0.0001 |
| Back left paw | 12 | 23 | 0.83 | <0.0001 | 0.68 | <0.0001 | |
| Fecal | 12 | 25 | 0.25 | 0.0079 | 0.20 | 0.039 | |
| Oral | 12 | 25 | 0.25 | 0.017 | 0.30 | 0.023 |
-
‘Child’ refers to all offspring aged 3–18 years who cohabit with the parents. ‘Infant’ is considered to be an individual aged 0–12 months. The number of families and individuals used in each analysis is shown. Statistically significant comparisons (p<0.05) are bolded. Those both statistically significant and of relatively large magnitude (R>0.25) are bolded and italicized.
Table 5
Summary of a permutational distance-based linear model testing the effect of age (Age), gender (Sex), pet ownership (Dog or Cat), and family size (FamSize) on unweighted and weighted UniFrac distance (measures of community dissimilarity)
| AgeGroup | Body site | Best model | AICc | Psuedo-F | p | r2 | |
| Unweighted | All | Palms (L&R) | (+)Age | −453.49 | 5.9182 | 0.001 | 2.2 |
| (+)Dog | −455.94 | 4.4837 | 0.001 | 1.19 | |||
| (+)FamSize | −454.95 | 2.0378 | 0.001 | 0.62 | |||
| Forehead | (+)Age | −264.31 | 2.7579 | 0.001 | 1.69 | ||
| Fecal | (+)Age | −269.34 | 4.3775 | 0.001 | 2.71 | ||
| Oral | (+)Age | −386.58 | 2.4774 | 0.002 | 1.5 | ||
| Adults | Palms (L&R) | (+)Dog | −284.03 | 4.303 | 0.001 | 2.43 | |
| Forehead | (+)Dog | −166.1 | 2.3878 | 0.001 | 2.33 | ||
| Fecal | None | NA | NA | NA | NA | ||
| Oral | None | NA | NA | NA | NA | ||
| Infants | Palms (L&R) | None | NA | NA | NA | NA | |
| Forehead | None | NA | NA | NA | NA | ||
| Fecal | None | NA | NA | NA | NA | ||
| Oral | None | NA | NA | NA | NA | ||
| Seniors | Palms (L&R) | None | NA | NA | NA | NA | |
| Forehead | None | NA | NA | NA | NA | ||
| Fecal | None | NA | NA | NA | NA | ||
| Oral | None | NA | NA | NA | NA | ||
| Weighted | All | Palms (L&R) | (+)Age | −727.66 | 23.597 | 0.001 | 9.05 |
| (+)Sex | −730.84 | 5.218 | 0.001 | 1.57 | |||
| (+)FamSize | −733.39 | 4.5795 | 0.002 | 0.39 | |||
| Forehead | (+)Age | −418.2 | 19.463 | 0.001 | 15.11 | ||
| (+)Sex | −423.78 | 7.6939 | 0.001 | 1.29 | |||
| (+)FamSize | −424.89 | 3.1675 | 0.028 | 0.22 | |||
| Fecal | (+)Age | −353.08 | 2.4044 | 0.061 | 1.51 | ||
| Oral | (+)FamSize | −416.32 | 3.4073 | 0.019 | 2.05 | ||
| Adults | Palms (L&R) | (+)Sex | −462.24 | 4.5058 | 0.002 | 5.36 | |
| (+)FamSize | −464.11 | 3.9149 | 0.003 | 1.09 | |||
| (+)Dog | −465.65 | 3.5858 | 0.003 | 0.22 | |||
| Forehead | (+)Sex | −295.94 | 4.3628 | 0.008 | 4.18 | ||
| Fecal | None | NA | NA | NA | NA | ||
| Oral | None | NA | NA | NA | NA |
-
This analysis was performed for the entire data set (All) as well as separately for age groups. The terms from the best model for each body site are shown, along with the percent of total variation explained (r2). Those terms of statistically significant and largest effect are bolded for each body site.
Table 6
Summary of taxon abundances (%) present on the forehead for each age group
| Taxon | Infants | Children/Adolescents | Adults | Seniors |
| Actinobacteria | ||||
| Propionibacteriaceae* (8.78 × 10⁻¹³) | 6.3 | 12 | 51 | 31 |
| Corynebacteriaceae | 0.7 | 2.0 | 4.2 | 9.3 |
| Micrococcaceae* (0.0072) | 2.0 | 2.7 | 1.2 | 2.5 |
| Bacteroidetes | ||||
| Prevotellaceae* (7.02 × 10⁻⁹) | 7.7 | 5.6 | 1.4 | 1.5 |
| Porphyromonadaceae* (8.53 × 10⁻¹²) | 2.8 | 3.1 | 0.4 | 0.8 |
| Flavobacteriaceae | 1.2 | 1.4 | 1.1 | 2.0 |
| Bacteroidaceae | 0.5 | 1.4 | 1.1 | 1.9 |
| Firmicutes | ||||
| Streptococcaceae* (5.32 × 10-37) | 47 | 27 | 5.5 | 8.2 |
| Staphylococcaceae* (0.0088) | 2.1 | 2.6 | 12 | 4.3 |
| Carnobacteriaceae* (5.99 × 10⁻²⁴) | 4.8 | 3.4 | 0.5 | 0.7 |
| Veillonellaceae* (1.25 × 10⁻¹³) | 4.6 | 1.9 | 0.7 | 1.3 |
| Alphaproteobacteria | ||||
| Sphingomonadaceae | 0.9 | 1.4 | 1.3 | 0.9 |
| Betaproteobacteria | ||||
| Neisseriaceae | 2.4 | 4.1 | 2.3 | 6.9 |
| Comamonadaceae | 0.4 | 1.2 | 1.5 | 2.9 |
| Gammaproteobacteria | ||||
| Pasteurellaceae* (1.64 × 10⁻⁶) | 5.3 | 7.0 | 1.3 | 2.4 |
| Moraxellaceae | 0.7 | 2.2 | 1.7 | 1.8 |
-
*
A significant effect of age (p<0.05 after Bonferroni correction; exact p-values are shown in parentheses). Infants were considered to be individuals aged 0–12 months, children/adolescents as 1–17 years, adults as 18–59 years and seniors as ≥60 years.
-
Family level abundances of >1% were subjected to ANOVA analysis in QIIME.
Table 7
Summary of a linear mixed effects analysis on the response of bacterial diversity across the body sites using the full data set and then filtered to include just adults
| Age group | Body site | Fixed effects | Random effects | Model | ΔAIC | Pr(Chi) |
| All | Palms (L&R) | Dog + Cat + Sex + Kid | BS + Ag + Fa + FS + Pl + La | Full | 0 | NA |
| (−)Dog | 2.91 | 0.027 | ||||
| (−)Cat | −5.60 | 1 | ||||
| (−)Sex | 1.73 | 0.053 | ||||
| (−)Kid | −5.62 | 1 | ||||
| Forehead | Dog + Cat + Sex + Kid | Ag + Fa + FS + Pl + La | Full | 0 | NA | |
| (−)Dog | 0.57 | 0.11 | ||||
| (−)Cat | −5.25 | 1 | ||||
| (−)Sex | 0.97 | 0.085 | ||||
| (−)Kid | −4.22 | 1 | ||||
| Fecal | Dog + Cat + Sex + Kid | Ag + Fa + FS + Pl + La | Full | 0 | NA | |
| (−)Dog | −0.049 | 0.16 | ||||
| (−)Cat | −0.15 | 0.17 | ||||
| (−)Sex | 0.33 | 0.13 | ||||
| (−)Kid | −0.13 | 0.17 | ||||
| Oral | Dog + Cat + Sex + Kid | Ag + Fa + FS + Pl + La | Full | 0 | NA | |
| (−)Dog | 1.22 | 0.072 | ||||
| (−)Cat | −1.95 | 0.82 | ||||
| (−)Sex | −1.88 | 0.73 | ||||
| (−)Kid | −1.78 | 0.64 | ||||
| Adults | Palms (L&R) | Dog + Cat + Sex + Kid | BS + Fa + FS + Pl + La | Full | 0 | NA |
| (−)Dog | 4.09 | 0.014 | ||||
| (−)Cat | −5.29 | 1 | ||||
| (−)Sex | 4.11 | 0.013 | ||||
| (−)Kid | −5.69 | 1 | ||||
| Forehead | Dog + Cat + Sex + Kid | Fa + FS + Pl + La | Full | 0 | NA | |
| (−)Dog | 2.52 | 0.033 | ||||
| (−)Cat | −4.99 | 1 | ||||
| (−)Sex | −0.37 | 0.20 | ||||
| (−)Kid | −4.38 | 1 | ||||
| Fecal | Dog + Cat + Sex + Kid | Fa + FS + Pl + La | Full | 0 | NA | |
| (−)Dog | 0.30 | 0.13 | ||||
| (−)Cat | 0.24 | 0.13 | ||||
| (−)Sex | −1.44 | 0.45 | ||||
| (−)Kid | −0.42 | 0.21 | ||||
| Oral | Dog + Cat + Sex + Kid | Fa + FS + Pl + La | Full | 0 | NA | |
| (−)Dog | −0.29 | 0.19 | ||||
| (−)Cat | −6.50 | 1 | ||||
| (−)Sex | −7.22 | 1 | ||||
| (−)Kid | −5.41 | 1 |
-
The factors tested are co-habitation of dogs (Dog), cats (Cat), children (Kid) and host gender (Sex). The base model takes into account the variability between age groups (Ag), families (Fa), family sizes (FS), sequencing lanes (La), and primer plates (Pl). Variability between left and right palms (BS) is also controlled for in the palm model. The change in model fit resulting from exclusion of each fixed effect based on Akaike's Information Criterion (AIC) is shown. Statistically significant values are in bold text.
Table 8
Summary of taxon abundances (%) on the external body sites of dogs
| Taxon | Back left paw | Back right paw | Front left paw | Paws averaged | Forehead |
| Actinobacteria | |||||
| Corynebacteriaceae | 1.8 | 1.3 | 0.7 | 1.2 | 1.0 |
| Microbacteriaceae | 4.0 | 4.2 | 4.3 | 4.2 | 1.8 |
| Micrococcaceae | 2.2 | 2.6 | 2.4 | 2.4 | 1.7 |
| Nocardioidaceae | 3.3 | 3.4 | 3.2 | 3.3 | 1.5 |
| Propionibacteriaceae | 3.0 | 3.9 | 3.1 | 3.3 | 4.5 |
| Bacteroidetes | |||||
| Bacteroidaceae | 2.1 | 1.9 | 2.6 | 2.2 | 3.2 |
| Porphyromonadaceae | 2.8 | 1.6 | 1.7 | 2.0 | 5.7 |
| Prevotellaceae | 1.1 | 1.8 | 3.0 | 2.0 | 2.4 |
| Flavobacteriaceae | 2.6 | 2.5 | 2.5 | 2.5 | 3.3 |
| Flexibacteraceae | 1.6 | 1.7 | 1.7 | 1.7 | 1.5 |
| Firmicutes | |||||
| Staphylococcaceae | 1.4 | 2.0 | 1.0 | 1.5 | 1.2 |
| Streptococcaceae | 1.2 | 1.6 | 1.5 | 1.4 | 2.8 |
| Lachnospiraceae | 1.1 | 0.9 | 1.7 | 1.3 | 1.2 |
| Veillonellaceae | 0.3 | 0.5 | 1.8 | 0.9 | 0.7 |
| Fusobacteria | |||||
| Fusobacteriaceae | 2.3 | 1.7 | 1.8 | 2.0 | 3.8 |
| Alphaproteobacteria | |||||
| Bradyrhizobiaceae | 0.6 | 0.8 | 0.5 | 0.6 | 1.0 |
| Hyphomicrobiaceae | 1.1 | 1.2 | 1.1 | 1.2 | 0.7 |
| Methylobacteriaceae | 0.4 | 0.7 | 0.3 | 0.5 | 1.0 |
| Sphingomonadaceae | 5.3 | 6.6 | 5.2 | 5.7 | 6.1 |
| Betaproteobacteria | |||||
| Comamonadaceae | 1.9 | 1.9 | 1.5 | 1.8 | 2.6 |
| Oxalobacteraceae | 1.5 | 1.8 | 1.5 | 1.6 | 1.3 |
| Neisseriaceae | 1.3 | 1.0 | 1.4 | 1.2 | 2.8 |
| Gammaproteobacteria | |||||
| Enterobacteriaceae | 2.2 | 5.1 | 5.9 | 4.4 | 2.5 |
| Oceanospirillaceae | 2.3 | 1.0 | 3.1 | 2.1 | 0.3 |
| Pasteurellaceae | 2.4 | 2.5 | 2.3 | 2.4 | 6.9 |
| Moraxellaceae | 1.9 | 1.4 | 1.6 | 1.6 | 2.2 |
| Pseudomonadaceae | 7.1 | 4.8 | 5.5 | 5.8 | 3.4 |
-
Family level abundances >1% are shown. The front right paw was sampled but failed to amplify and is therefore not shown.
Table 9
Summary of taxon abundances (%) present on the palms for each age group
| Infants | Children/ Adolescents | Adults | Seniors | |
| Actinobacteria | ||||
| Corynebacteriaceae | 0.7 (0.6) | 3 (2.3) | 4.2 (3.9) | 4.3 (4.0) |
| Micrococcaceae | 4.7 (3.9) | 3.9 (3.9) | 2.8 (2.6) | 2.7 (2.8) |
| Propionibacteriaceae* (0.00016) | 3.1 (2.2) | 11 (11) | 27 (27) | 20 (15.9) |
| Bacteroidetes | ||||
| Bacteroidaceae | 0.5 (0.6) | 1.6 (1.4) | 1.6 (3.3) | 3.4 (8.7) |
| Flavobacteriaceae | 1 (1.4) | 1.9 (1.4) | 2.7 (2.0) | 3.8 (4.1) |
| Porphyromonadaceae | 2 (2.1) | 1.9 (1.5) | 1.4 (0.7) | 0.6 (1.0) |
| Prevotellaceae | 5.6 (4.2) | 4.2 (5.7) | 3.1 (3.0) | 2.1 (1.7) |
| Firmicutes | ||||
| Carnobacteriaceae* (1.15 × 10⁻¹¹) | 6.4 (5.8) | 5 (3.5) | 1.7 (1.9) | 1 (0.7) |
| ClostridialesFamilyXI.IncertaeSedis | 0.2 (NA) | 1.5 (NA) | 1 (NA) | 1.4 (NA) |
| Lachnospiraceae* (8.57 × 10⁻⁵) | 0.3 (0.5) | 0.9 (1.3) | 1 (1.5) | 3.1 (7.2) |
| Lactobacillaceae | 0.1 (NA) | 0.2 (NA) | 1.5 (NA) | 4.2 (NA) |
| (Ruminococcaceae*) (1.17 × 10⁻⁵) | NA (0.2 ) | NA (0.7) | NA (0.8) | NA (3.5) |
| Staphylococcaceae | 3.2 (2.1) | 5.1 (7.2) | 6.7 (7.3) | 2.8 (2.2) |
| Streptococcaceae* (3.91 × 10⁻¹⁰) | 49 (54) | 27 (26) | 15 (16) | 13 (9.1) |
| Veillonellaceae* (1.76 × 10⁻⁷) | 5.5 (4.5) | 2.2 (2.1) | 1.7 (2.0) | 1.9 (2.1) |
| Fusobacteria | ||||
| Fusobacteriaceae | 1.6 (1.6) | 1.8 (1.2) | 1.4 (1.2) | 1 (1.0) |
| Betaproteobacteria | ||||
| Comamonadaceae* (9.90 × 10⁻⁵) | 0.7 (0.3) | 0.7 (1.0) | 1.5 (1.7) | 3.6 (3.7) |
| Neisseriaceae | 2.6 (2.4) | 3.5 (2.3) | 1.6 (1.1) | 2 (1.6) |
| Gammaproteobacteria | ||||
| Moraxellaceae | 1.5 (0.7) | 1.2 (1.7) | 3.2 (2.7) | 3.3 (2.7) |
| Pasteurellaceae* (0.017) | 2.6 (3.3) | 4.4 (2.9) | 1.8 (1.6) | 1.2 (1.1) |
| Pseudomonadaceae* (0.049) | 0.2 (0.2) | 0.6 (0.7) | 1.1 (1.0) | 2.4 (3.0) |
| (Enterobacteriaceae*) (0.027) | NA (0.6) | NA (0.8) | NA (0.8) | NA (2.7) |
-
*
A significant effect of age (p<0.05 after Bonferroni correction; exact p-values are shown in parentheses).
-
Shown only for the right palm (left palm showed similar trends). Infants were considered to be individuals aged 0–12 months, children/adolescents as 1–17 years, adults as 18–59 years and seniors as ≥60 years. Abundances for the left palm are shown in parentheses. Family level abundances of greater than 1% were subjected to ANOVA analysis in QIIME. Taxa present at >1% on the left palm but <1% on the right are shown in parentheses.
Download links
A two-part list of links to download the article, or parts of the article, in various formats.
Downloads (link to download the article as PDF)
Open citations (links to open the citations from this article in various online reference manager services)
Cite this article (links to download the citations from this article in formats compatible with various reference manager tools)
Cohabiting family members share microbiota with one another and with their dogs
eLife 2:e00458.
https://doi.org/10.7554/eLife.00458


