Ribosome structures to near-atomic resolution from thirty thousand cryo-EM particles
- Medical Research Council Laboratory of Molecular Biology, United Kingdom
Figures
Figure 1 with 1 supplement
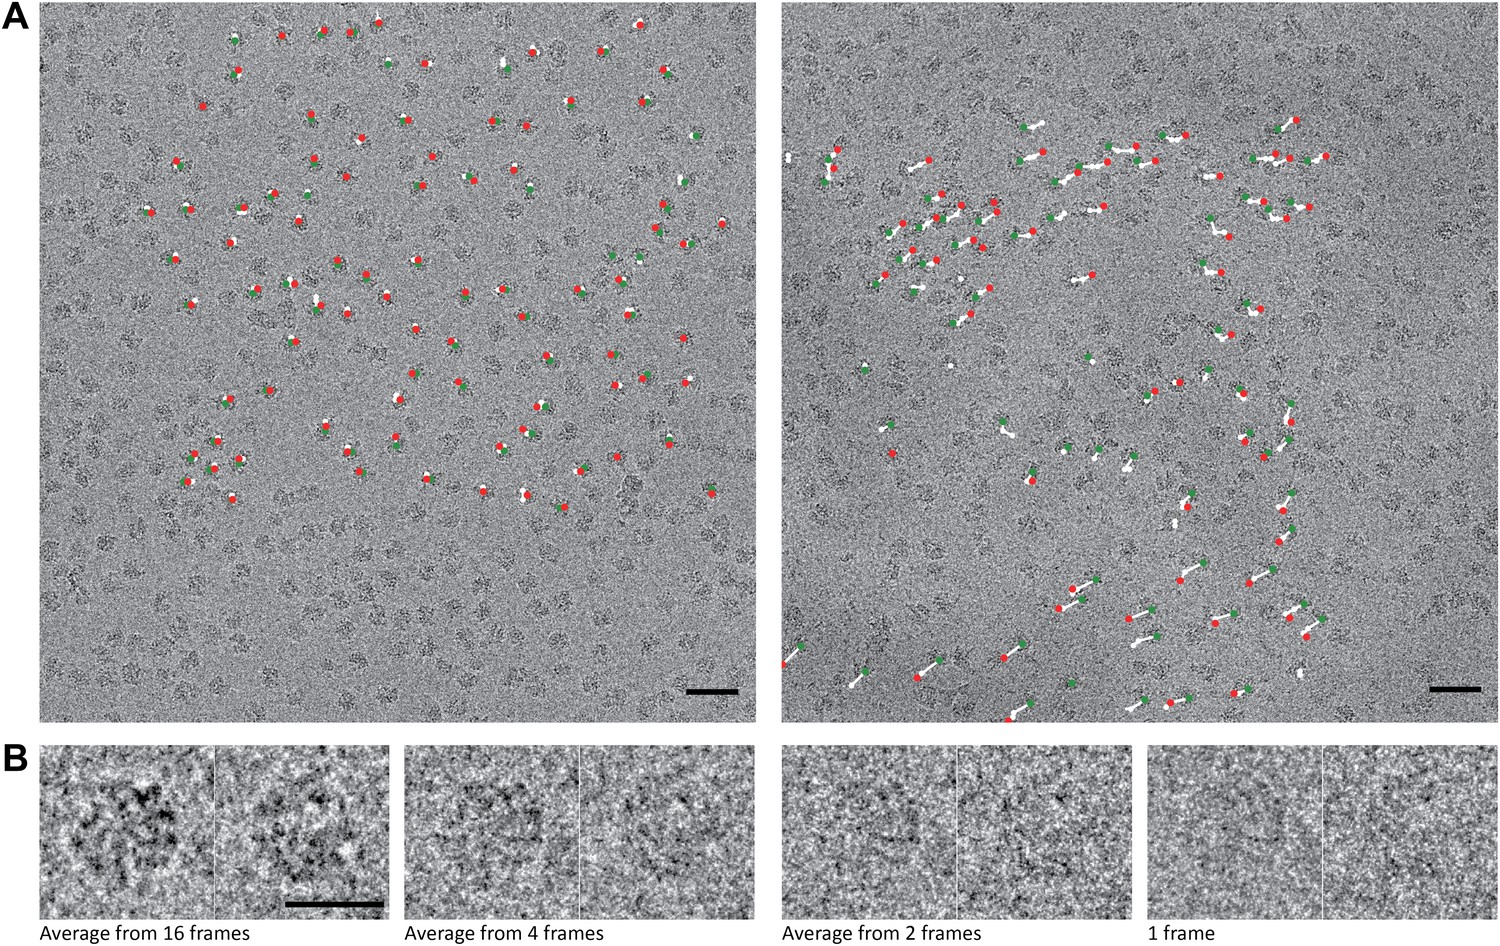
70S data collected on a back-thinned FEI Falcon detector.
(A) The 16-frame (1-s) average of two untilted videos. The scale bar indicates 50 nm. Relative positions for independently aligned four-frame averaged particles are shown with circles connected by white lines. The relative position of the average from the first four frames is shown in green, the relative position of the last four frames in red. The differences between these relative positions are exaggerated 25 times for improved clarity, and only those four-frame averages for which correct alignment was confirmed by tilt-pair analysis are included. Movements in the area on the left are smaller (up to 1.5 Å) then in the area on the right (up to 10 Å). (B) Examples of two individual ribosome particles as averages over a decreasing number of video frames. The scale bar indicates 20 nm. Zoomed-in areas of micrographs, additional individual particles and reference-free 2D class averages for both the 70S and 80S data are shown in Figure 1—figure supplement 1.
Figure 1—figure supplement 1
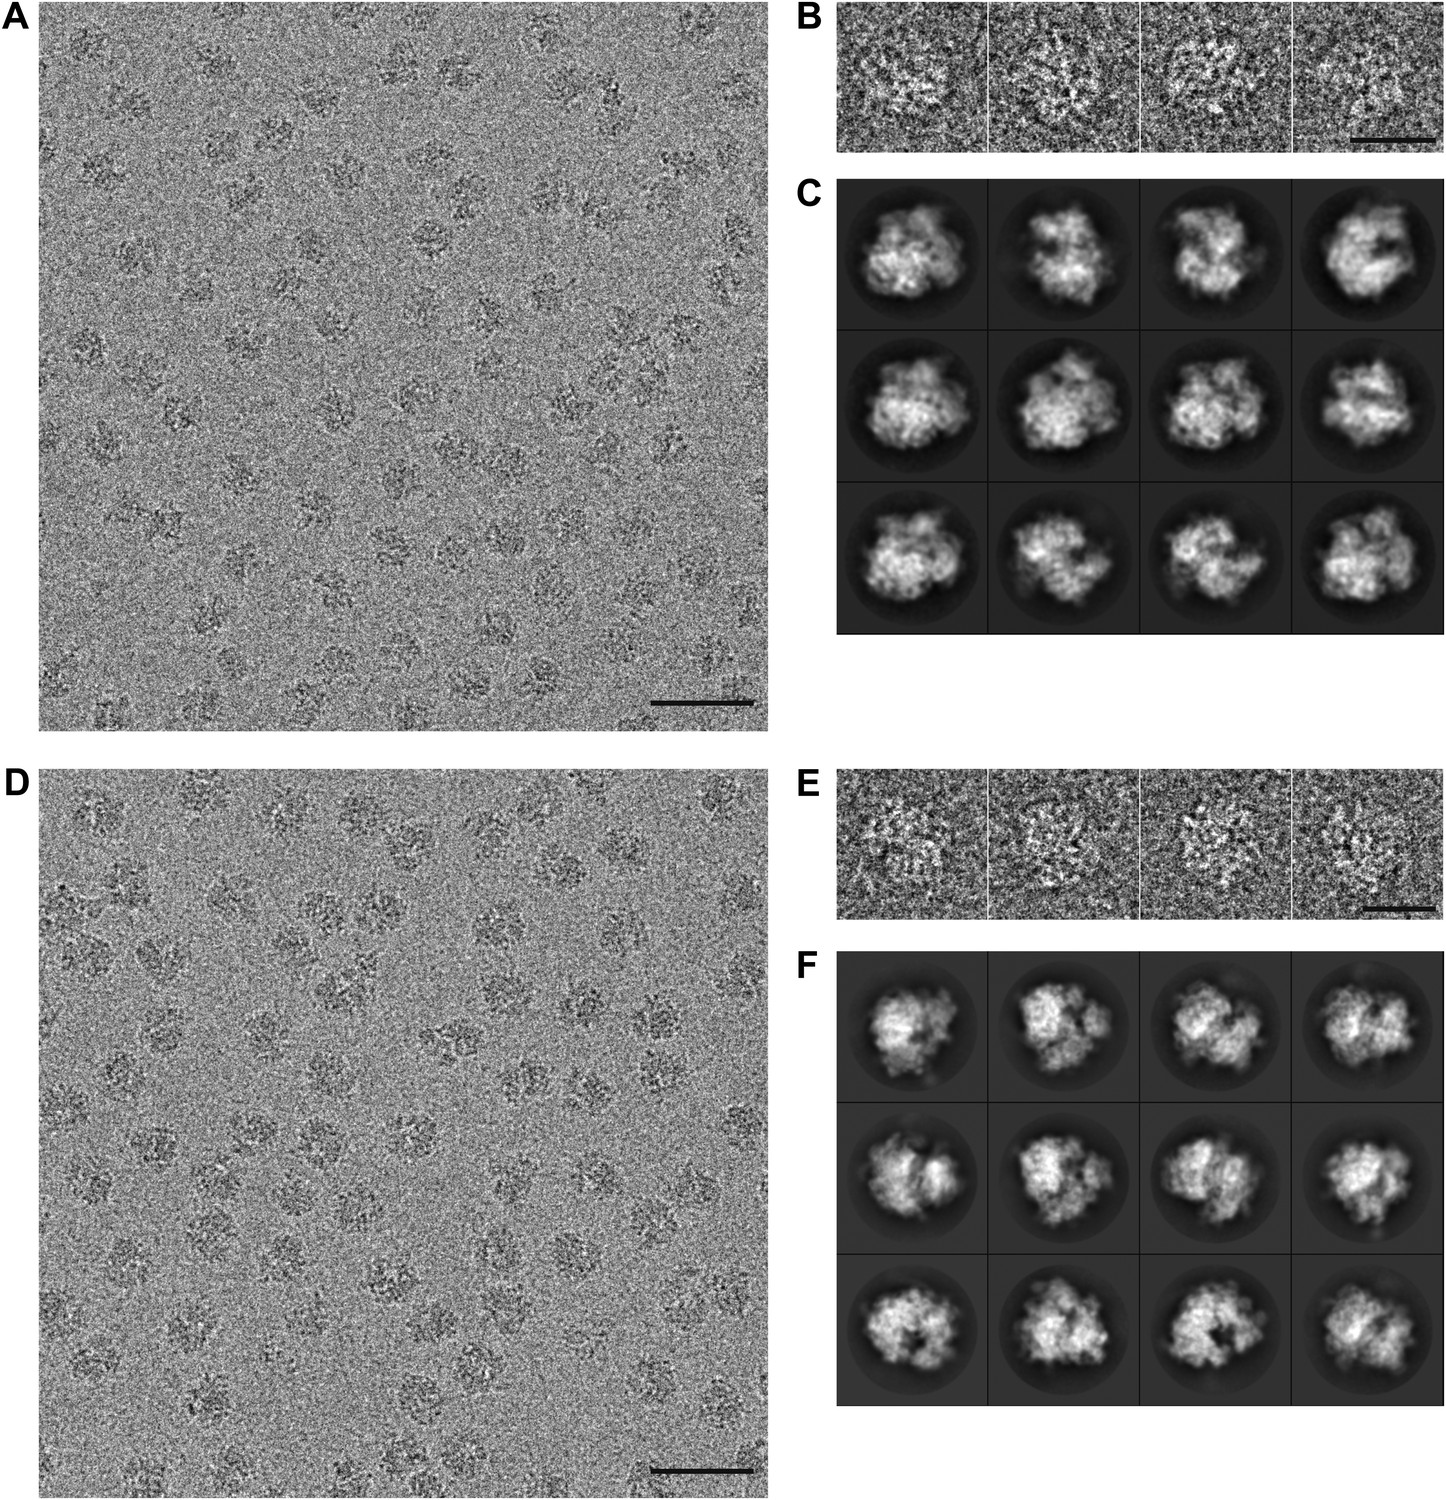
Part of a recorded micrograph and reference-free class averages for the 70S and 80S data sets.
The scale bar indicates 50 nm. (B) Individual 70S particles. The scale bar indicates 20 nm. (C) Reference-free 2D class averages showing distinct views of the 70S ribosome. (D–F) As in (A–C), but for the 80S data.
The scale bar indicates 50 nm.
Figure 2 with 1 supplement
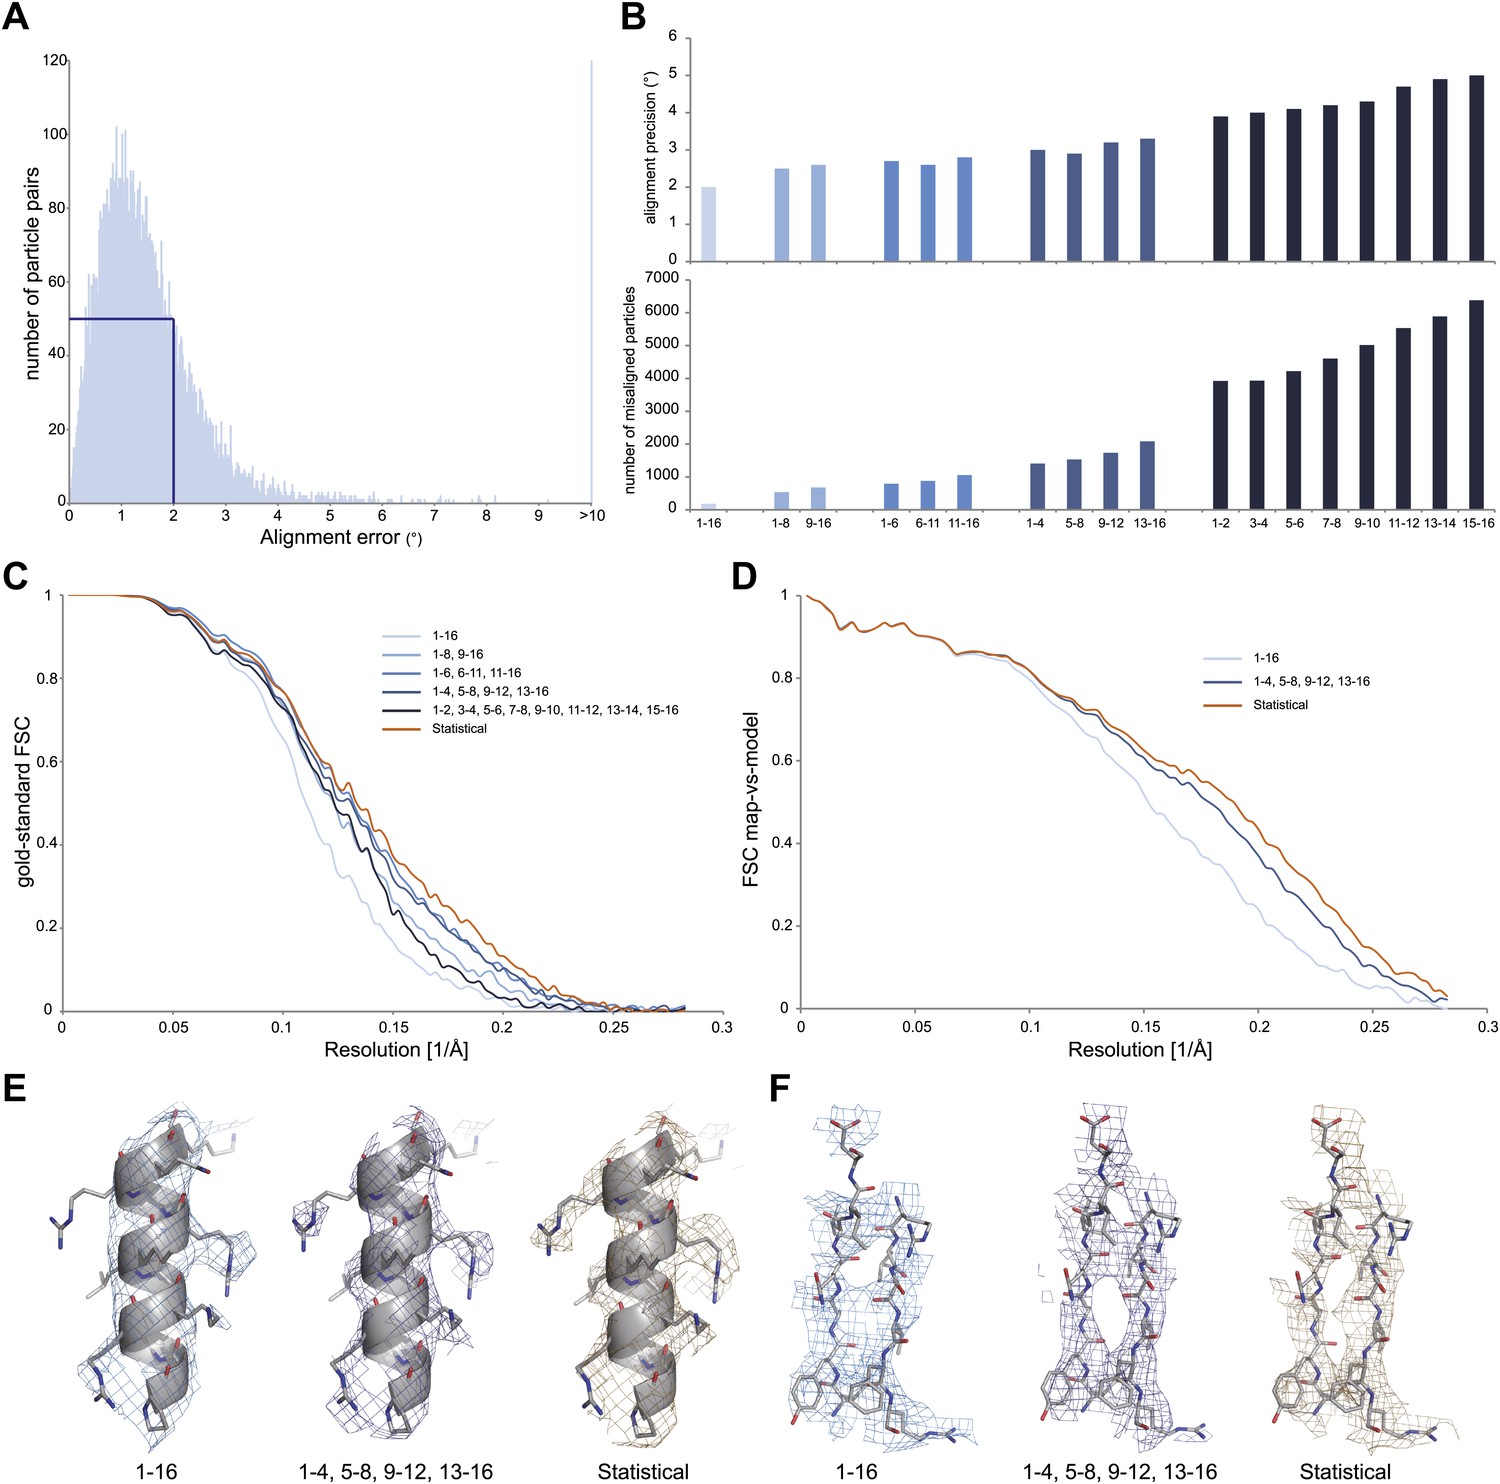
Development of video processing procedures on the 70S data set.
(A) Histogram of tilt-pair alignment errors for particles that were calculated as 16-frame averages. The width of the first peak at half its height is 2°. This value is plotted as the tilt-pair alignment precision in (B). (B) Tilt-pair alignment precision (top) and the number of incorrectly aligned particle pairs (bottom) for independent refinements of 16-frame, 8-frame, 6-frame, 4-frame and 2-frame averages (ranges in frame numbers are indicated on the x-axis); the total number of particle pairs was 15,202. Particle pairs with alignment errors larger than three times the reported precision were considered as aligned incorrectly. (C) Gold-standard FSC curves. The same blue colors are used as in (B); orange lines indicate the results of the statistical video-processing approach described in the main text. (D) FSC-curves between a rigid-body fitted atomic model and the cryo-EM maps (using the same color scheme as in [C]). (E–F) Illustrative density and atomic model for the reconstructions obtained from 16-frame averaged particles (light blue), independently refined four-frame averages (dark blue) and the statistical video processing procedure (orange). The density maps were sharpened with B-factors of −211, −185 and −178 Å2, respectively. Complete density maps for these three reconstructions are shown in Figure 2—figure supplement 1.
Figure 2—figure supplement 1
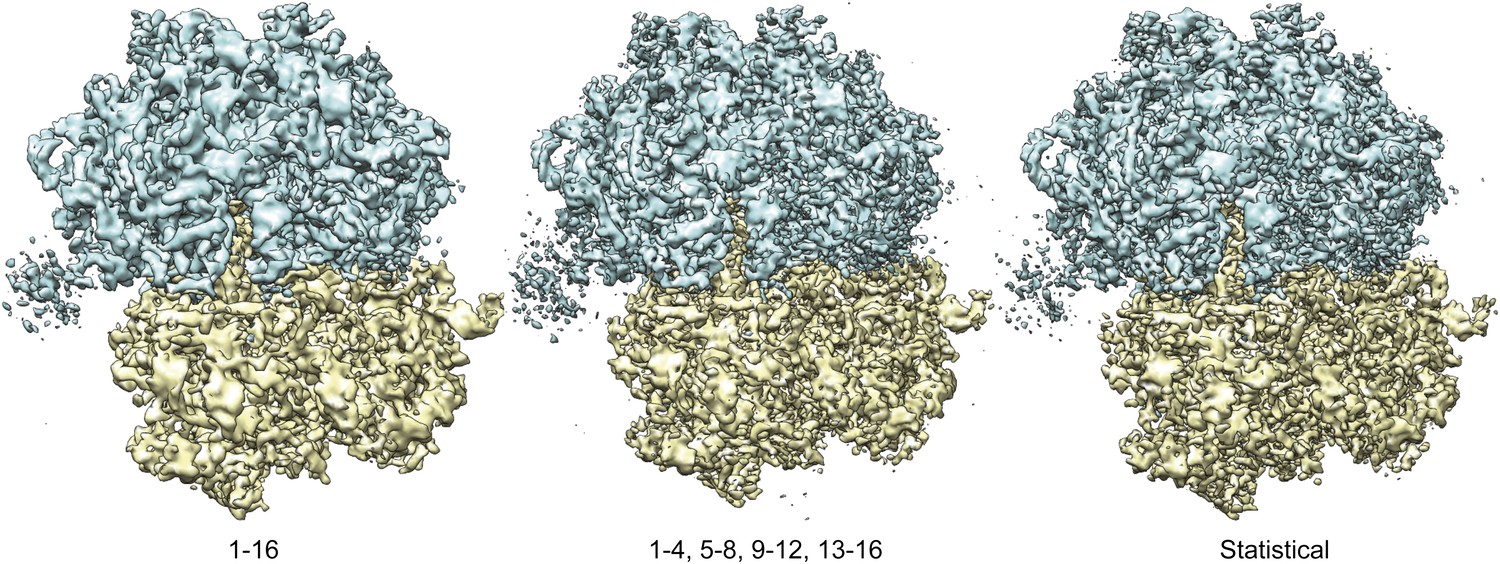
Overall views of the 70S ribosome reconstructions obtained from 16-frame averaged particles (left), independently refined four-frame averages (middle) and the statistical video processing procedure (right).
The large subunit is shown in blue; the small subunit in yellow.
Figure 3
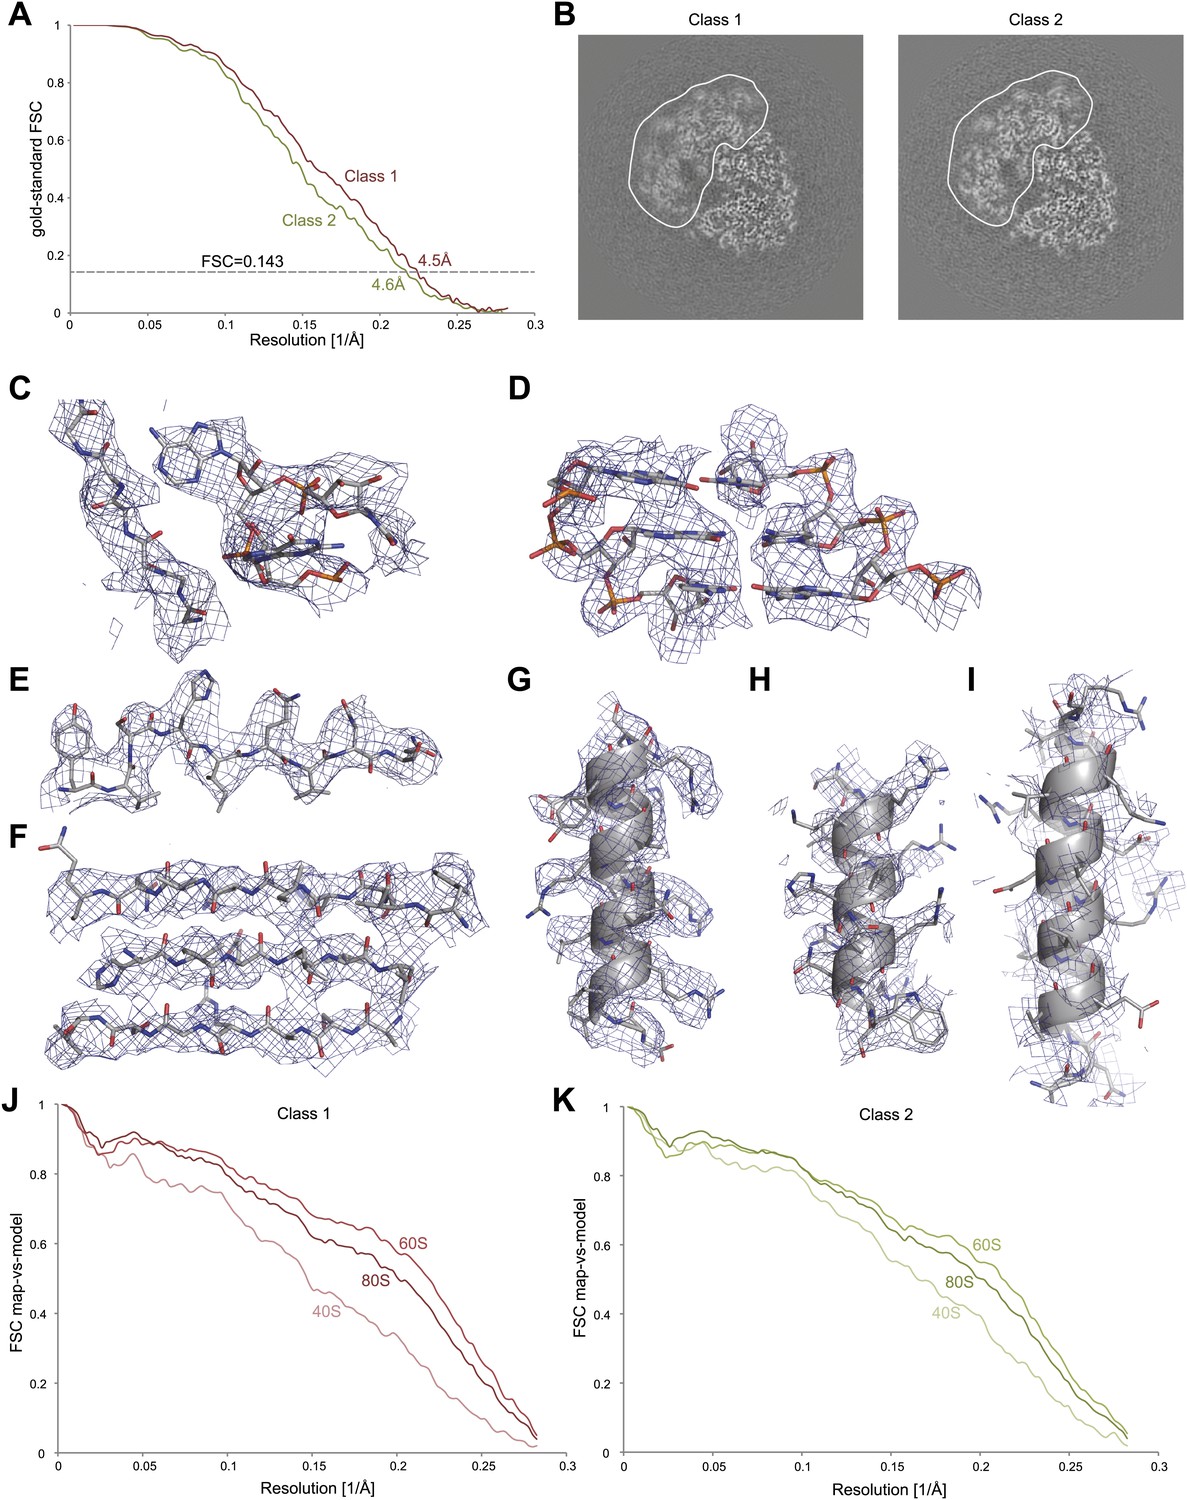
Application of the statistical video processing procedure to an 80S ribosome data set.
(A) Gold-standard FSC curves for class 1 (red) and class 2 (green). (B) Slices through the reconstructions of class 1 (left) and class 2 (right). The fuzzy appearance for the density of the 40S subunits (green and red lines) is an indication of unresolved structural heterogeneity. (C–G) Densities for the 60S subunit of class 1 showing a protein loop interacting with a flipped-out RNA base (C), a short stretch of an RNA helix (D), a β-strand (E), a β-sheet (F), and an α-helix (G). (H–I) Density for the 40S subunit of class 1 showing a well-resolved α-helix (H) and a poorly-resolved one (I). The density map of class 1 was sharpened with a B-factor of −160 Å2. (J) FSC curves between the map of class 1 and the rigid-body fitted atomic models of the entire 80S particle, and for the 40S and 60S subunits separately. (K) As in J, but for class 2.
Videos
Video 1
Shown are the density maps for the two classes of the 80S data set after 3D classification, which display a difference of ∼2° in ratchet-like rotation. The resolution is 6.5 Å for class 1 and 6.7 Å for class 2. However, the maps appear to be of lower resolution as they have not been sharpened.
Video 2
Shown is the cryo-EM density map for class 1 of the 80S data set together with the atomic models that are also shown in Figure 3C–I. Density for the 60S subunit is shown in blue, density for the 40S subunit in yellow. The density for the 40S subunit in the overall view is filtered to 5.0 Å resolution for improved clarity, all other densities are filtered at 4.1 Å resolution.
Download links
A two-part list of links to download the article, or parts of the article, in various formats.
Downloads (link to download the article as PDF)
Open citations (links to open the citations from this article in various online reference manager services)
Cite this article (links to download the citations from this article in formats compatible with various reference manager tools)
Ribosome structures to near-atomic resolution from thirty thousand cryo-EM particles
eLife 2:e00461.
https://doi.org/10.7554/eLife.00461


