Arabidopsis plants perform arithmetic division to prevent starvation at night
- John Innes Centre, United Kingdom
Figures
Figure 1 with 1 supplement
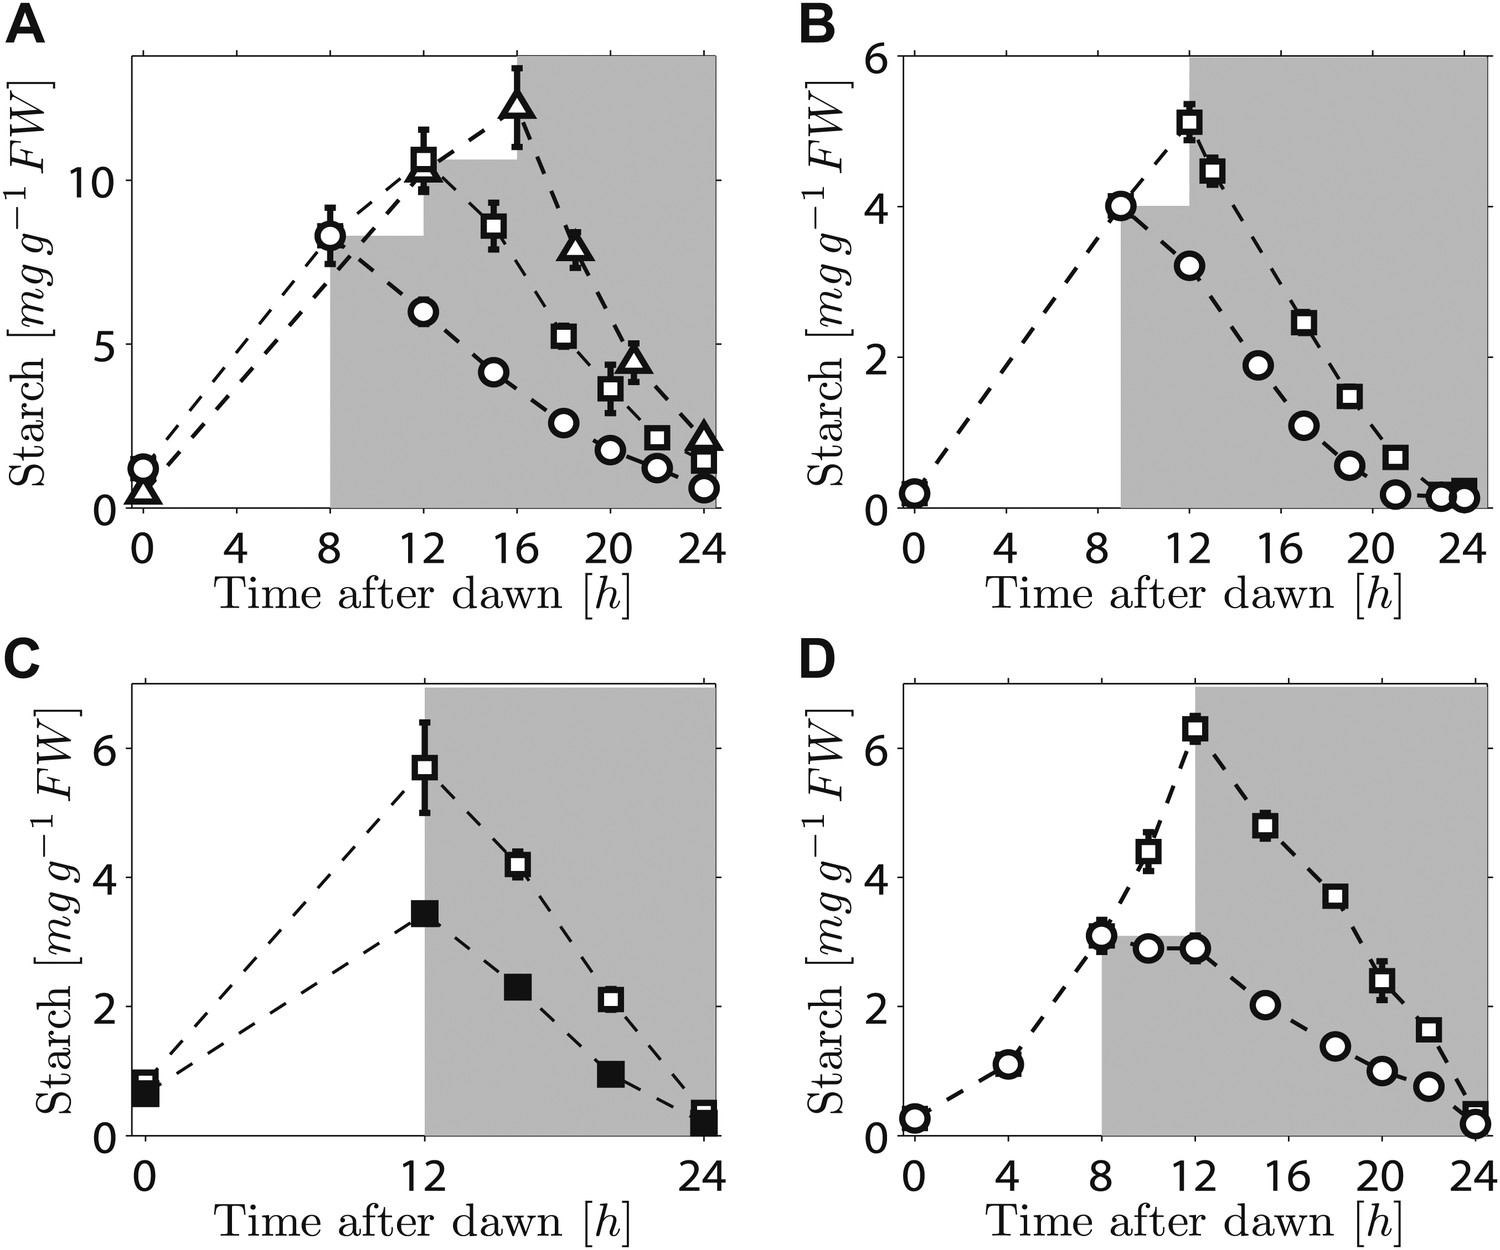
Starch content levels from experiments with unexpected variation in either starch content at the onset of darkness or the time of onset of darkness.
(A) Starch turnover in Arabidopsis grown in 12-hr light/12-hr dark, then subject to unexpected early (8 hr, n = 6 individual rosettes, circles) normal (12 hr, n = 6, squares) or unexpected late (16 hr, n = 5, triangles) onset of darkness. (B) Starch turnover in Arabidopsis cca1/lhy mutant grown in 12-hr light/12-hr dark, then subject to unexpected early (9 hr, circles), or normal (12 hr, squares) onset of darkness (n = 6–10). (C) Starch turnover in Arabidopsis exposed to different daytime light levels: 90 µmol quanta m−2 s−1 (open squares) or 50 µmol quanta m−2 s−1 (filled squares) (both n = 5, previously all plants grown in 12-hr light/12-hr dark with 90 µmol quanta m−2 s−1). (D) Starch turnover in Brachypodium grown in 12-hr light/12-hr dark, then subject to unexpected early (8 hr, circles) or normal (12 hr, squares) onset of darkness (both n = 6). Error bars are standard error of the mean throughout.
Figure 1—figure supplement 1
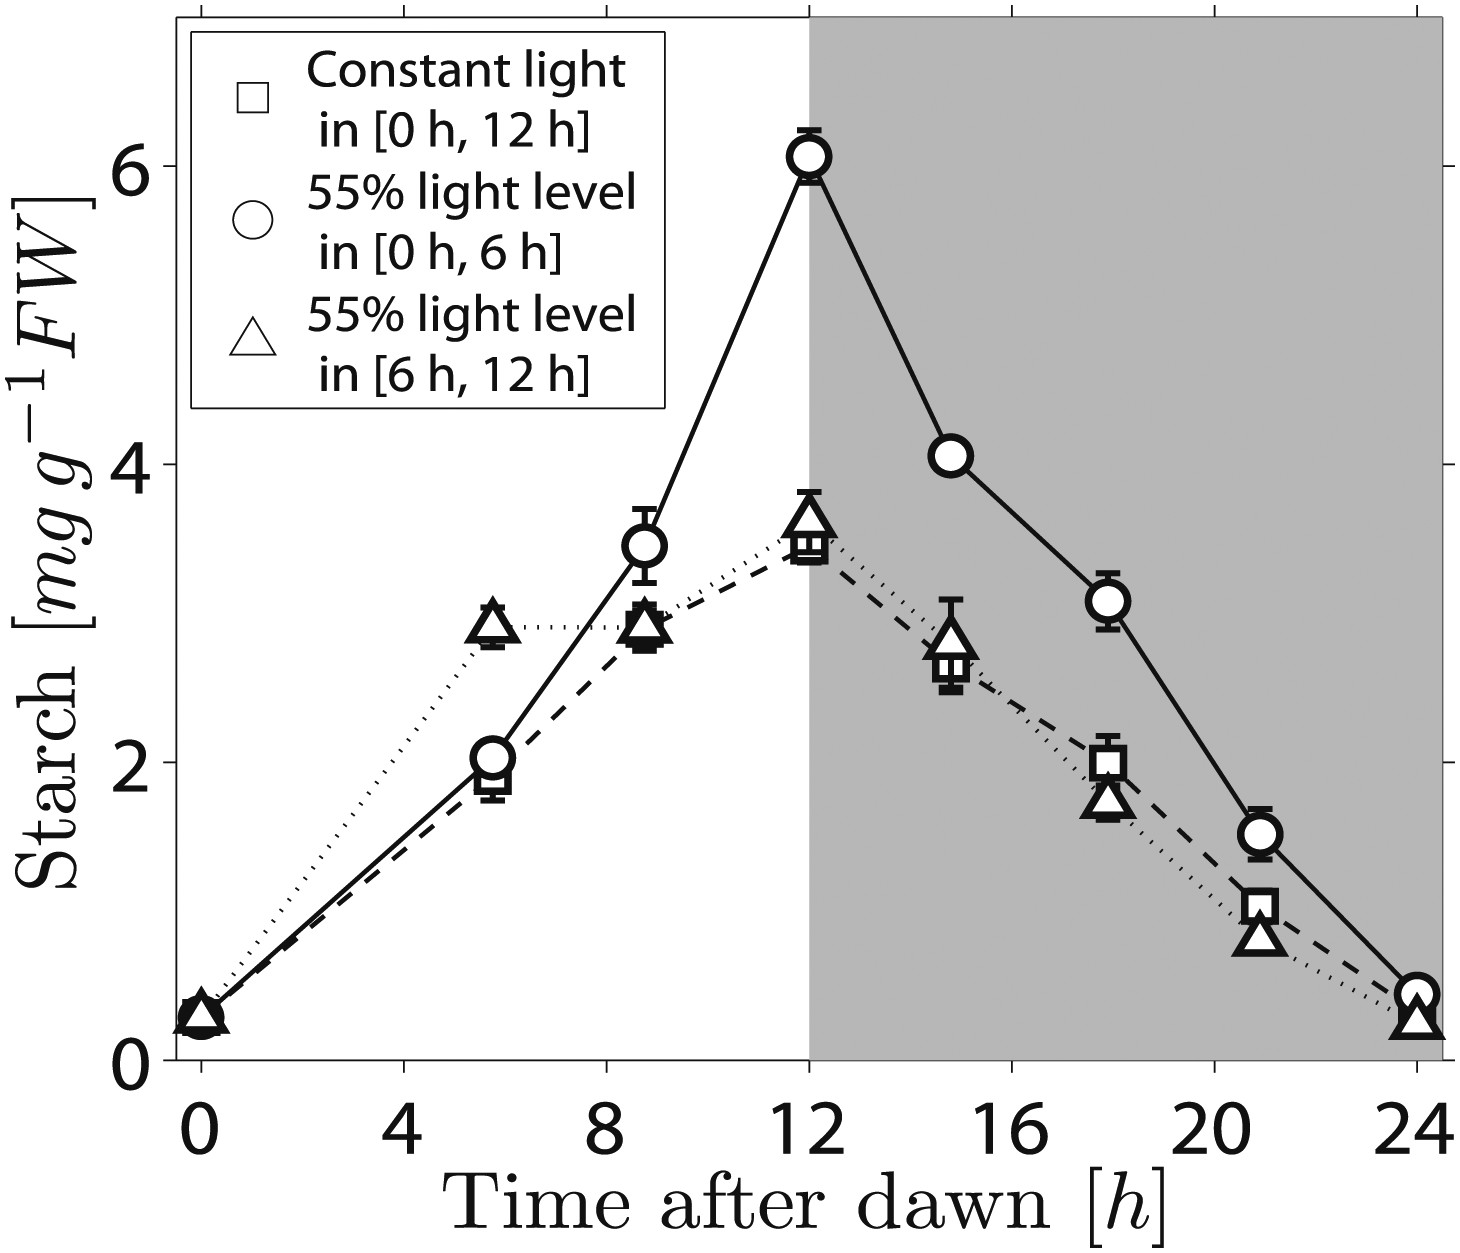
Starch content levels in Arabidopsis plants exposed to different regimes of varying light level over a single light period.
Three sets of plants (each n = 5 individual rosettes) were grown in 12-hr light, 12-hr dark and were then subject to different light regimes during a single day. One set (squares) was exposed to normal light levels (180 μmol quanta m−2 s−1), the other two were shaded to about 55% of normal light level (100 μmol quanta m−2 s−1) for either the first 6 hr (circles) or the second 6 hr (triangles) of the 12-hr light period, with the normal light level for the other 6-hr period. Error bars are standard error of the mean.
Figure 2
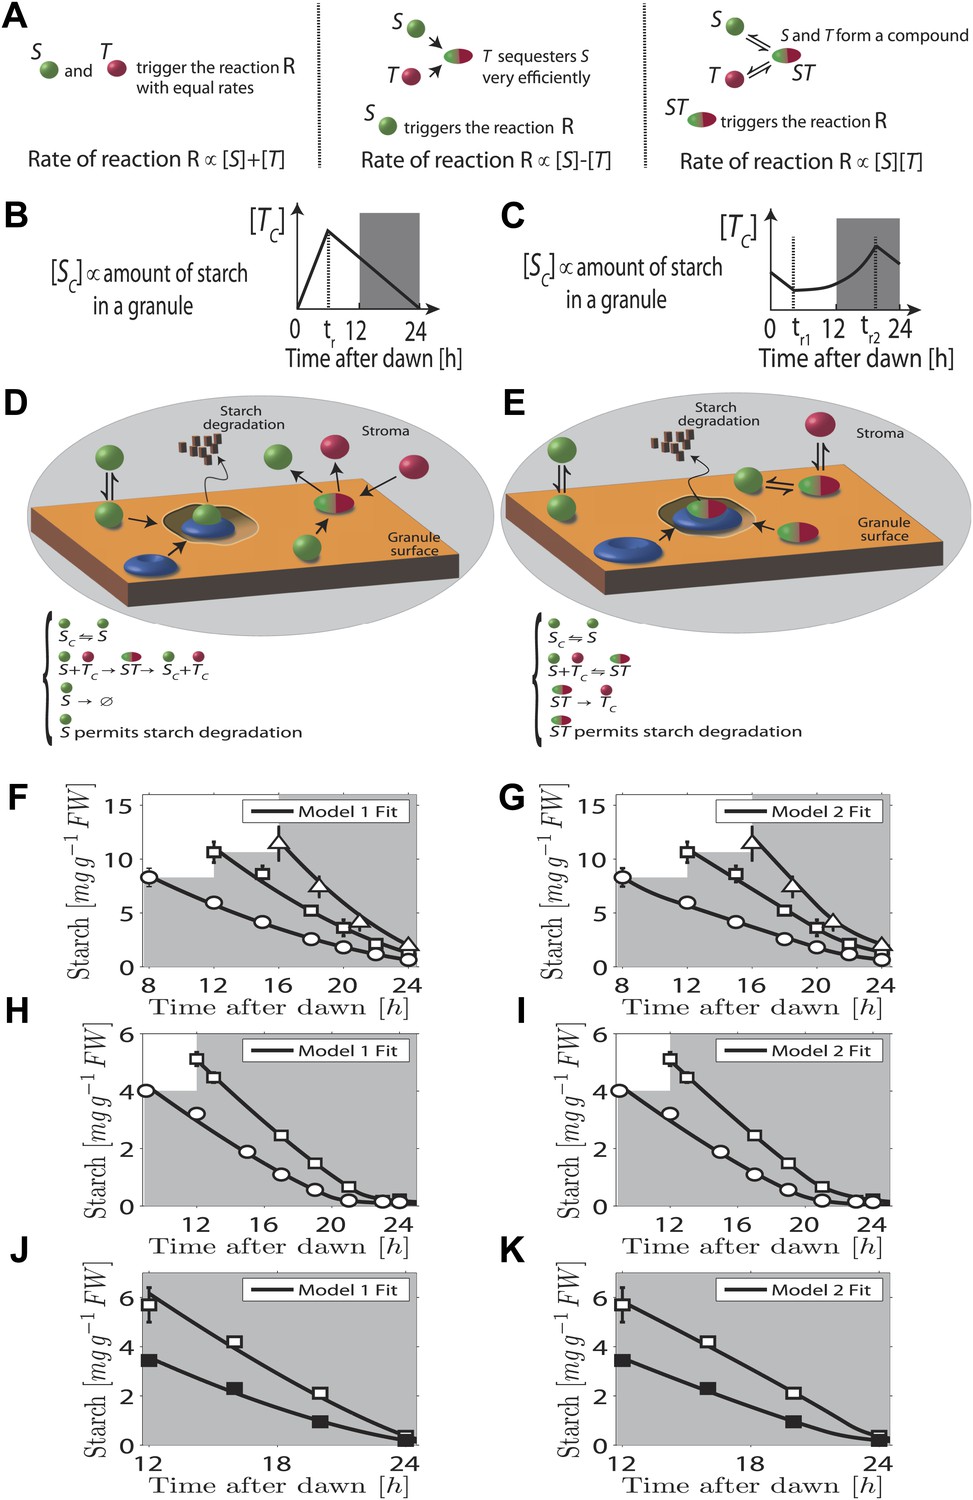
Chemical kinetic models capable of implementing analog arithmetic operations.
(A) Pictorial summaries of schemes for analog implementation of addition, subtraction and multiplication between the concentrations of two molecules S and T. Square brackets indicate concentrations. (B) and (C) Schematic behavior of the stromal concentrations of S and T molecules ([SC] and [TC] respectively), in (B) first and (C) second arithmetic division models. In the first model, the T molecule tracks the time to expected dawn after a reset-time tr. In the second model the T molecule concentration increases with time proportionally to 1/(expected time to dawn) between tr1 and tr2. (D) and (E) Pictorial summaries of (D) first and (E) second analog arithmetic division models (not all reactions shown in pictures, for full details see ‘Materials and methods’). In the reaction schemes, molecules not attached to the starch granule surface have a ‘C’ subscript. The blue disk represents components of the starch degradation apparatus potentially activated by the S molecule in the first model, and by the ST complex in the second model. Best fits (full lines) of first (F), (H), and (J) and second (G), (I), and (K) arithmetic division models to Arabidopsis data from Figure 1A–C.
Figure 3 with 2 supplements
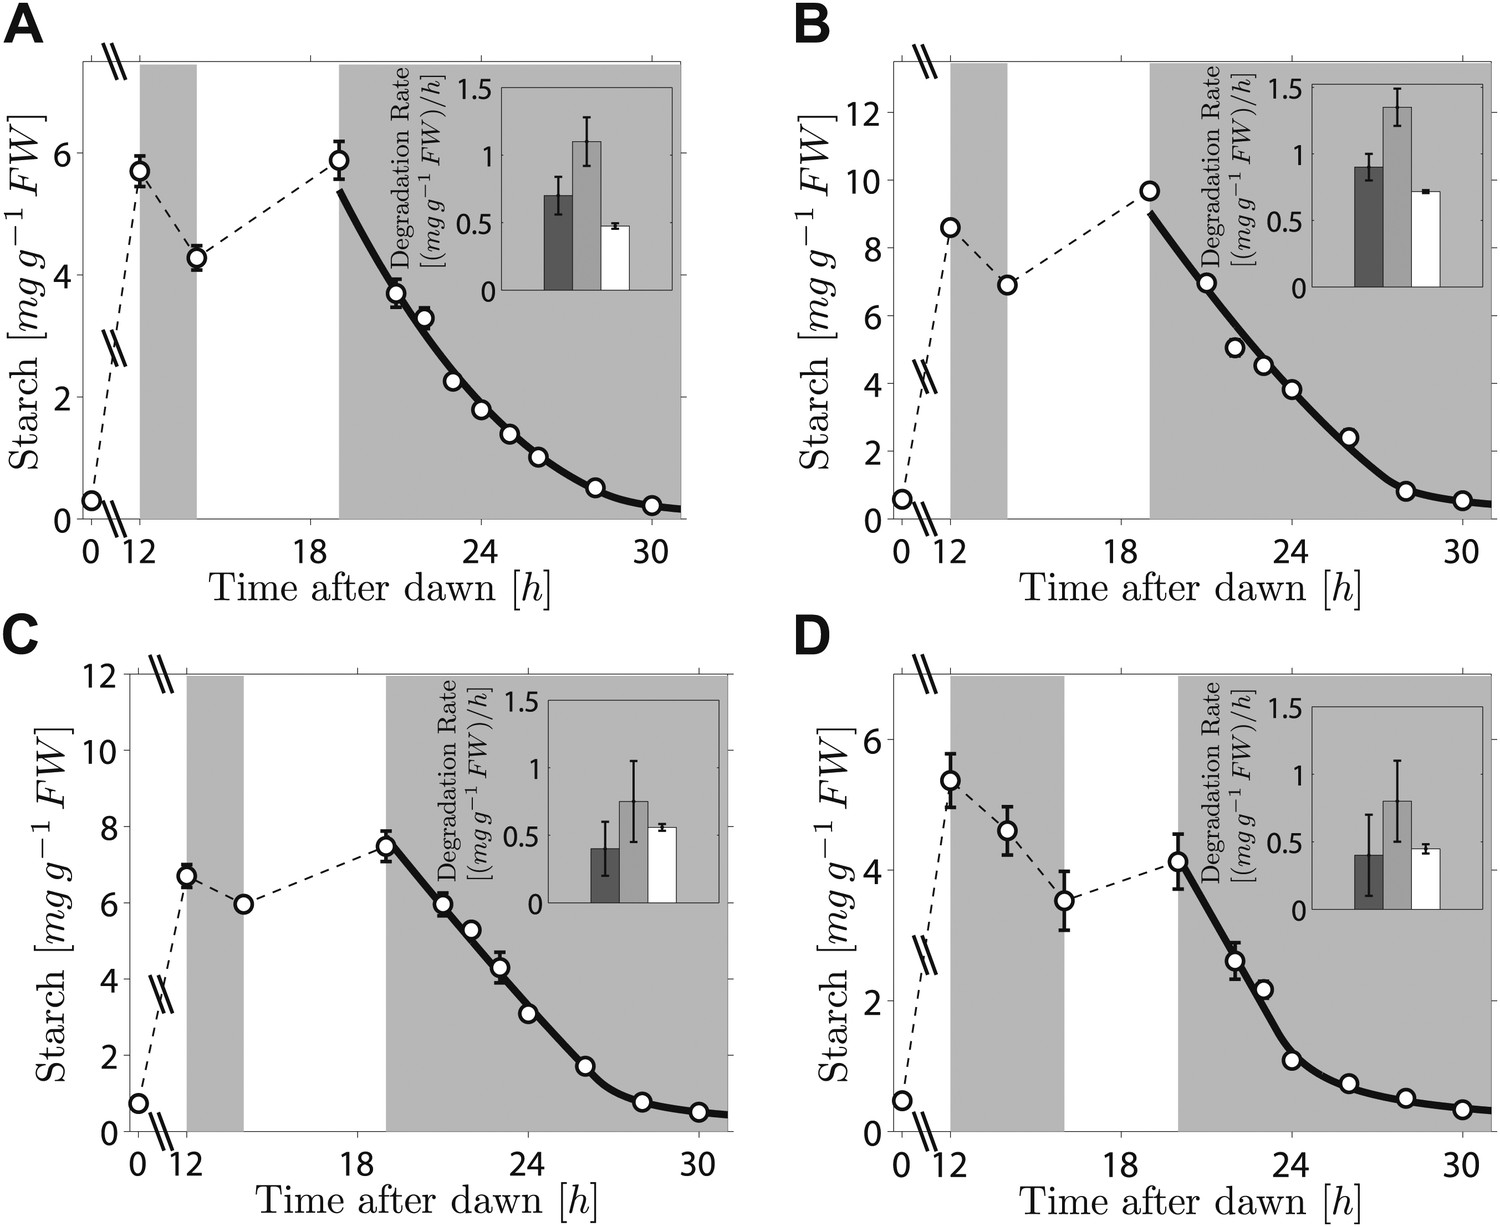
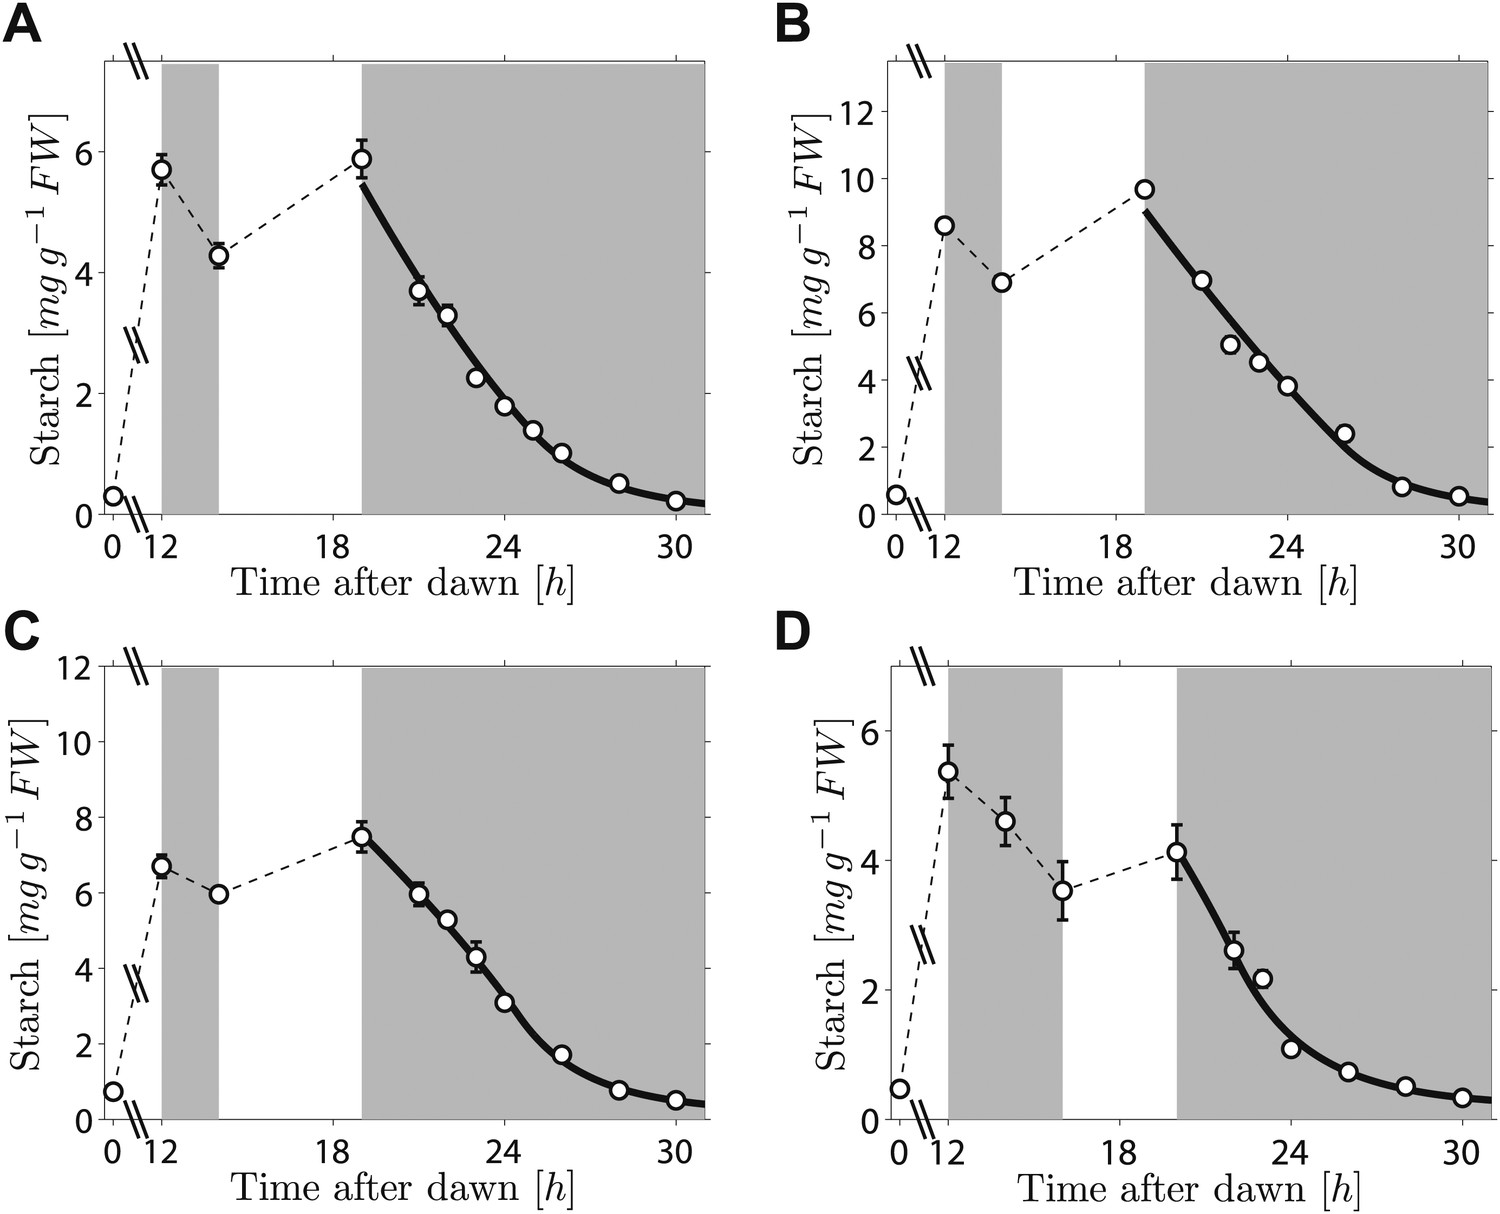
Starch content levels from experiments incorporating night-time light period.
Arabidopsis plants grown in 12-hr light/12-hr dark were subjected to onset of darkness at 12 hr, followed by an unexpected period of light, followed by extended darkness. (A)–(C) Three data sets (n = 12 individual rosettes, except n = 10 for C), in which the unexpected period of light was between 14 hr and 19 hr after dawn. (D) In the fourth dataset (n = 12) the period of light was between 16 hr and 20 hr after dawn. Full lines are best fits to the first division model. The second model produces very similar fits (see Figure 3—figure supplement 2). The insets show the respective starch degradation rates computed from the 12-hr and 14-hr experimental time points (dark grey bars) compared to those computed from the 19-hr and 21-hr experimental time points in panels (A–C) or the 20-hr and 22-hr time points in panel (D) (light grey bars). The white bars are the expected starch degradation rates in a normal 12 hr night, that is rates that would have ensured the complete depletion of the starch content measured at 12 hr at the time of expected dawn (24 hr). Error bars are standard error of the mean throughout.
Figure 3—figure supplement 1
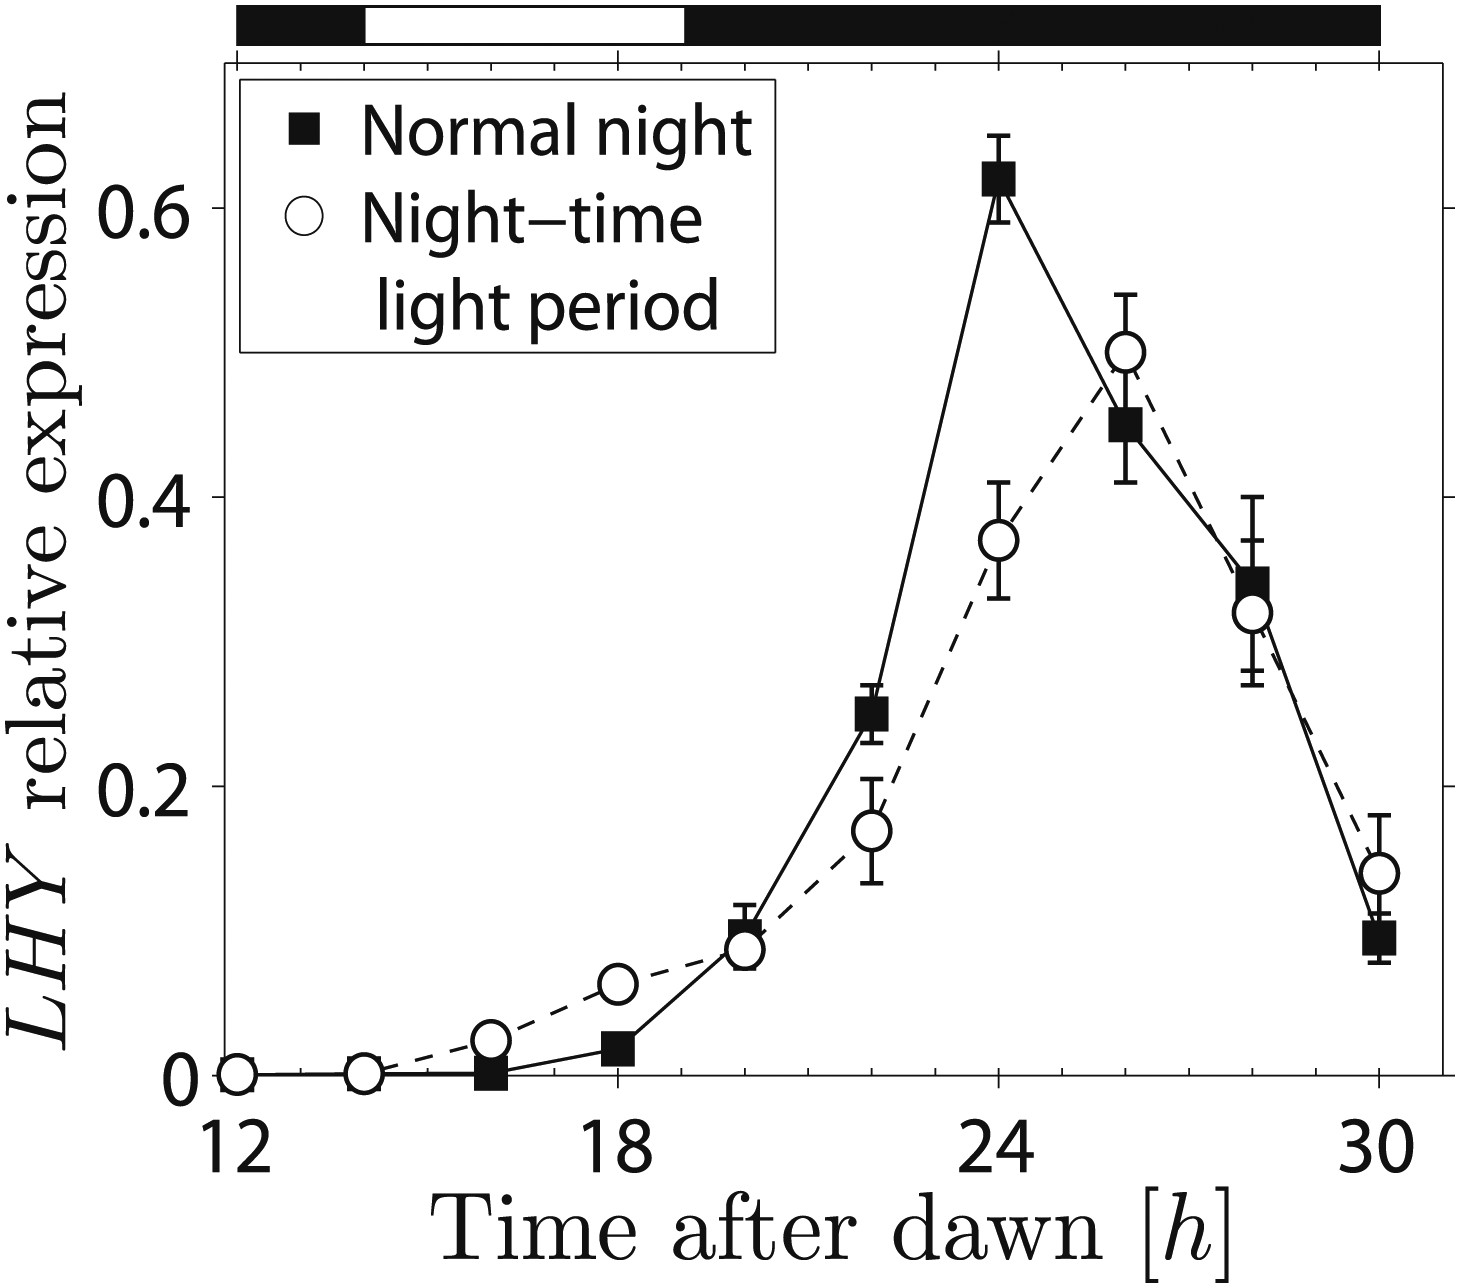
Transcript levels of LHY from experiment incorporating night-time light period.
LHY transcript levels (relative to ACT2) measured in Arabidopsis plants kept in continuous darkness after a normal night (squares), or subjected to a 5-hr night-time light period between 14 hr and 19 hr after dawn, and then kept in continuous darkness (circles), as in Figure 3A–C. Data for the night-time light period are from the same plants as in Figure 3B. n = 5 individual rosettes, error bars are standard error of the mean. The night-time light period is shown on top of graph.
Figure 3—figure supplement 2
Best fits (full lines) of the second division model to starch content data from experiments incorporating night-time light period.
Error bars are standard error of the mean throughout.
Figure 4 with 1 supplement
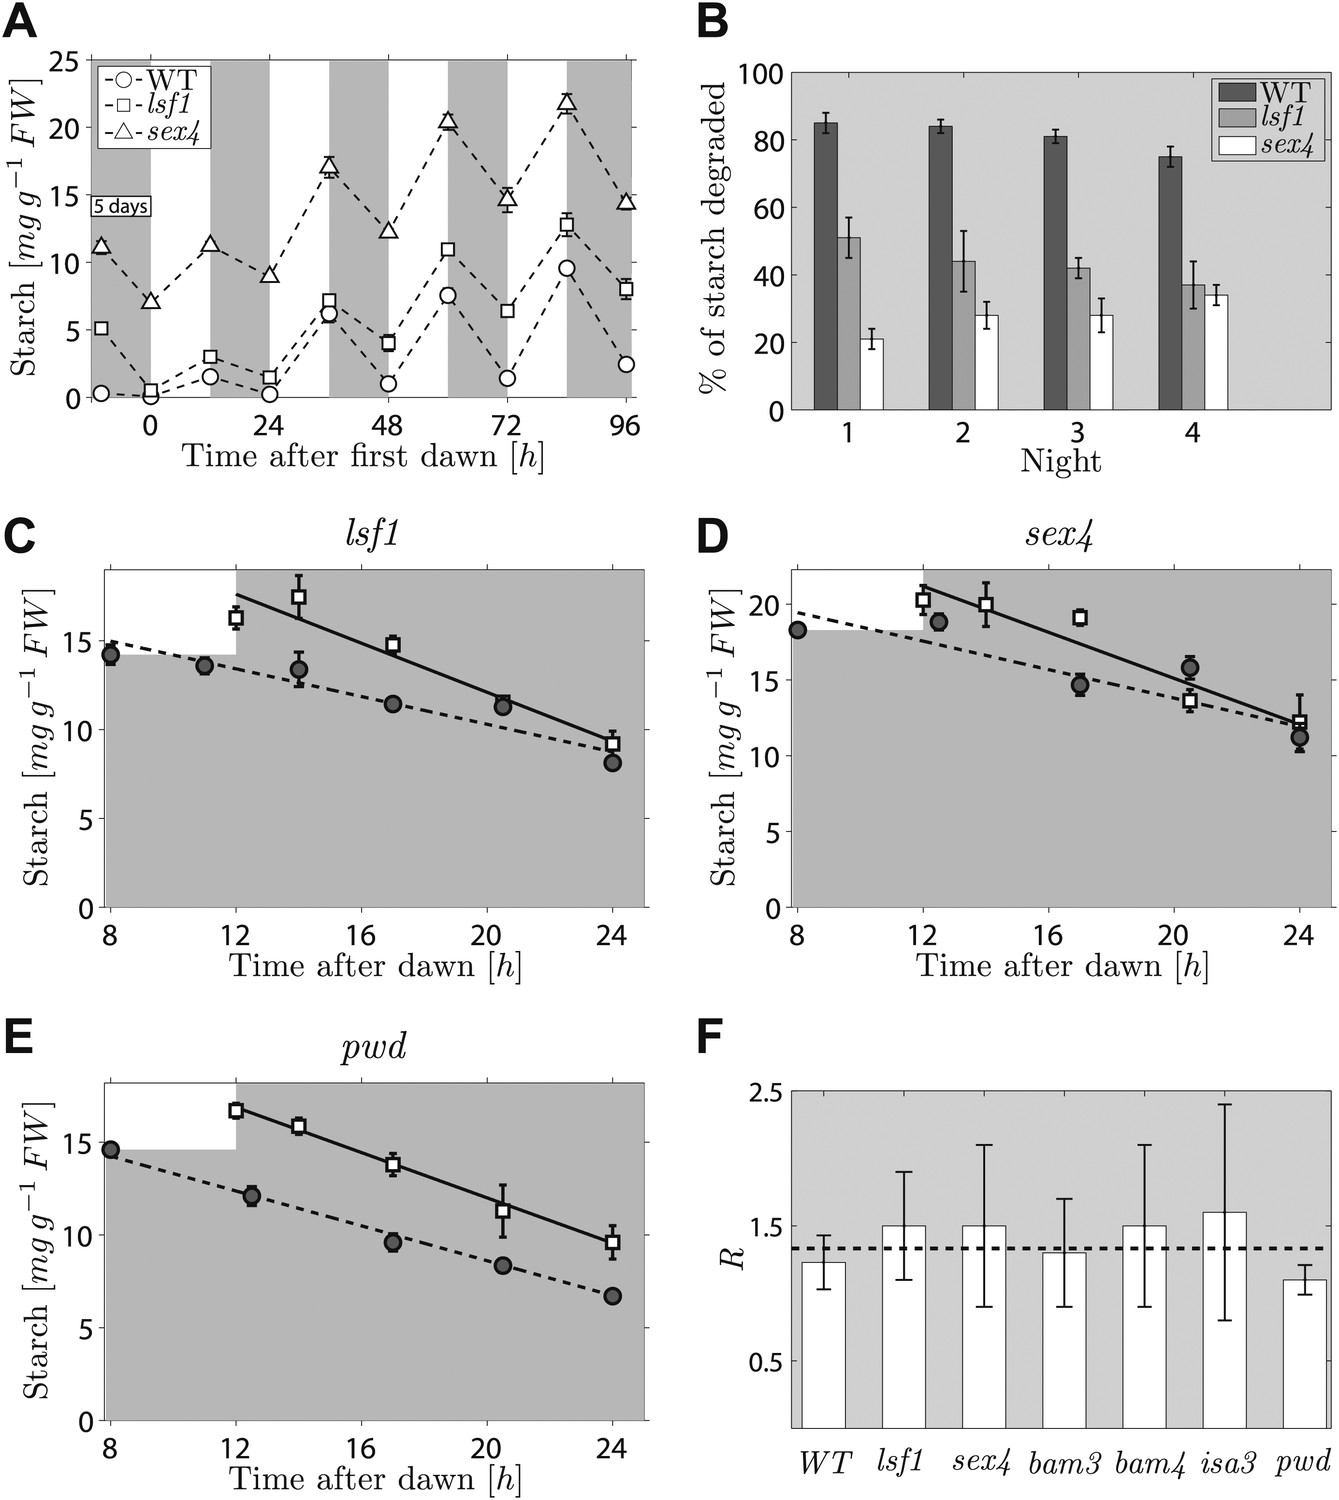
Starch content levels in mutant Arabidopsis plants defective in components of the starch degradation apparatus.
(A) Starch content in wild-type (WT) plants and lsf1 and sex4 mutant plants during four days of 12-hr light/12-hr dark following 5 days of continuous darkness, where plants were transferred back into the light (at time 0 hr on the x-axis) 132 hr after the end of the previous light period (n = 6 individual rosettes). Data for wild-type and lsf1 plants are from (Comparot-Moss et al., 2010). (B) The percentage of starch degraded during each of the four nights in (A). (C)–(E) Starch content in lsf1, sex4 and pwd mutant plants grown in 12-hr light/12-hr dark cycles then subject to unexpected early (8 hr, circles) or normal (12 hr, squares) onset of darkness (n = 5). The continuous and dashed lines are linear fits to the normal and early night datasets respectively. (F) For each of the labeled genotypes, R is the ratio between the starch degradation rates (each normalized by their respective end-of-light period starch content and as determined from the linear fits) during the normal and early nights. The dashed line shows the expected value of R for wild-type (WT) plants, that is, ratio of rates that would ensure the complete depletion of the starch content in all cases at the time of expected dawn (24 hr). See ‘Materials and methods’ for details about the linear fitting and the calculation of R. Error bars are standard error of the mean throughout. Figure 4—figure supplement 1 shows the datasets used to calculate R for WT, bam3, bam4 and isa3.
Figure 4—figure supplement 1
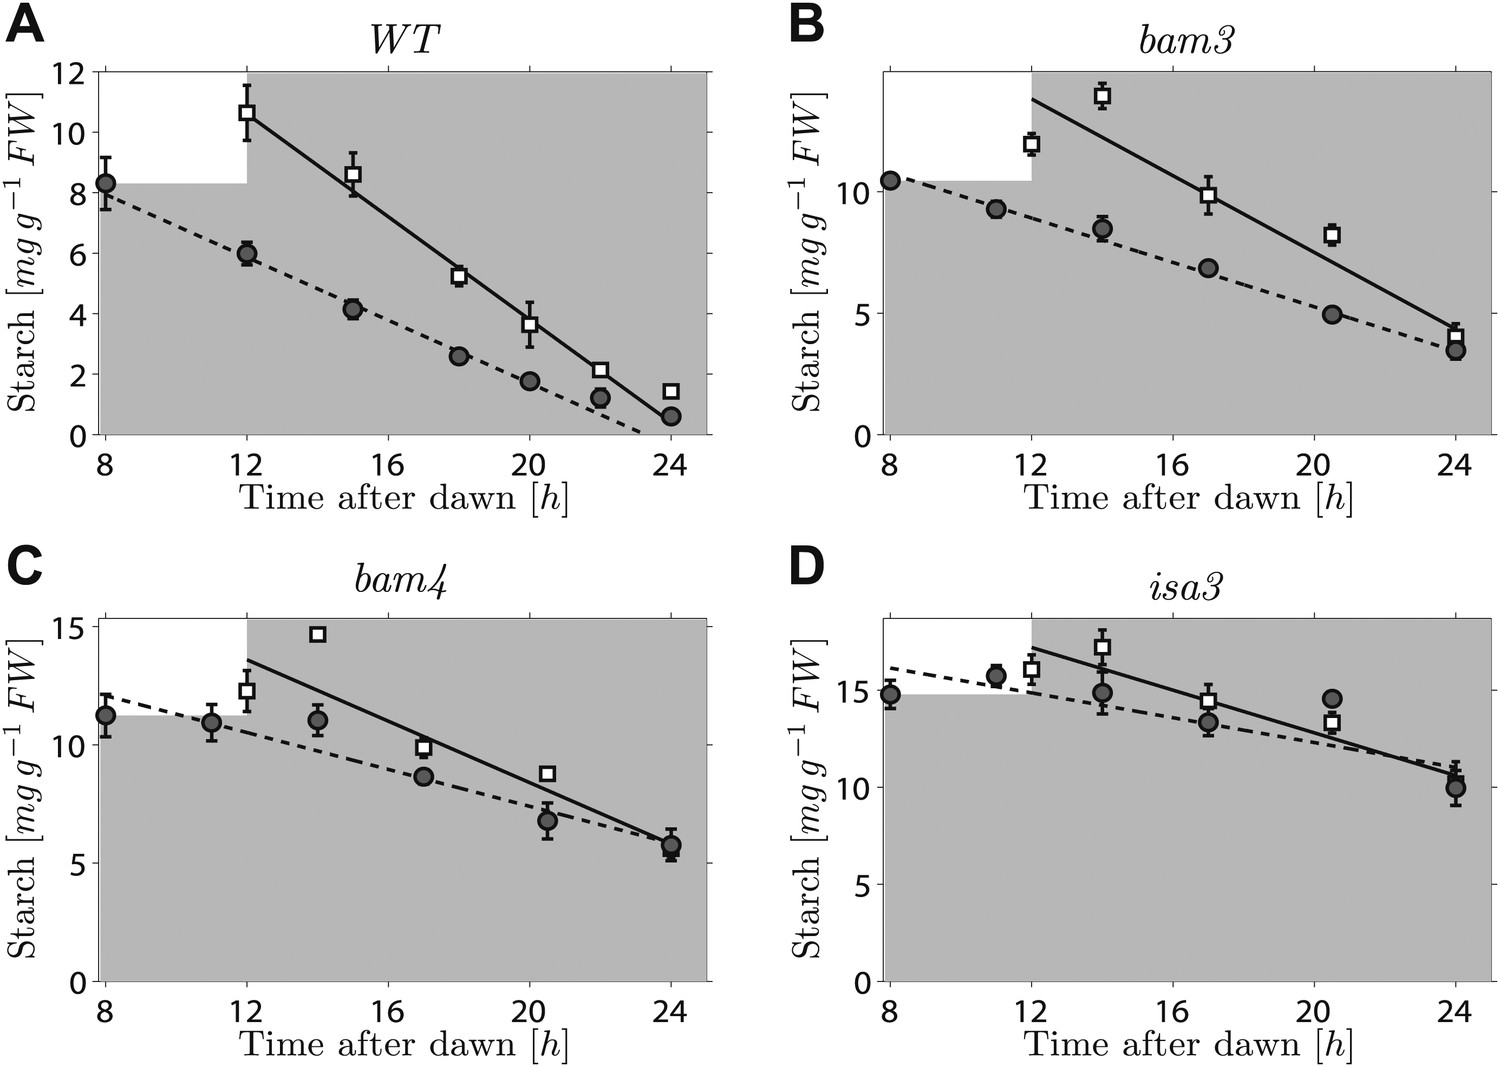
Starch content levels during unexpectedly early night in wild-type, bam3, bam4, isa3 mutant plants.
Starch content in wild-type (WT), bam3, bam4, isa3 mutant Arabidopsis plants grown in 12-hr light, 12-hr dark cycles then subject to unexpected early (8 hr, circles) or normal (12 hr, squares) onset of darkness (n = 6 individual rosettes for WT, n = 5 for mutants; the WT dataset analyzed here is the one already shown in Figure 1A). The continuous and dashed lines are linear fits to the normal and early night datasets respectively. Error bars are standard error of the mean throughout.
Figure 5
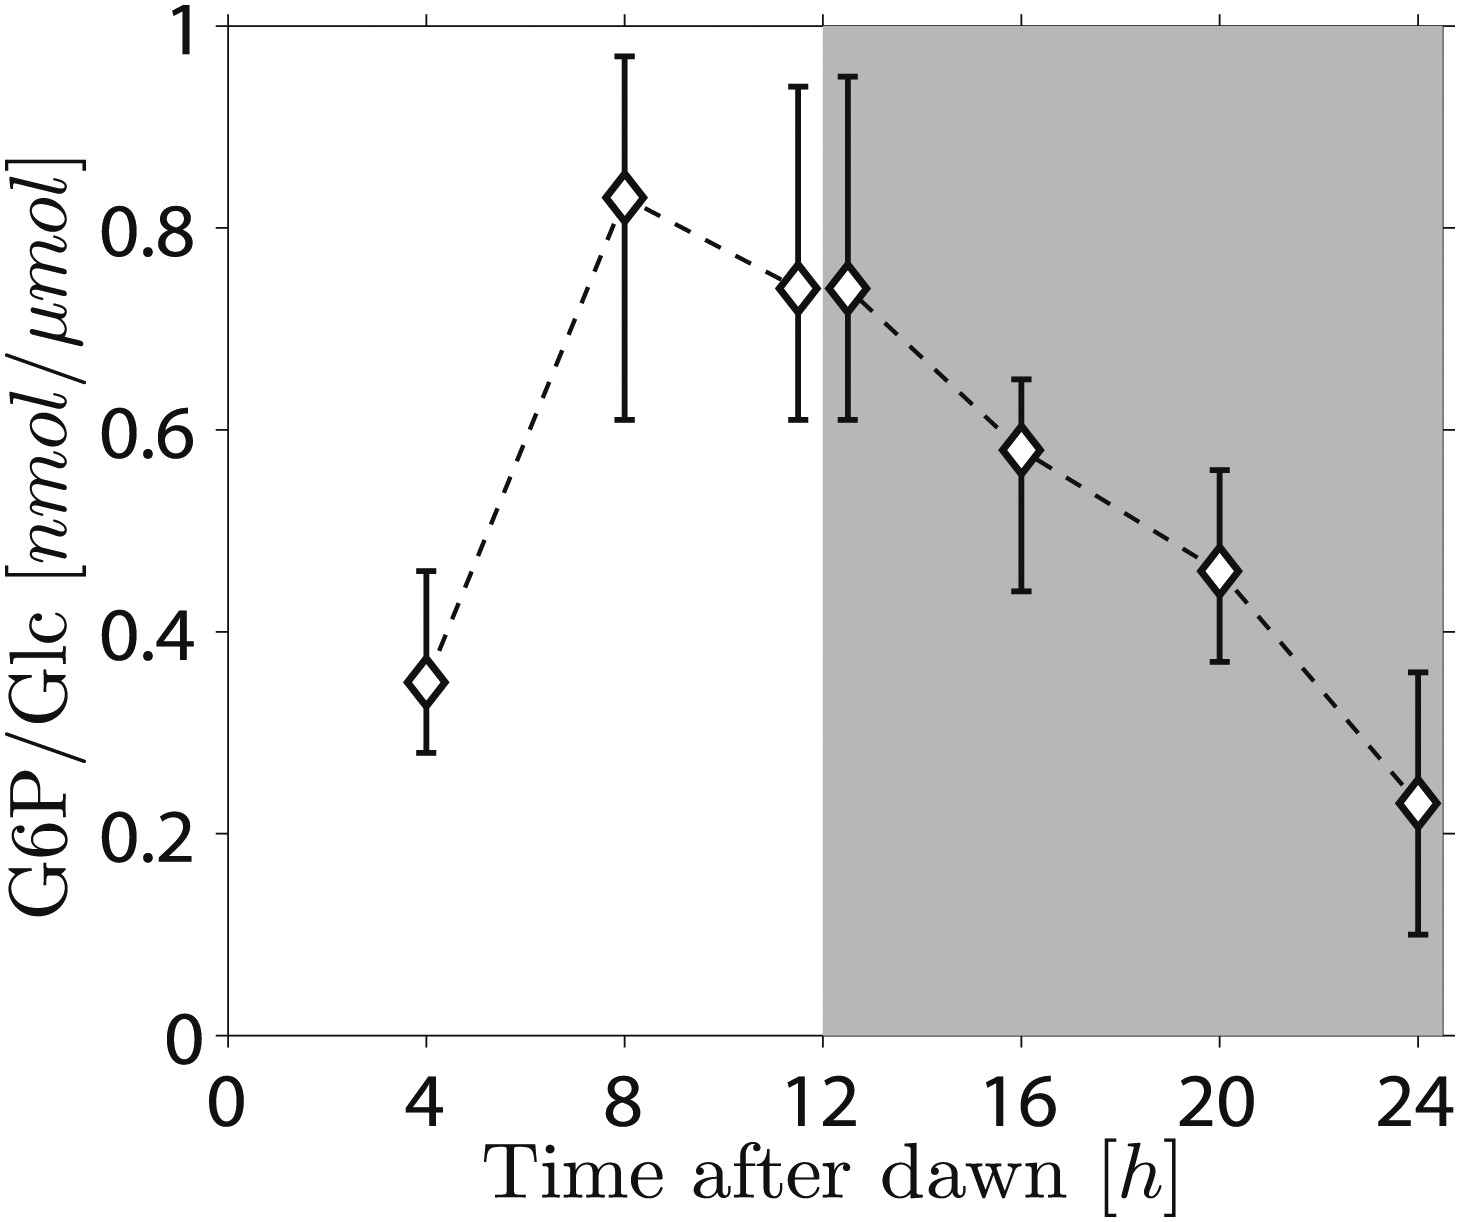
Daily change in starch phosphate content (measured as glucose 6-phosphate, G6P) in Arabidopsis leaves.
Results are normalized by total amount of glucose (Glc) in starch at each time point. Starch was extracted from rosettes of 26-day-old plants. n = 3 pools of 10 rosettes except at 24 hr time point, with n = 2 pools of 15 rosettes. Error bars represent the range (i.e., error bar edges correspond to highest and lowest values measured).
Tables
Table 1
Full list of the system parameters for Model 1
| Symbol | Definition |
|---|---|
| ρ0 | Starch content at the beginning of the dark period. |
| γ | Normalization variable. |
| (βkST1)−1 | kST1 is the ratio of the reaction parameter associated with reaction rST1 with the backward rate of reaction rS. β is the proportionality constant between [TC] and Δt. |
| tr | Time at which [TC] levels finish being reset at the beginning of the day (see Figure 2B). |
| t0 | Phase shifting parameter of the [TC] dynamics given by Equation 1. The next dawn is expected to come (24 + t0) hr after the previous one. |
Table 2
Full list of the system parameters for Model 2
| Symbol | Definition |
|---|---|
| ρ0 | Starch content at the beginning of the dark period. |
| γ | Normalization variable. |
| tr1 | Time at which [TC] levels finish being reset at the beginning of the day (see Figure 2C). |
| tr2 | Time at which [TC] levels start being reset at the end of the day (see Figure 2C). |
| t0 | Phase shifting parameter of the [TC] dynamics given by Equation 2. The next dawn is expected to come (24 + t0) hr after the previous one. |
Table 3
The values of the parameters of the Model 1 best fits shown in Figure 2
| Model 1 | |||||||
|---|---|---|---|---|---|---|---|
| WT early night (panel F) | WT normal night (panel F) | WT late night (panel F) | cca1/lhy early night (panel H) | cca1/lhy normal night (panel H) | WT low light level (panel J) | WT normal light level (panel J) | |
| ρ0 (mg g−1 FW) within 10% of the measured value | 8.5 | 11.0 | 11.7 | 4.2 | 5.1 | 3.6 | 6.1 |
| γ (0.7–3.0) | 1.8 | 1.8 | 1.9 | 1.2 | 1.2 | 1.5 | 1.3 |
| (βkST1)−1 (1.5–5.0) hr | 5.0 | 5.0 | 5.0 | 1.6 | 1.7 | 2.1 | 1.5 |
| tr (9.0–12.0) hr | 9.0 | Any value in the specified range | Any value in the specified range | 11.7 | 11.7 | Any value in the specified range | Any value in the specified range |
| t0 (−5.0–5.0) hr for the cca1/lhy data, t0 = 0 for WT | 0.0 | 0.0 | 0.0 | −4.2 | −2.5 | 0.0 | 0.0 |
-
With each parameter the range used in the best fit search is indicated.
-
WT: wild-type plants.
Table 4
The values of the parameters of the Model 2 best fits shown in Figure 2
| Model 2 | |||||||
|---|---|---|---|---|---|---|---|
| WT early night (panel G) | WT normal night (panel G) | WT late night (panel G) | cca1/lhy early night (panel I) | cca1/lhy normal night (panel I) | WT low light level (panel K) | WT normal light level (panel K) | |
| ρ0 (mg g−1 FW) within 10% of the measured value | 8.3 | 11.0 | 12.1 | 4.2 | 5.1 | 3.5 | 5.8 |
| γ (0.7–3.0) | 1.1 | 1.0 | 1.1 | 1.3 | 1.2 | 1.2 | 0.9 |
| tr1 (9.0–12.0) hr | 11.0 | 12.0 | 12.0 | 11.0 | 11.4 | 10.5 | 10.2 |
| tr2 (20.0–23.0) hr | 20.1 | 20.0 | 20.0 | 21.8 | 21.4 | 21.4 | 22.5 |
| t0 (−5.0–5.0) hr for the cca1/lhy data, t0 = 0 for WT | 0.0 | 0.0 | 0.0 | −2.4 | −1.3 | 0.0 | 0.0 |
-
With each parameter the range used in the best fit search is indicated.
-
WT: wild-type plants.
Table 5
The values of the parameters of the Model 1 best fits shown in Figure 3
| Model 1 | ||||
|---|---|---|---|---|
| Panel A | Panel B | Panel C | Panel D | |
| ρ0 (mg g−1 FW) within 10% of the measured value | 5.4 | 9.0 | 7.7 | 4.2 |
| γ (0.7–3.0) | 2.4 | 1.4 | 1.1 | 1.0 |
| (βkST1)−1 (1.5–5.0) hr | 5.0 | 2.6 | 2.1 | 2.0 |
| tr (9.0–12.0) hr | 9.0 | 9.0 | 10.3 | 12.0 |
| t0 (−5.0—5.0) hr | 4.3 | 3.3 | 2.4 | −0.5 |
-
With each parameter the range used in the best fit search is indicated.
Table 6
The values of the parameters of the Model 2 best fits shown in Figure 3—figure supplement 2
| Model 2 | ||||
|---|---|---|---|---|
| Panel A | Panel B | Panel C | Panel D | |
| ρ0 (mg g−1 FW) within 10% of the measured value | 5.5 | 9.1 | 7.7 | 4.2 |
| γ (0.7–3.0) | 1.5 | 1.3 | 0.7 | 0.7 |
| tr1 (9.0–12.0) hr | 12.0 | 9.0 | 9.0 | 9.0 |
| tr2 (20.0–23.0) hr | 20.0 | 20.9 | 22.1 | 22.1 |
| t0 (−5.0–5.0) hr | 5.0 | 5.0 | 2.4 | 0.0 |
-
With each parameter the range used in the best fit search is indicated.
Download links
A two-part list of links to download the article, or parts of the article, in various formats.
Downloads (link to download the article as PDF)
Open citations (links to open the citations from this article in various online reference manager services)
Cite this article (links to download the citations from this article in formats compatible with various reference manager tools)
Arabidopsis plants perform arithmetic division to prevent starvation at night
eLife 2:e00669.
https://doi.org/10.7554/eLife.00669


