Ultrafast endocytosis at Caenorhabditis elegans neuromuscular junctions
- Howard Hughes Medical Institute, University of Utah, United States
Figures
Figure 1
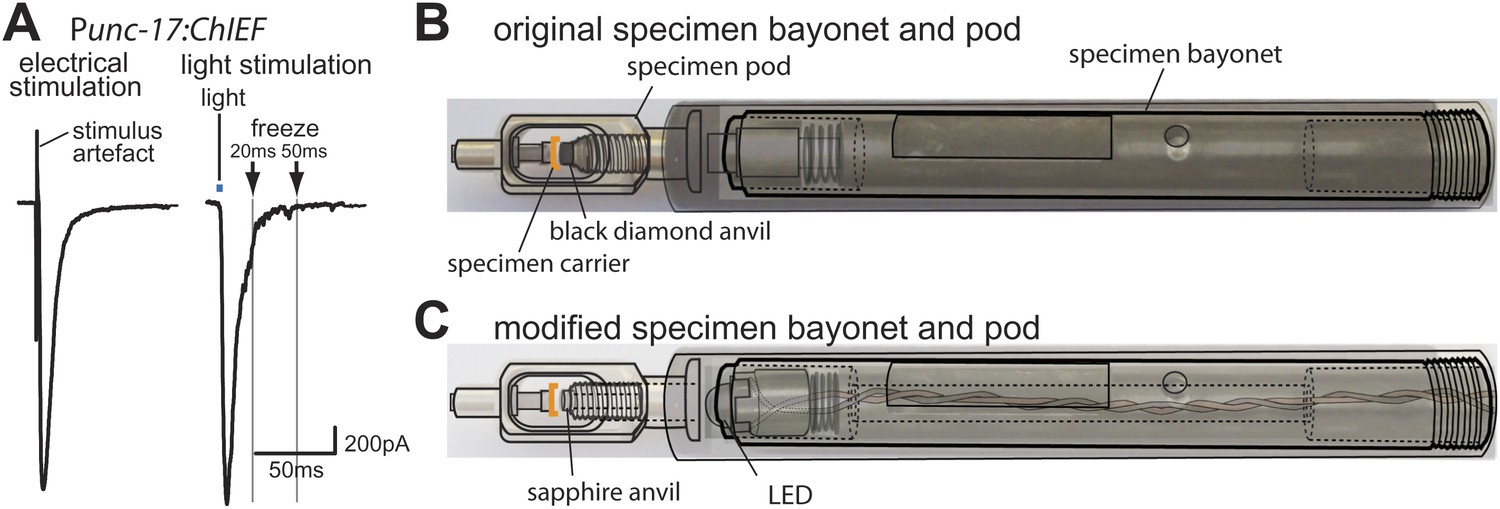
Optogenetics coupled with high-pressure freezing.
(A) A sample trace of an excitatory postsynaptic current from the muscle of animals expressing ChIEF in acetylcholine neurons, evoked by a single depolarizing pulse (left) and by a 3 ms pulse of blue light (right). The blue line indicates the application of blue light. Arrows indicate freezing times at 20 ms and 50 ms. (B) A schematic diagram of original specimen bayonet and a pod. Specimens in the cup of the specimen carrier face the black diamond anvil. (C) A schematic diagram of modified specimen bayonet and a pod. The bayonet was bored out (the dotted lines) to house the LED and wires. A sapphire end stone was mounted into the pod. Specimens in the cup of the specimen carrier face the sapphire anvil and LED.
Figure 2 with 1 supplement

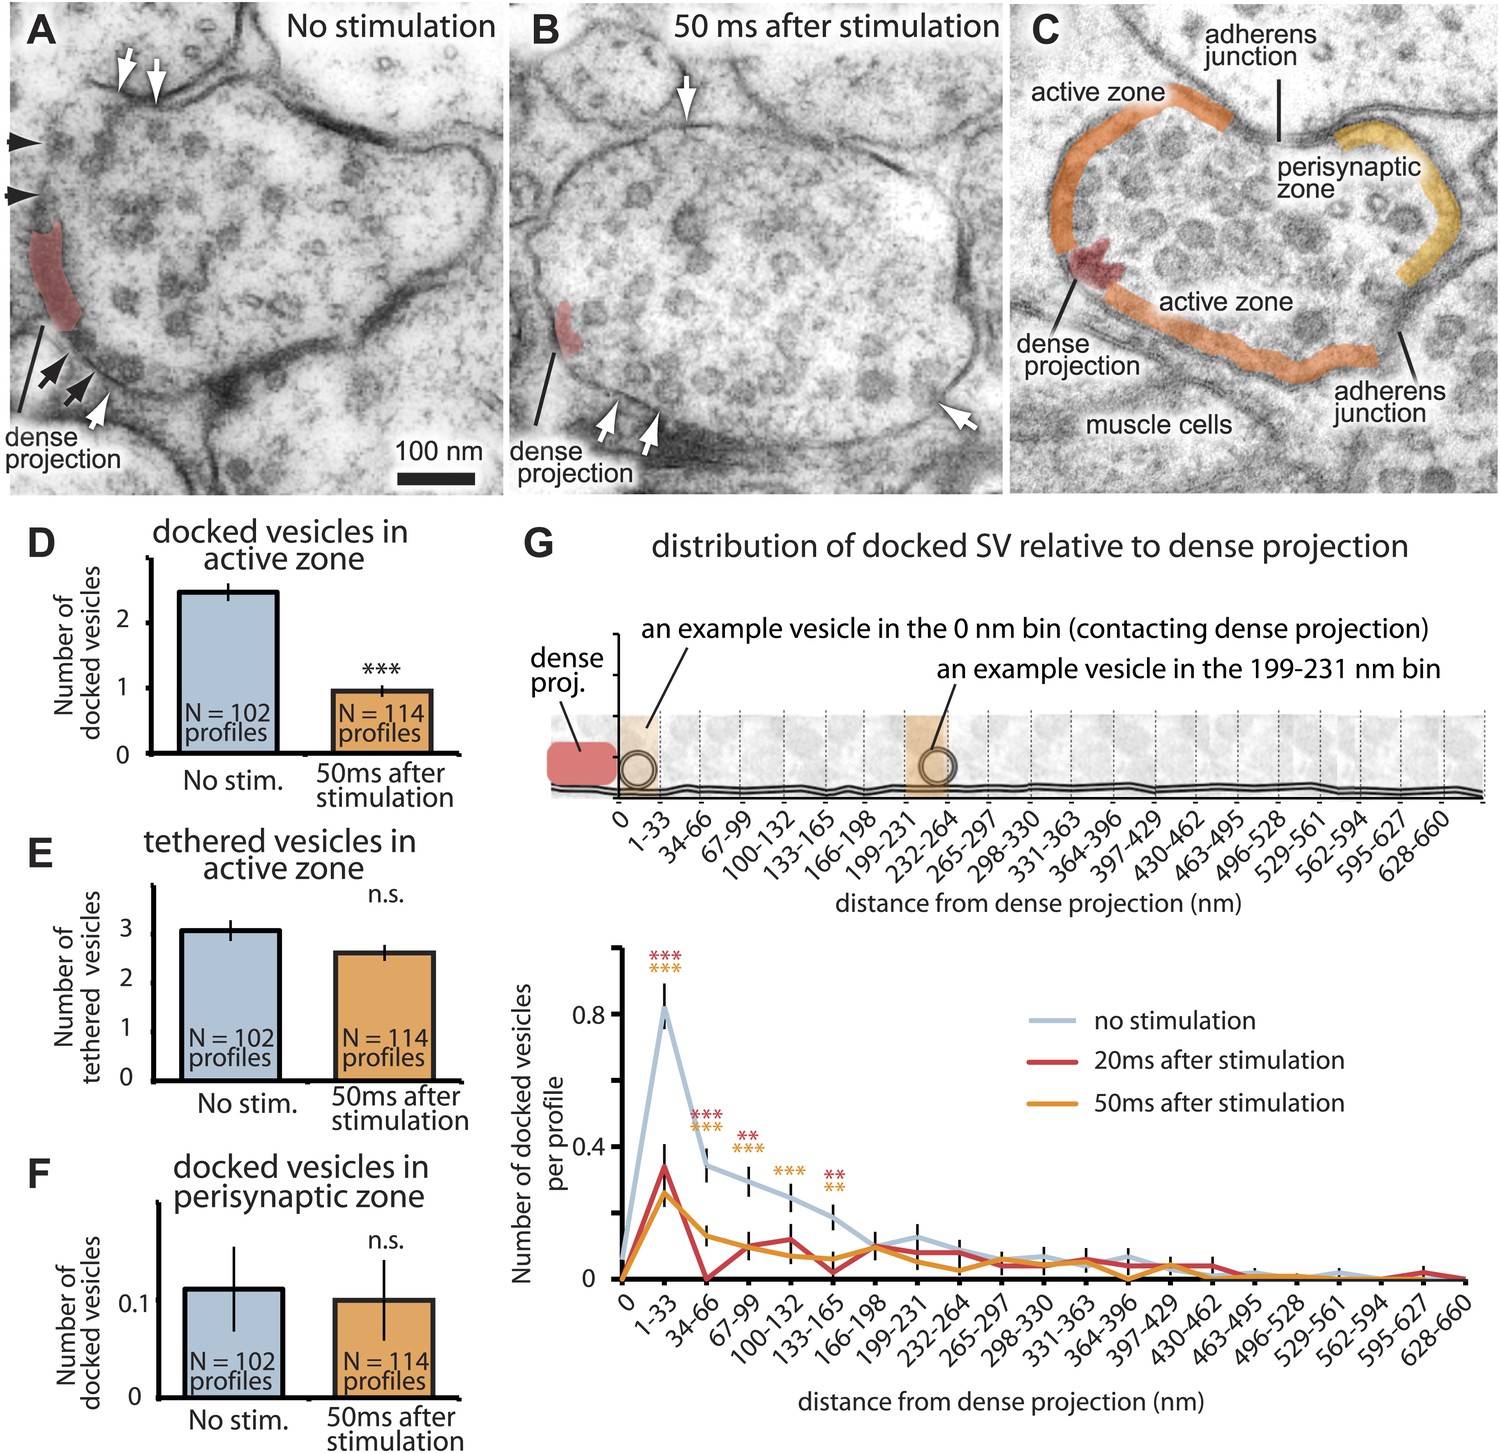
Fusing vesicles are observed 20 ms after stimulation.
(A–D) Sample electron micrographs of acetylcholine neuromuscular junctions 20 ms after depolarization by light stimulation of channelrhodopsin. Fusing vesicles, indicated by the black arrow, with the size of a synaptic vesicle were present in the active zone. (B–D) The necks of these pits are wide, suggesting that vesicles are undergoing full collapse into the membrane. (E) An active zone stimulated at 20 ms was reconstructed from 27 serial sections for a total distance of ∼900 nm. The reconstruction is cut along the adherens junctions, and shows the entire face of the active zone. Docked vesicles are colored green. A large vesicle (orange) was observed above the dense projection (red) at this synapse. (F) The distance of fusing vesicles from the dense projection per profile. A total of 17 exocytic intermediates was scored from 50 synaptic profiles analyzed. The inset illustrates how vesicles were placed into 33 nm bins from the dense projection. The column labeled as 0 nm includes vesicles that are touching the dense projection. Orange shading shows examples of binning. The black line indicates the expected number and fusion sites of vesicles based on the loss of docked vesicles at 20 ms (Figure 3G). Note that fusing vesicles were not observed in proximity of the dense projection (within 33 nm) likely because they had collapsed before freezing at the 20 ms time point. Representative micrographs of (G) a docked vesicle (in direct contact with the plasma membrane), and (I) a tethered vesicle (within 30 nm of plasma membrane). (H and J) Average number of vesicles per profile docked (H) and tethered (J) along the active zone. Only the number of docked vesicles was reduced after stimulation. The number is normalized by the length of active zone. ***, **, * indicate p-values of <0.001, <0.01, and <0.05, respectively. n.s., ‘not significant’. The standard error of the mean is shown in each graph.
-
Figure 2—source data 1
Figure 2H,J: The numbers of docked and tethered vesicles in each profile were normalized by the area of active zones.
- https://doi.org/10.7554/eLife.00723.005
Figure 2—figure supplement 1
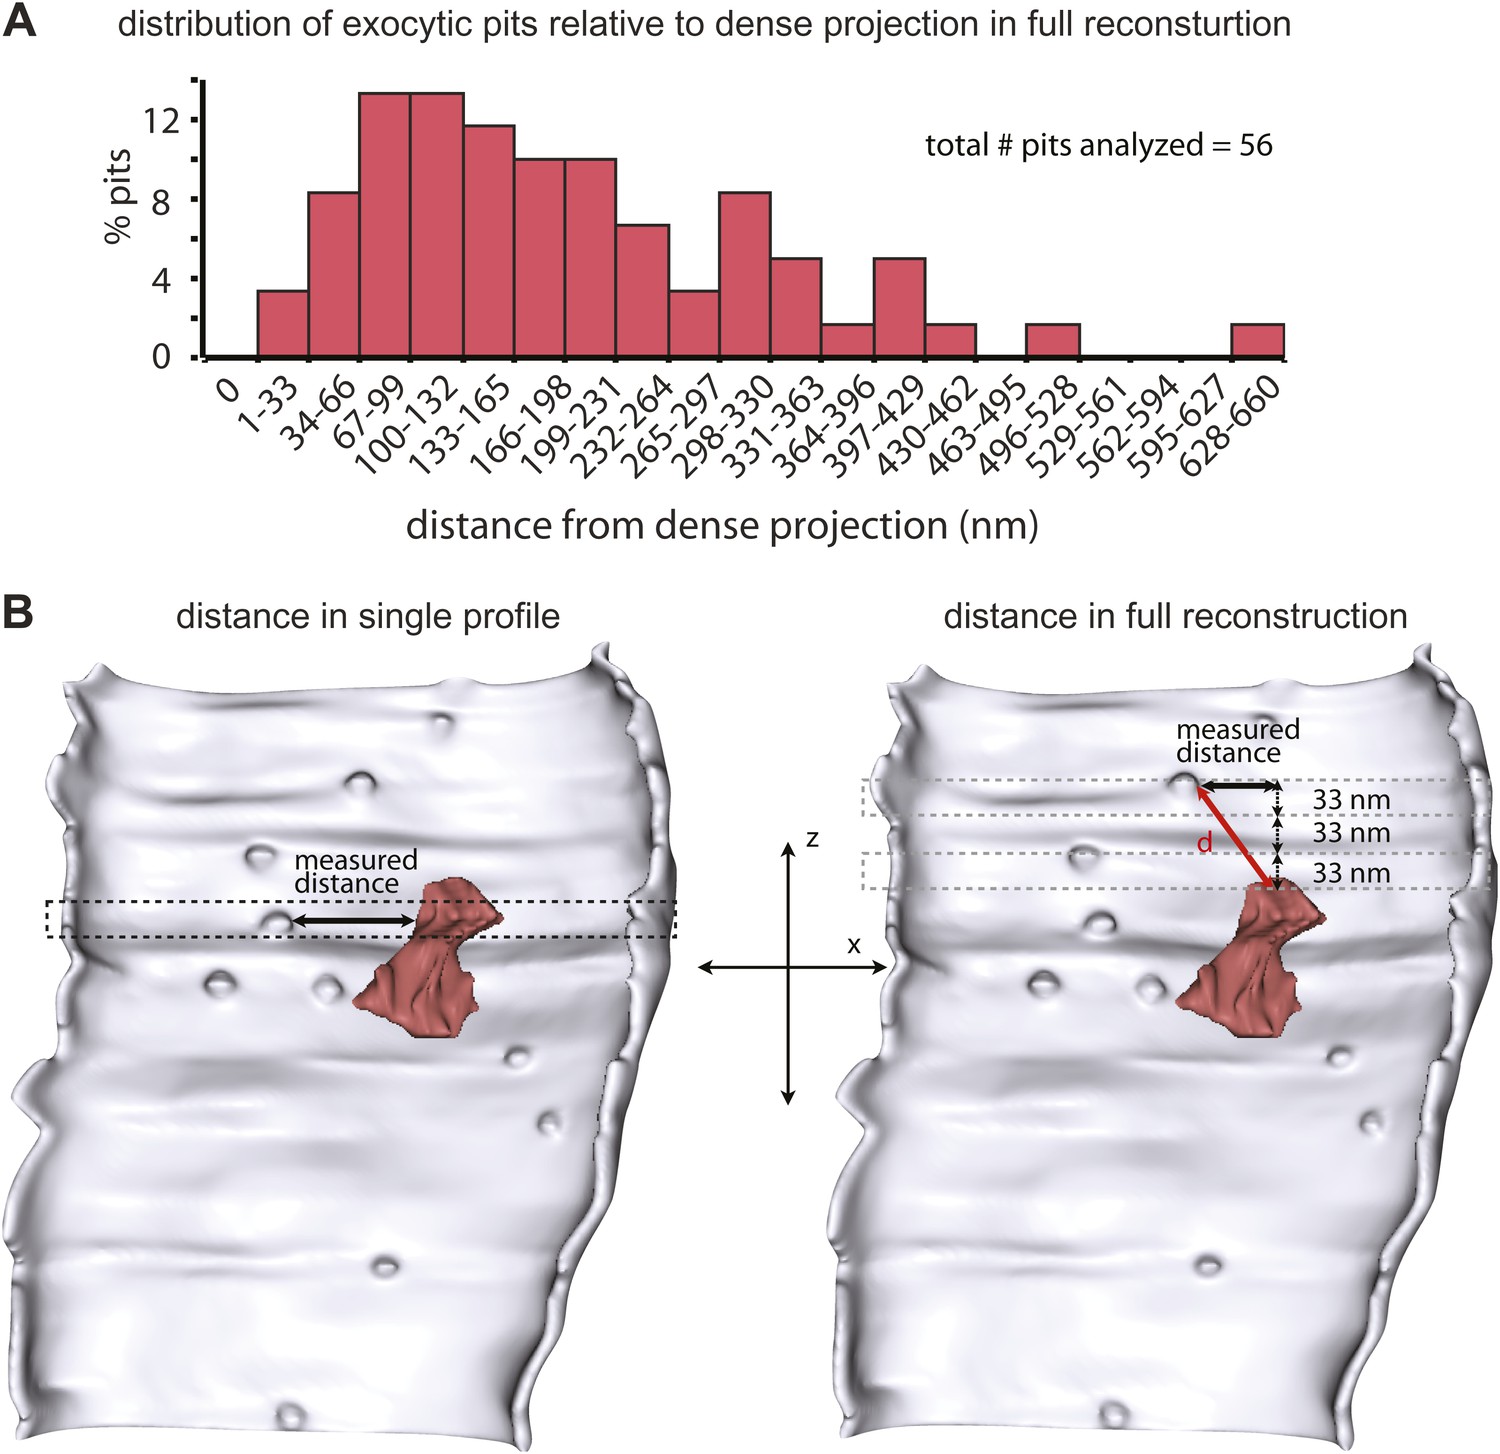
C. elegans neuromuscular junction has a broad active zone.
(A) Distance of vesicle fusions to the dense projection in acetylcholine neurons in full end-to-end synapse reconstructions (12 synapses). The first column along the x-axis labeled as 0 nm in this panel shows the number of fusing vesicles that are touching the dense projection, and each column thereafter is binned by 33 nm. Exocytic pits were observed across the entire length of the active zone. (B) Illustration of how distances were calculated. The Z-value was determined by the number of 33 nm sections. The X-value was the distance of the cord to the fusing vesicle. The distance ‘d’ was calculated using the Pythagorean equation.
Figure 3 with 1 supplement
The readily-releasable pool is solely constituted of docked vesicles.
An electron micrograph of an unstimulated (A) and stimulated (B) acetylcholine motor neuron after depolarization by channelrhodopsin. Docked vesicles (black arrows) are present near the dense projection before the stimulation but are absent 50 ms after the stimulation. Tethered vesicles (white arrows) are present before and after stimulation. (C) The active zone extends from the dense projection to the flanking adherens junctions to neighboring axons at C. elegans neuromuscular junctions based on fusion sites. Note that the side of the neuron that faces the muscle (bottom) can be very broad. (D) Average number of vesicles docked in active zones per profile. A significant reduction in docked vesicles was observed after depolarization (unstimulated 2.5± 0.1 SV per profile; stimulated 0.9 ± 0.1 SV; p<0.0001). The number is normalized by the length of the active zone. (E) Average number of vesicles per profile tethered in the active zone. No reduction in tethered vesicles was observed after depolarization (unstimulated 3.1 ± 0.2 SV per profile; stimulated 2.6 ± 0.2 SV; p=0.21). The number is normalized by the length of the active zone. (F) Average number of docked vesicles per profile in the perisynaptic zone before and after stimulation, normalized by the length of the perisynaptic zone. The docked vesicles in the perisynaptic zone were not released by a stimulus (p=0.95). (G) Distance of docked vesicles to the dense projection in the active zone. The absolute number of docked vesicles per synaptic profile is shown. Docked vesicles are released across the entire length of the active zone. The binning of vesicle distances is similar to Figure 2F. The asterisks indicate a significant difference in the number of docked vesicles between stimulated and unstimulated at a particular distance from the dense projection. Note that the adherens junctions are located on average 250–350 nm from the dense projection, but in acetylcholine neurons the arrangement is asymmetric–the active zone facing the muscle can be up to ∼1000 nm. Thus, the apparent reduction in docked vesicles further than 133–660 nm is caused by the staggered ends of the active zones rather than a reduction in the density of docked vesicles. Docked vesicles in the perisynaptic zone are not counted. ***, **, * indicate p-values of <0.001, <0.01, and <0.05, respectively. ‘n.s.’, not significant. The standard error of the mean is shown in all graphs.
-
Figure 3—source data 1
Figure 3D,E,F: The numbers of docked and tethered vesicles in each profile were normalized by the area of active zones or perisynaptic zone.
- https://doi.org/10.7554/eLife.00723.008
Figure 3—figure supplement 1

The readily-releasable pool is solely constituted of docked vesicles.
Representative micrographs showing neuromuscular junctions from C. elegans acetylcholine motor neurons, expressing ChIEF channelrhodopsin, unstimulated (A), stimulated in the absence of trans-retinal (B), 50 ms after stimulation (C), 100 ms after stimulation (D), 300 ms after stimulation (E), 1 s after stimulation (F), 3 s after stimulation (G), and 10 s after stimulation (H). Docked vesicles are marked with black arrows, and tethered vesicles are indicated by white arrows. Note that the number of docked vesicles recovers with rest. DP, dense projection.
Figure 4
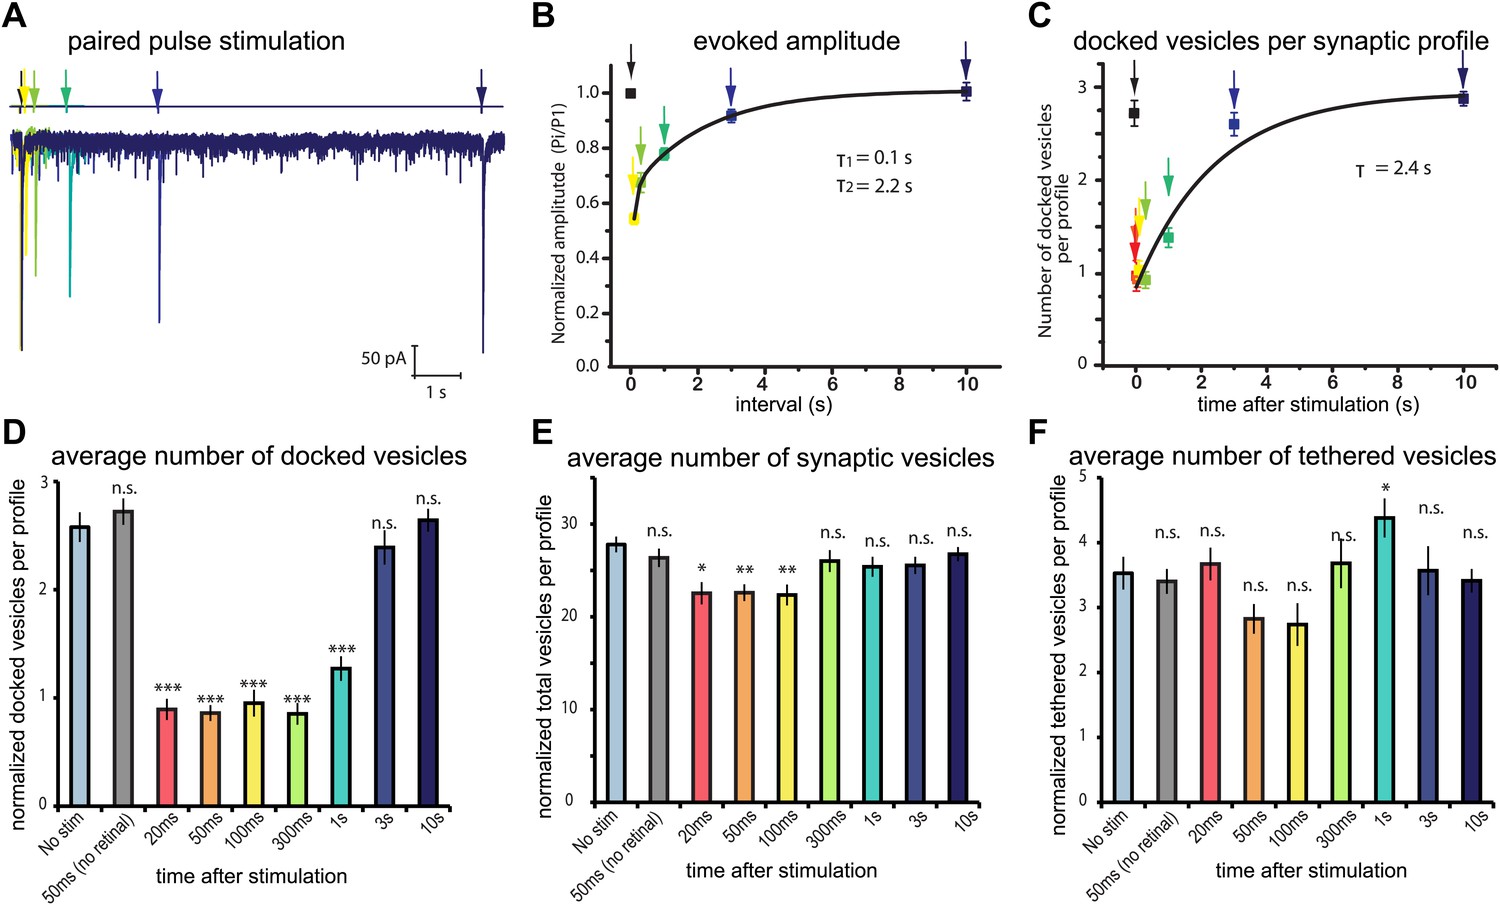
Physiological recovery corresponds to refilling of docking sites.
(A) Sample traces for paired-pulse stimulations using channelrhodopsin recorded from an adult body muscle (acr-16(ok789); oxSi91[Punc17::ChIEF::mCherry]). The second pulses are indicated by colors: yellow, 100 ms; green, 300 ms; emerald, 1000 ms; blue, 3000 ms; and dark blue, 10000 ms. (B) Recovery of evoked responses in paired pulse stimulations. The ratios of the second current peak (Pi) to the first current peak (P1) were calculated and plotted relative to the recovery intervals. There are two time constants for recovery: the first tau was 0.1 s, and the second tau was 2.2 s. The rapid recovery (τ = 100 ms) is likely due to a transition of docked vesicles from an incompetent to competent state (Zenisek et al., 2000), rather than the translocation and docking of vesicles. (C) Average number of vesicles per profile docked in the active zone is plotted relative to the intervals between stimulation and freezing. The time constant for the recovery was 2.4 s. (D) Average number of vesicles docked per profile at various time points after the stimulus. Docked vesicles were reduced at time points before 3 s. (E) Total number of synaptic vesicles, averaged per profile. A slight reduction in the total number of synaptic vesicles was observed after stimulation. (F) Number of vesicles per profile tethered in the active and perisynaptic zones. The size of the tethered pool drops initially after stimulation. The numbers in (D) and (F) include vesicles in both the active and perisynaptic zones. The numbers in (D), (E) and (F) are normalized by the area of the profiles to account for differences in the size of varicosities (‘Materials and methods’). All the p values were calculated against no stimulation control. Bonferroni correction was applied for multiple comparisons. For detailed numbers and statistical analysis, Figure 4—source data 1. ***, ** and * indicate p-values of <0.0001, <0.001 and <0.007, respectively. n.s., ‘not significant’. N values: not-stimulated: 102 profiles; no retinal 50 ms: 51 profiles; 20 ms: 50 profiles; 50 ms: 104 profiles; 100 ms: 83 profiles; 300 ms: 89 profiles; 1 s: 111 profiles; 3 s: 91 profiles; 10 s: 121 profiles. The standard error of the mean is shown in each graph.
-
Figure 4—source data 1
Figure 4D,E,F: The numbers of docked and tethered vesicles in each profile were normalized by the area of profiles.
- https://doi.org/10.7554/eLife.00723.011
Figure 5 with 2 supplements
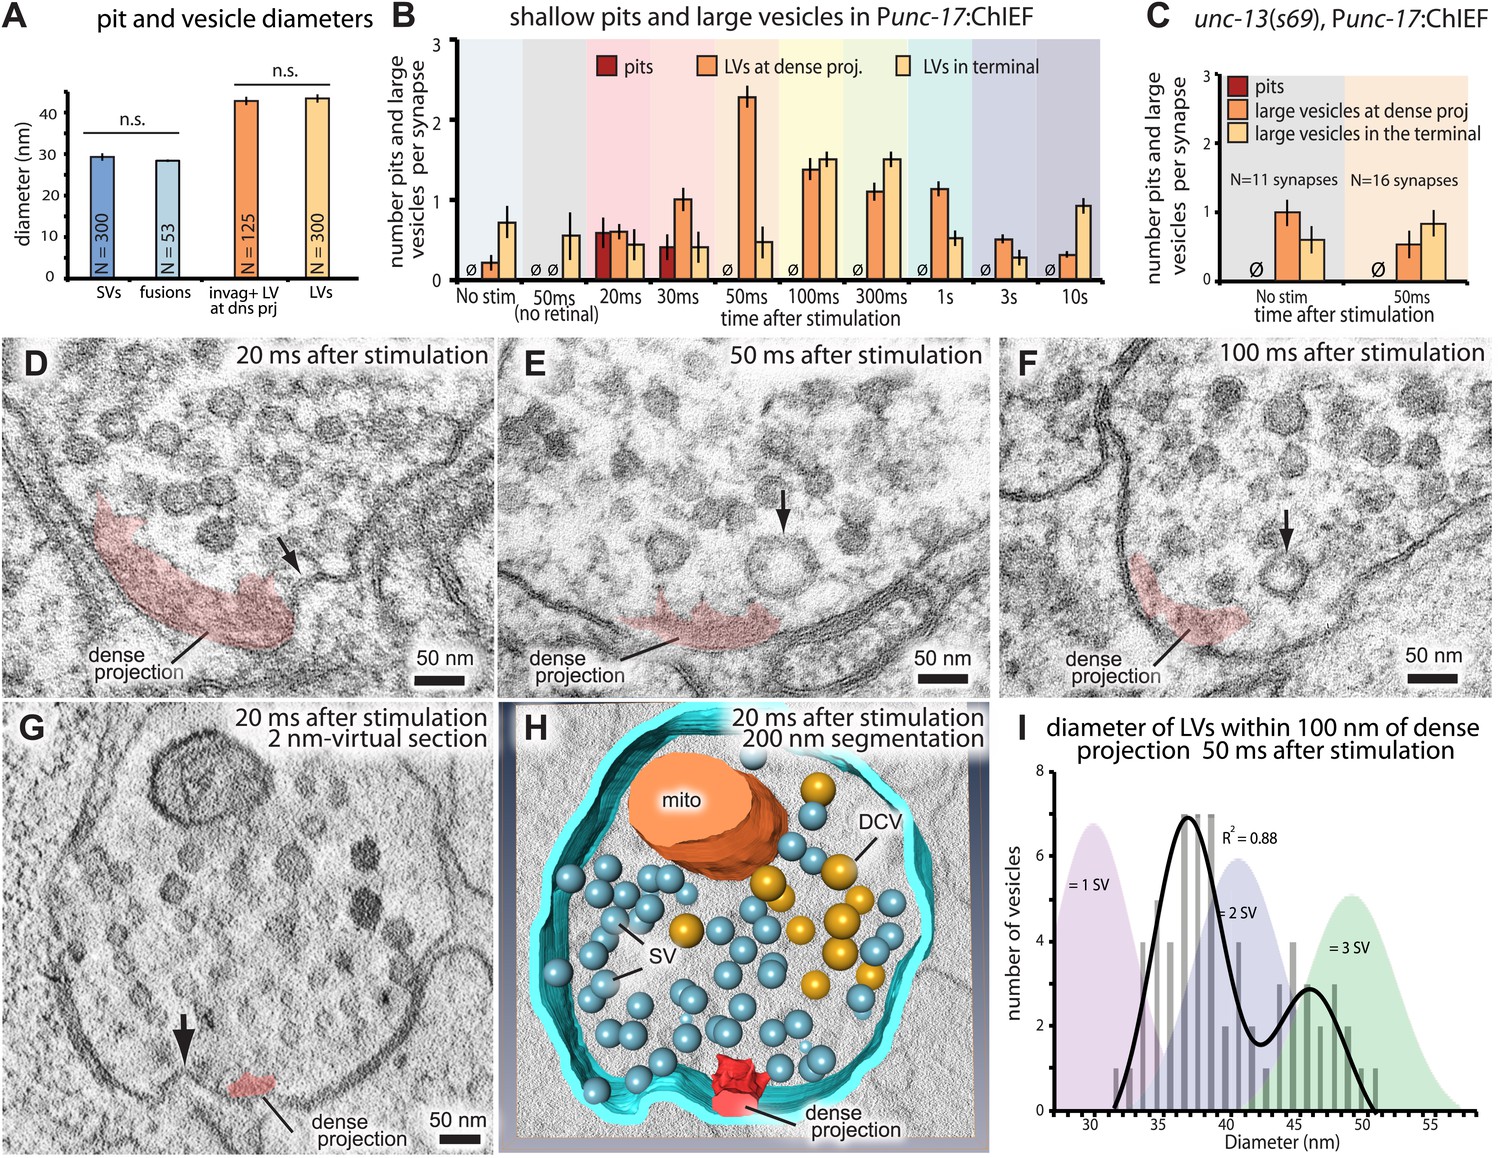
Ultrafast endocytosis takes place near the dense projection.
(A) Average size of synaptic vesicles, exocytic pits in active zone, large invaginations at dense projections, and large vesicles in the terminal. The diameter of invaginations and large vesicles (LV) was ∼1.5 times larger than that of exocytic pits observed at 20 ms after stimulation. (B) Time course of endocytosis at the dense projection. Structures are quantified for individual dense projections (a ‘synapse’) reconstructed from serial electron micrographs. Large vesicles are defined as clear-core vesicles with a diameter larger than 35 nm. Large vesicles at the dense projection are within a radial distance of 100 nm from the dense projection. (See Figure 5—source data 1 for numbers and statistics.) (C) Pits and large vesicles at the dense projection in unc-13 (unc-13(s69); Punc-17::ChIEF::mCherry) animals in unstimulated animals or animals frozen 50 ms after stimulation. Large vesicles are occasionally found in the synapses of unstimulated animals. (D–F) Electron micrographs showing an invagination at the dense projection of an acetylcholine motor neuron 20 ms after stimulation (D) and large vesicles near dense projections 50 ms (E) and 100 ms (F) after stimulation. (G–H) An electron tomogram and a hand-segmented model of an acetylcholine motor neuron synapse captured 20 ms after stimulation. An invagination of membrane is visible next to the dense projection. (I) The numbers of large vesicles within 100 nm of a dense projection are plotted against their diameter. The background shading indicates the expected diameters for vesicles composed of 1, 2 or 3 synaptic vesicles. There are two populations of large vesicles: one peaks at 38 nm and the other at 46 nm. R2 value for bimodal distribution was 0.88 whereas that for unimodal was 0.78. Akaike information criterion for unimodal, bimodal, and trimodal distributions were 352.6, 346.4, and 353.9, respectively, supporting the bimodal distribution. Interestingly, the difference between the peaks is equivalent to the amount of membrane in a single synaptic vesicle. N for each condition in (A) and (B) was as follows: non-stimulated: 26 synapses; no retinal 50 ms: 12 synapses; 20 ms: 12 synapses; 30 ms: 12 synapses; 50 ms: 24 synapses; 100 ms: 19 synapses; 300 ms: 20 synapses; 1 s: 23 synapses; 3 s: 19 synapses; 10 s: 26 synapses; unc-13 unstimulated: 11 synapses; unc-13 stimulated: 14 synapses. The standard error of the mean is shown in each graph.
-
Figure 5—source data 1
Figure 5A: Average size of synaptic vesicles, exocytic pits in active zone, large invaginations at dense projections, and large vesicles in the terminal. Figure 5B: Number of endocytic structures.
- https://doi.org/10.7554/eLife.00723.013
Figure 5—figure supplement 1
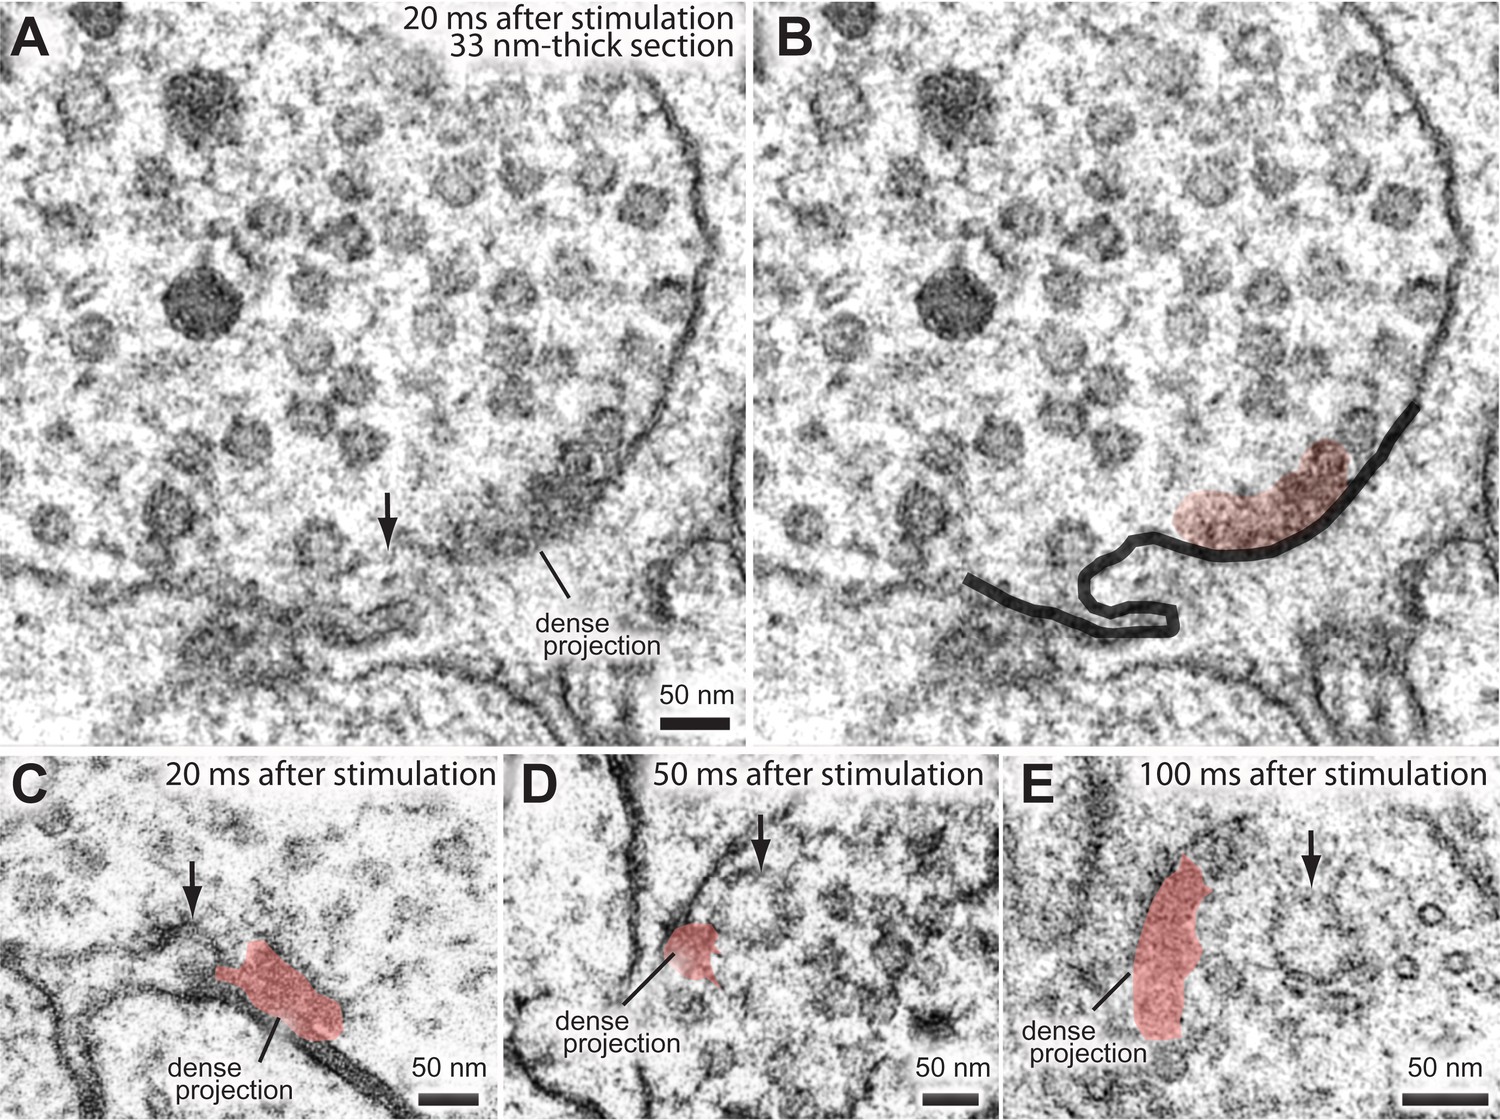
Ultrafast endocytosis takes place near the dense projection.
Additional representative micrographs showing endocytosis at the dense projection. (A and B) A large invagination at the dense projection 20 ms after stimulation. Plasma membrane (black) and dense projection (red) are highlighted in (B). (C) An invagination adjacent to the dense projection at 20 ms after stimulation. (D) A large vesicle adjacent to the dense projection 50 ms after stimulation. (E) A large vesicle detached from the dense projection 100 ms after stimulation. These large vesicles only appear transiently after the stimulation of channelrhodopsin. Black arrows indicate the invaginations or large vesicles.
Figure 5—figure supplement 2
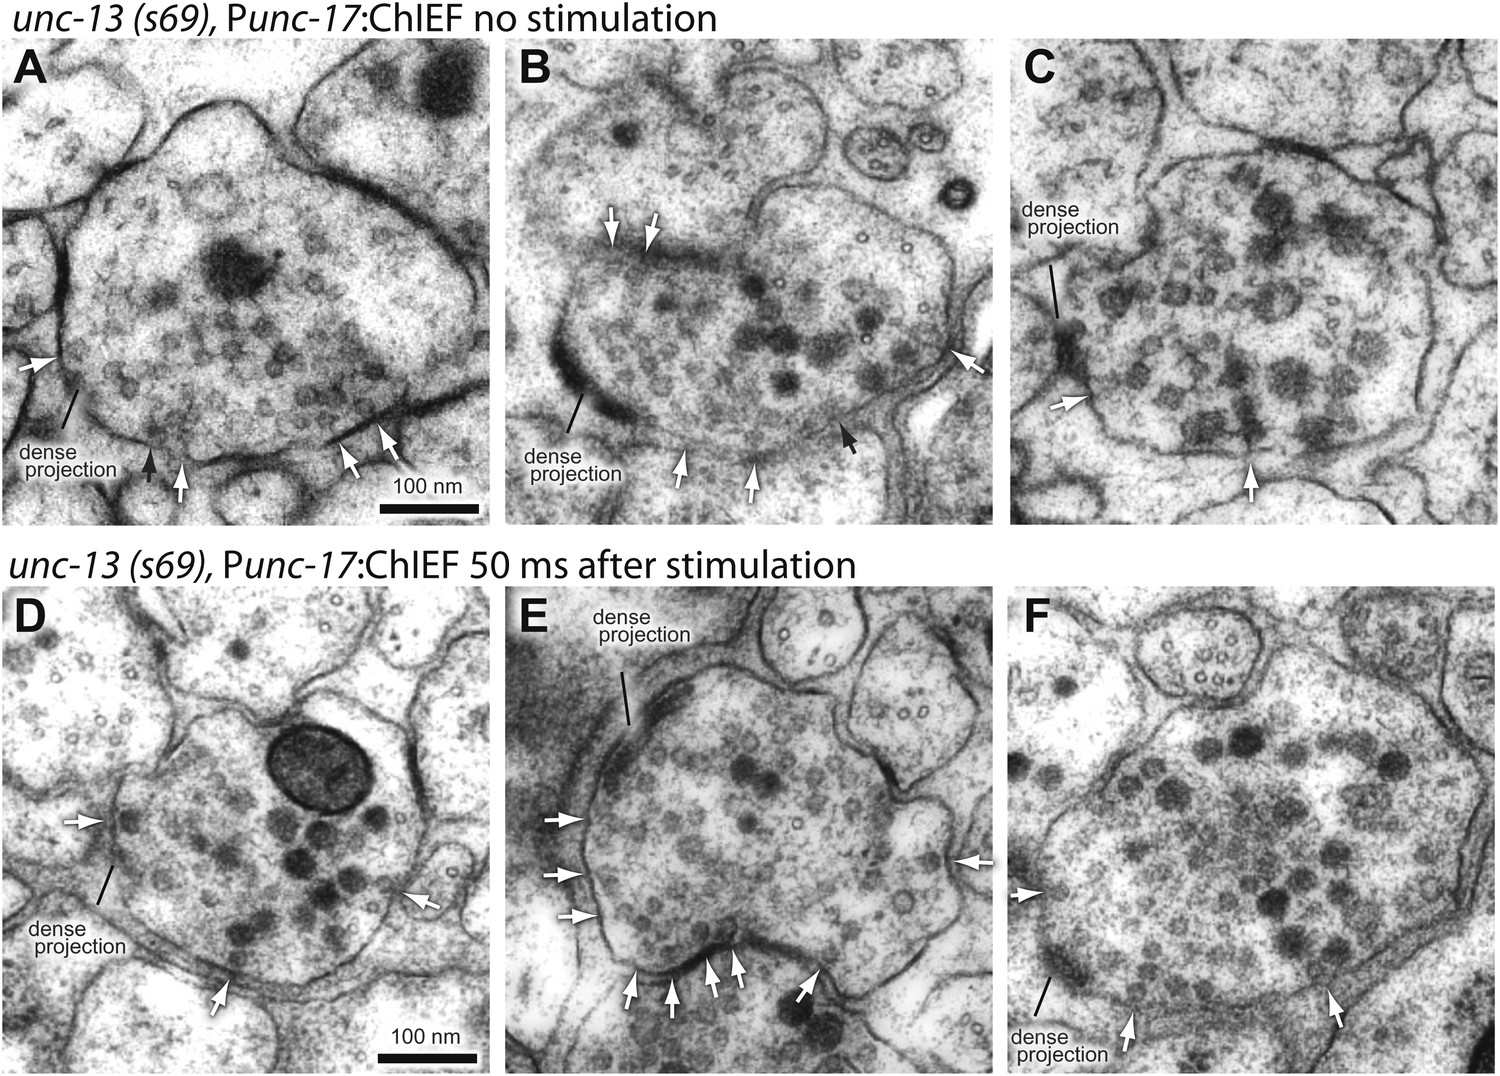
Endocytosis is coupled to exocytosis.
Representative micrographs showing acetylcholine neuromuscular junctions from unc-13(s69) mutants that were unstimulated (A–C) and stimulated by light activation of ChIEF (D–F). Large vesicles do not appear after stimulation in unc-13 mutants, suggesting that endocytosis is triggered by addition of vesicle membrane to the synaptic membrane and not simply depolarization of calcium entry. Docked vesicles are marked with black arrows, and tethered vesicles are indicated by white arrows.
Figure 6 with 1 supplement
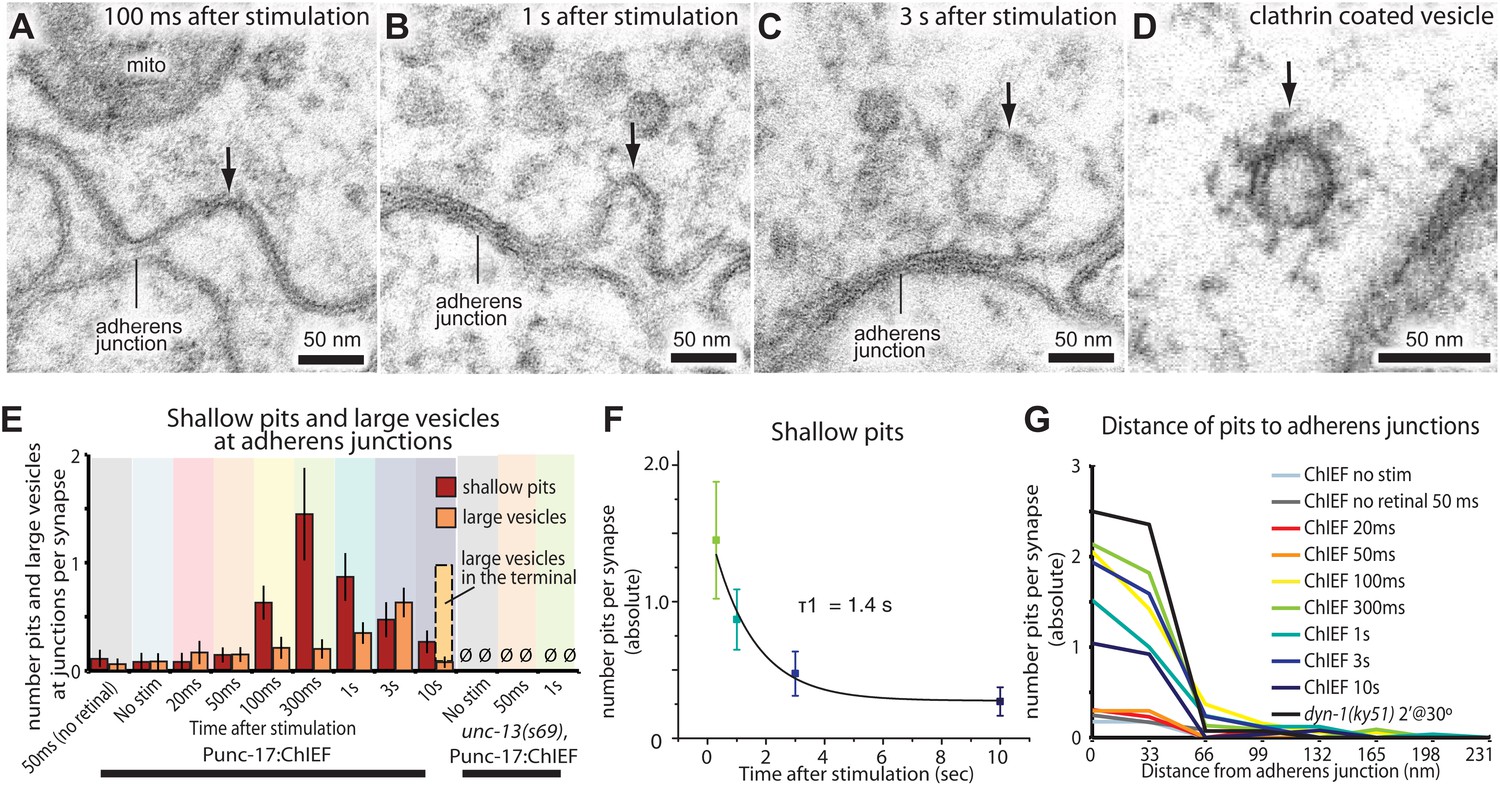
Endocytosis adjacent to adherens junctions is fast.
(A) A shallow pit is present adjacent to the adherens junction (arrow) 100 ms after stimulation. (B) A deep pit at the adherens junction 1 s after stimulation. (C) A large clear vesicle near the adherens junction 3 s after stimulation. (D) Clathrin coats can be preserved through high-pressure freezing and freeze-substitution. An electron micrograph of a clathrin-coated vesicle in an endophilin mutant captured with the same fixation protocol and equipment. (E) Average number of shallow pits at adherens junctions (red) and large vesicles associated with adherens junctions (dark orange) per synapse. The decline of shallow pits is followed by an increase in large vesicles at adherens junctions. N values: no retinal 50 ms: 12 synapses; non-stimulated: 26 synapses; 20 ms: 12 synapses; 50 ms: 24 synapses; 100 ms: 19 synapses; 300 ms: 20 synapses; 1 s: 23 synapses; 3 s: 19 synapses; 10 s: 26 synapses. A synapse is defined as a collection of profiles containing the same dense projection. (F) Average number of shallow pits at adherens junctions per synapse. The time constant for the resolution of pits is 1.4 s. (G) Distance of shallow pits to adherens junctions after the stimulation. Average number per synapse is shown. The pits are next to adherens junctions. The standard error of the mean is shown in each graph.
-
Figure 6—source data 1
Figure 6E,F: Number of shallow pits at adherens junctions per synapse.
- https://doi.org/10.7554/eLife.00723.017
Figure 6—figure supplement 1
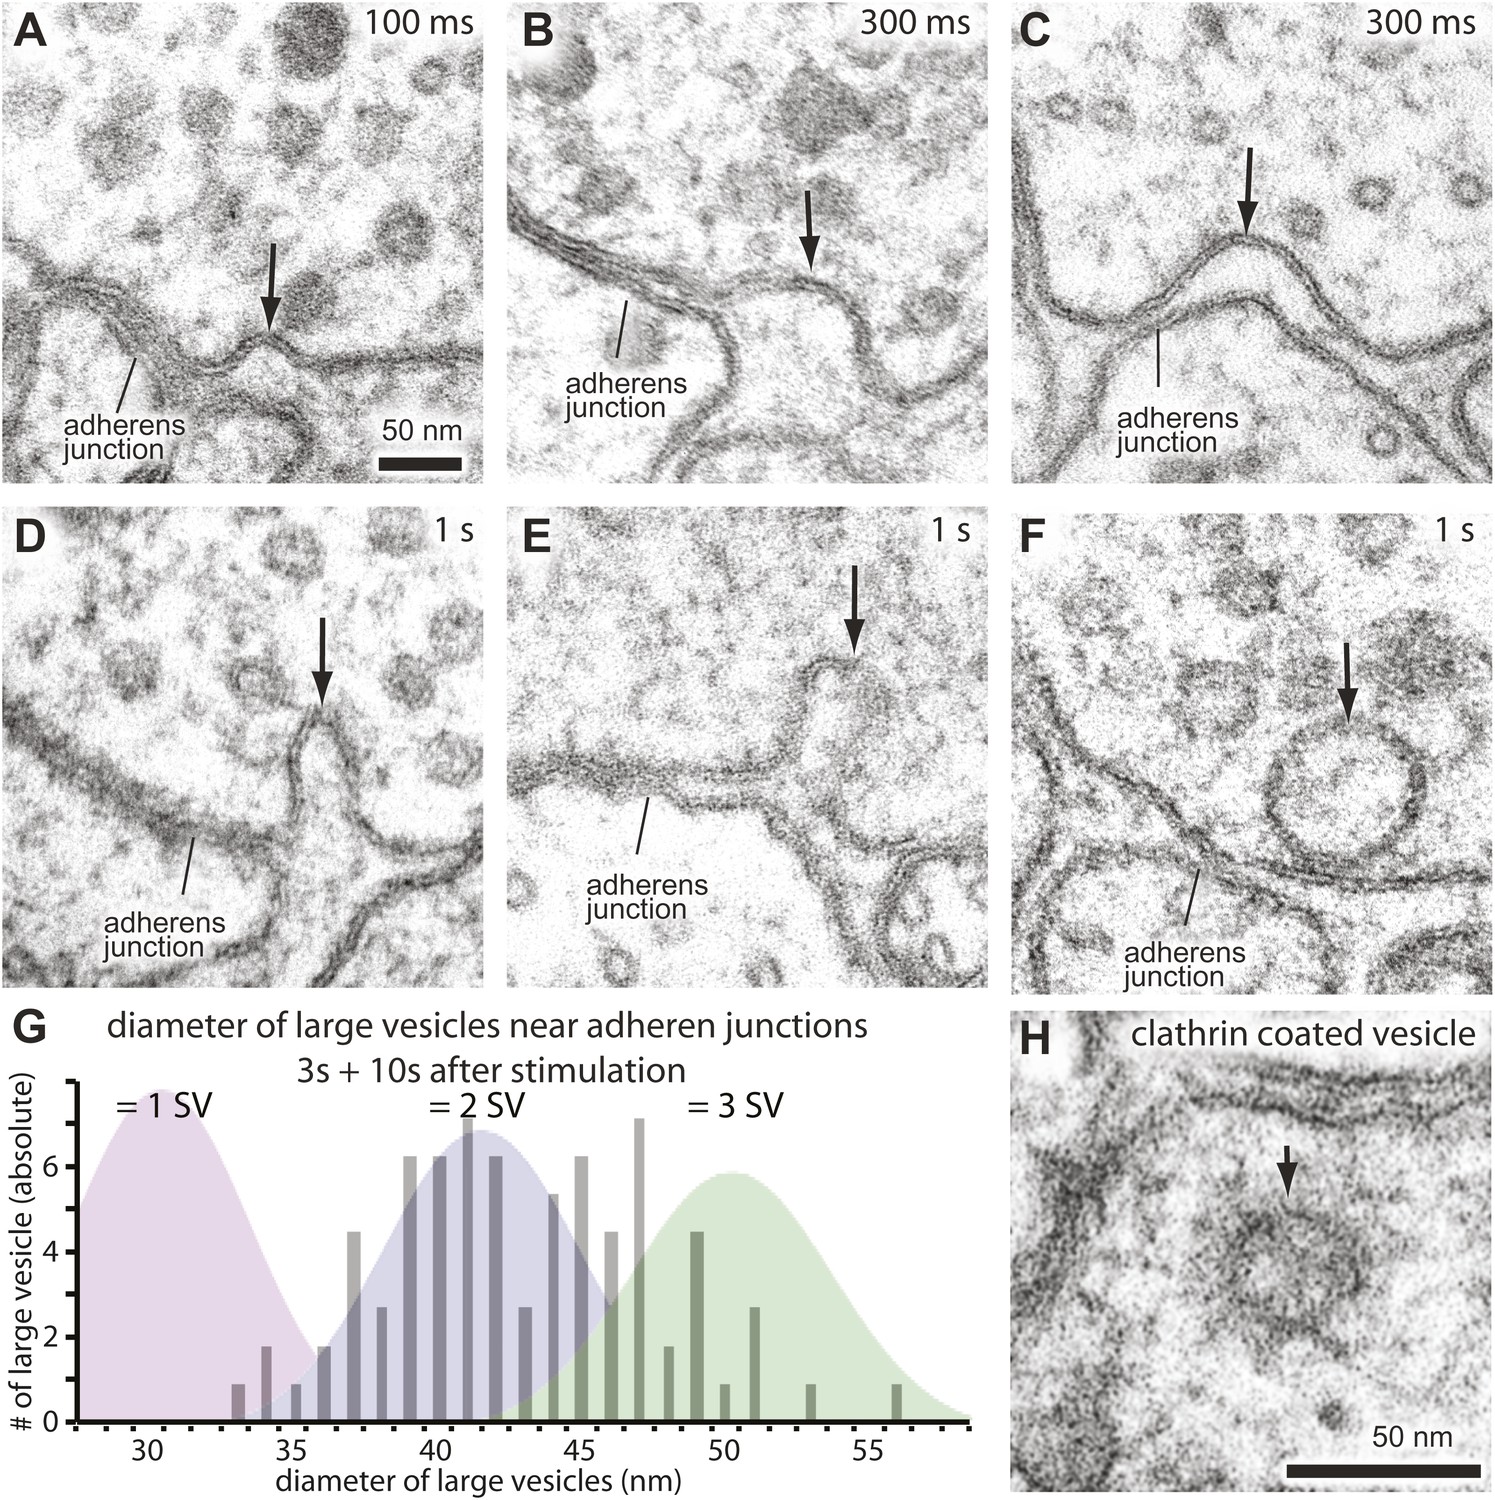
Endocytosis takes place adjacent to adherens junctions.
Additional representative micrographs showing acetylcholine neuromuscular junctions from animals expressing ChIEF, 100 ms (A), 300 ms (B and C), and 1 s after stimulation (D–F). Black arrows indicate pits or a large vesicle. (G) The number of large vesicles near adherens junctions from 3 s and 10 s after stimulation is plotted against their diameter. The graph is shaded to indicate the number of synaptic vesicles that can be incorporated into the given size of the large vesicle; it is not clear if the distribution is unimodal or bimodal. (H) An additional representative micrograph showing a clathrin-coated vesicle. Clathrin-coats can be preserved in our fixation protocol.
Figure 7 with 1 supplement
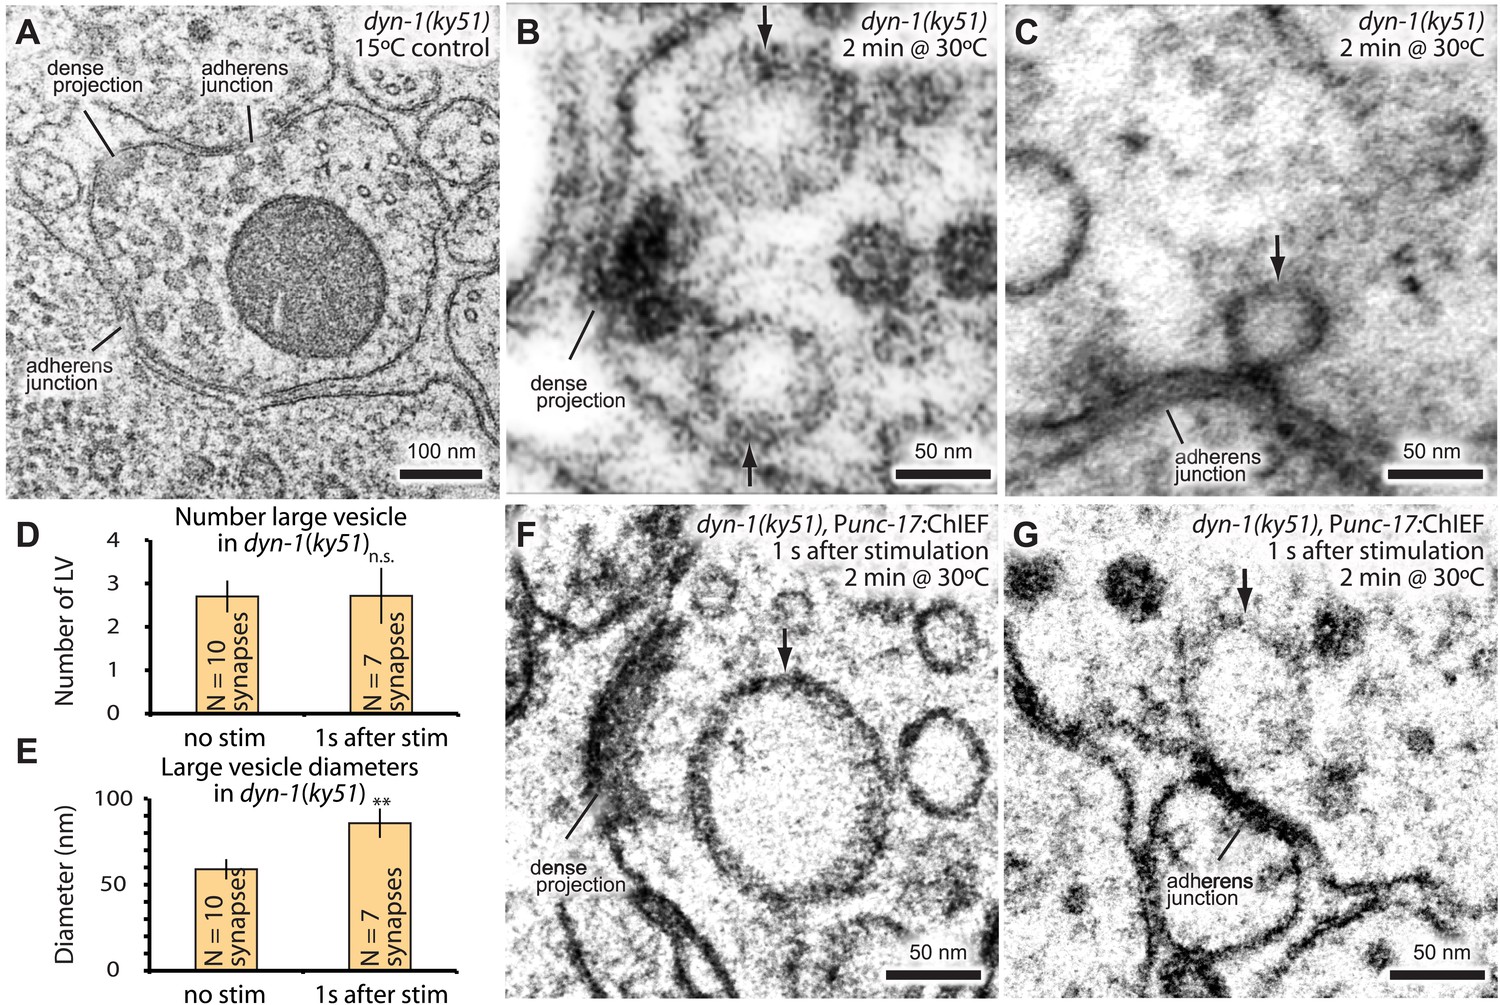
Dynamin is required for fast endocytosis.
(A–C, F and G) Electron micrographs showing morphology of an acetylcholine motor neuron from the dynamin temperature-sensitive mutant dyn-1(ky51) at the permissive temperature (A) and at the restrictive temperature (30°C) for 2 min with no stimulation (B and C) or 1 s after stimulation (F and G). Large vesicles near the dense projection (B and F) and adherens junction (C and G) are stabilized only when the mutants were exposed to the restrictive temperature. Average number of large vesicles per synapse (D) and average diameter of large vesicles (E) in dyn-1(ky51) animals at the restrictive temperature. A single stimulus does not increase the number of endocytic structures, but the diameter of large vesicles increases.
-
Figure 7—source data 1
Figure 7D, Number of large vesicles; Figure 7E, Diameter of large vesicles.
- https://doi.org/10.7554/eLife.00723.020
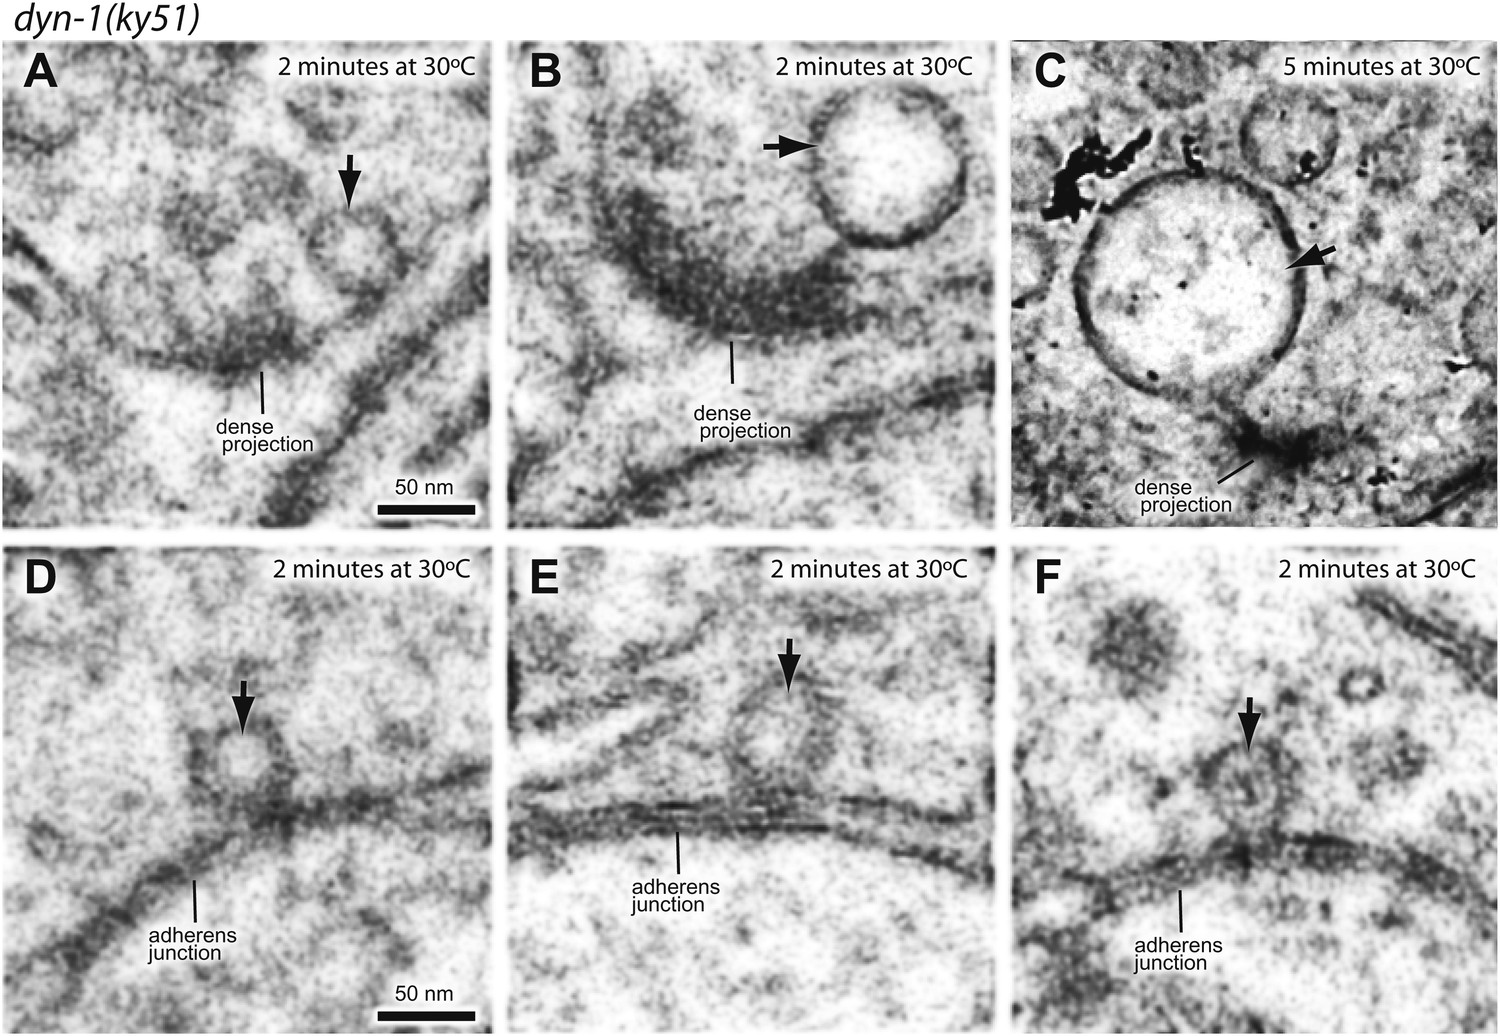
Figure 7—figure supplement 1
Dynamin is required for ultrafast endocytosis.
Additional representative micrographs of acetylcholine neuromuscular junctions showing large endocytic structures are trapped in dyn-1(ky51) mutants at dense projections (A–C) and adherens junctions (D–F) dyn-1(ky51) mutants were shifted from the permissive temperature (15°C) to the restrictive temperature (30°C) for either 2 min (A, B, and D–F) or for 5 min (C). Note that the neck of the endocytic structure is visible in an animal that was incubated at 30°C for 5 min (C). Black arrows indicate the large endocytic structures. Only acetylcholine synapses are shown.
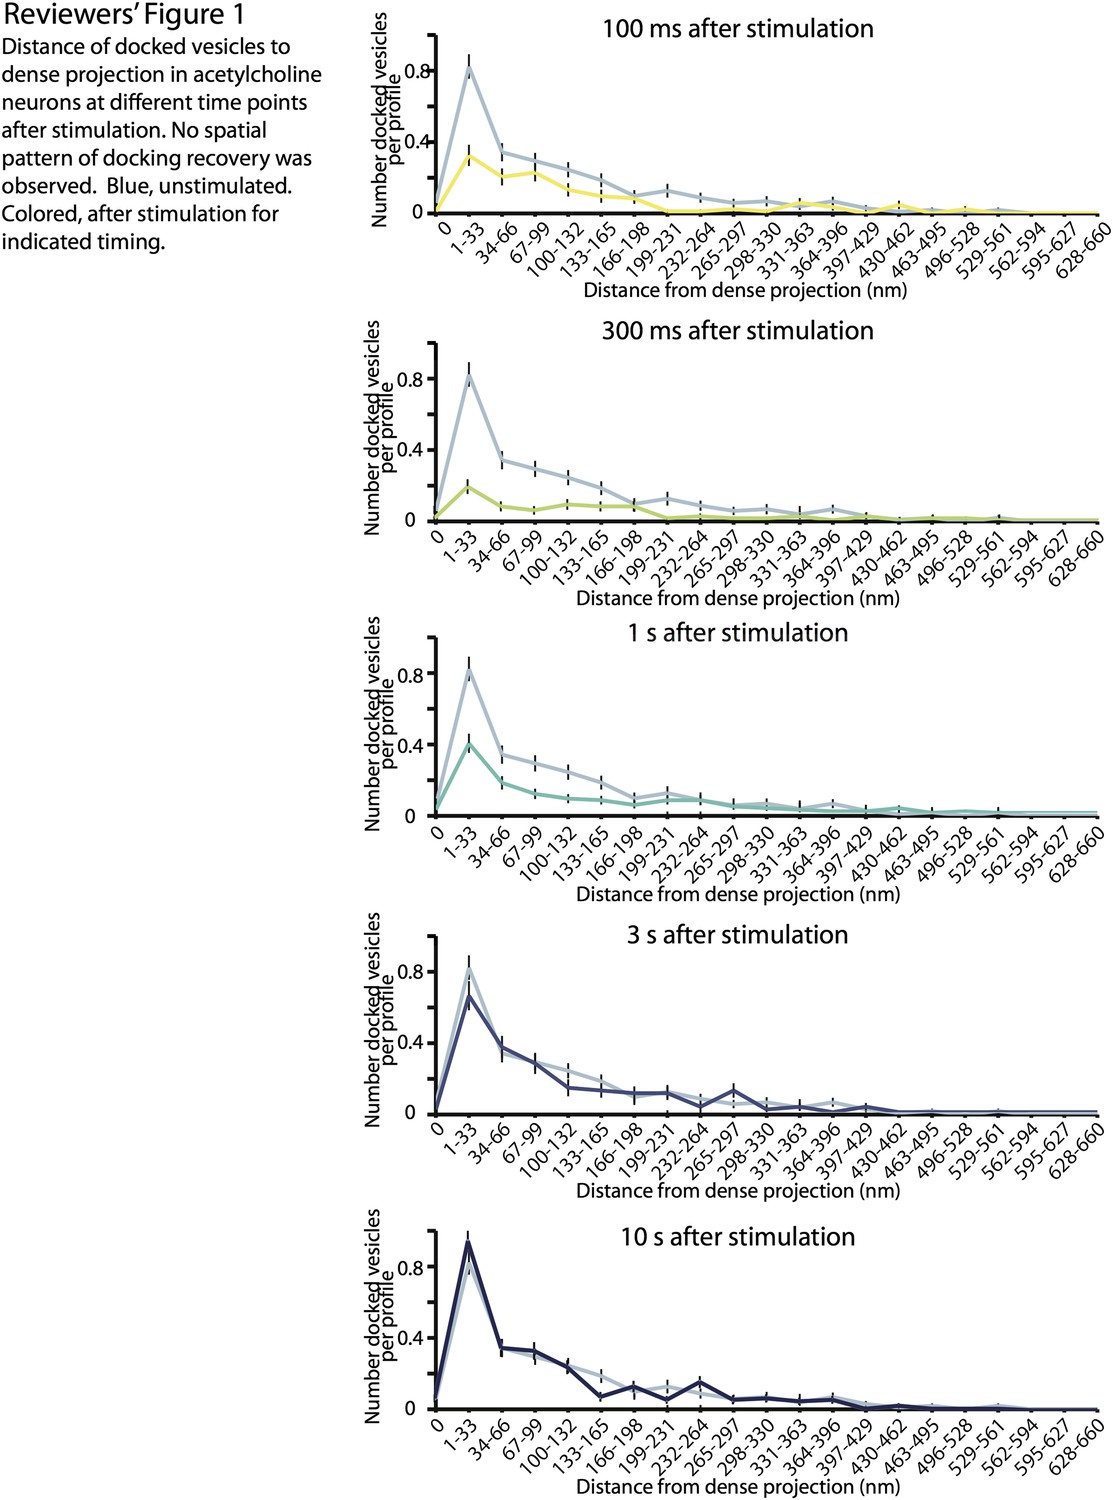
Reviewers’ figure 1
Download links
A two-part list of links to download the article, or parts of the article, in various formats.
Downloads (link to download the article as PDF)
Open citations (links to open the citations from this article in various online reference manager services)
Cite this article (links to download the citations from this article in formats compatible with various reference manager tools)
Ultrafast endocytosis at Caenorhabditis elegans neuromuscular junctions
eLife 2:e00723.
https://doi.org/10.7554/eLife.00723


